
Abstract
This article describes an automated method for the measurement of crack initiation and propagation in composite materials during modeI double cantilever beam (DCB) testing under different environmental conditions. The method uses the time-domain reflectometry (TDR)-DCB system, which transmits a high-frequency pulse through a transmission line integrated within the composite test coupon and measures impedance discontinuities generated due to the presence of a crack. Using this system, real-time crack propagation in the specimen can be monitored, and the critical fracture toughness parameters (G IC) can be calculated in a variety of environmental conditions. TDR-DCB test method was used for the measurement of G IC for dry and wet (water-saturated) DCB samples made from E-glass fiber/vinyl ester composites under dry conditions (room temperature (RT) at 94°C) and wet conditions (RT at 60°C). For all test conditions, TDR signals showed that crack initiation and propagation was the dominant mechanism in identifying impedance changes in the material. Changes in dielectric properties of the specimen due to the test conditions, whether from water uptake, temperature, or a combination of the two, did not significantly affect signal quality.
Keywords
Introduction
Fracture toughness of composites can be measured using a double cantilever beam (DCB) method, as described in ASTM 5528, 1 where the real-time crack growth must be captured. There are several methods available to detect the real-time crack growth in composites during DCB testing, with the traditional approach using a traveling microscope. Cowley and Beaumont 2 used a thin insulated metal foil, bonded onto one edge of the specimen to track the crack propagation in Hercules IM8 carbon/polyethersulfone composites at temperatures ranging from 23°C to 90°C. Crack gages with different types can also be used for crack detection. One type uses a foil configuration 3 that cracks during the test, and a second version 4 uses an array of conductive wires that break in sequence as the crack front moves through the gage. Crack gages are mounted on the side face of the DCB test specimen and can get expensive for longer beam-type coupons. The foil-based gage requires substantial thickness for mounting (>0.5″), while the conductive wire array gage is limited in resolution and cost. Both gage methods require substantial specimen preparation, prior to testing.
Optical methods were also used in the literature 5 –7 to track the crack propagation in composites during mode I DCB testing. Hutapea and Yuan 5 used the traditional visual tracking method to monitor the crack propagation. Uhlig et al. 6 developed an automated optical crack tracing system that uses a CCD camera to monitor the crack front during the test, with real-time image processing to obtain crack propagation data. However, this method requires direct view of the tested specimen, which is not easy for environmental testing (hot–wet, low temperature, etc.). Davidson et al. 7 also used optical method to trace the crack propagation during DCB mode I testing on dry and wet carbon fiber/epoxy composites at different temperatures of −43, 21, 98, and 125°C. The authors pointed out that the in situ tracking of crack propagation was successfully performed at all temperatures except at −43°C due to the ice build-up on the window.
The major concern is that the performance of the abovementioned techniques can be adversely affected under extreme environments. None of these methods combine low cost, nonintrusive or in situ, usability under extreme conditions and simplified specimen preparation at the same time. A time-domain reflectometry (TDR) concept was successfully used for detection and measurement of crack propagation in composites during DCB testing at room temperature (RT). 8 Figure 1(a) shows the schematic geometry of TDR-DCB sample applied in our previous work. 8 The TDR concept involved sending a fast pulse down a transmission line and detecting reflections returning from impedance discontinuities along the line (see Figure 1(a)). Crack growth between the signal and ground lines results in changes in both geometry and electromagnetic material properties causing the TDR signal to deviate significantly from the baseline signal (see Figure 1(b)). This allows real-time tracking of crack location during the test.
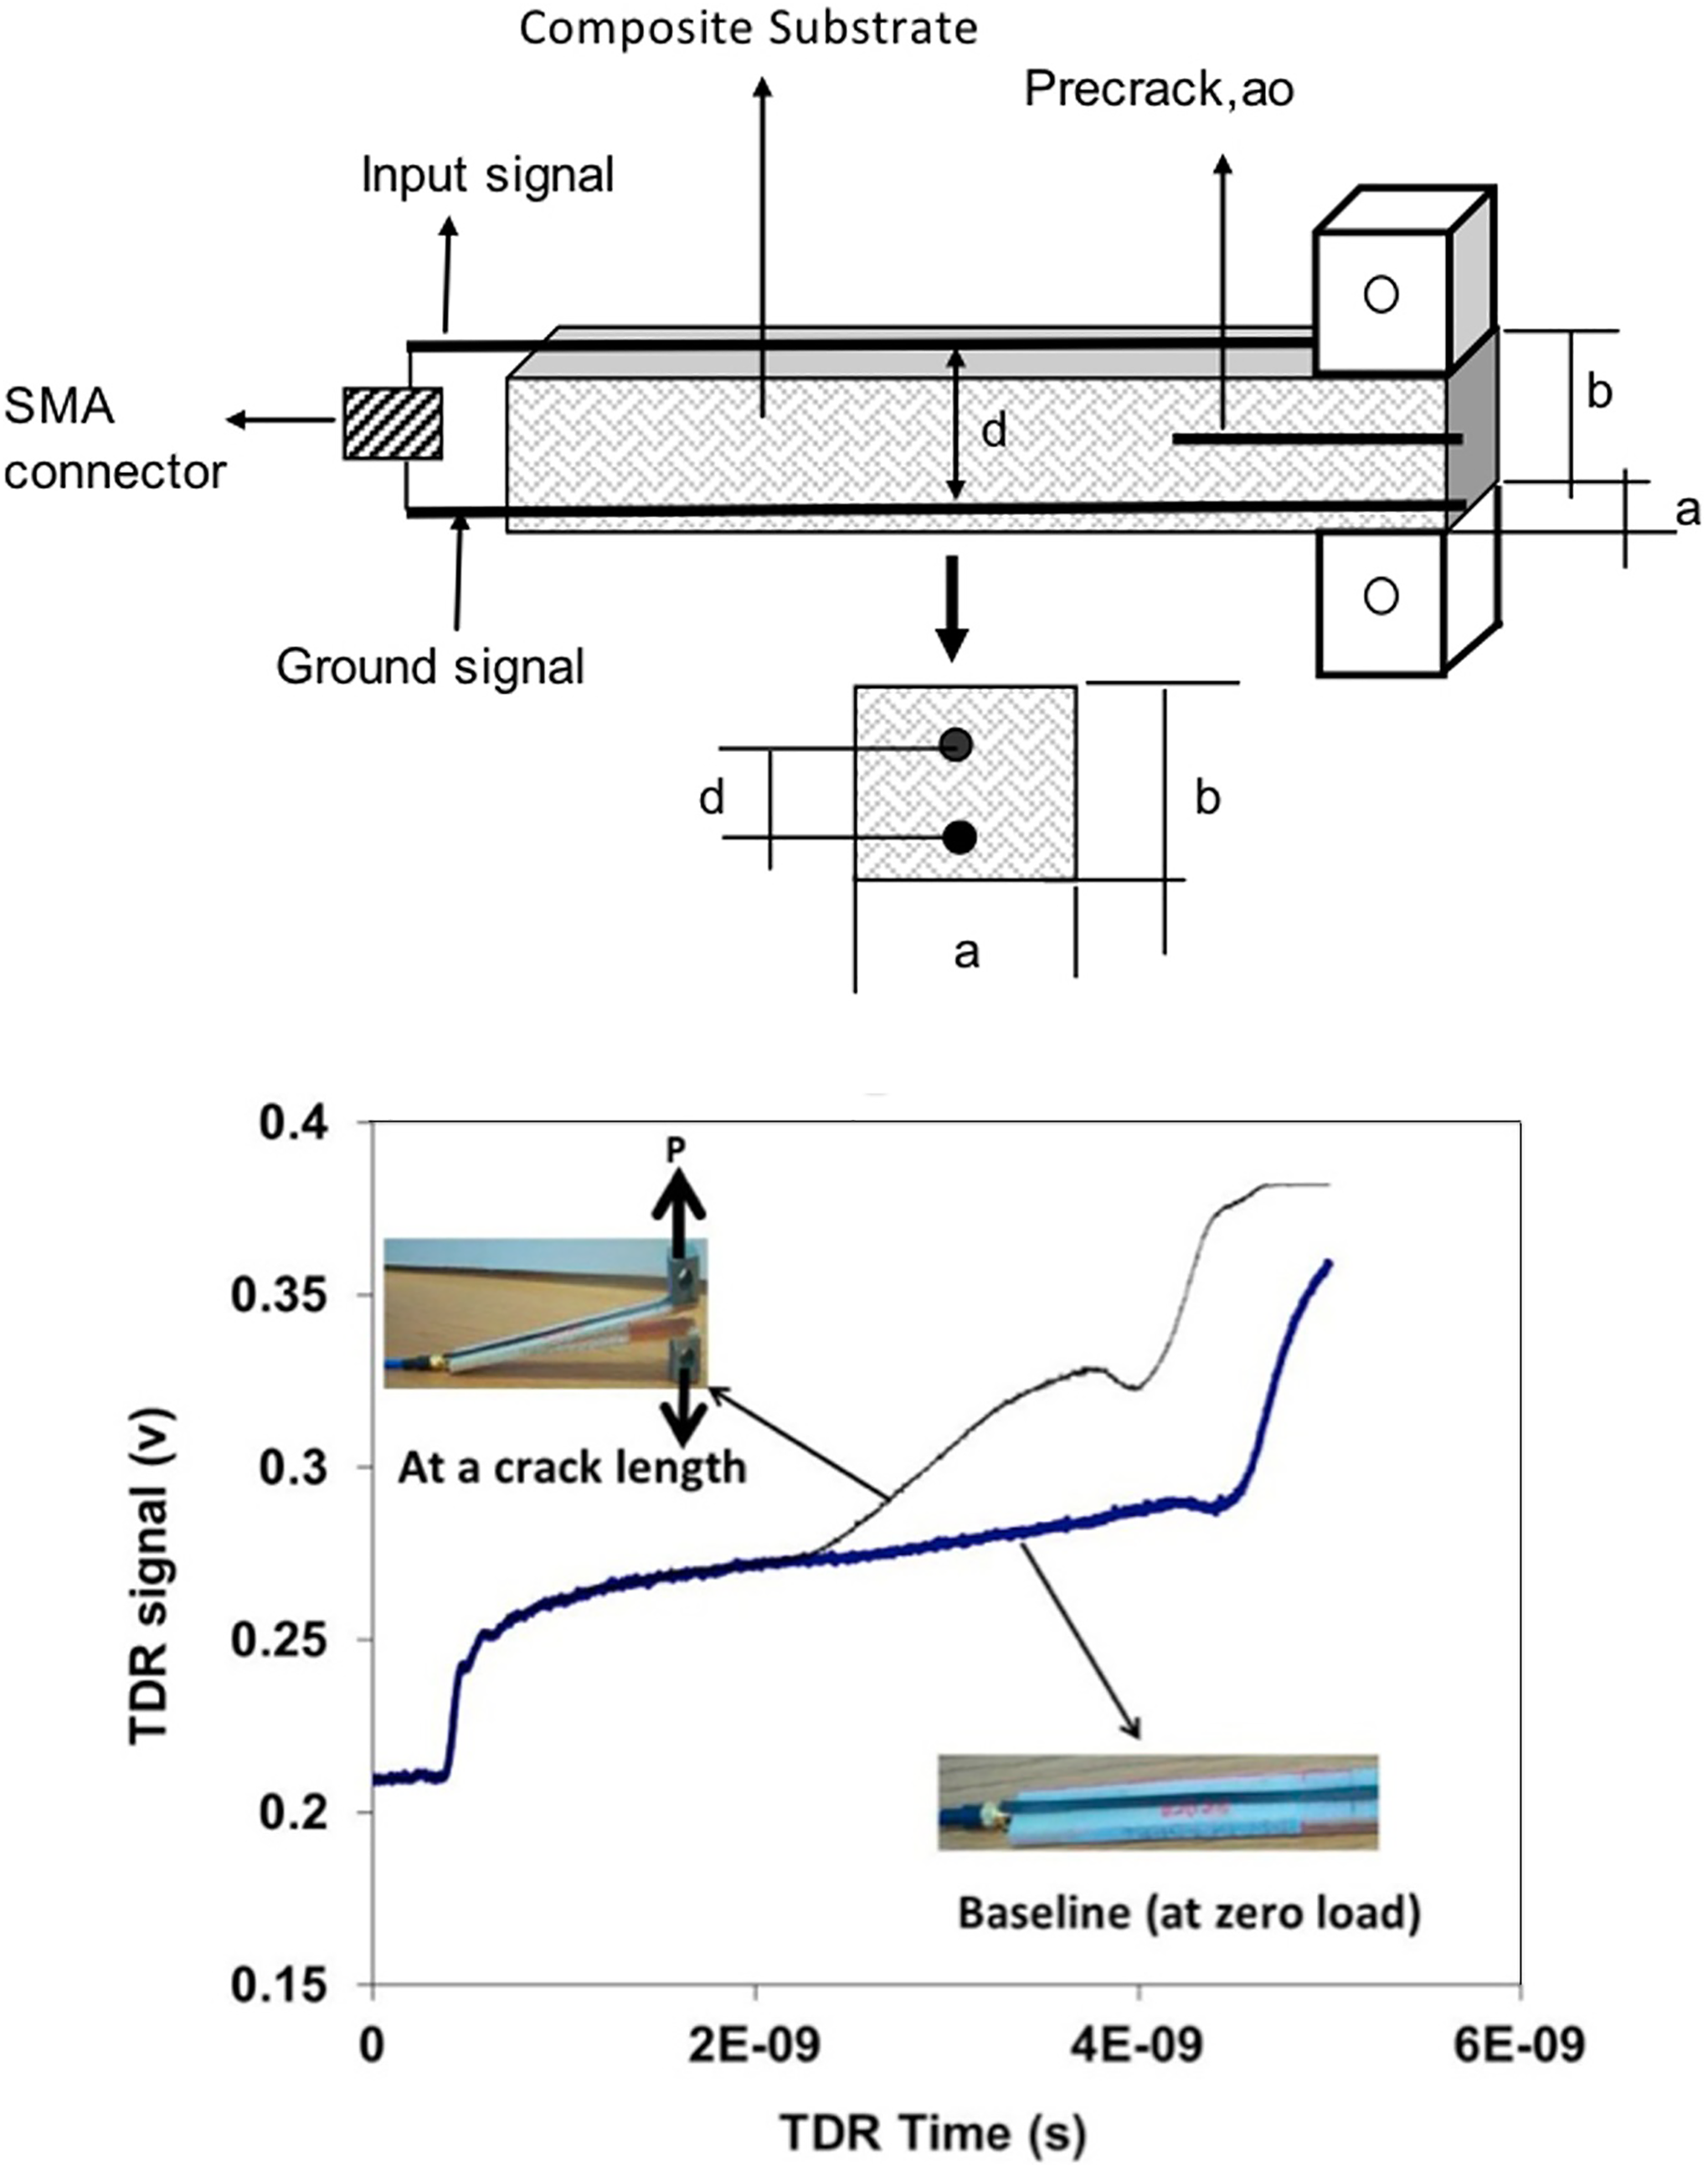
(a) TDR sensor configuration for mode I DCB test, where d is the distance between the signal and the ground line and a, b, and a 0 are specimen width, specimen thickness, and initial delamination, respectively. (b) TDR signal shows a clear shift in time axis with respect to baseline signal due to crack advancement in the DCB specimen. 8 TDR: time-domain reflectometry; DCB: double cantilever beam.
The goal of this study is to use the TDR-DCB test method for measurement of real-time crack growth in glass fiber/vinyl ester composites under different environmental conditions and assess TDR sensor performance. Testing was conducted on dry samples at 23 (RT), −40, 43, 60, 77, and 94°C and on water-saturated samples under wet/25°C and wet/60°C. TDR sensor performance was characterized and compared with the baseline RT dry case to assess the effect of the environment on sensor performance.
Materials
DCB samples were made using 24 Oz plain-weave E-glass and vinyl ester 510 A resin system. The resin was mixed with 1.5% of Trigonox, 0.2% of cobalt, and 0.2% of 2,4-pentanedione. Aluminum 6061 backing plates were used in the preparation of samples for testing in hot/dry conditions to prevent premature failure of the substrates in bending at higher temperatures. Adhesive film AF-191 manufactured by 3M was used as the bonding material between the fabric layers and aluminum strips. Hysol adhesive 1C-LV having a high resistance to hot/wet conditions was used to bond the tabs on the end of aluminum plates (Figure 3(c)).
Experimental methods
TDR sensor description
TDR sensors can be made from any conductive material, copper wire (with 0.003 ohms m−1), conductive fibers (such as ARACON fibers with 1.3 ohms m−1), and carbon fiber in thermoplastic tapes (such as IM7/PEI tapes with 50 ohms m−1). In our previous work, 8 the three types of sensors were evaluated showing no significant difference in the sensor response. Standard copper wire was used as the sensor material in this study due to low cost and ease of integration into the specimens during fabrication.
The TDR sensor in this study consists of a ground line and a feed line made from copper wire with a diameter of 0.25 mm. The spacing between the two lines was approximately 4 mm (four layers of 814 g m−2 fabric), as shown in Figure 2. The methodology used to embed the sensor wires in the composite laminate is described in subsequent sections.
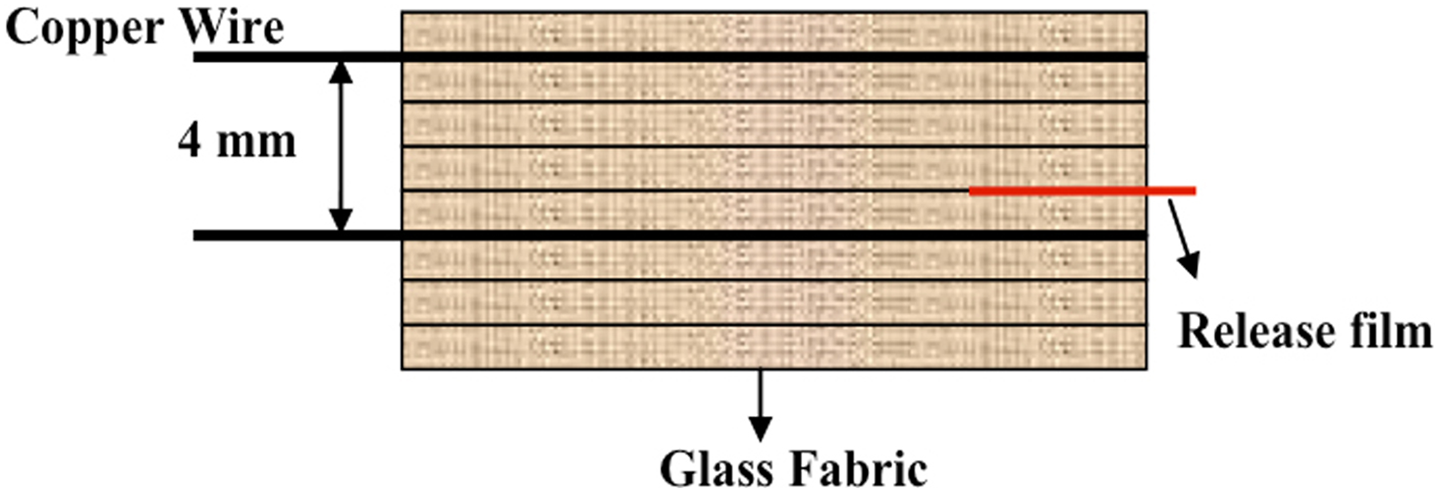
A schematic picture showing the sequence of the layup of fabric layers, TDR copper wires (diameter — 70 µm), and release film (artificial pre-delamination). TDR: time-domain reflectometry.
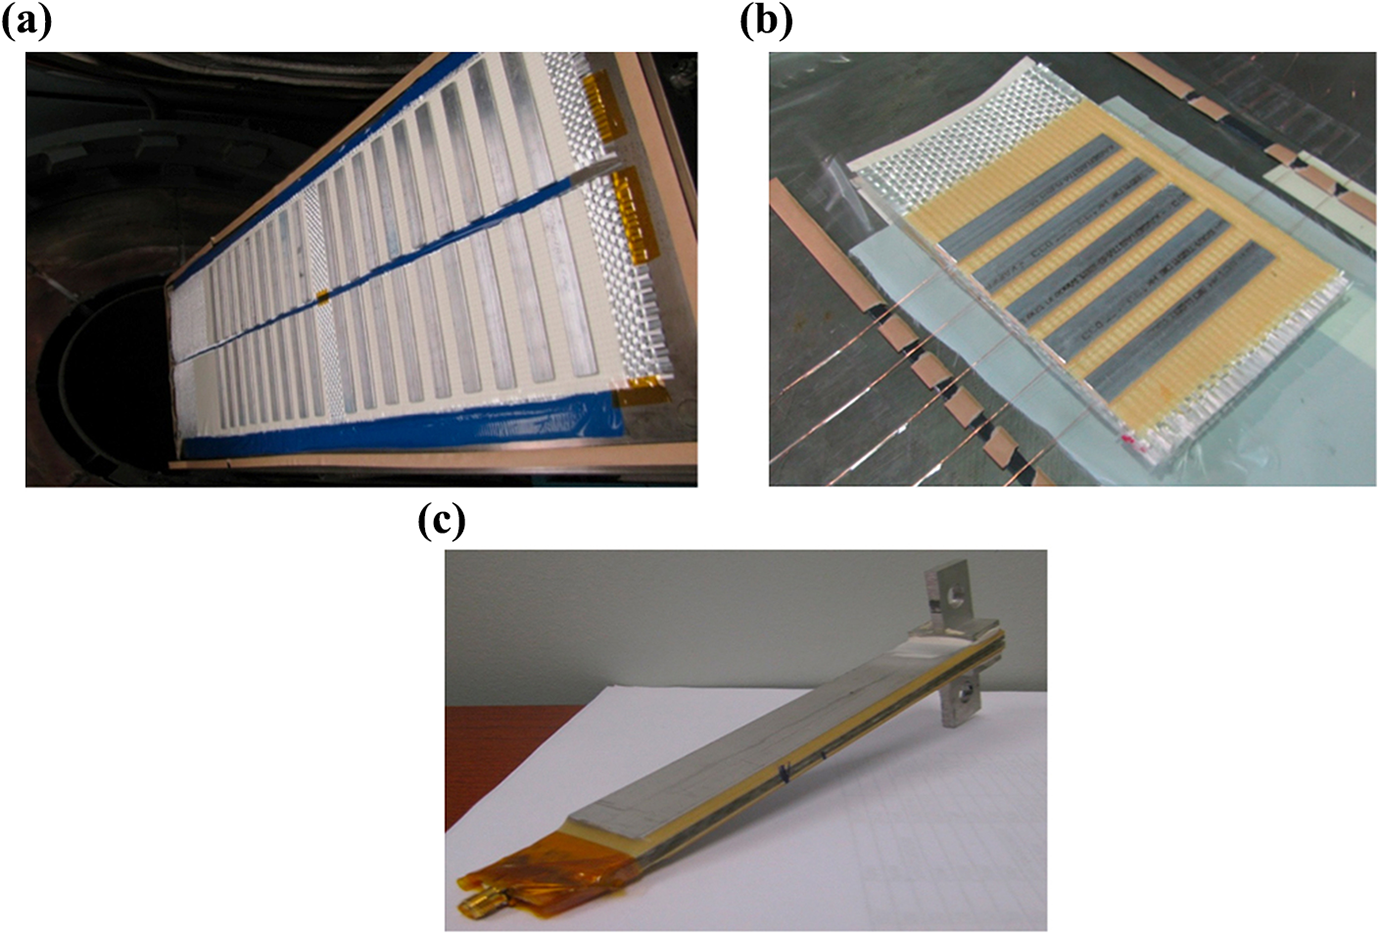
Preparation procedure for DCB samples with backing plates: (a) aluminum strips bonded to fabric surface in autoclave, (b) layup with backing plates and bare copper wires in place (c) final form of double cantilever beam (DCB) specimen with aluminum tabs and SMA connector.
DCB sample preparation
TDR sensor geometry for the detection of crack propagation consists of a signal path and ground plane straddling the crack plane in simple transmission line configuration, which was well described in our previous article. 8 This transmission line configuration was used in all sample groups (see Table 1). The first group (group 1) was used for testing under cold conditions and groups 2 and 3 were used for testing under wet conditions and hot/wet conditions. The samples in group 4 were tested under hot conditions, where the aluminum beams were bonded to the specimens as backing stiffeners.
Types of TDR-DCB samples made from S glass fiber/vinyl ester composites.
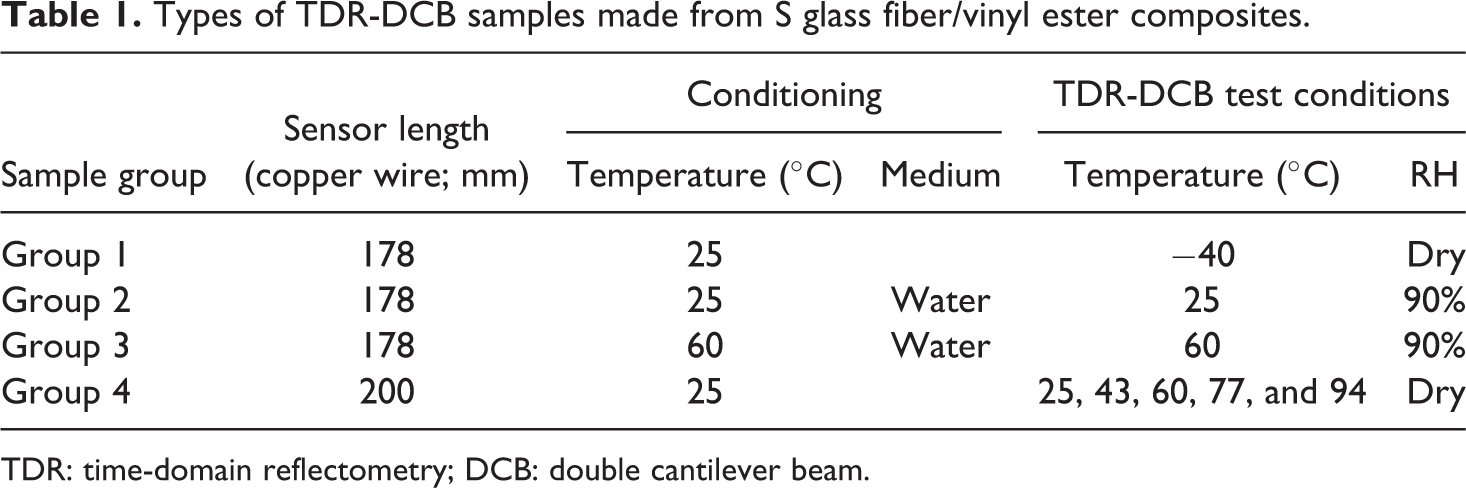
TDR: time-domain reflectometry; DCB: double cantilever beam.
Specimen preparation for testing under cold (group 1) and wet (groups 2 and 3) conditions
The two copper wires representing the signal and ground lines of the transmission line were carefully placed in the layup with a gap of four layers between them prior to infusion. The wires were placed after the first and the fifth layer, with a release film placed in the midplane (four layers on each side) to create the precrack in the laminate (see Figure 2). Kapton tape was used on both ends of the wires to keep them aligned during the infusion process. A gap of 38 mm was kept between adjacent wires to prevent any shorting in the sensors. The assembly was then infused with resin using VARTM process at RT. The laminate was allowed to cure at RT for 24 h, followed by a post cure cycle of 6 h at 80°C. The DCB test coupons were then machined out of the composite panel with the final dimensions of 178 × 25 × 4 mm.
Aluminum blocks were bonded to the ends of the composite samples, as shown in Figure 1. SMA connectors were soldered to the ends of the transmission line (ends of the copper wires) of test coupons. Prior to conditioning in water (groups 2 and 3), the SMA connectors of the samples were sealed using high-temperature rubber caps to prevent water diffusion.
Specimen preparation for testing under hot/dry conditions (group 4)
For testing under dry/hot conditions, aluminum plates were bonded to the coupons to stiffen the samples in high-temperature environment and facilitate the crack monitoring without the softening effect (i.e. prevent bending failure). The use of backing plates is well-documented in the literature; for instance, Dransfield et al. 9 used stiffeners in carbon/epoxy DCB samples to stiffen the samples for testing under mode I testing. Blackman et al. 10 also utilized the backing plate method for conducting DCB tests in high-temperature conditions. Tanzawa et al. 11 also used this technique for 3-D orthogonal interlocked fabric composites.
In this study, 3.18-mm thick Aluminum 6061 backing rectangular bars (25.4 × 203 mm2) were bonded to two fabric layers using adhesive film AF-191 and applying 0.31 MPa pressure at 177°C for 60 min with a ramp of 3°C min−1 (Figure 3(a)). These two glass layers were used as the top and bottom layer, and six other glass layers (203 × 508 mm2) were placed in between them (Figure 3(b)). The cured panel was cut into test coupons with final dimensions (25 × 2.5 × 0.4 cm3). Aluminum loading blocks were then bonded to the samples, and an SMA-type connector was soldered to the ends of the transmission line (ends of the copper wires), as shown in Figure 3(c).
TDR-DCB test methodology
Each specimen was mounted on test frame (Instron 4484 static load frame, made by Instron, MA, USA) equipped with an environmental chamber, where a thermocouple was attached directly to specimen to monitor the real-time temperature during the test. All tests were performed at a crosshead speed of 2.54 mm min−1 with a 500-N load cell for samples without stiffeners and a 5-kN load cell for the samples with stiffeners. A special TDR-DCB acquisition system was developed to collect real-time data of TDR signal, load, and displacement. The data acquisition rate used for the testing was 10 points s−1. The TDR system uses a digitizing oscilloscope with a 54754A differential TDR plug-in (type: HP54750A supplied by an Agilent Technologies, Santa Clara, CA, USA). Data reduction was done using a custom LabVIEW program VI from National Instruments.8
Data reduction methodology
Figure 4(a) shows typical TDR signal sequences during DCB mode I testing. For all cases, the baseline (reference signal when the load is zero) shows the usual signal injection on the left and open-circuit reflection on the right (Figure 4(a)). As load increases, the crack propagates causing the signal–ground spacing, and consequently, impedance to increase at the loaded end of the coupon induces the signal to rise from the baseline signal. The position along the time axis at which this initial rise occurs is the crack front which moves to the left as the crack growth in the specimen advances. The flight time at which the initial rise of the TDR signal occurs is defined as the crack position
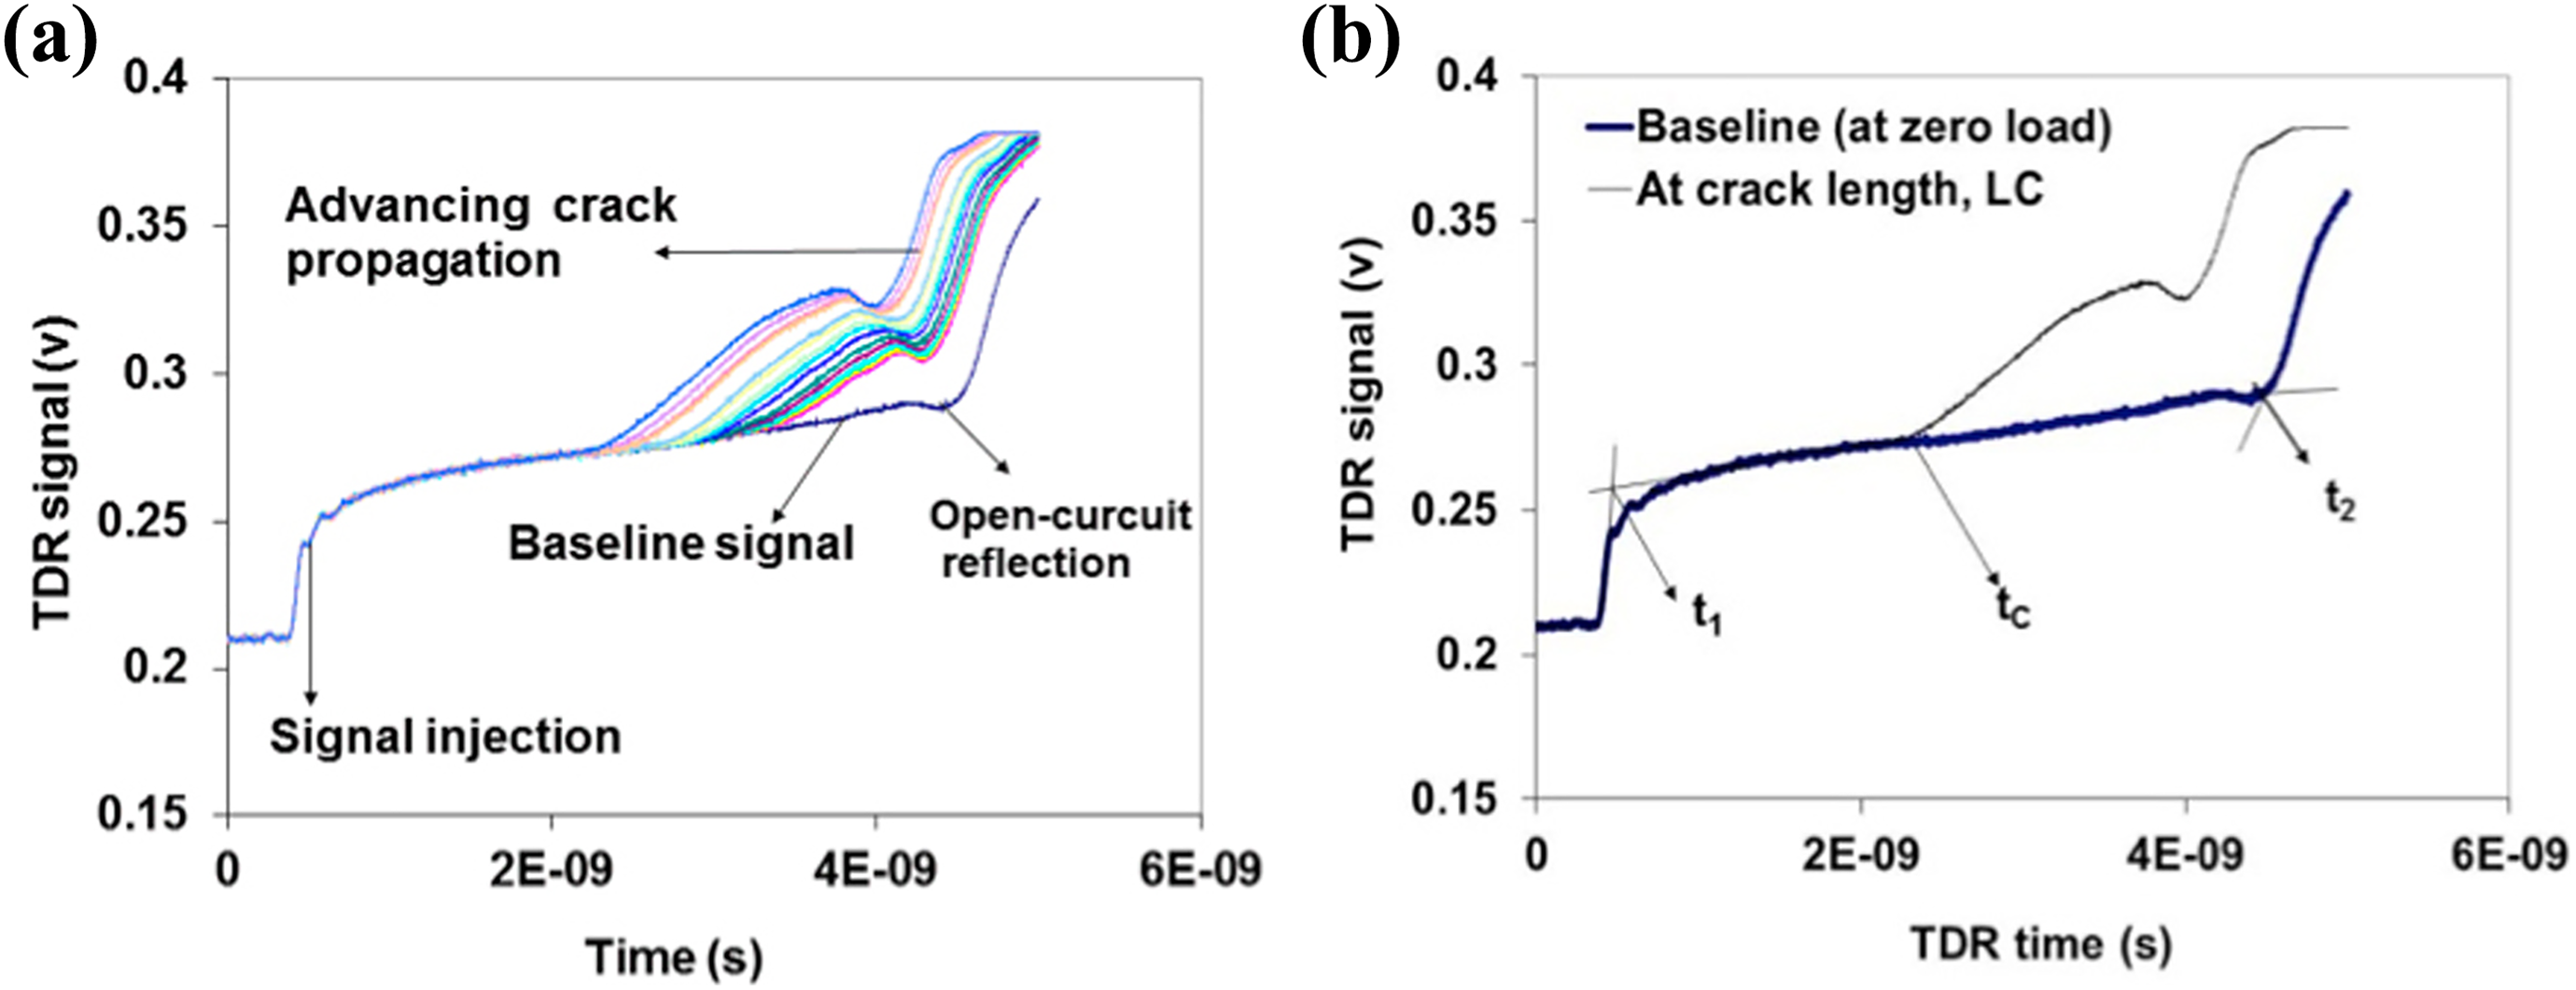
(a) Representative real-time TDR signal during mode I testing and (b) timing markers in the TDR crack sensor signal that are used to determine crack propagation. TDR: time-domain reflectometry.
Crack length measurement
The crack length is determined by the timing shift (

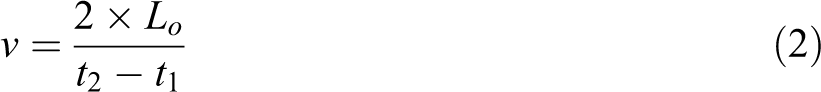
where v is the propagation velocity in the sensor of length Lo as calculated by the following equation:
Combining equations (1) and (2) gives the crack opening
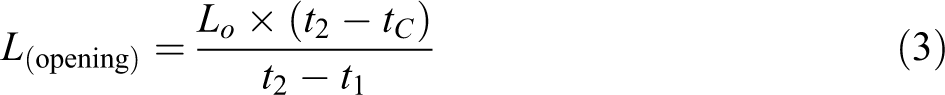
Since the total crack opening includes the crack length LC
and the initial delamination 
Fracture toughness calculation
The interlaminar fracture toughness 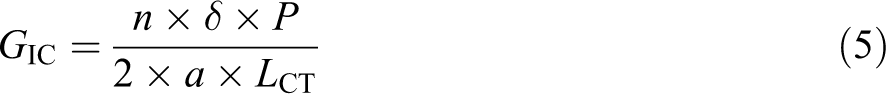
where
Experimental results
Initial measurements focused on the signal response of the TDR sensor for the various environmental conditions of interest.
TDR sensor response for various environmental conditions
In order to determine whether the test conditions significantly change the dielectric properties of the material (glass/vinyl ester composite) during the test, the TDR signal under zero load was compared at different environmental conditions, and the results are shown in Figures 5 and 6. Figure 5(a) shows the TDR signal of the specimen under cold/dry conditions compared to the baseline signal, and no significant changes were observed. For the samples submerged in water till saturation at RT (wet), and at 60°C (hot/wet), the TDR signal obtained from wet samples exhibits relatively small changes in the TDR signal voltage axis (Figure 5(b)). This change indicates that the water conditioning of samples to saturation (approximately 3 months) induced small changes in the dielectric properties of the glass/vinyl ester composite. These results were expected since the saturation values of water uptake at both temperatures were less than 1%. In the literature, it has been shown that the dielectric constant of polymers increases with increased water content absorbed by the polymer. 12 For composites with matrices that are more susceptible to water (e.g. epoxies), we can expect a larger shift in the signal due to larger changes in dielectric properties and will be addressed later in a parametric study. Figure 6 shows insignificant changes in the TDR signals obtained from the specimens (with aluminum backing plates) at various temperatures in dry conditions compared to the baseline (no backing plates).
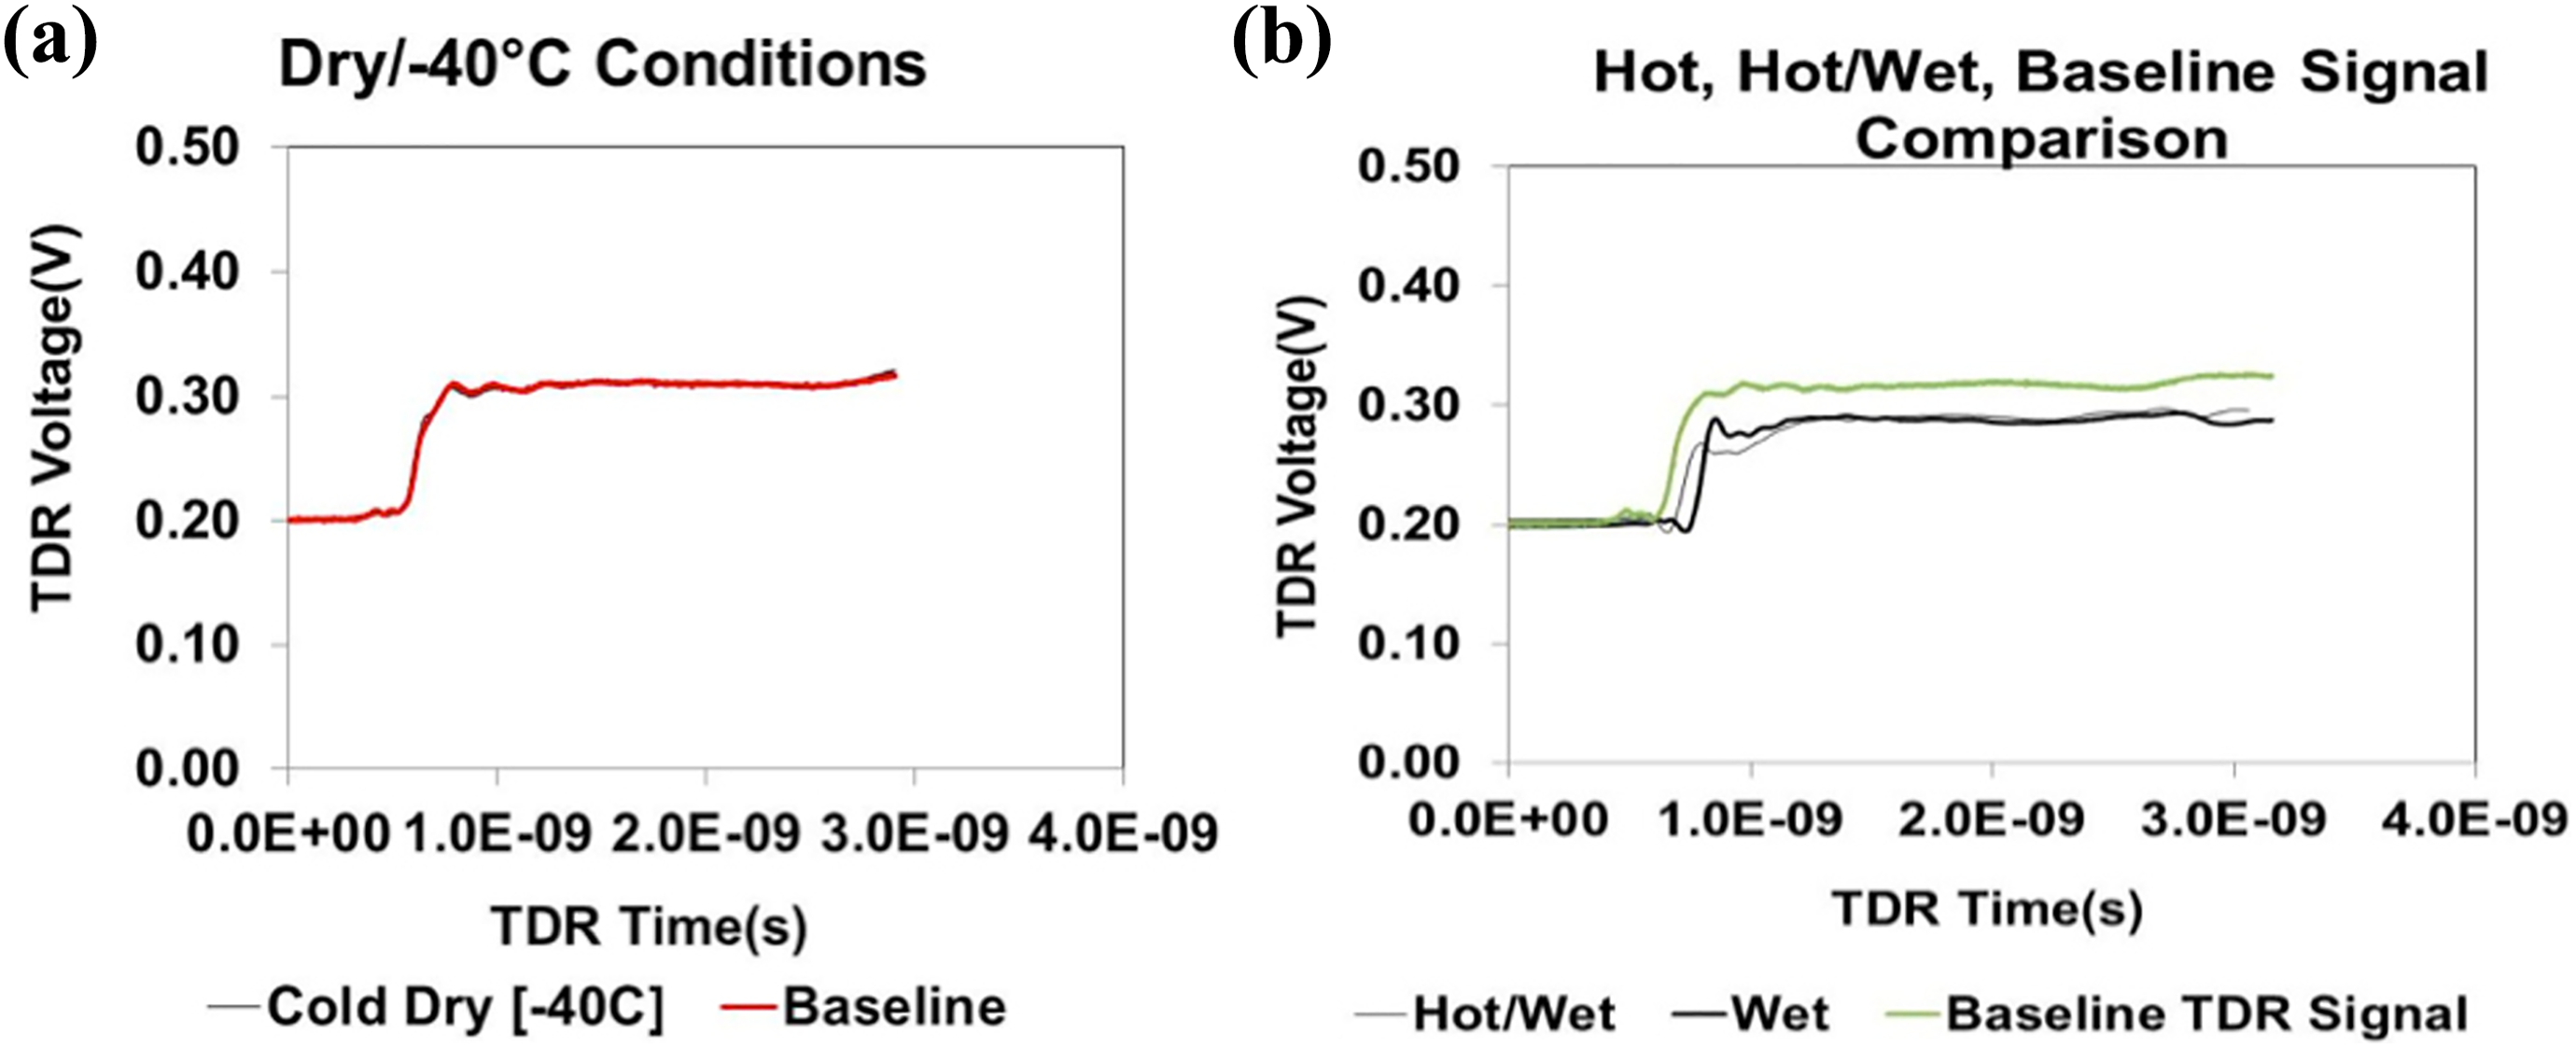
TDR sensor response under different test conditions compared with their baselines prior to crack initiation. TDR: time-domain reflectometry.
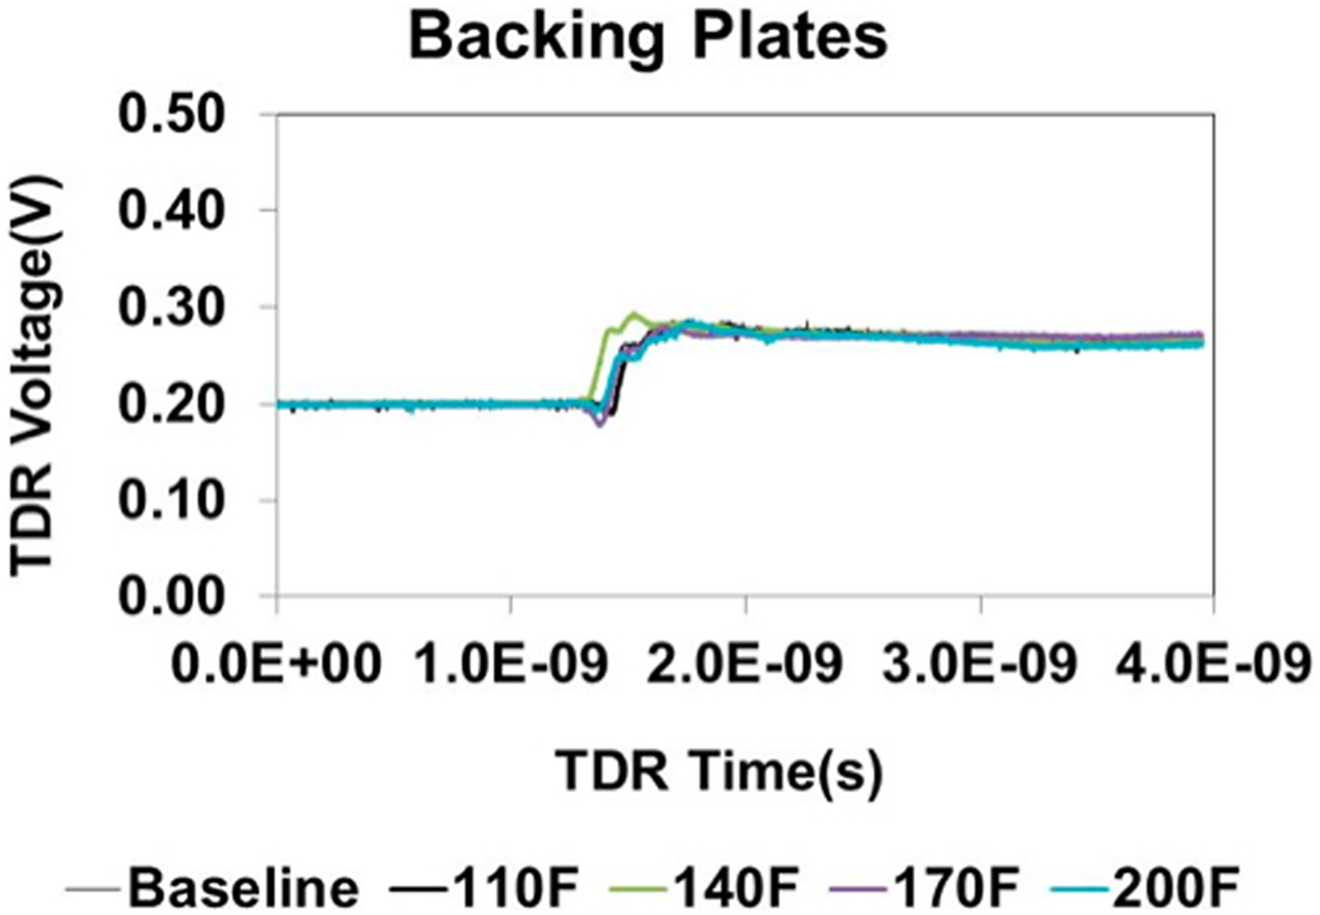
TDR sensor response from DCB samples with backing plates under different temperatures compared to baselines prior to crack initiation. TDR: time-domain reflectometry; DCB: double cantilever beam.
Effects of test conditions on crack detection by TDR sensor
Representative real-time TDR signals recorded for samples tested under dry/cold, dry/hot, wet/RT, and wet/hot conditions are shown in Figure 7. Regardless of the type of test condition, the real-time TDR signal exhibits clear time shifts as the crack in the specimen propagates. Overall, these results confirm the feasibility of automated TDR method for tracking crack propagation under various environmental conditions.
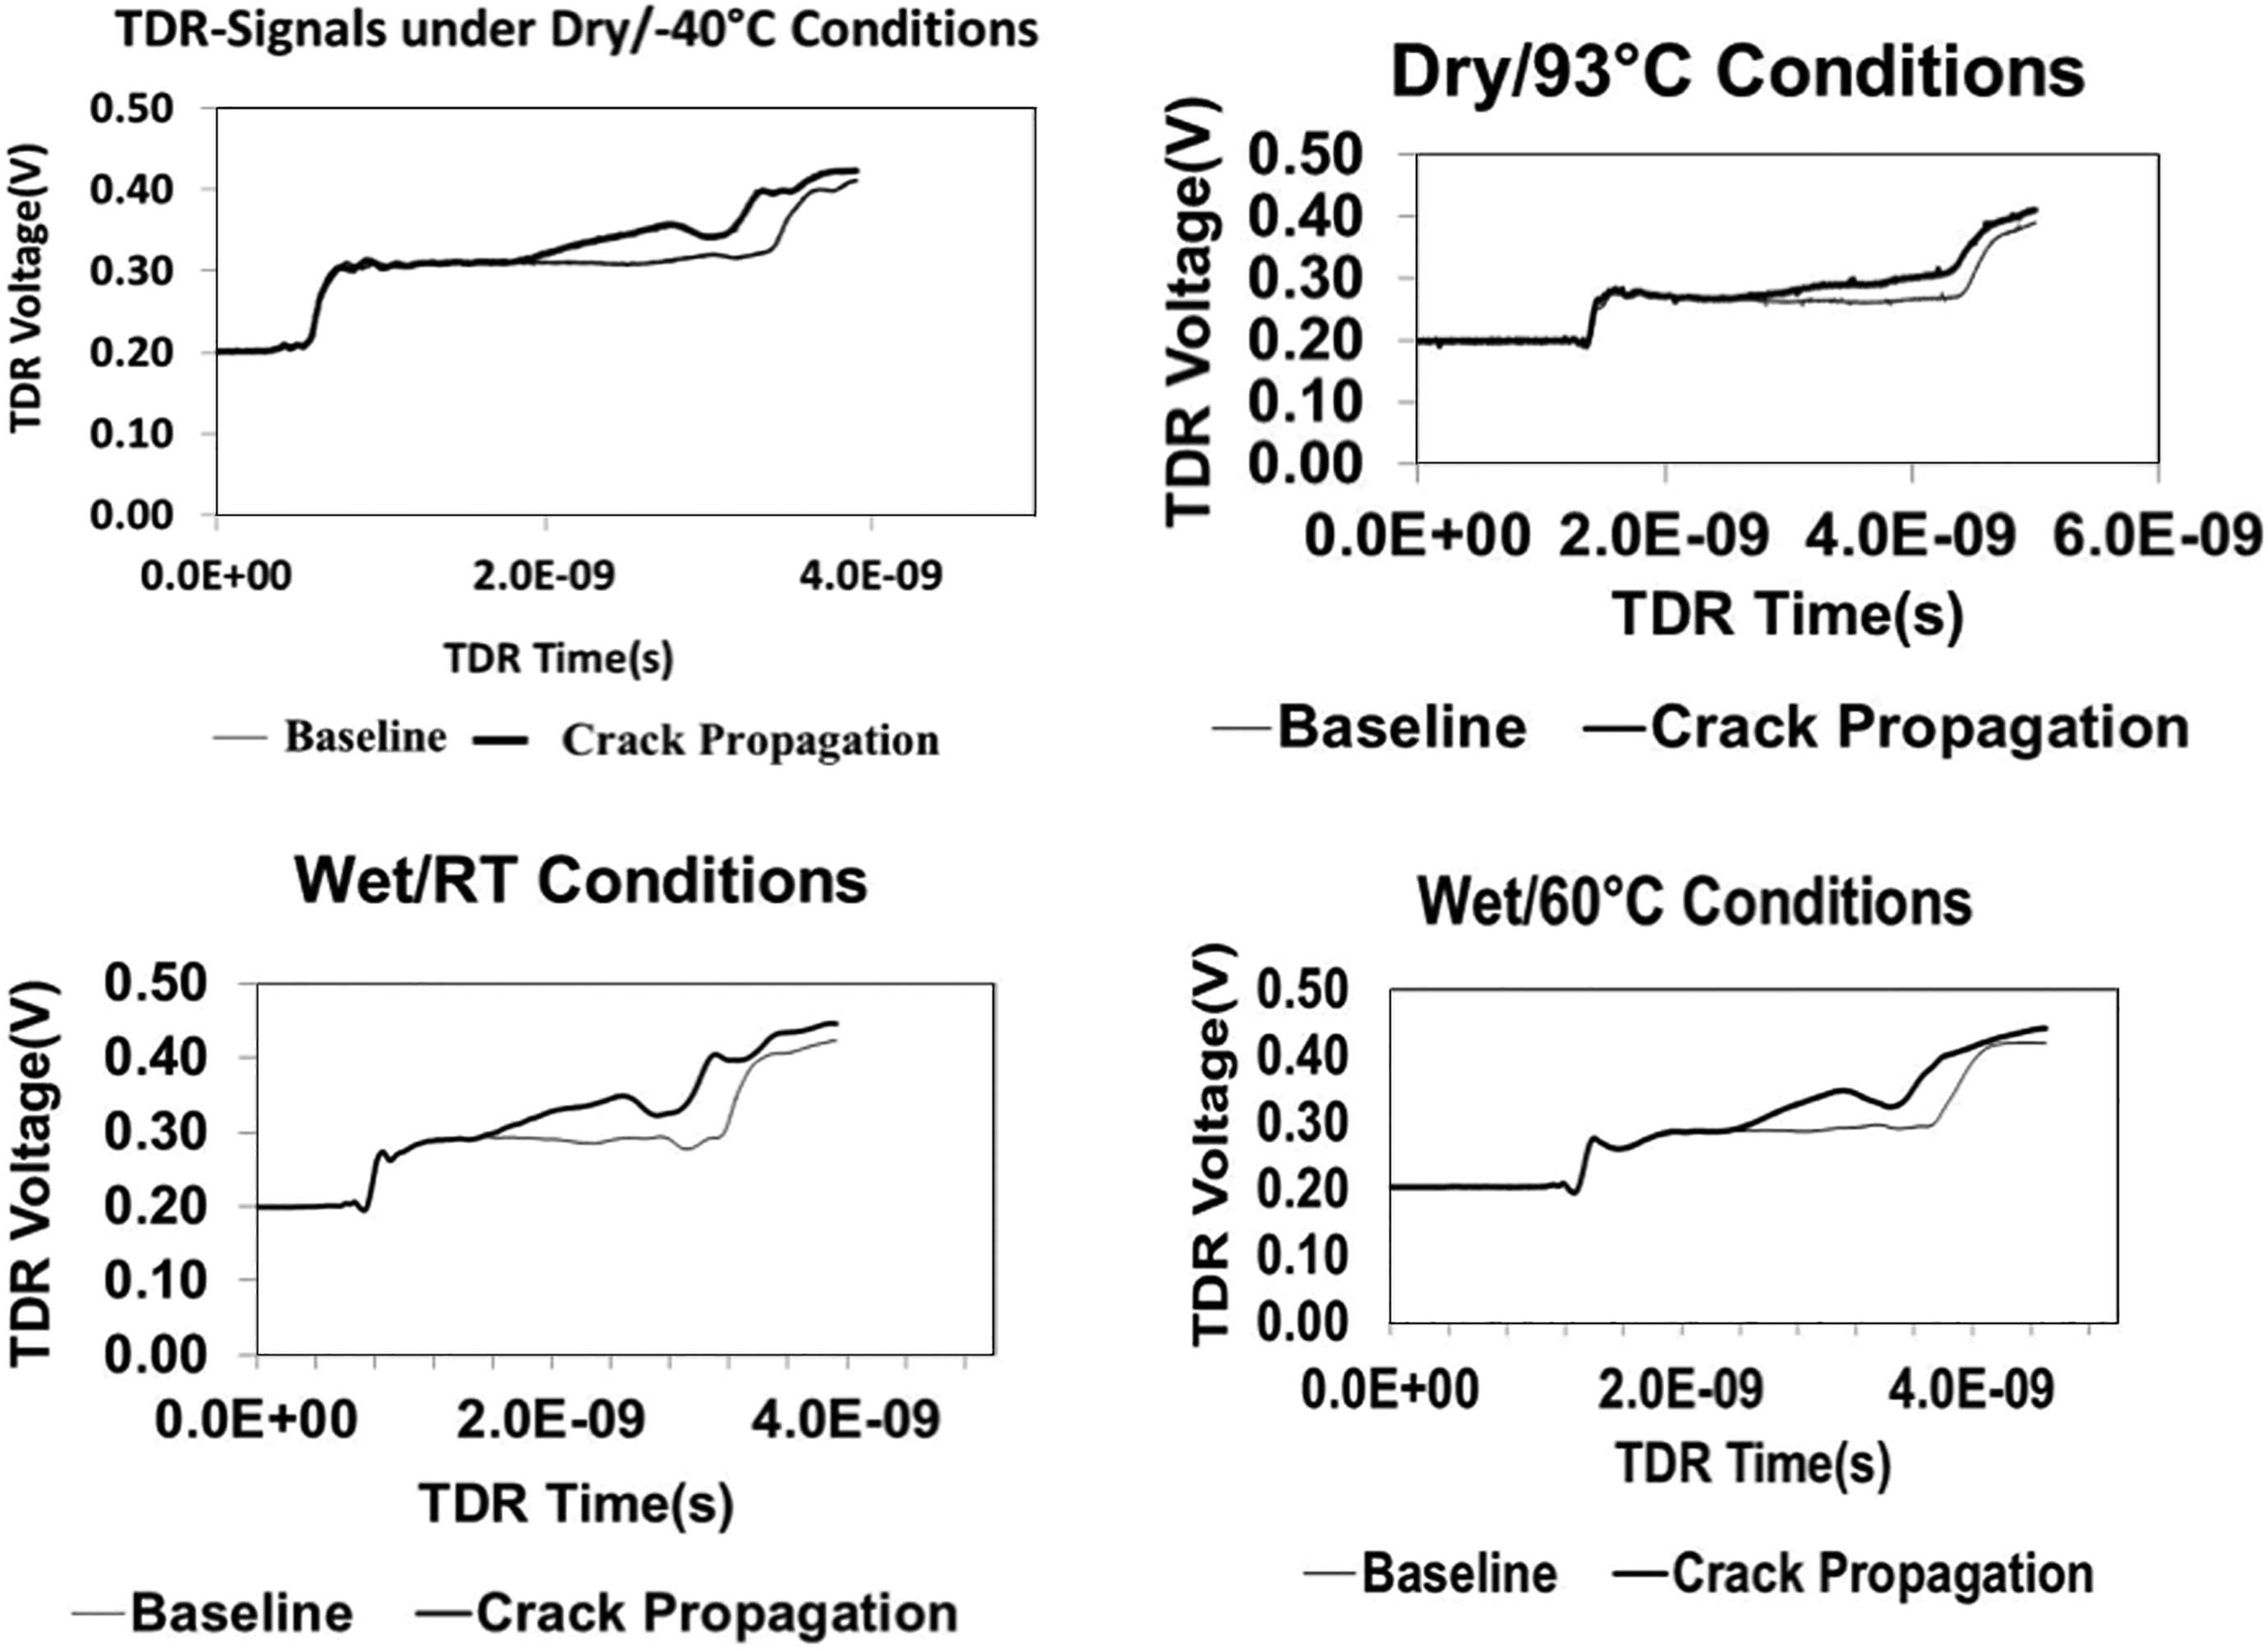
Representative real-time TDR signals for composite samples under different environmental conditions. For all environmental conditions, clear time shifts due to the advancing crack propagation were obtained. TDR: time-domain reflectometry.
For DCB sample with backing plates, it is essential to check whether the metal stiffeners affect the performance of TDR signal during DCB testing. Representative TDR signals obtained under dry/RT conditions for the DCB samples with and without stiffeners are shown in Figure 8. From Figure 8 (right), the TDR signals obtained for sample stiffened with aluminum backing plates exhibit insignificant attenuation and clear rise in voltages with respect to their baselines as crack advances; same behavior was observed in samples without stiffeners tested under dry/RT conditions (see Figure 8 (left))
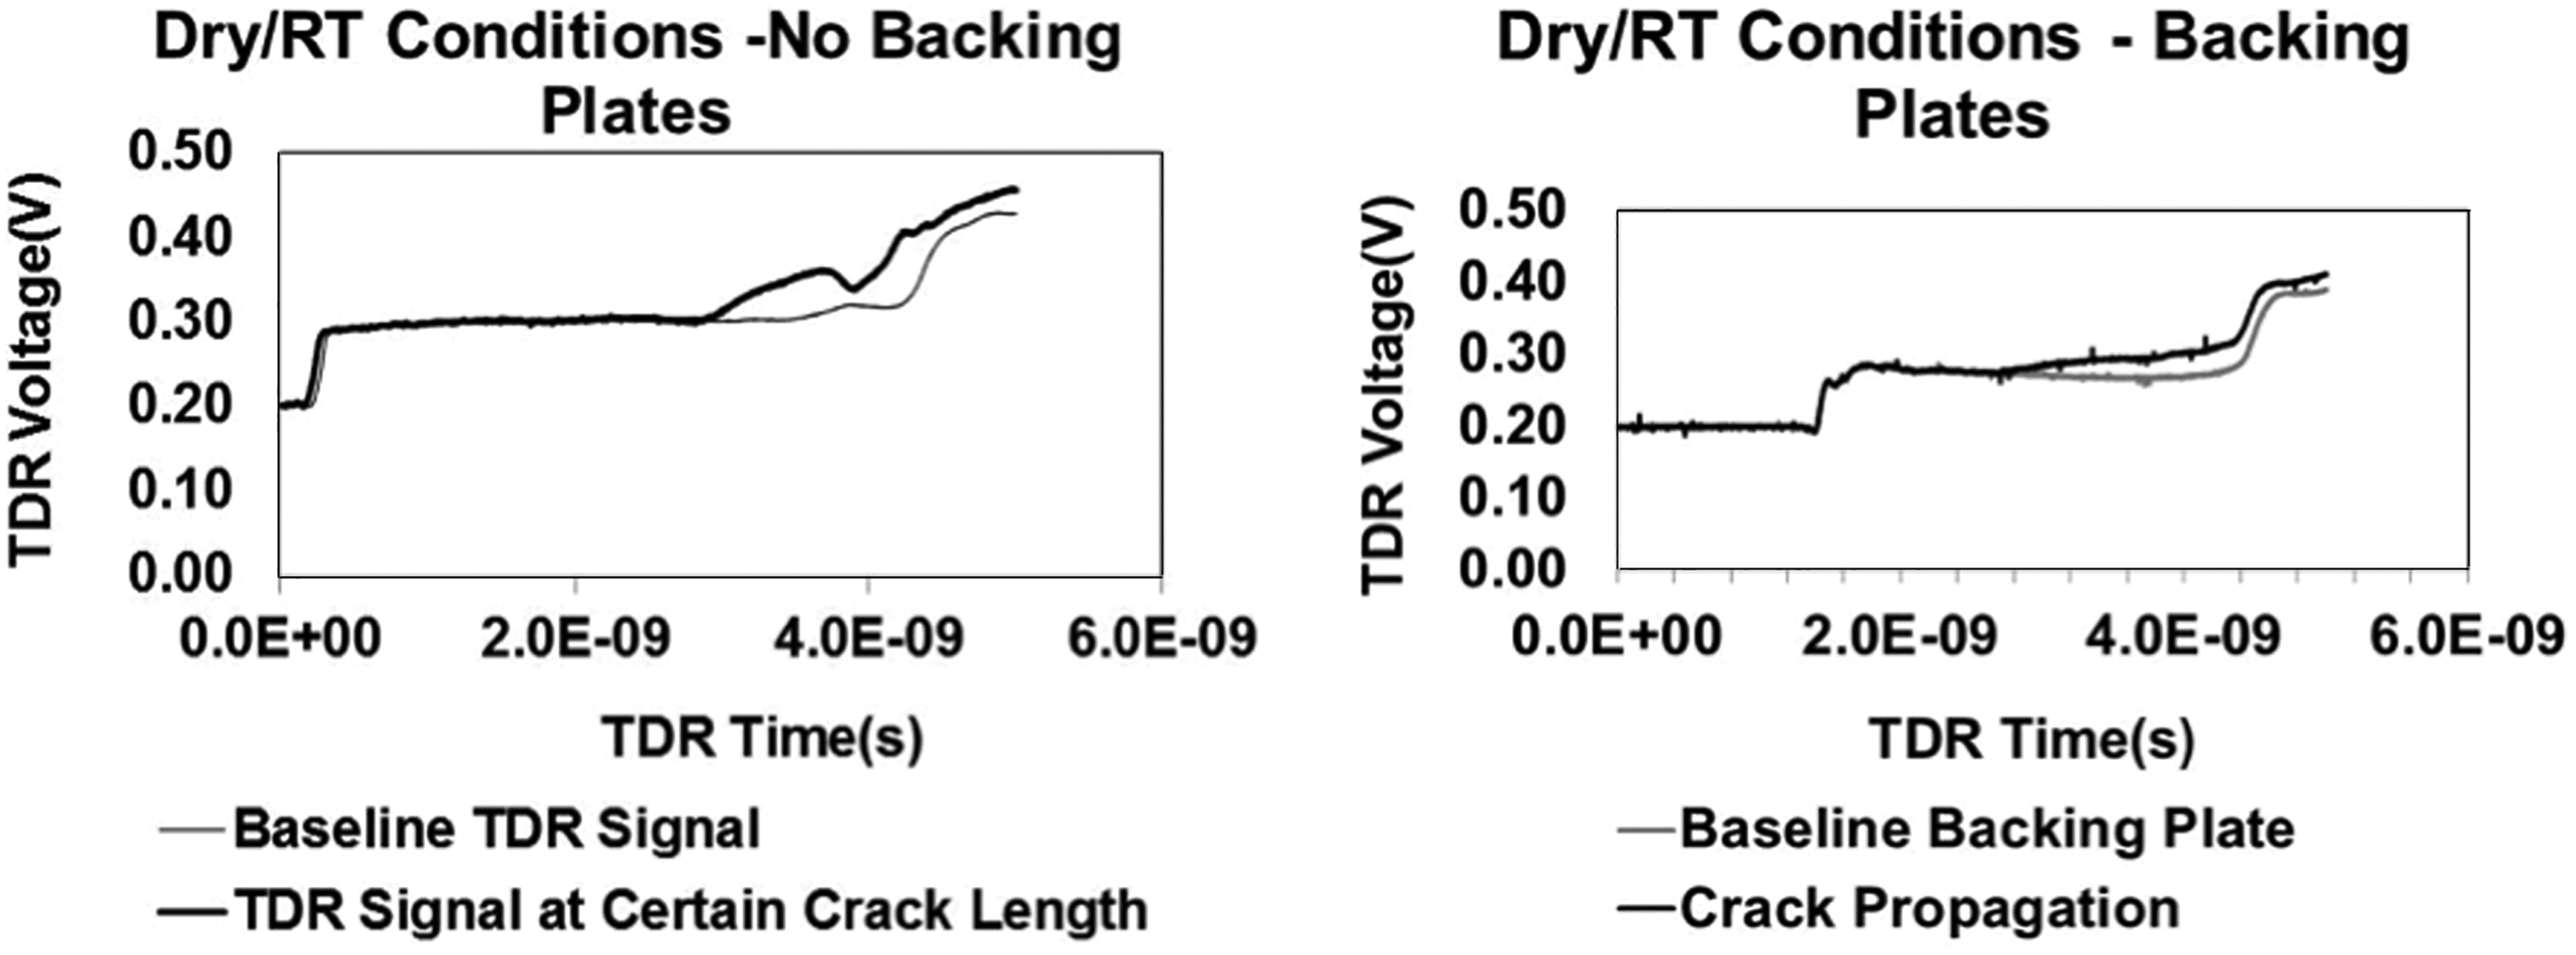
Representative real-time TDR signals obtained for composite samples with and without stiffeners tested under dry/RT conditions. TDR: time-domain reflectometry; RT: room temperature.
Fracture toughness under cold/dry conditions (group 1)
For samples tested under dry/25°C (baseline samples) and dry/−40°C conditions, real-time load and TDR signals were acquired. From these data, the real-time crack propagation length was measured using equation (4). Their representative curves of crack length and load versus time are shown in Figure 9. Samples tested at −40°C show more or less comparable real-time fracture behavior to baseline samples.
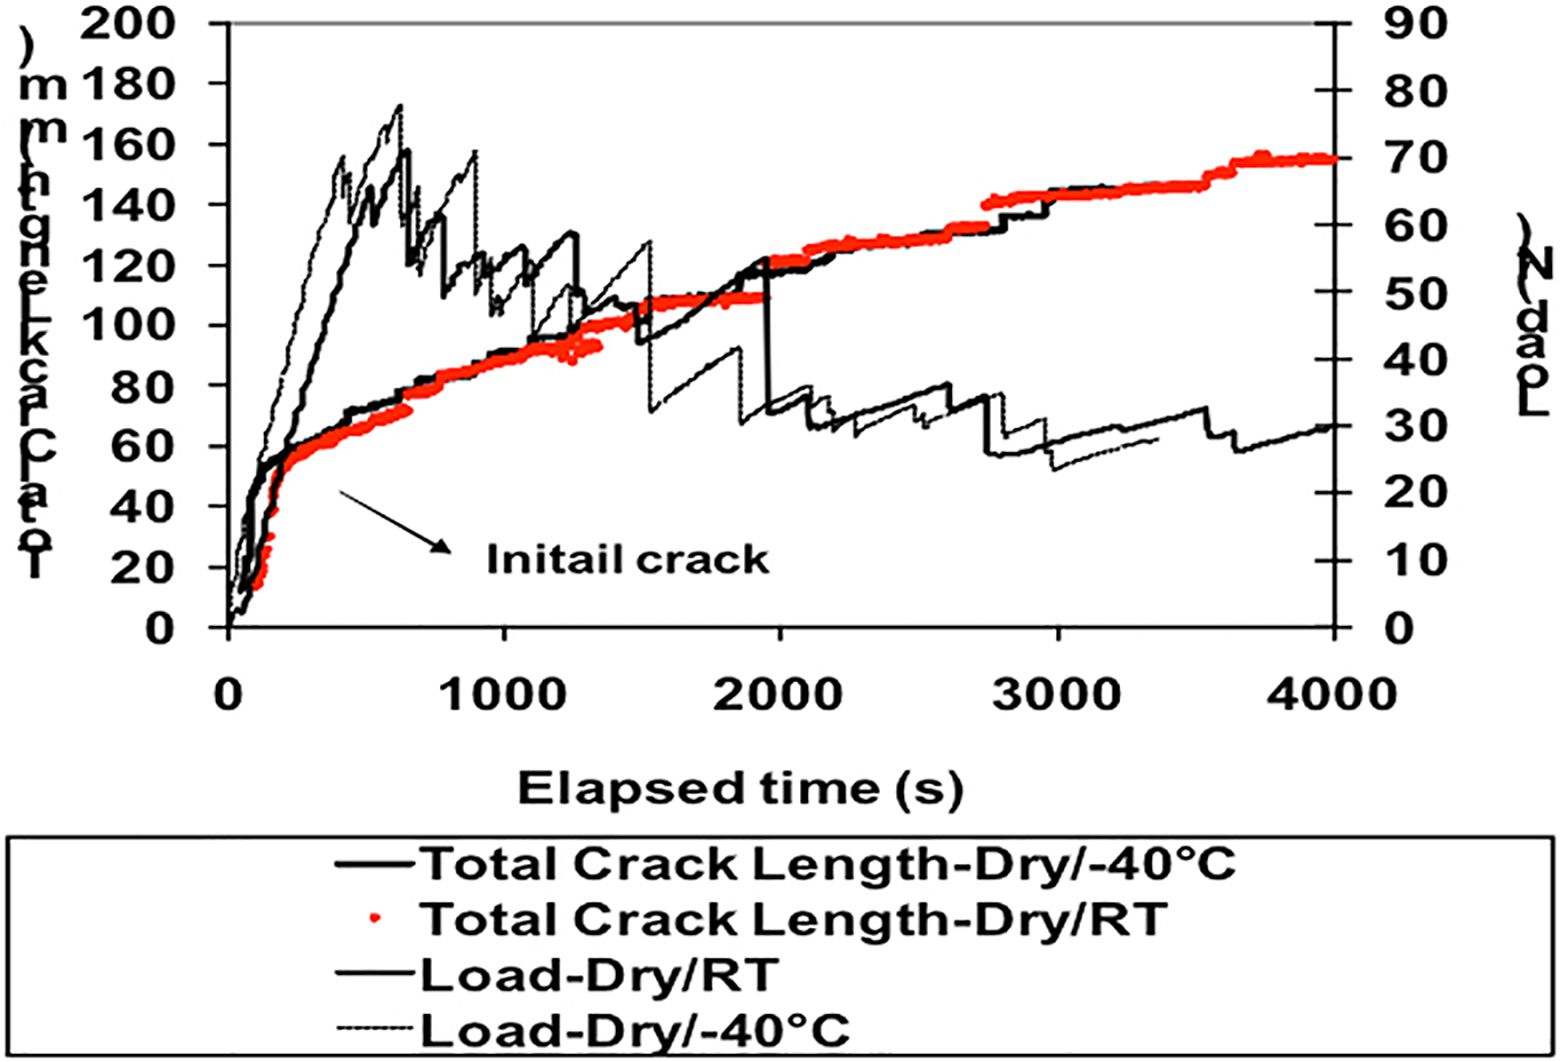
Representative real-time load and crack propagation length in composite samples tested under dry/RT and dry/−40°C conditions. RT: room temperature.
Applying equation (5) to the real-time data measured, fracture resistance curves (
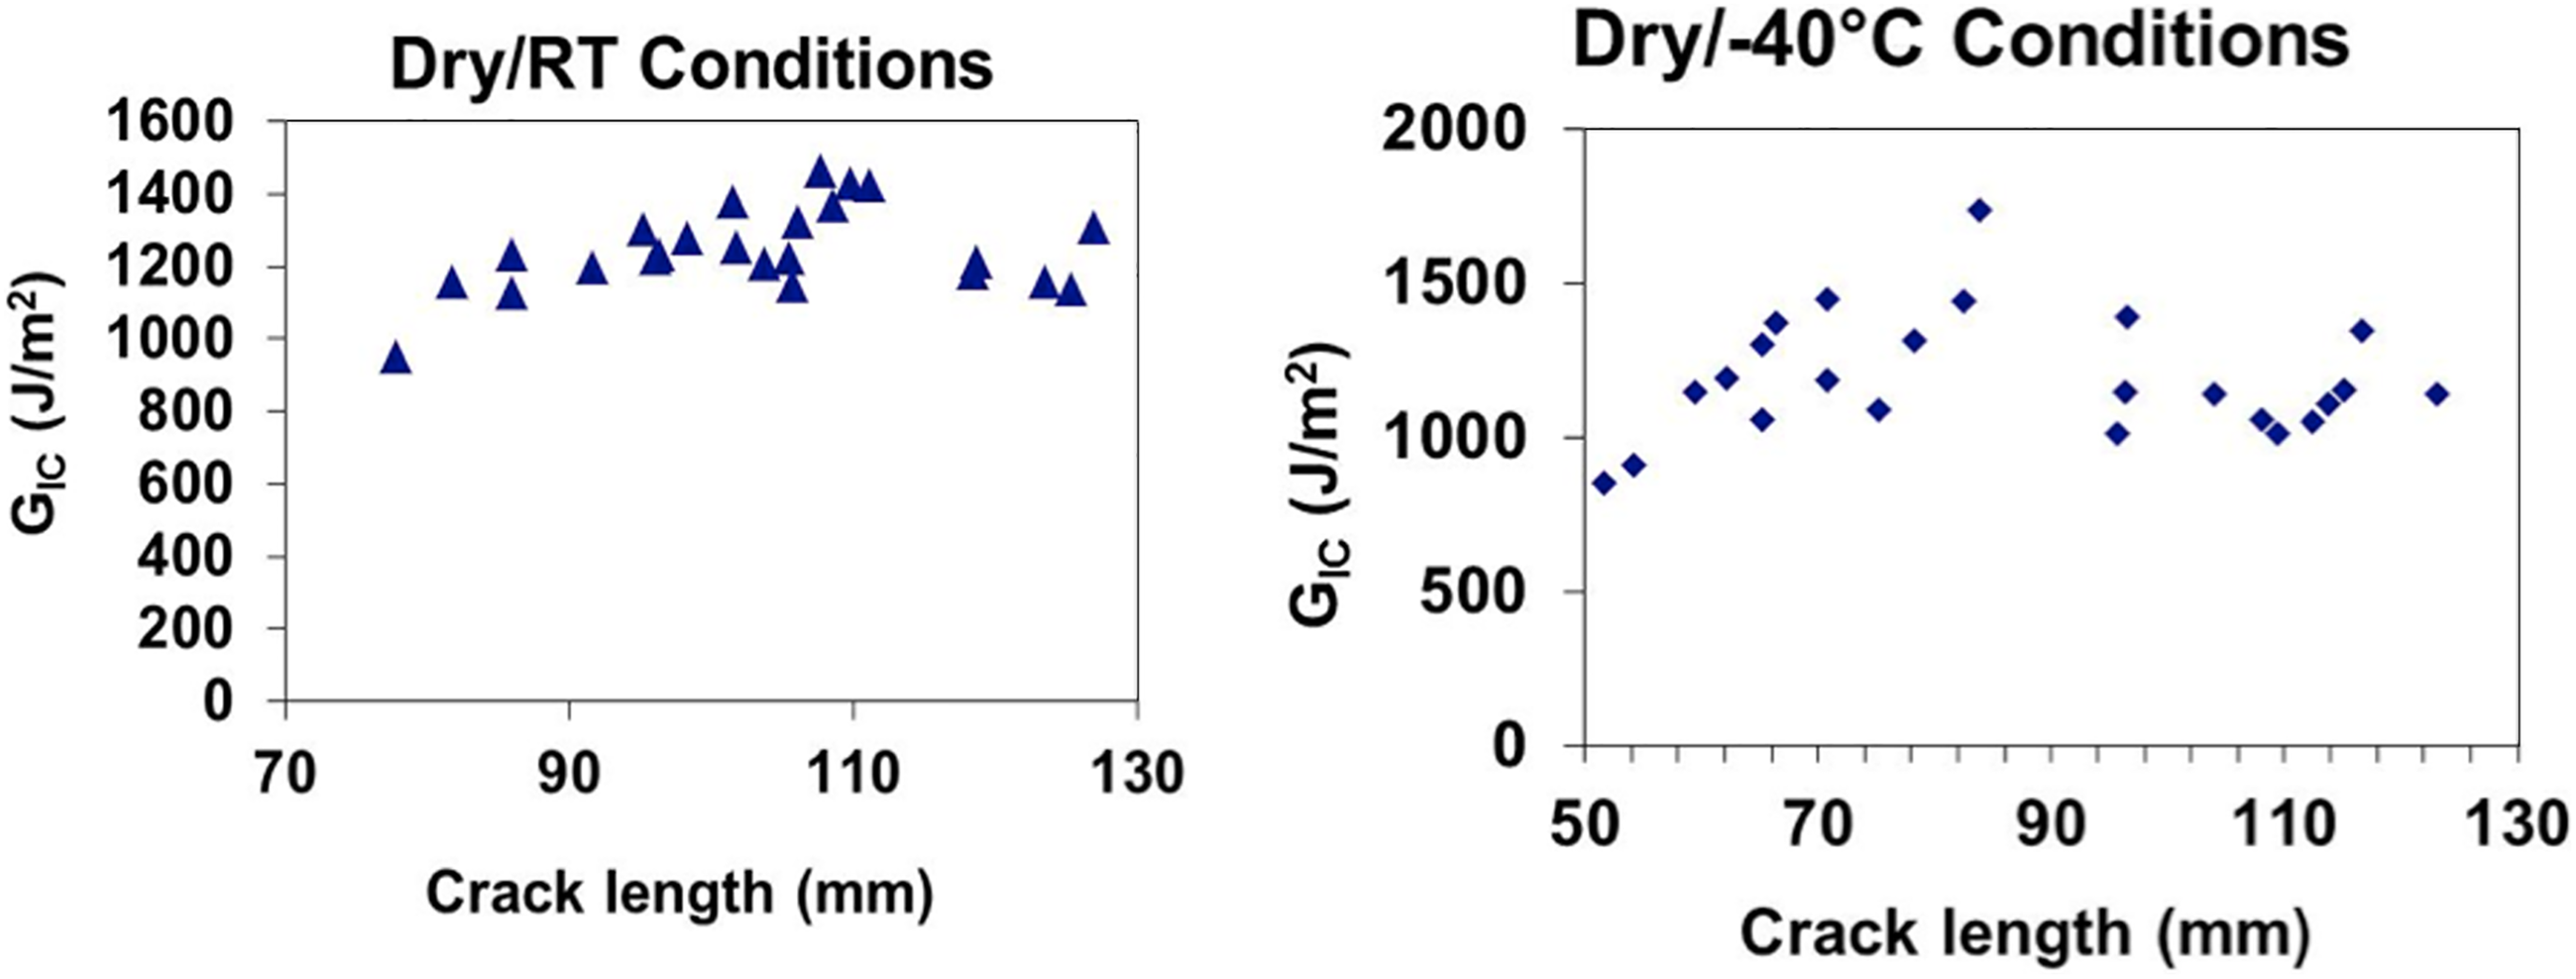
Representative fracture resistance curves obtained for composite samples tested under dry/RT (left) and under dry/−40°C conditions (right). RT: room temperature.
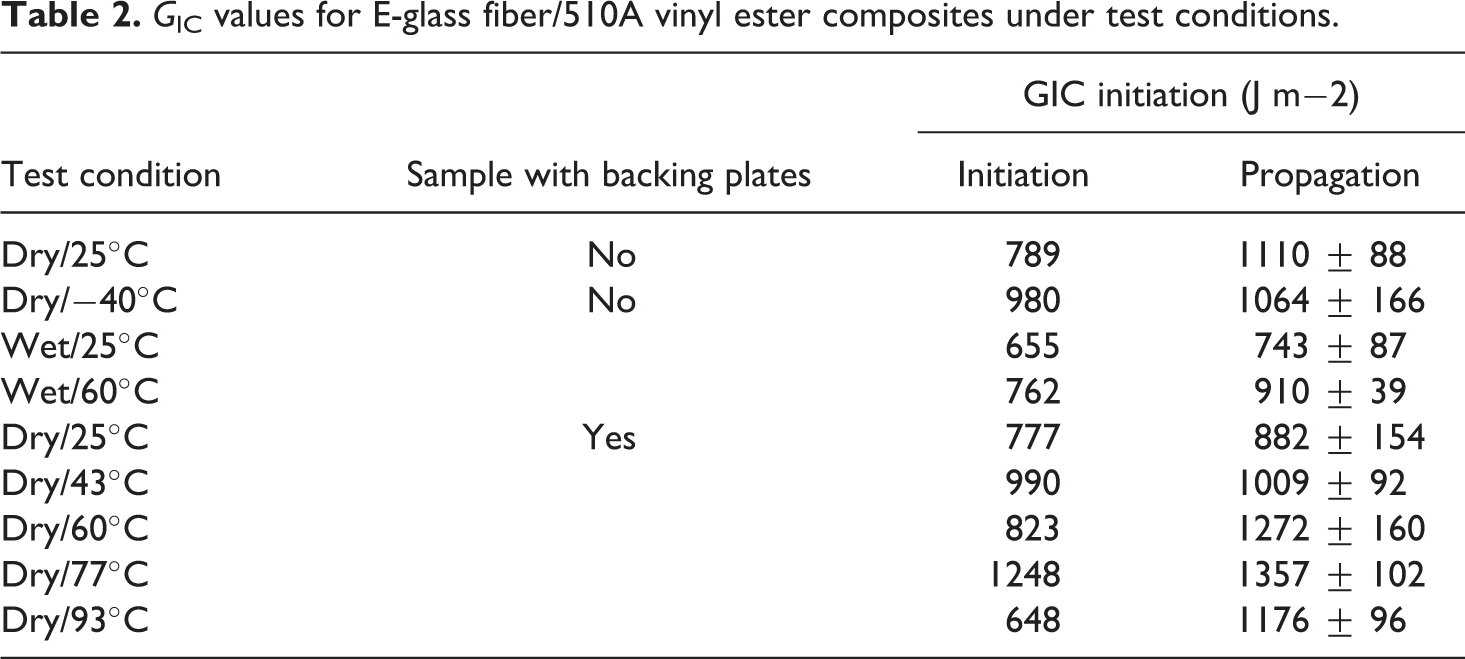
G IC values for E-glass fiber/510A vinyl ester composites under test conditions.
Fracture toughness under wet/RT and wet/hot conditions (groups 2 and 3)
For samples tested under wet/RT and wet/hot conditions, the real-time data of load and crack length were recorded, and the fracture toughness resistance curves were generated. The representative plots of load and crack length versus time are shown in Figure 11. From the generated fracture resistance curves (they are not shown), the average values of
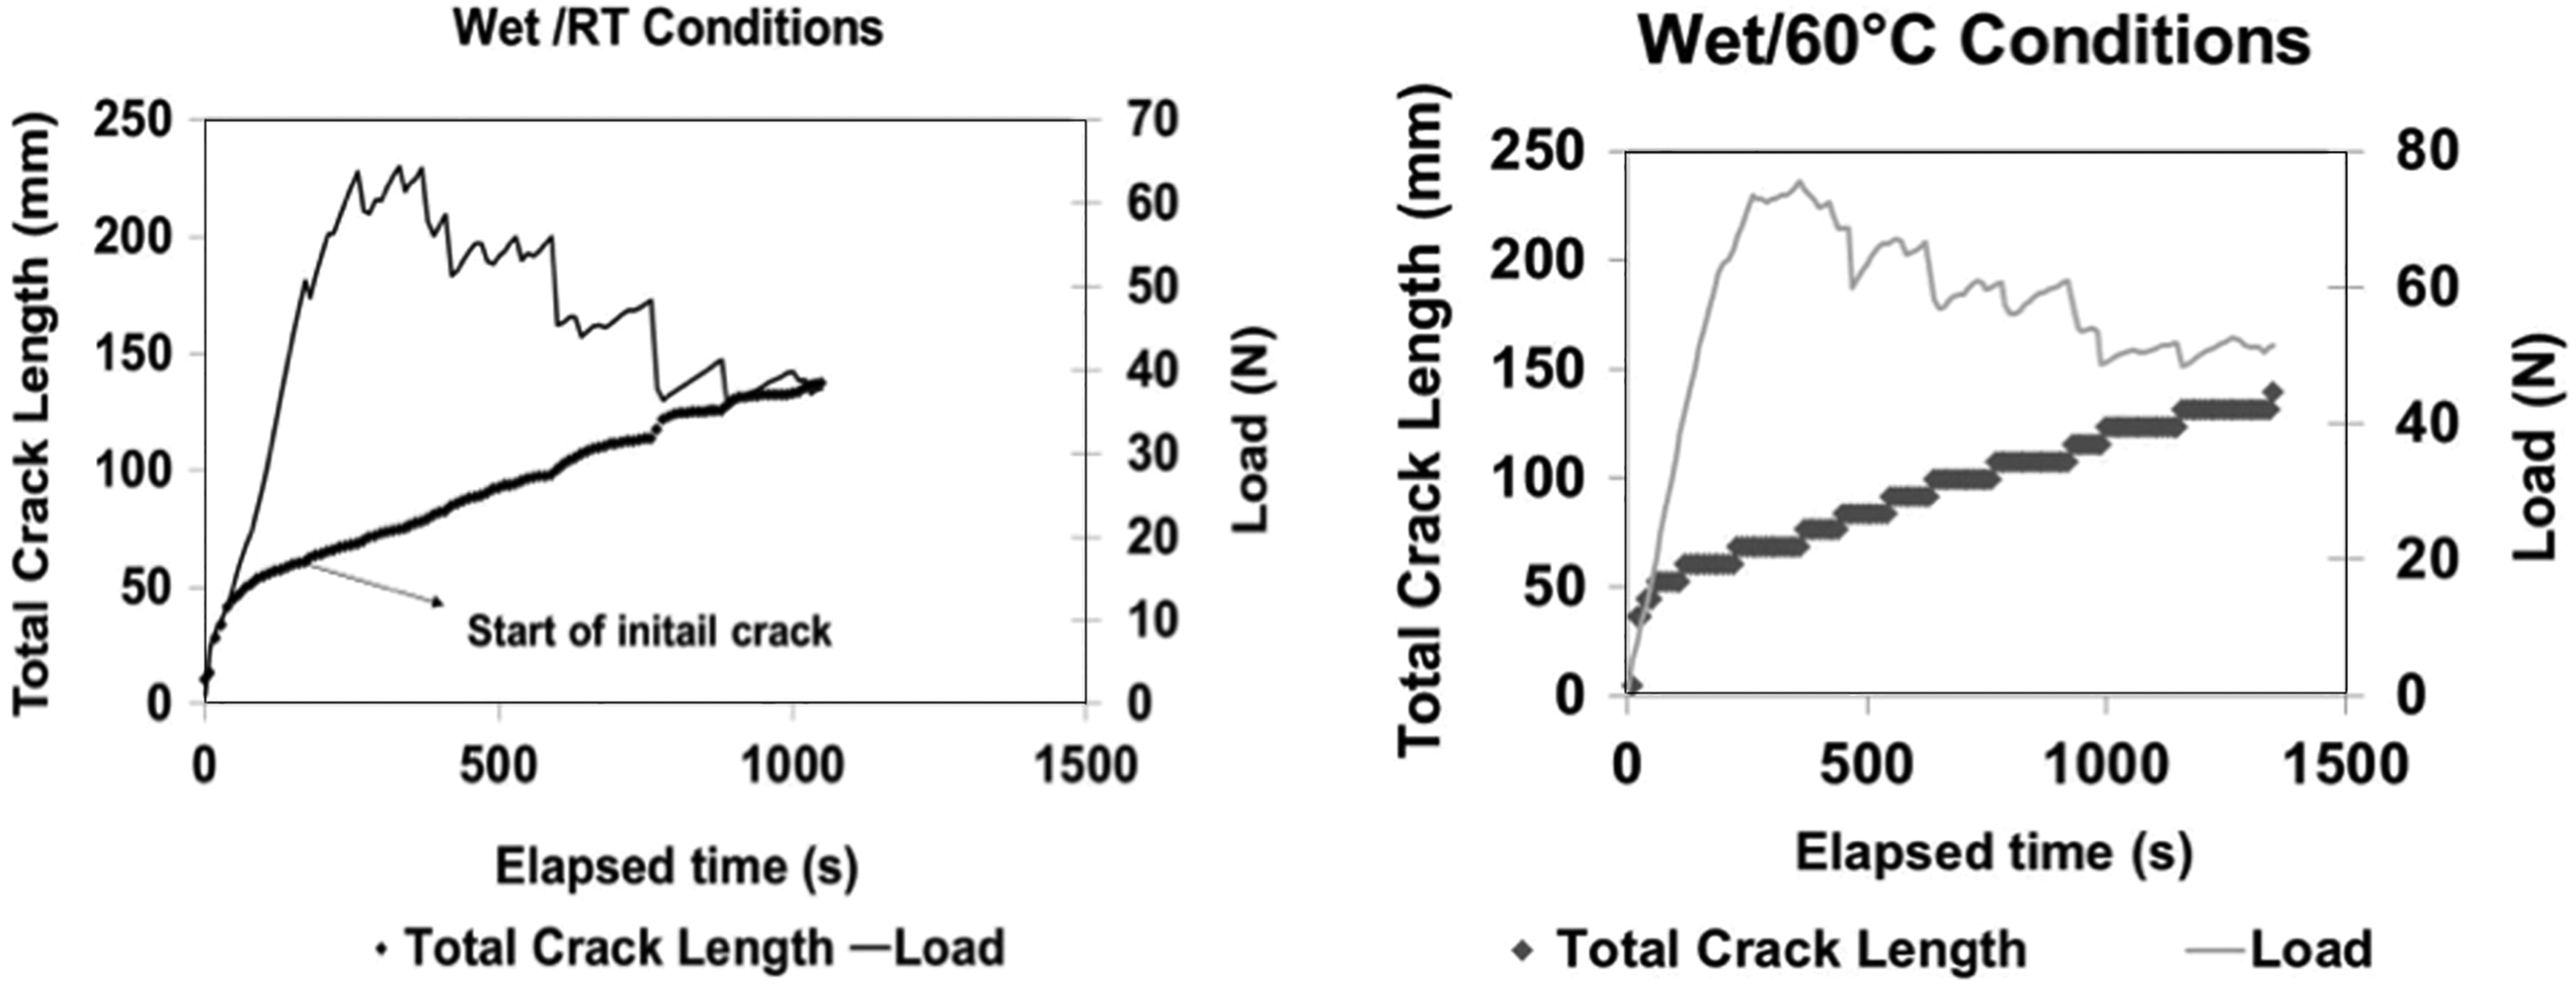
Representative real-time load and crack propagation length obtained under wet/RT (left) and wet/hot conditions (right). RT: room temperature.
Samples tested under wet/hot conditions show comparable G IC values to baseline samples and higher than those obtained for wet/RT samples, due to temperature-based softening of the vinyl ester. Fracture toughness behavior of the samples tested under wet/60°C conditions is controlled by competing mechanisms of long-term water diffusion into the composites that can reduce G IC values (as observed by wet/RT test results) and high-temperature softening of vinyl ester matrix increasing the G IC values (as observed by hot/dry test results in Table 2).
Fracture toughness under dry/hot conditions (group 4)
DCB samples of glass vinyl ester composites with stiffeners (backing plates) were tested at 25 (control samples), 43, 60, 77, and 94°C under dry condition. For each test, the real-time load, crack length, (see Figure 12) and fracture resistance curves were generated. From these data, the initiation and propagation values of
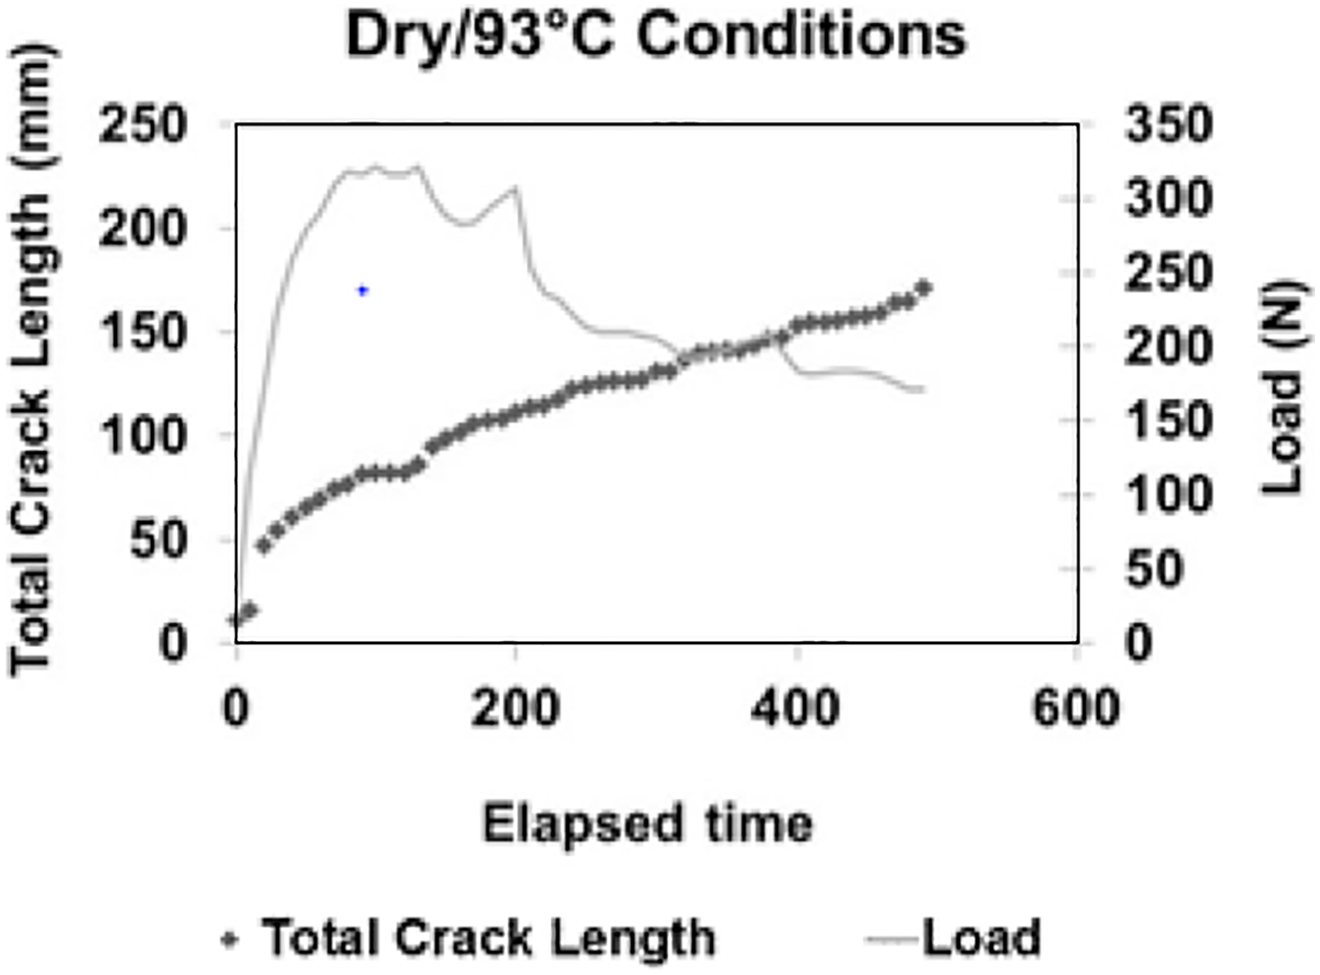
Representative real-time load and crack propagation length and their corresponding fracture resistance curve obtained under dry/hot (93°C).
Model-based parametric study
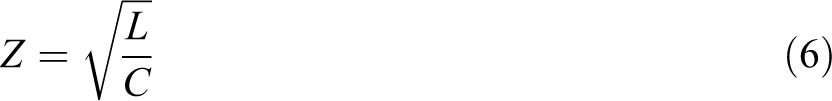
The main concern with conditioning of samples (heating/water submersion) is the effect on the dielectric properties of the material, which can affect the TDR signal. This model uses characteristic capacitance and inductance that can be related to the transmission impedance and propagation velocity according to Liao 16
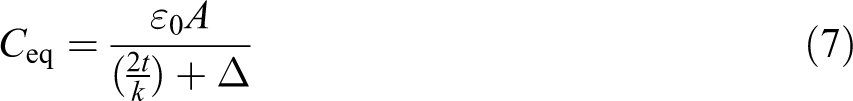
In this effort, the capacitance of the transmission line (TDR sensor) during cracking was calculated based on parallel-plate model (see Figure 13(a)). In this model, a glass fiber/vinyl ester composite with a dielectric constant (k) of 4.5 was assumed to be sandwiched between the transmission line (TDR sensor). The equivalent capacitance of the delaminated section of the samples during testing (crack propagating) can be presented by three capacitors in series as shown in Figure 13(a), and the equivalent capacitance can be calculated using the following equation:
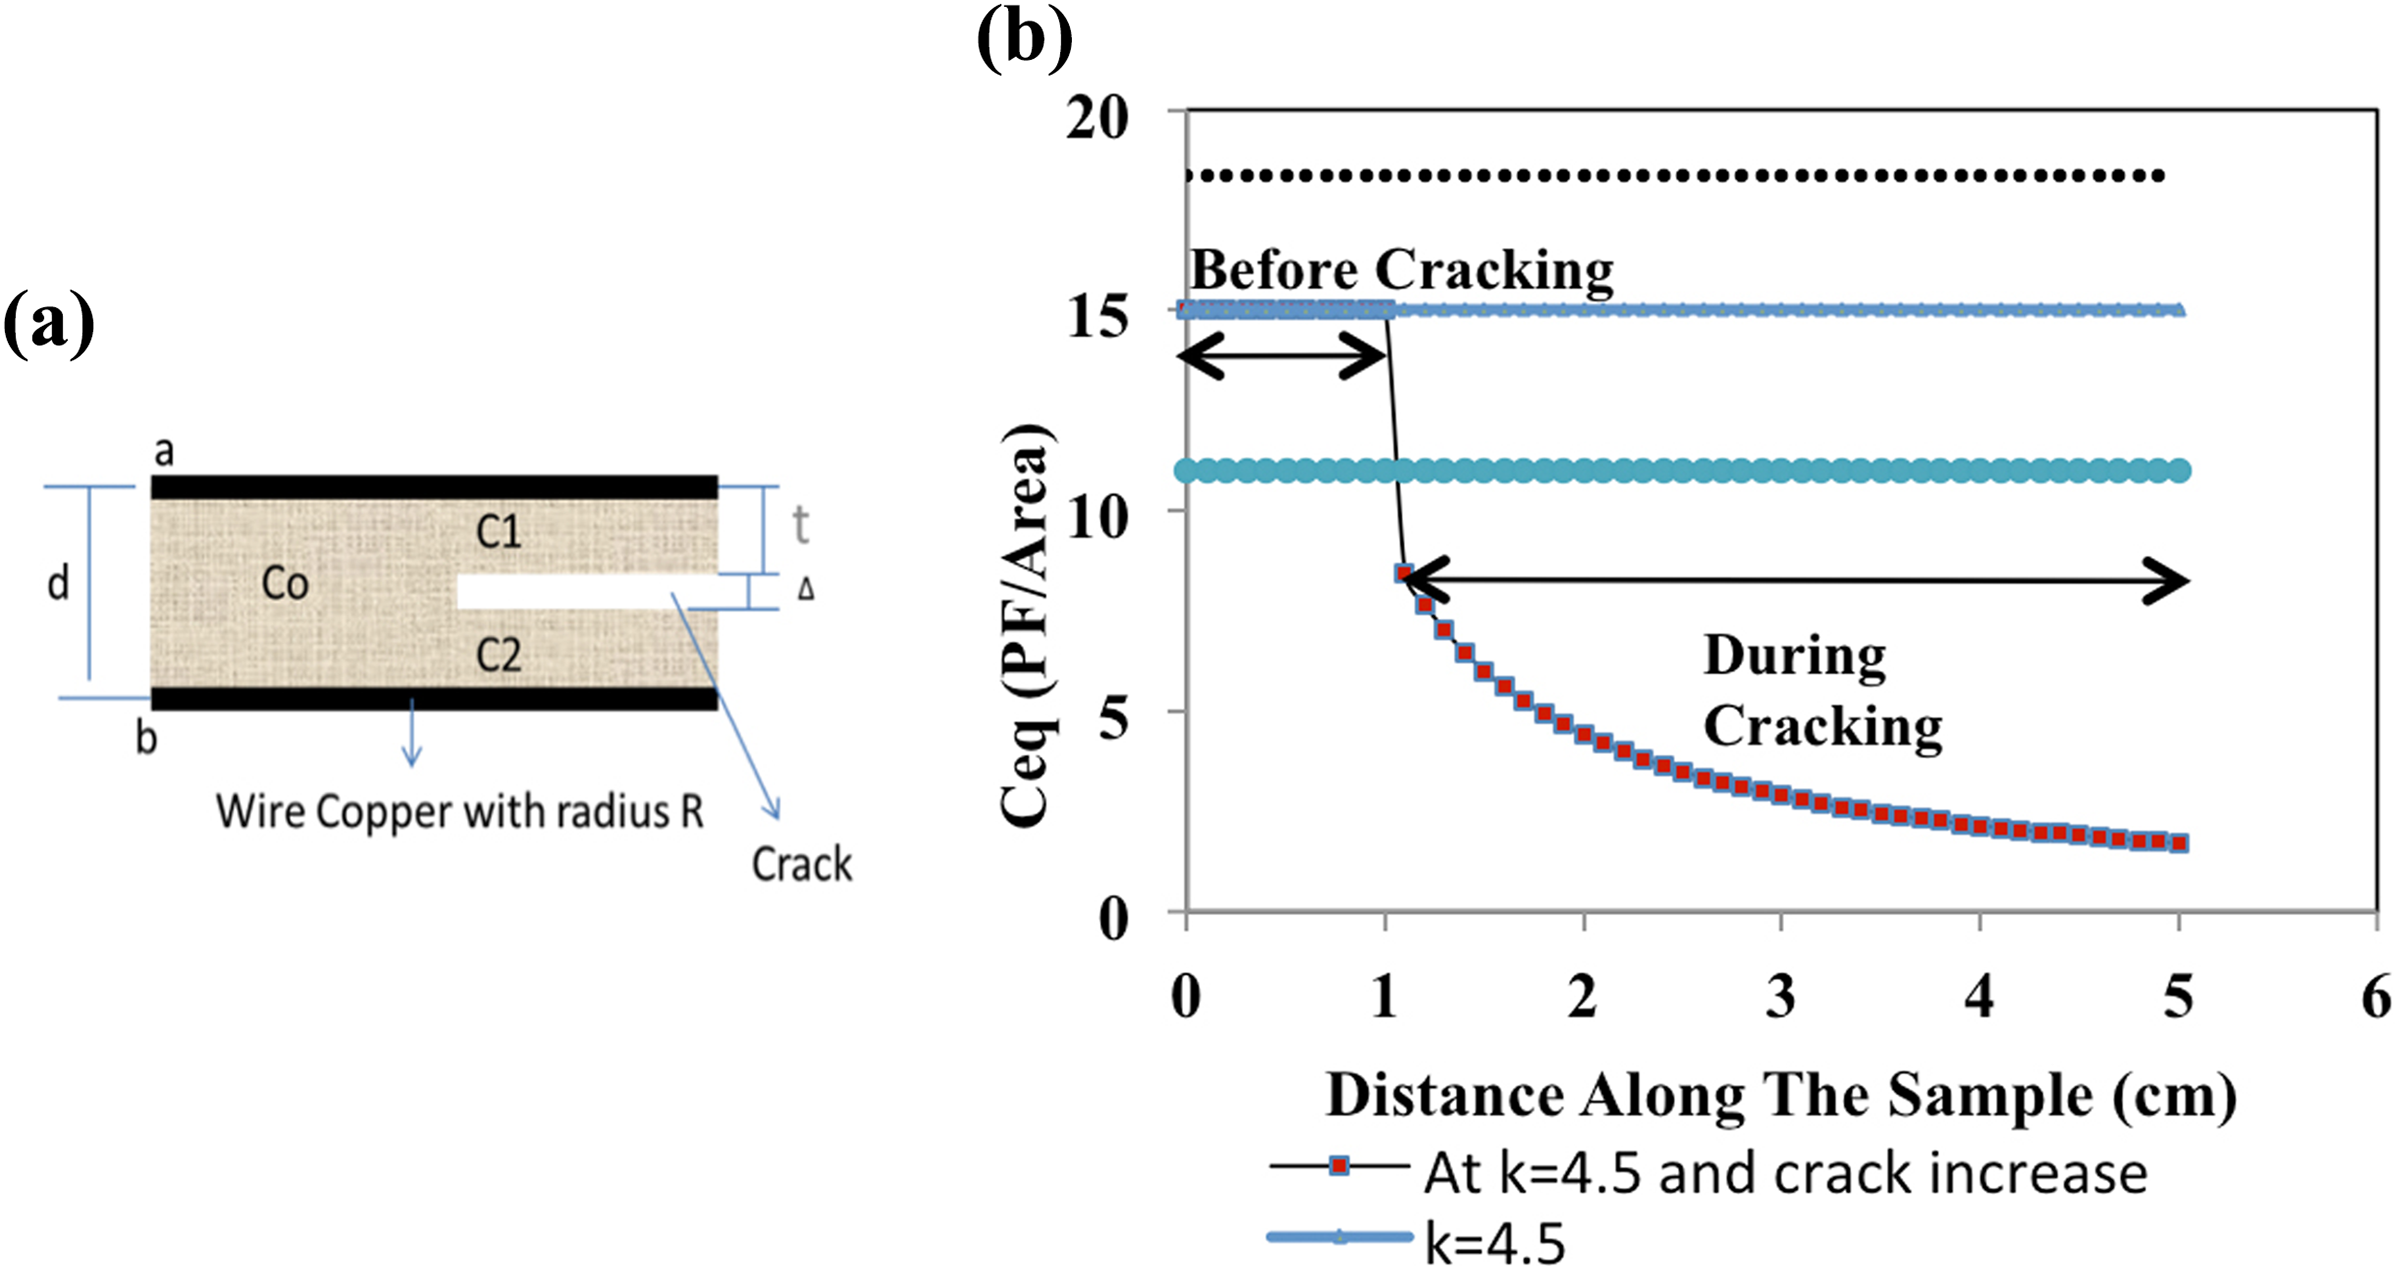
(a) Transmission line with composite material sandwiched between two parallel wires during DCB mode I loading and (b) equivalent capacitance at different dielectric constants and during crack advancing calculated based on two parallel plate systems (right). DCB: double cantilever beam.
where A is the area, t is the beam thickness, Δ is the gap due to crack propagation, and ε o is the electrical permittivity of free space.
Figure 13(b) shows the equivalent capacitance of the samples without crack propagation as a function of the distance along the sample (0 being the tip of the samples). For the sample without cracking, the capacitance remains constant for a given dielectric constant; the increase in the dielectric constant of 18% results in a 22% increase in the capacitance. A 29% decline in the dielectric constant reduces the capacitance by 27%. Figure 13(b) shows also that the capacitance remains constant for a given dielectric constant (k = 3.5, 4.5, 5.5). During cracking, the sample shows a nonlinear decreasing trend as the crack propagates through the sample. These changes in the capacitance induce also changes in the transmission impedance affecting the overall TDR signal performance (see equation (6)). The conditioning of samples can affect the dielectric constant, resulting in a change in the total capacitance of the system. The TDR-DCB sensor is designed to focus on local variation in properties (at the crack front) and global changes in properties do not affect its performance.
Summary and conclusions
TDR signal responses from TDR-DCB specimens made from glass/vinyl ester composites were measured under different environmental test conditions and compared to their baseline signals. Under cold (−40°C), dry/hot (25, 43, 60, 77, and 94°C), and wet conditions (wet/25°C and wet/60°C), TDR signals showed no significant changes with respect to their baseline RT signals. Small shifts in the signal were measured in the wet samples due to water uptake from conditioning changing the material dielectric properties but did not affect sensor response. Aluminum backing plates were used as stiffeners for testing in high-temperature environment to prevent the bending due to softening effects and had no measurable effect on the TDR signal.
Real-time TDR signals were measured during progress of crack propagation in the specimens under the different environmental conditions. Results showed that regardless of the type of test condition, the real-time TDR signal exhibits clear time shifts as the crack in the specimen propagates. Simplified capacitive models show that the local change in dielectric property due to a propagating crack front dominates the measured TDR response in all cases. Even with large changes in dielectric constant of the material, there is no effect on TDR sensor response as the change in material property is global, whereas the TDR response due to a propagating crack is a local effect.
G IC values for glass/vinyl ester were determined from real-time data of TDR signal, load, displacement, and crack length measured during the test. Overall, these results confirm the validity of automated TDR-DCB method for tracking the crack propagation under various environmental conditions.
Footnotes
Declaration of Conflicting Interests
The author(s) declared no potential conflicts of interest with respect to the research, authorship, and/or publication of this article.
Funding
The author(s) received no financial support for the research, authorship, and/or publication of this article.