
Abstract
This study extensively investigated the surface roughness of injection molded wood plastic composites (WPCs) produced from different amounts of wood flour, polymer matrix, mineral filler, and other additives. A larger range of roughness parameters that used in the previous literature were obtained from nine different WPC compositions by using a robust filtering method (robust Gaussian regression filter) to have a better understanding of the overlaying quality of the WPC samples. Three melt flow index (MFI) of the polymer were tested (MFI 3.6, 12, and 25). It was found that WPCs produced with the polypropylene having a MFI value of 25 were the smoothest. It was noticed that not only the wood flour percentage matters but the combination of wood flour–mineral filler was also important. The WPC compositions with lower polymer amount in favor of more wood flour and mineral filler led to rougher surfaces. A decrease of wood flour in favor of increasing the mineral filler participation percentage had a surface smoothing effect. At the same wood flour content, a decrease in polymer combined with an increase in mineral filler led to rougher WPC surface. Among the tested WPC compositions, the smoothest surface was obtained in the specimens produced from 50% wood flour, 0% mineral filler, and around 40% polymer by weight. The results should be helpful to anticipate the effect on surface roughness of the percentage participation for each amount of the wood or mineral filler, polymer matrix, and additives in further development of WPC combinations.
Introduction
Surface coatings and overlaying of wood-based composites such as particleboard and fiberboard are directly affected by surface quality. Surface roughness is one of the significant parameters affecting the surface quality of wood-based composites. 1 Wood plastic composites (WPCs) are gaining popularity in wood-based composite industry for nonstructural exterior applications including decking, fencing, siding, and paneling. The predominant technologies to produce WPCs are extrusion to obtain endless profiles (more than 90%) and injection molding leading to three-dimensional (3-D) forms. While extrusion methods create lineal elements, injection molding produces 3-D parts and components. The unique shapes and profiles that can be created with injection molding provide the potential for diversifying from the current WPC markets, which are mainly furniture, consumer goods, and electrical/electronics products industries.
When WPC is used as substrate for liquid coatings or thin overlays for indoor and outdoor applications, their surface properties play an important role in determining quality of final product. Finishing properties of WPCs are mainly dependent upon the properties of the raw materials such as polymer and wood flour content and characteristics, and manufacturing parameters. For the direct painting, the surfaces of WPCs have to be smooth, stable, and not highly absorbent. Therefore, it is important to quantify surface roughness of the panel to have a better overlaying of WPC. Previous studies reported that surface roughness of WPCs was significantly affected by the type and ratio of the thermoplastic, wood, and additives. 2 –6 However, evaluation of surface roughness in case of wood or any wood-based composite requires a special consideration. It was found that general standard requirements followed by the vast majority of researchers, more likely valid for homogeneous materials as metals, are not applicable for wood. 7 –10
The inherent wood anatomy is a source of bias, from the selection of the measuring instrument to the evaluation of measured data. 8,11,12 The most important biasing effect of wood anatomy is caused during the filtering of the roughness (short wavelength irregularities) data from waviness (long wavelength irregularities). Most common filters such as the simple Gaussian filter from ISO 11562, 13 now replaced by ISO 16610-21 14 and ISO 13565-1, 15 cause a distortion known as “push-up,” 8,12 which makes the result of filtering unreliable. The artificial “push-up” occurs in case the surface contains isolated deep valleys or high peaks, both type of irregularities being common when wood is used as such or in wood-based composites. However, a robust Gaussian regression filter (RGRF; ISO/TS 16610-31 16 ) was found robust and recommended for wood surfaces. The robust filter was tested on wood surfaces since it was a draft version and found useful. 1,9,11,12 More recently, these findings have also been confirmed by Tan et al. 10 and Piratelli-Filho et al. 17 If the RGRF works well on wood surfaces, can work reliably for any surface that contains wood ingredients (wood fibers, wood chips, wood flour), which all may be a source of bias and distortion during filtering with the common simple Gaussian filter. Furthermore, researchers generally have used a limited number of roughness parameters, from the ones available in the standards, to evaluate the surface quality, such as Ra 18,19 or Rq 20 or a combination of Ra and Rz. 2,3,6 However, these parameters cannot give a complete picture and interpretation of the surface status. A thorough understanding of the surface condition is needed, especially for composite materials where wood is used in combination with other materials and so introducing a degree of unevenness. Gurau et al. 21 interpreted a range of profile roughness parameters from ISO 4287 22 and ISO 13565-2 23 when applied to wood and found that apart from Ra or Rz, parameters as Rq, Rt, Rsk, and Rku (from ISO 4287) as well as Rk, Rpk, and Rvk (from ISO 13565-2) gave refined information about the presence of deep valleys, accidental gaps in the surface, and surface fuzziness outlying from a core roughness. The usefulness of some shape parameters such as Rsk and Rku for evaluating the WPC surfaces was also acknowledged by Hutyrová et. al. 24 Therefore, in this study, a large number of surface roughness parameters were used from roughness profiles obtained after robust filtering with RGRF of the injection molded WPCs produced from different amounts of the filler, polymer matrix, and additives to have a better understanding of the overlaying quality of the WPC samples.
Experimental details
Materials
Virgin polypropylene (PP) granulates were used as polymer matrix in the production of thermoplastic composites. The density and melt flow index (MFI; 230°C/2.16 kg) of the PP were 0.904 g/cm3 and 12 g/10 min, respectively. Pine wood (Pinus sylvestris) chips without bark were grinded in the grinder and then sieved to obtain wood flour of 0.25 mm size. The wood flour was dried in a laboratory oven with a fan at 100°C for 24 h to the moisture content of 0–0.5% before the manufacturing process. The particle size of the mineral filler (calcite) was 0.15 mm. The amounts of compatibilizing agent, maleic anhydride modified homopolymer PP, mineral filler, wax, ultraviolet (UV) absorber, zinc borate, antioxidant, and color pigment are given in Table 1. Nine different raw material formulations were selected in a broad spectrum based on commercial formulations of WPC injection molding for different applications.
Experimental design.
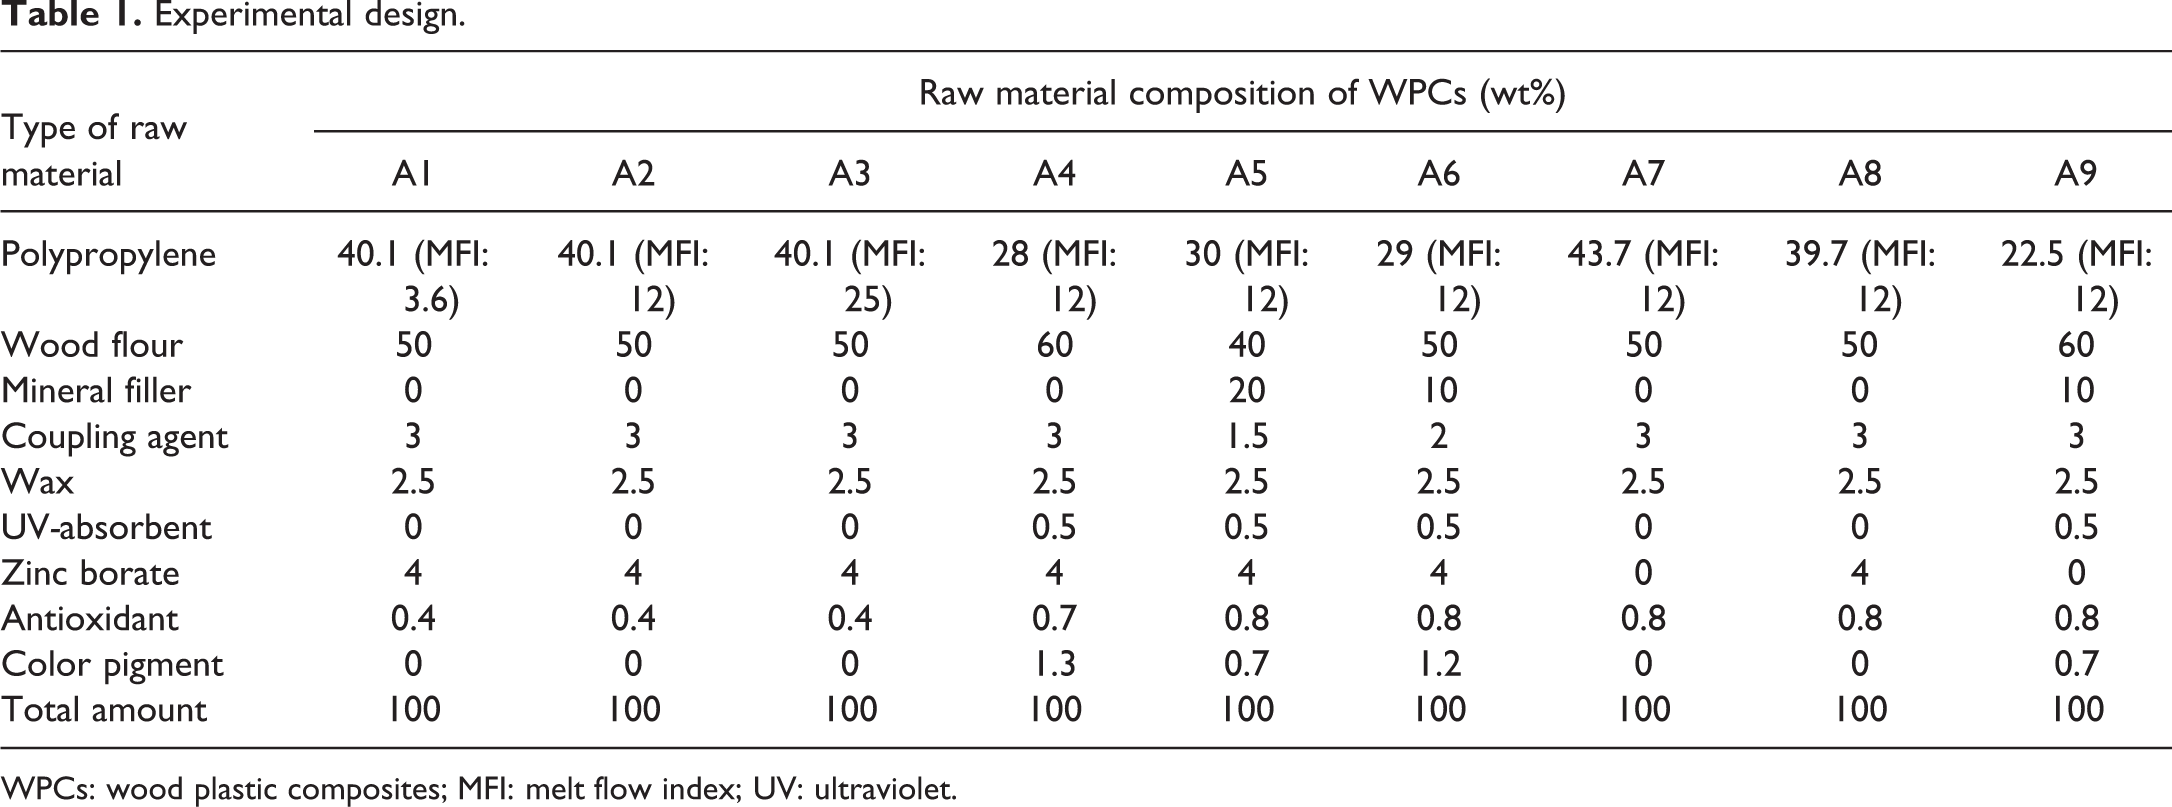
WPCs: wood plastic composites; MFI: melt flow index; UV: ultraviolet.
Preparation of injection molded WPC composites
The oven-dried wood flour and mineral filler with a moisture content of less than 0.5 wt%, PP granulates, and other additives were weighed for each formulation according to Table 1. All the materials were then dry blended in a drum type mixer for 5 min before the extrusion. Following the pre-mixture, all the materials were compounded with a corotating twin-screw extruder (L/D: 38) having a barrel temperature ranging from 175°C (feeding zone) to 185°C (the die zone), at a screw speed of 60 r/min. The compounded materials were cooled down by carrying them through water and pelletized. The pellets were then dried in an oven at 90°C for 24 h before the injection molding process. Finally, the pellets were directly injection molded to produce test specimens using an injection molding machine. The barrel temperature of the injection molding machine was controlled between 160°C and 190°C at 6 MPa injection pressure. The specimens were conditioned at a temperature of 23°C and relative humidity of 50% until a constant mass was reached according to ISO 291. 25 The density values of the composites ranged from 1.05 to 1.11 g/cm3. The experimental design is given in Table 1.
Method
A surface roughness methodology for measuring and evaluation of surface data proposed by Gurau et al. 26 was used in this research. The methodology was born from previous research experience, which indicated a stylus instrument as reliable for wood surfaces. The measurements were performed on the WPC surfaces by using a MarSurf XT20 instrument manufactured by Mahr GmbH, Göttingen, Germany, endowed with a scanning head MFW 250 with tracing arm in the range of ±500 μm and a stylus with 2 μm tip radius and 90° tip angle, which measured the specimens at a speed of 0.5 mm/s and at a low scanning force of 0.7 mN. The instrument had MARWIN XR20 software installed for processing the measured data.
The surface roughness measuring lengths of WPC’s were generally rather short: 4 mm 27 or 12.5 mm. 2,3,5 However, in this research, the specimens (four replicates for each WPC combination) were scanned on tracing lengths of 50 mm, because longer tracing length gave more accurate results. 26 Four profiles were recorded for each specimen, two on each specimen face, so that a total of 16 profiles were available for further evaluation of parameters for each WPC combination. The profiles were measured in areas which displayed, as much as possible, homogeneity of the mixture. The lateral measuring resolution was set for 1 μm (50,000 data points), so that any variation in surface irregularities could be detected with accuracy. The instrument provided a vertical resolution of 7 nm.
The measured data were processed with the built-in software of the instrument. First, the software removed the form error and after that, the waviness. The roughness profiles were obtained by filtering each profile by using the robust filter RGRF contained in ISO 16610-31 16 and recommended in the methodology from Gurau et al. 26 The cutoff used was 2.5 mm as recommended in previous research of Gurau et al. 9,26 and also used by various researchers specifically on WPC surfaces. 2,3,24
A range of roughness parameters were calculated directly on the evaluation lengths, such as Ra (mean parameters: the arithmetic mean of the absolute ordinate values), Rq (the root mean square value of the ordinate values), Rt (the total height of roughness profile calculated as the sum of the maximum profile peak height and the largest absolute value profile valley depth), Rsk (skewness calculated as the quotient of Rq cubed and the mean of the cubed ordinate values), Rku (kurtosis calculated as the quotient of Rq and the mean of the ordinate values to the fourth power) from ISO 4287 22 and Rk (the core roughness), Rpk (the reduced peak height, which is the average height of the protruding peaks above the roughness core profile), Rvk (the reduced valley depth, which represents the average depth of the profile valleys projecting through the roughness core profile) from ISO 13565-2. 23 The sum Rk + Rpk + Rvk was also determined for comparisons, because of the parameters’ cumulative effect on surface roughness.
Mean parameters Ra and Rq are common roughness indicators, but alone, they do not provide sufficient information about wood surface topography. Rt is a parameter sensitive to the occurrence of high isolated peaks. Rsk and Rku are very sensitive to isolated extreme irregularities, which are not clearly detected by Ra or Rq. Rsk is a measure of the asymmetry of the amplitude density function and is a nondimensional parameter. It is strongly influenced by isolated peaks or isolated valleys. Surfaces with a positive skewness, Rsk > 0, have fairly high peaks that protrude above a smoother plateau. Surfaces with a negative skewness, Rsk < 0, have fairly deep valleys in a smoother plateau. More random surfaces have skewness around zero indicating that the points are evenly distributed around the mean.
Rku is a measure of the sharpness of the amplitude density function and is a nondimensional parameter. If it is strongly influenced by isolated peaks or isolated valleys, which lead to a high kurtosis (Rku > 3) in a data set, the probability density function tends to have a distinct peak around the mean, then declines rather rapidly.
Rk is a parameter which characterizes the depth of the roughness profile excluding protruding peaks and deep valleys. It corresponds to the highest concentration of datapoints and usually characterizes a processing process. 12 Rpk and Rvk give information about datapoints located outside the core range and correspond to amplitudes defined outside the core by isolated peaks, respectively valleys. In combination with parameters from ISO 4287, 22 these Abbot-curve parameters offer a better understanding of the irregularities distribution along a measured profile and are a useful tool for comparisons between different surfaces. A mean value of roughness parameters and standard deviations were determined for each WPC combination.
Individual profiles of WPC combinations were also separately examined by using MathCad 2000 Professional @1986-1999 MathSoft Inc. from original measured data saved as ASCII (text) files. This allowed a visual comparison of the magnitude of irregularities between WPC compositions. The highest concentration of datapoints corresponding to the core data was separated with upper and lower thresholds from outlying peaks and valleys in the profiles with a method described in detail by Gurau et al. 28 as in Figures 7 and 8. The core data should represent the effect of manufacturing the WPC composite as a mixture of materials and is characterized by the highest concentration of roughness datapoints above and below a reference line (zero line), which is generated by standard filtering. 9 Datapoints above or below the core roughness delimited zone depict isolated features as peaks or valleys occurring less frequent on the surface in comparison with datapoints from the core. For example, the addition of wood, as heterogeneous material, to WPC can add isolated valleys extending below the core roughness attributed to the anatomical cavities. The addition of wood to WPC composites may also be responsible for isolated peaks caused by the increased amount of the wood fibers.
Results and discussion
The results of the surface roughness measurements are presented in Table 2 and from Figures 1 to 10. A1, A2, and A3 had an identical composition, except for the MFI values. As for the MFI of the PP, the lowest Ra value (1.5 μm) was found in the WPCs produced with the PP having a MFI value of 25 (Table 2; Figure 1). The WPCs produced with the PP having the MFI values of 3.6 and 12 had the same Ra value (1.6 μm; Table 2). The fluidity of polymers increased with increasing MFI value. This resulted in better penetrating the wood cell cavities, which improved the surface smoothness of WPC measured not only by Ra and Rq parameters but also by the core roughness parameter Rk (Figure 2) and the composed parameter Rk + Rpk + Rvk (Table 2), which gradually decreased from MFI 3.6 to MFI 25. An increased fluidity of the polymer in wood cavities is also proved by a gradual increase in negative Rsk in favor of valleys extending in isolation below the core roughness (Figure 3). Similarly, Rku increased as a result of more isolated valleys occurring while the polymer became more fluid (Table 2). It can be remarked that roughness parameters for A1, A2, and A3 compositions in Table 2 were very similar and indicated the smoothest WPC surfaces together with A7 and A8 compositions. Analysis of variance (ANOVA) test (p < 0.05) confirmed that there were insignificant differences between the roughness parameters of these three groups (A1, A2, and A3). These groups of specimens also had the smallest Rpk values among all WPC combinations (Table 2; Figure 4). Rpk is responsible for the irregularities occurring above the core roughness, Rk. Furthermore, the standard deviation values for some of the most representative roughness parameters: Ra, Rq, Rk, Rk + Rpk + Rpk were the smallest among all WPC combinations (Table 2). From the compositions of A1, A2, and A3, A2 were compared with the other compositions, because the MFI of the polymer was the same, respectively MFI 12.
Mean values of roughness parameters (μm) for WPC composites made with different material ratios.a
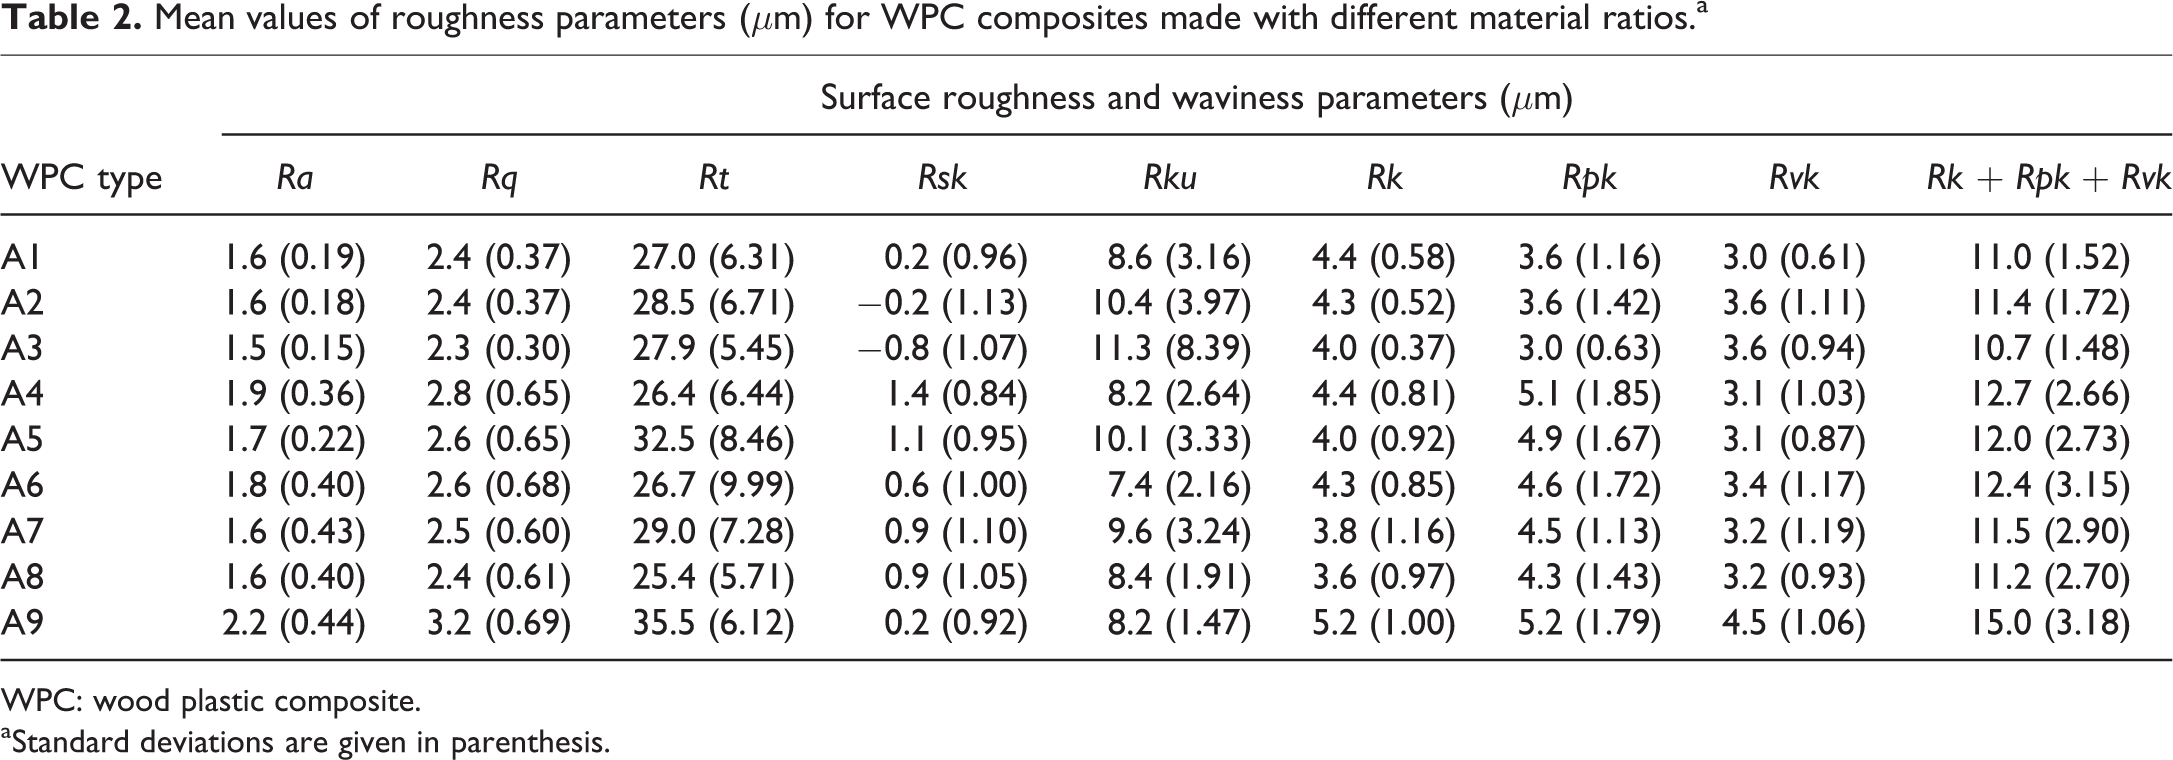
WPC: wood plastic composite.
aStandard deviations are given in parenthesis.
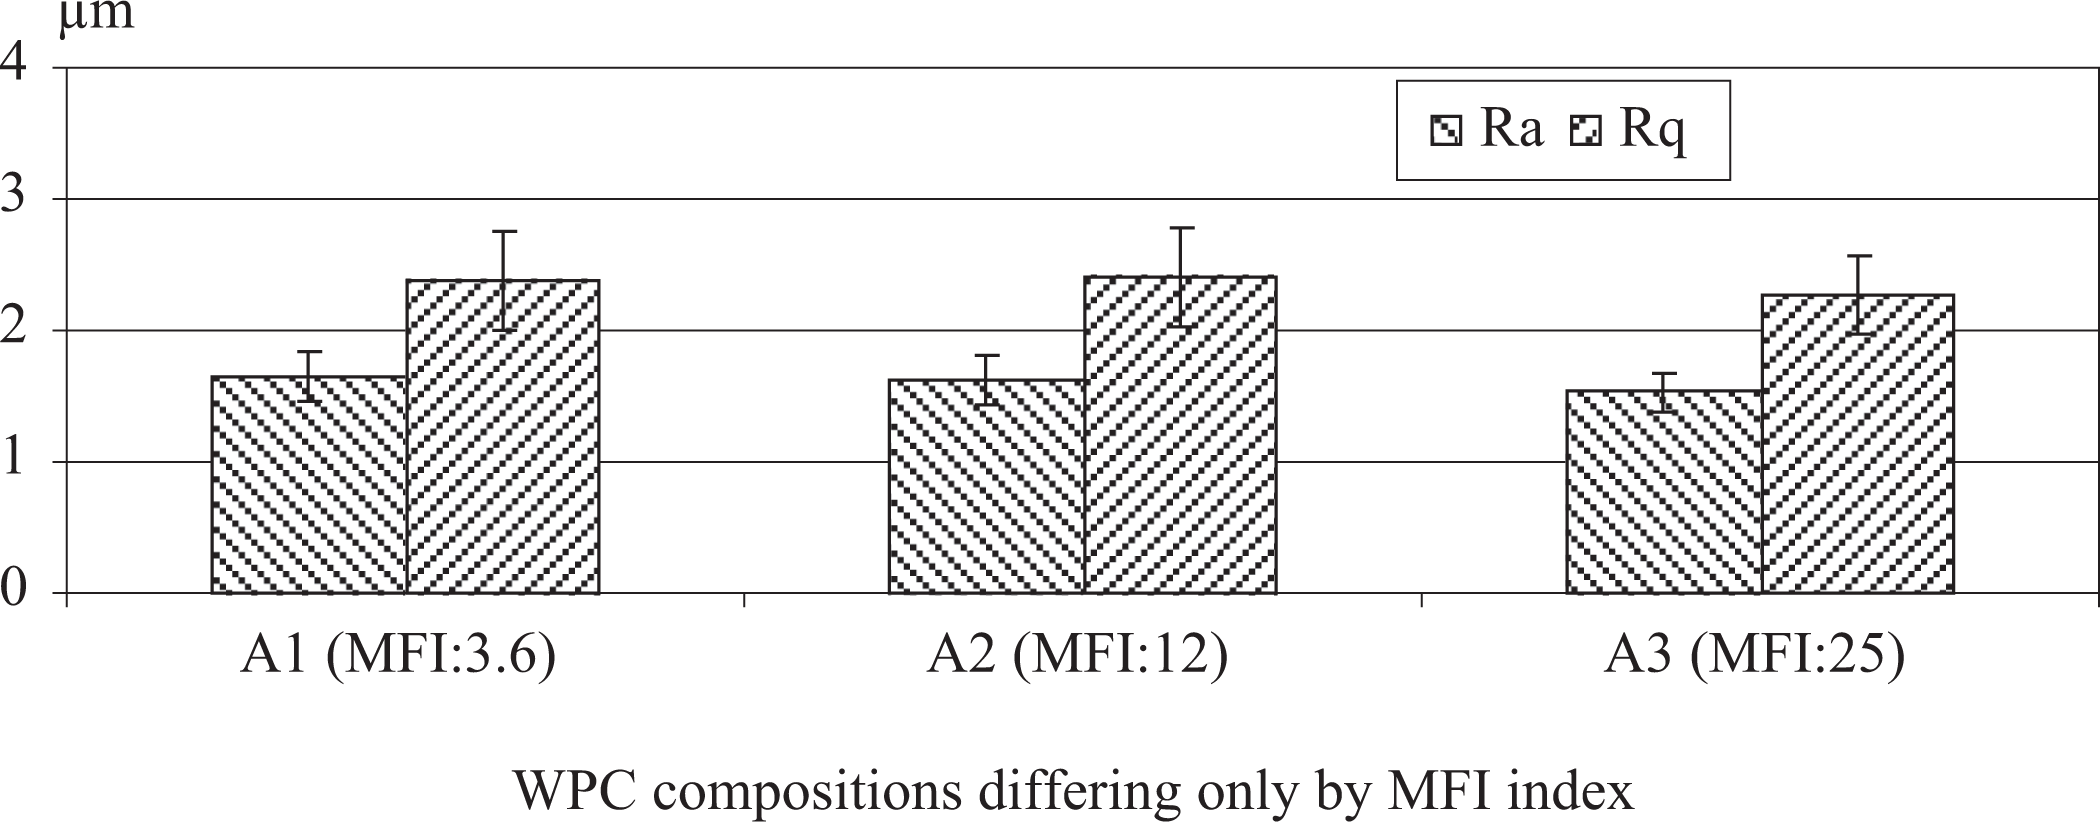
Variation of roughness parameters Ra and Rq (mean values and standard deviations) with the MFI of the WPC composition.
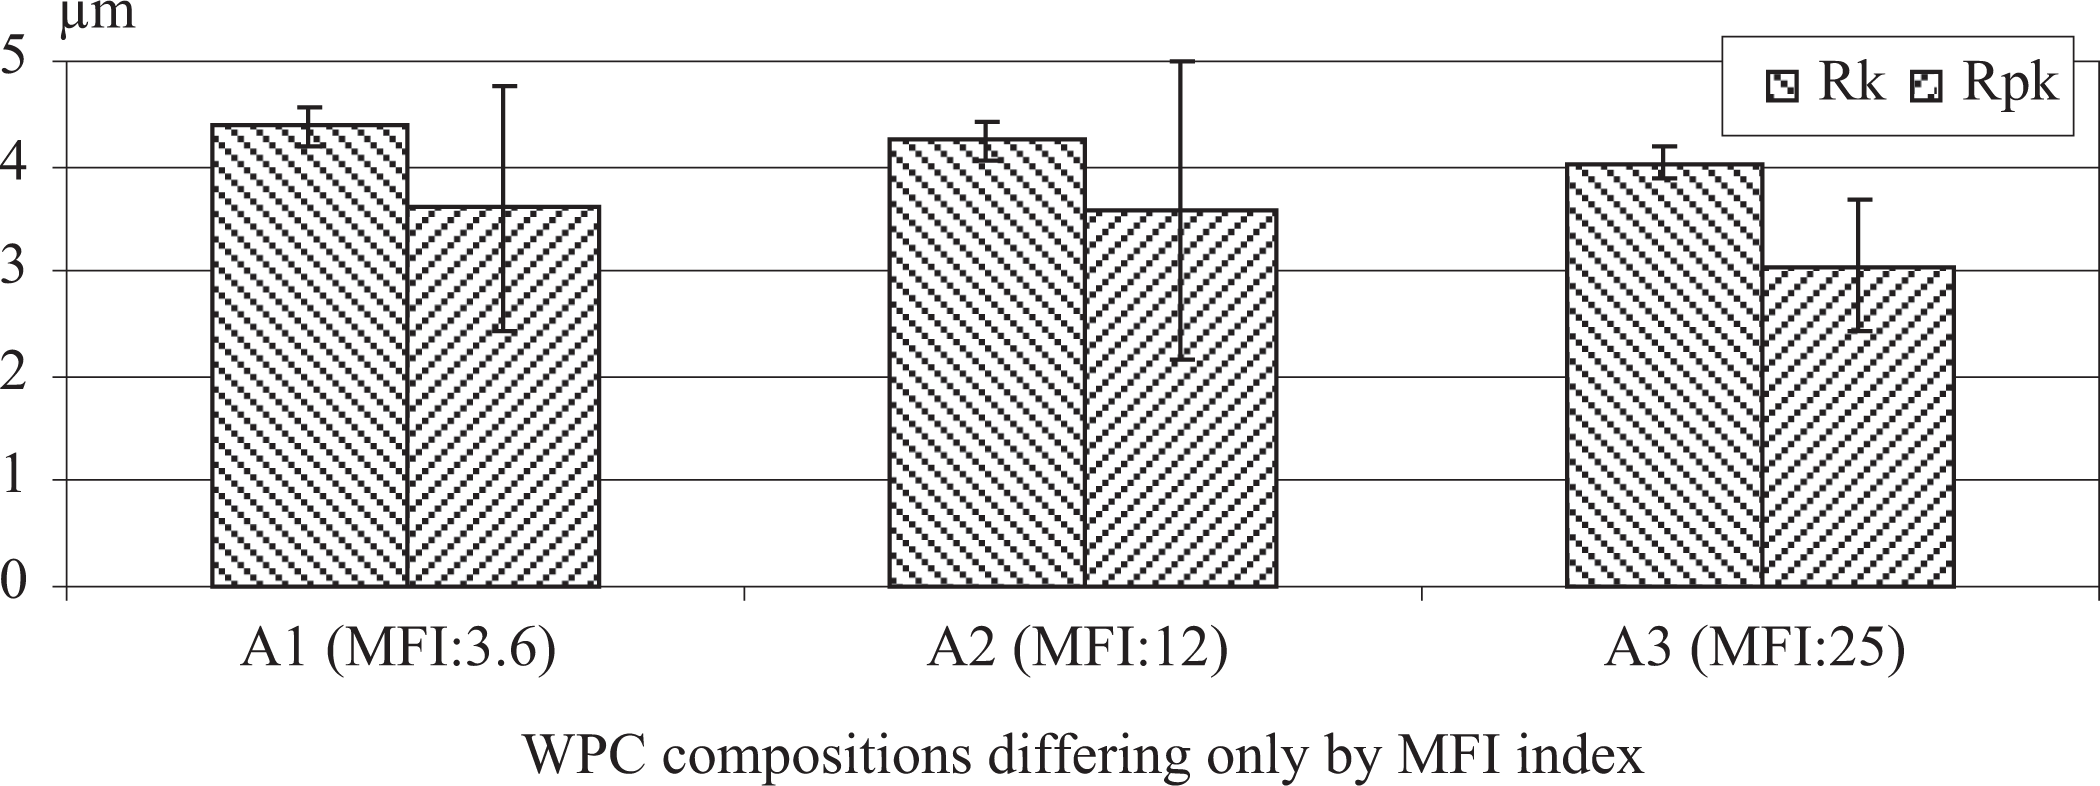
Variation of roughness parameters Rk and Rpk (mean values and standard deviations) with the MFI of the WPC composition.
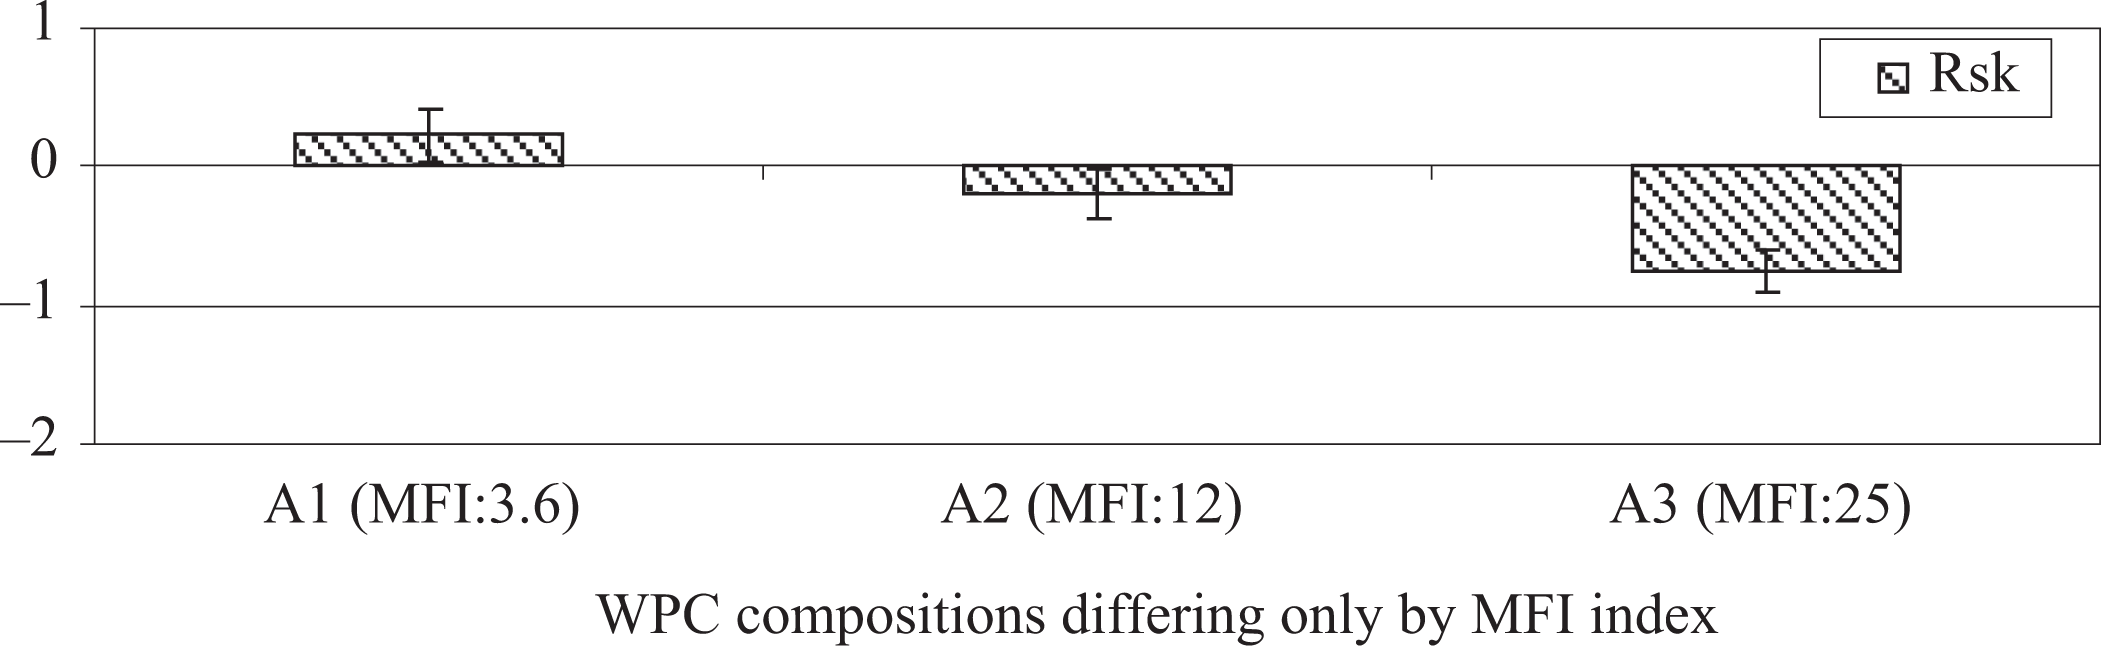
Variation of roughness parameter Rsk (mean values and standard deviations) with the MFI of the WPC composition.
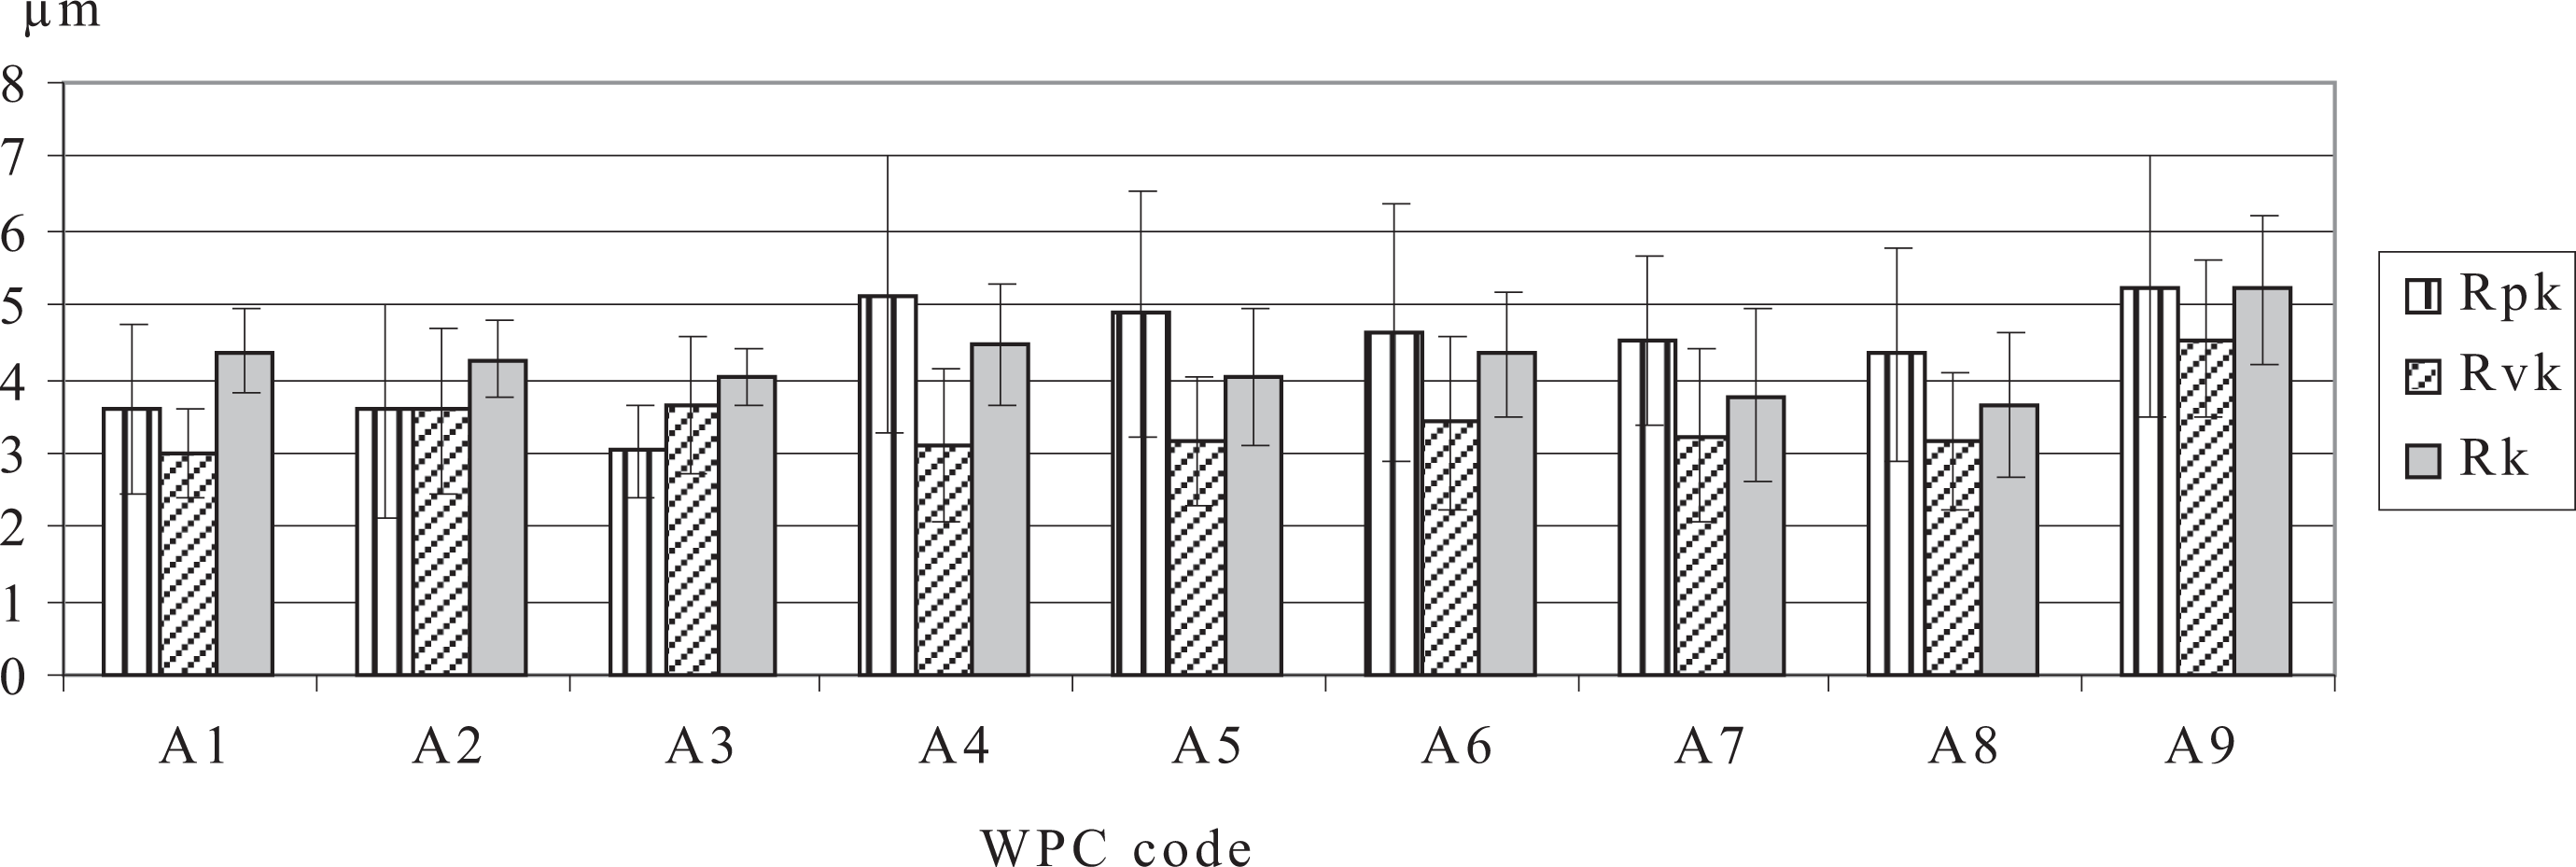
Variation of roughness parameters Rpk, Rvk, and Rk (mean values and standard deviations) with the WPC composition.
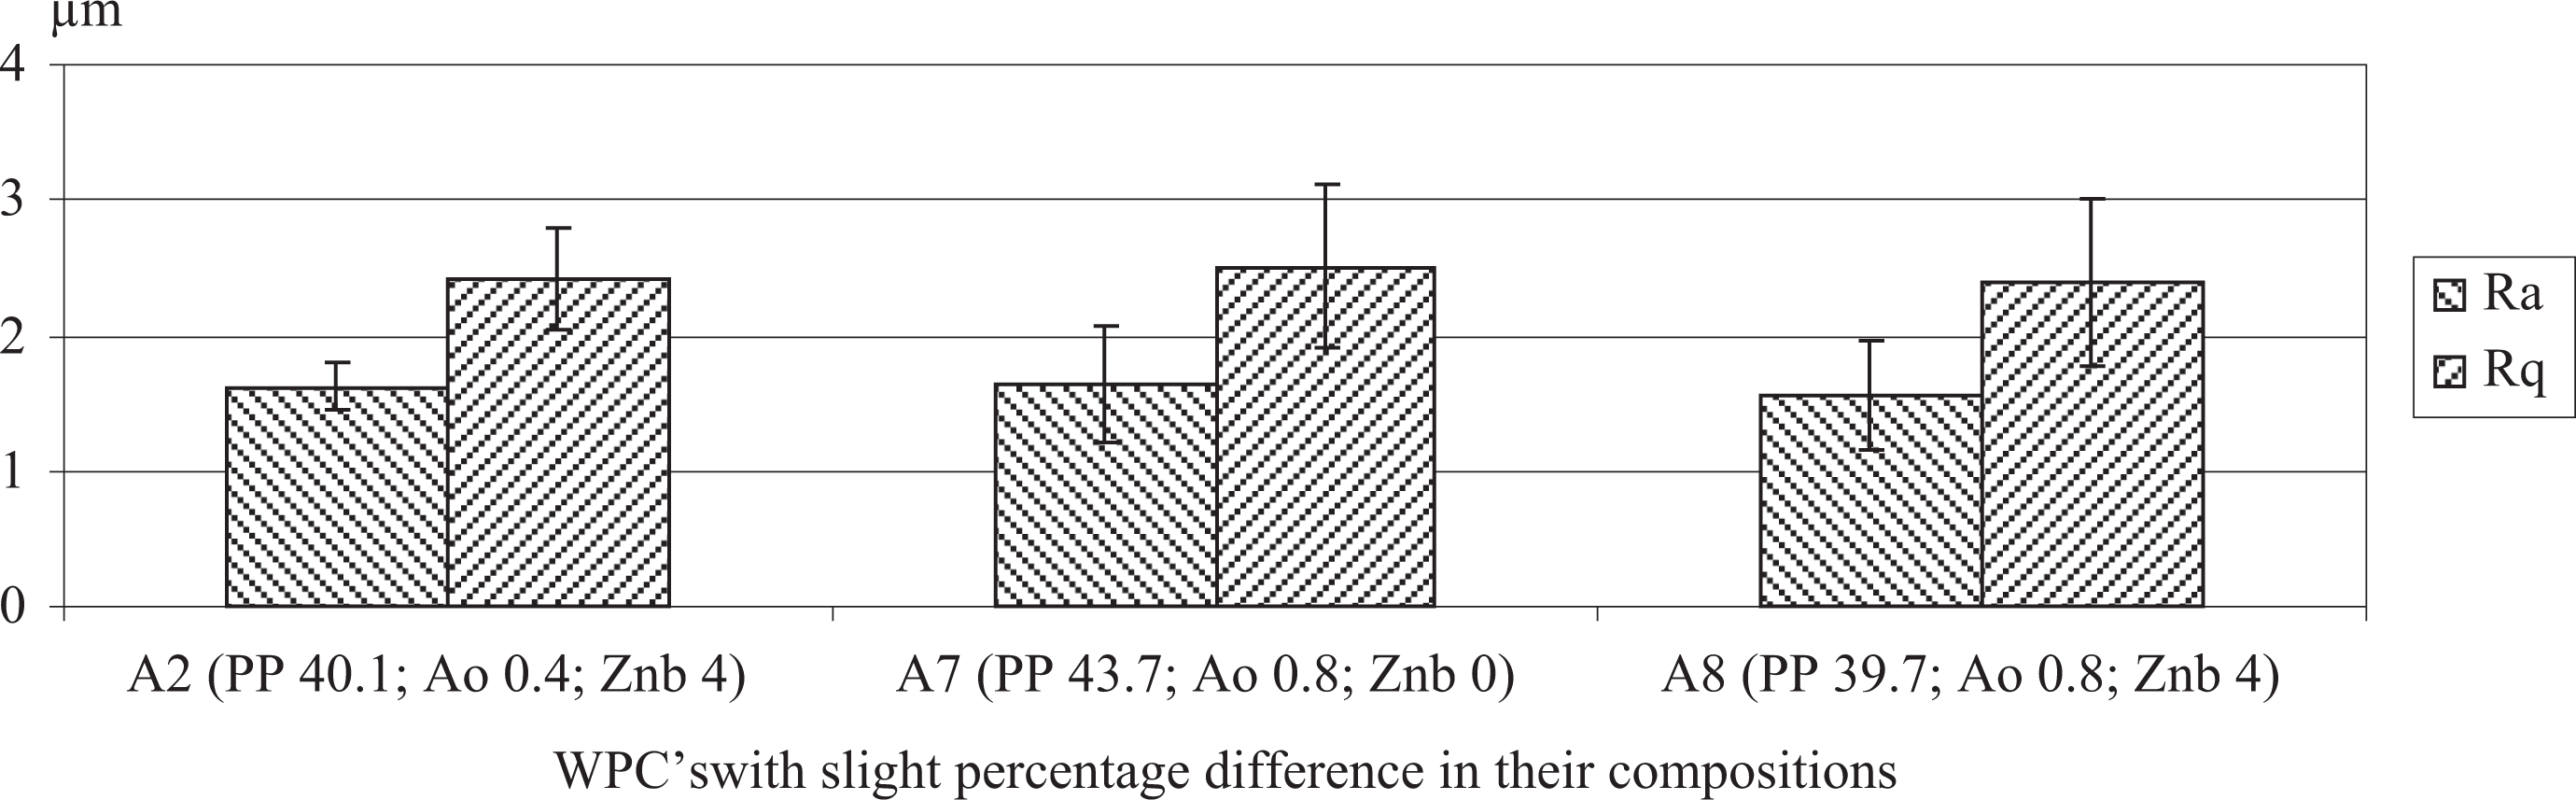
Comparison of WPC surface quality measured by Ra and Rq for similar compositions differing slightly in PP, antioxidant, and Zn borate content.
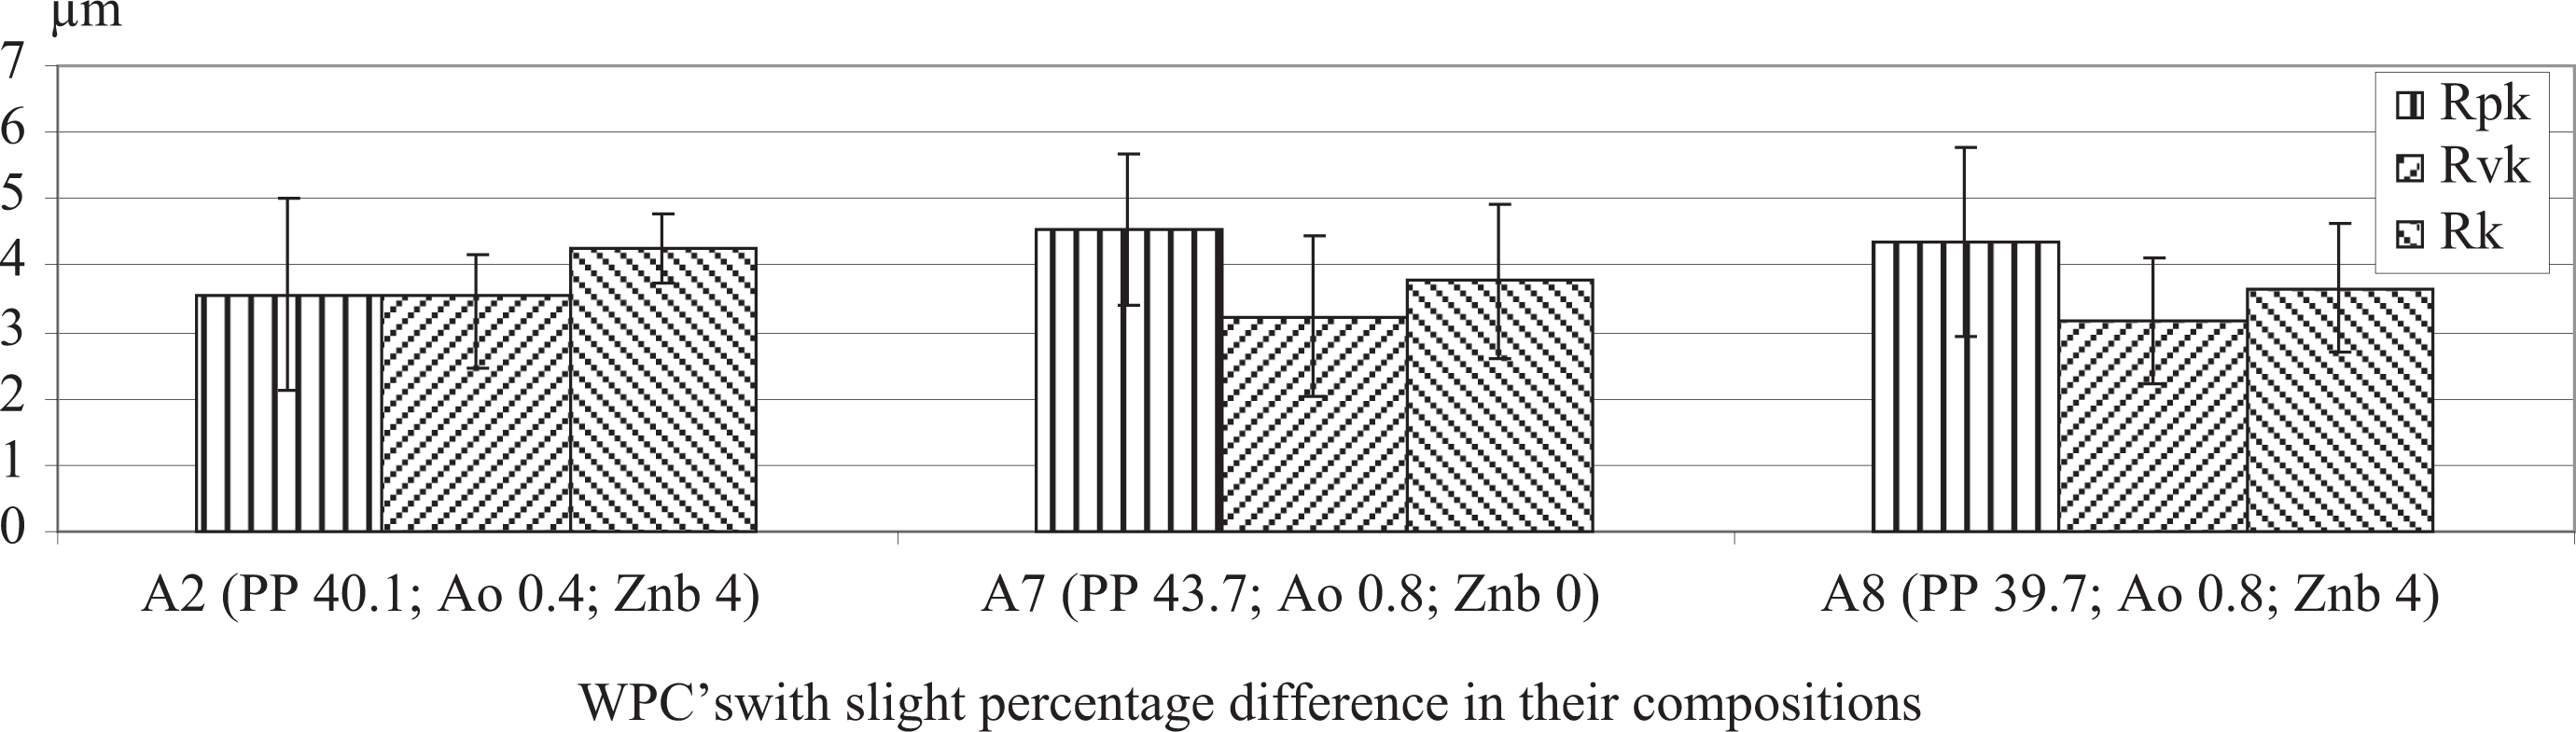
Comparison of WPC surface quality measured by Rpk, Rvk, and Rk for similar compositions differing slightly in PP, antioxidant and Zn borate content.
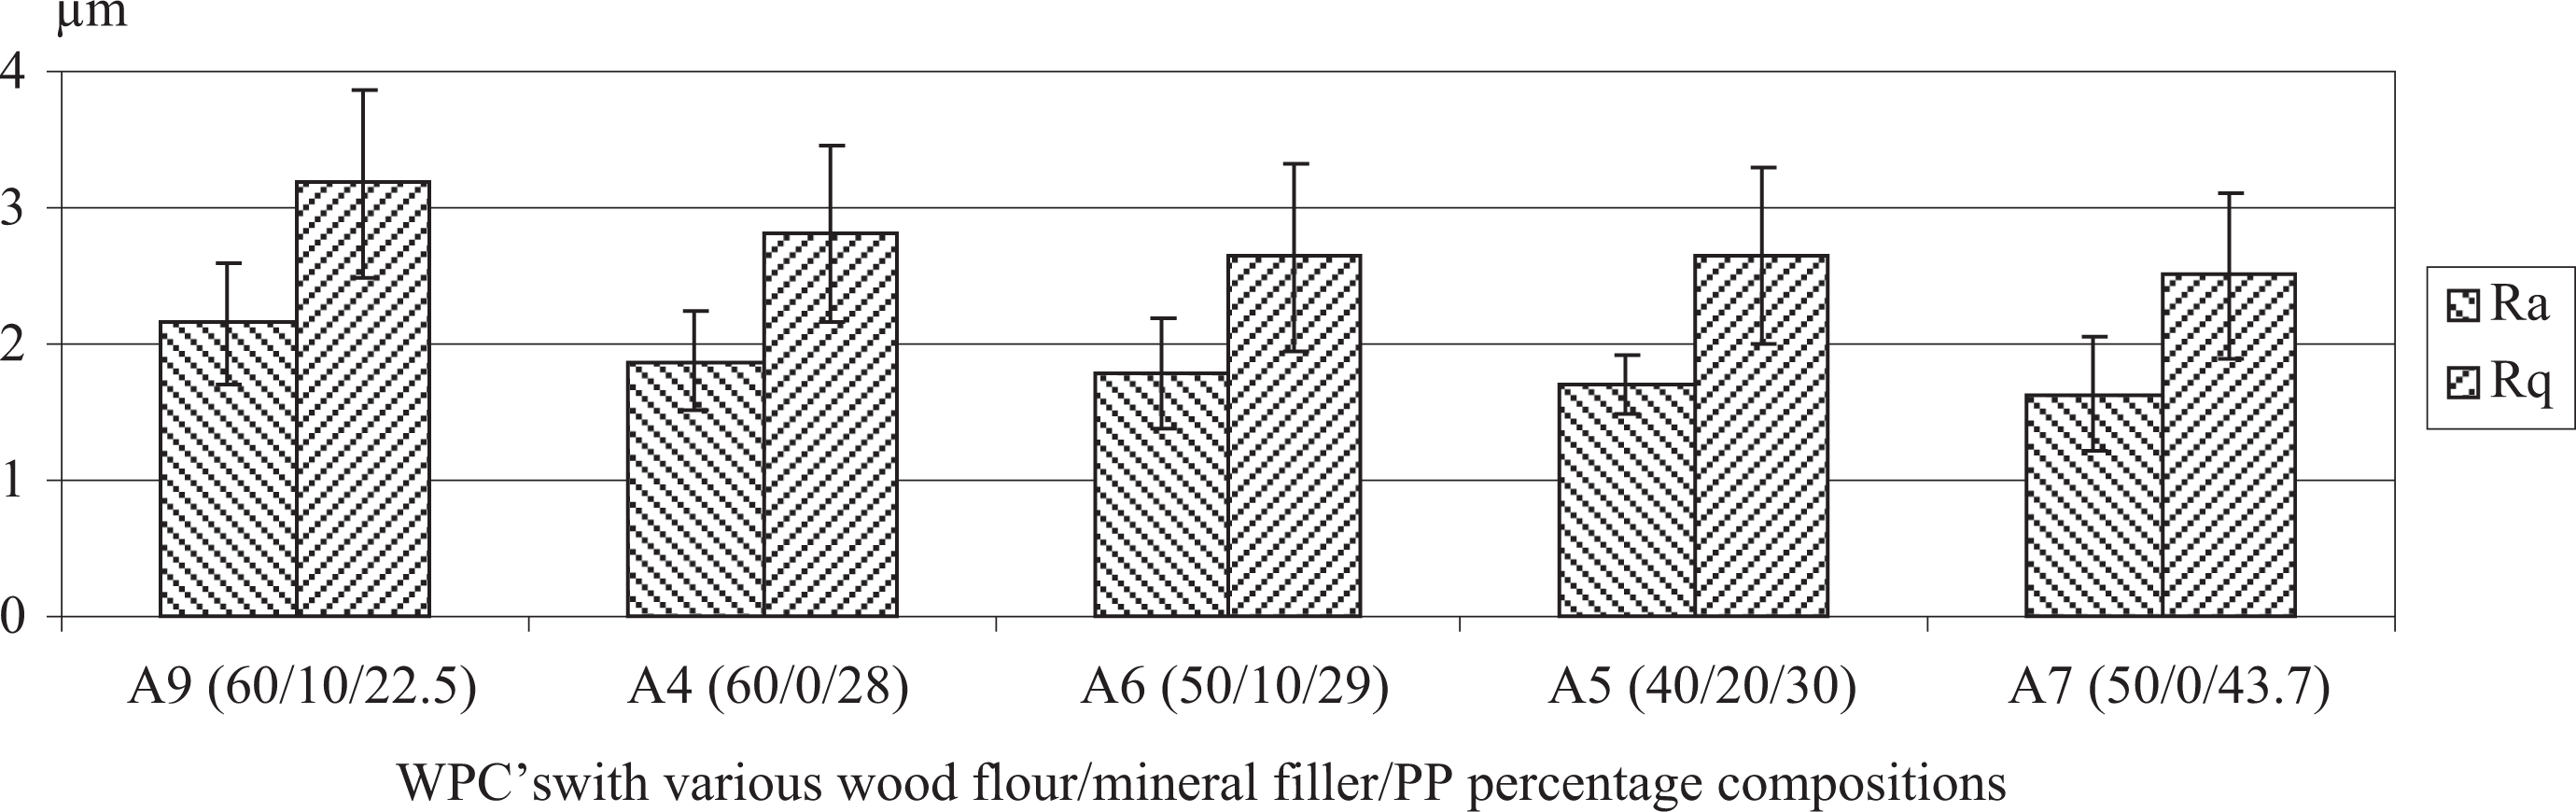
Comparison of WPC surface quality measured by Ra and Rq for compositions with various wood flour/mineral filler/PP percentage compositions.
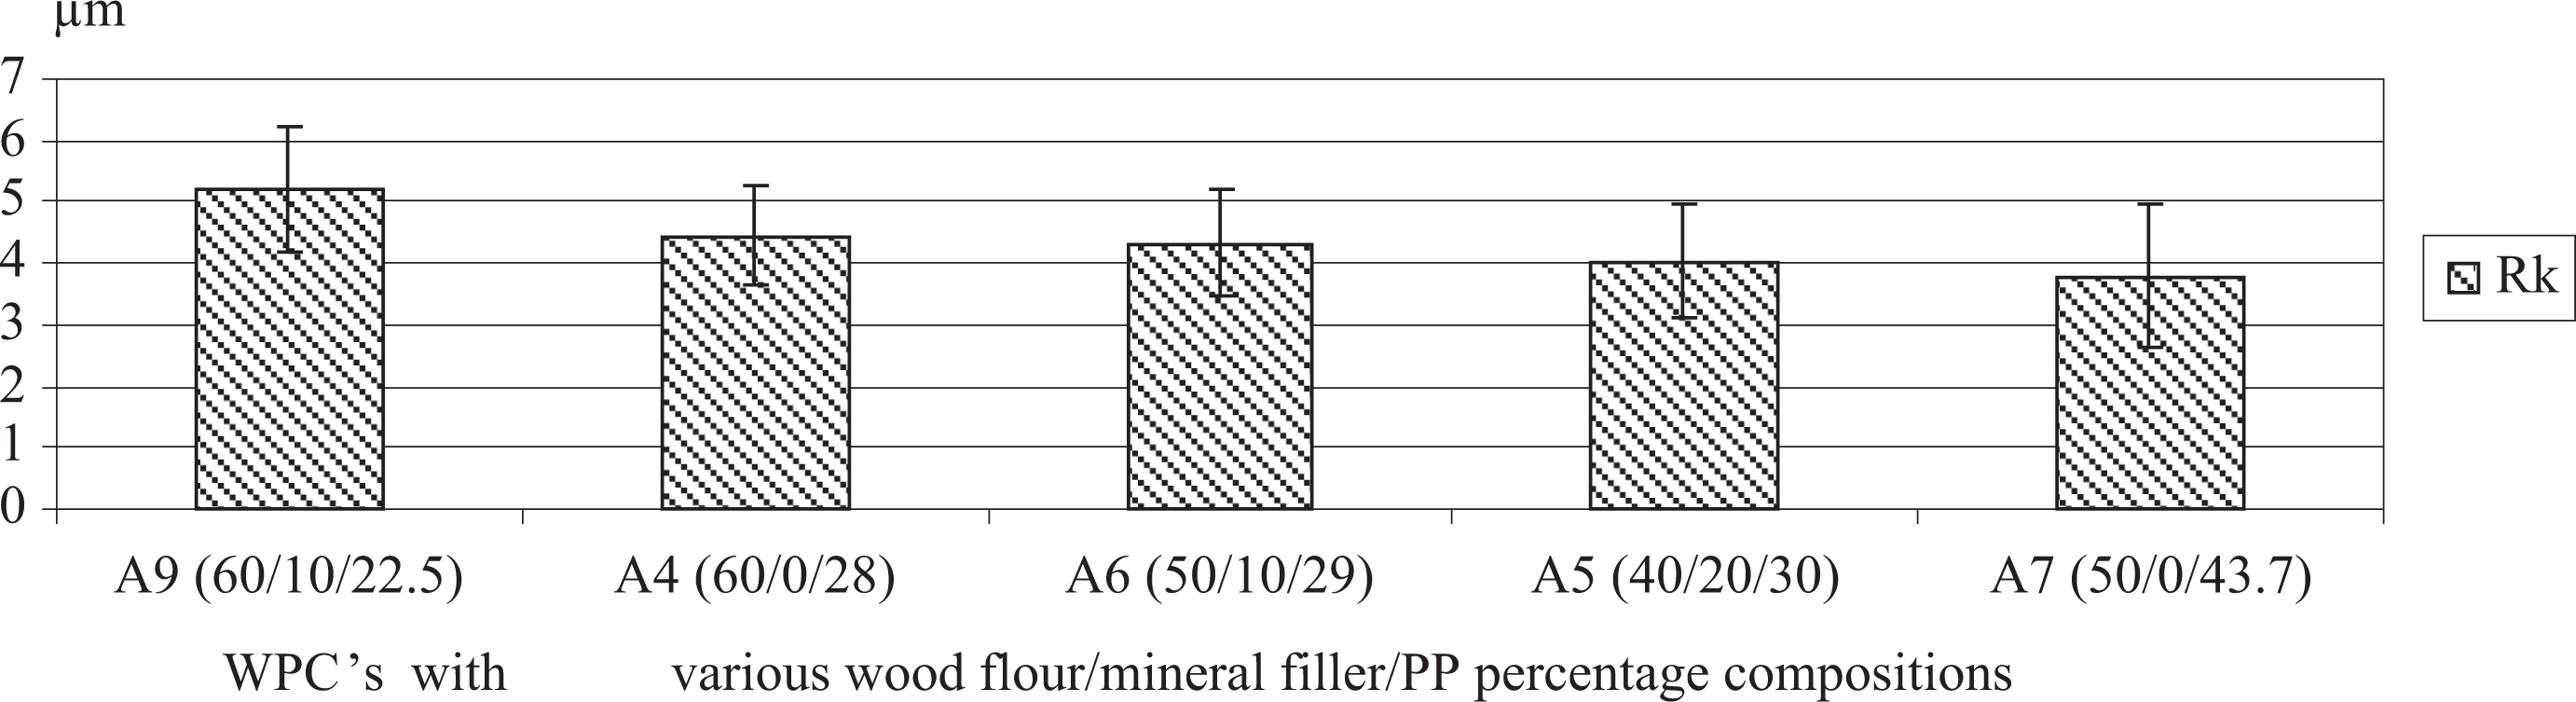
Comparison of WPC surface quality measured by Rk for compositions with various wood flour/mineral filler/PP percentage compositions.
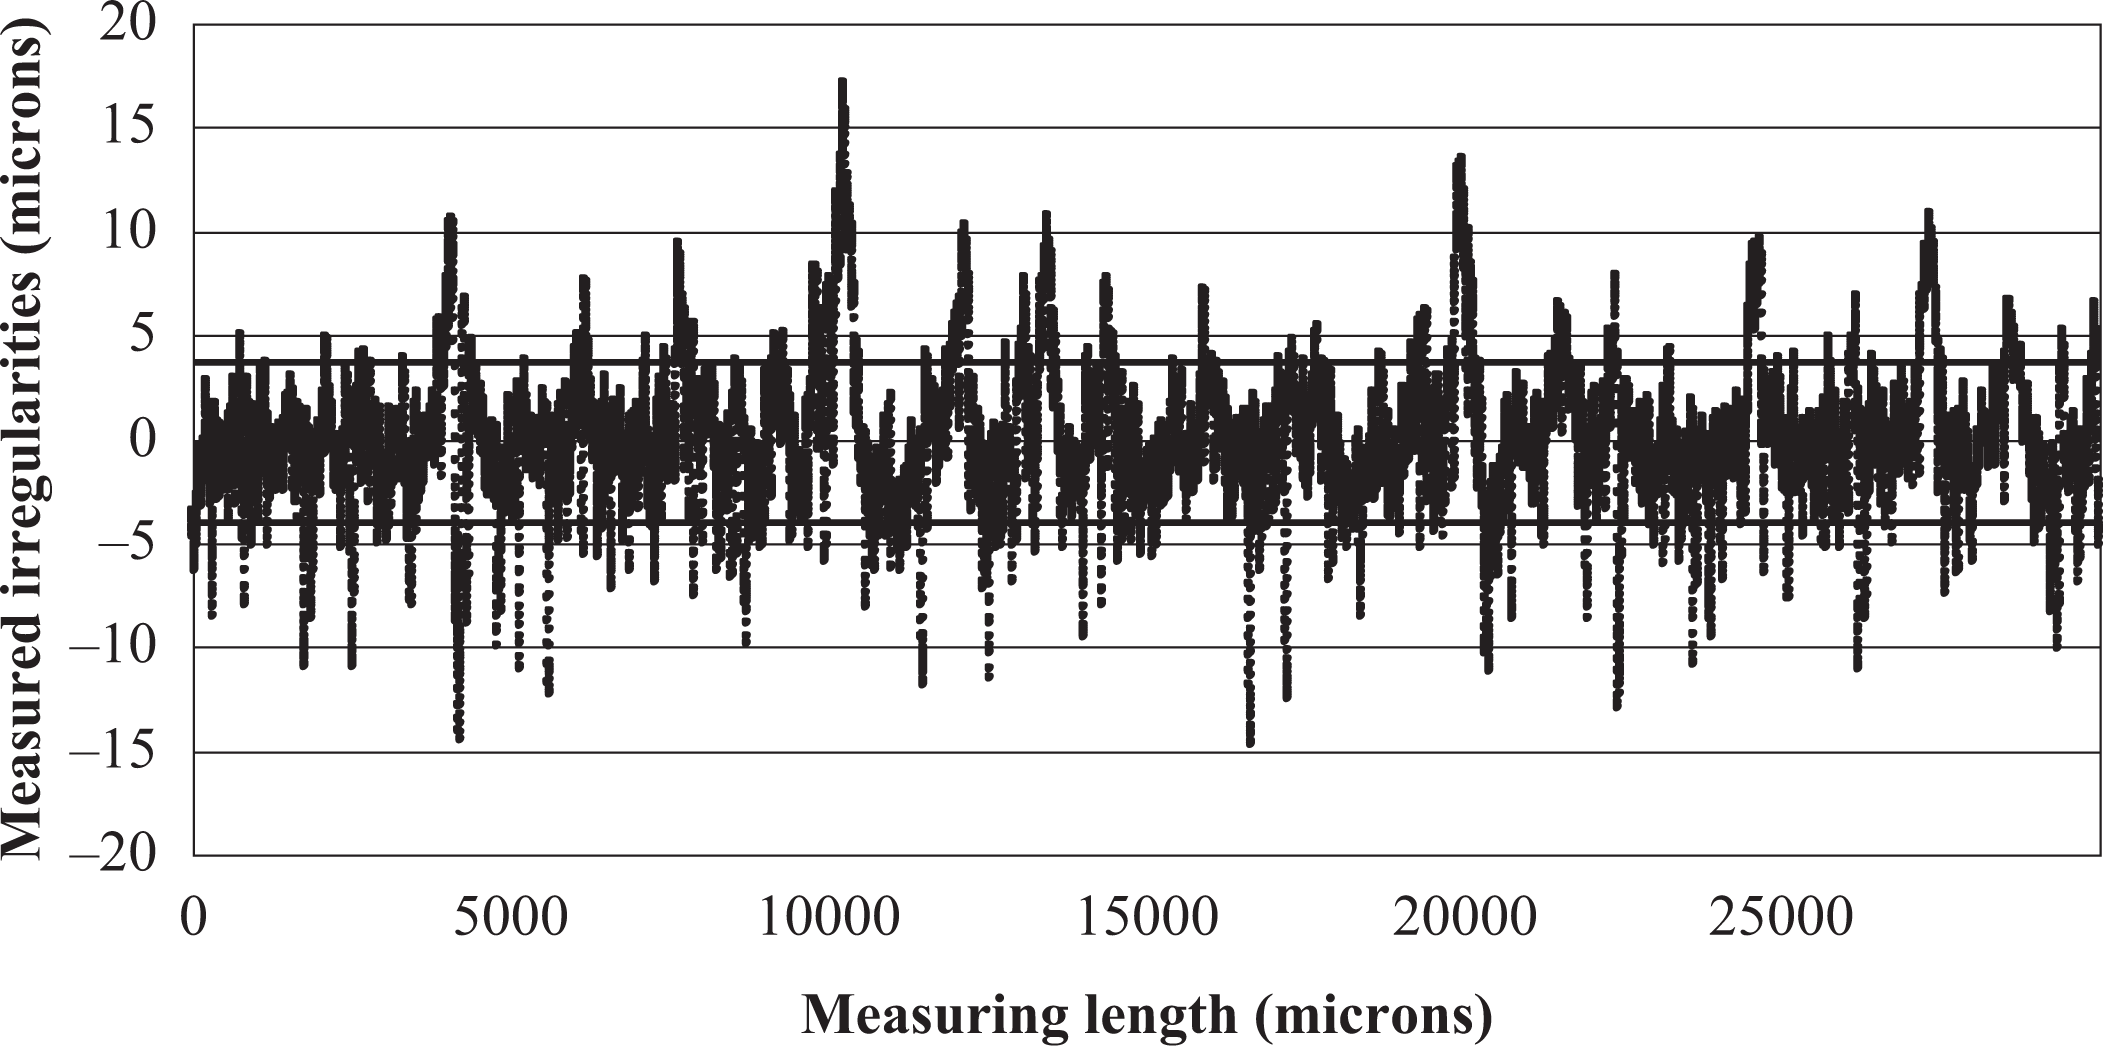
Roughness profile of WPC A9 composition with thresholds delimiting the core roughness from outlying peaks and valleys.
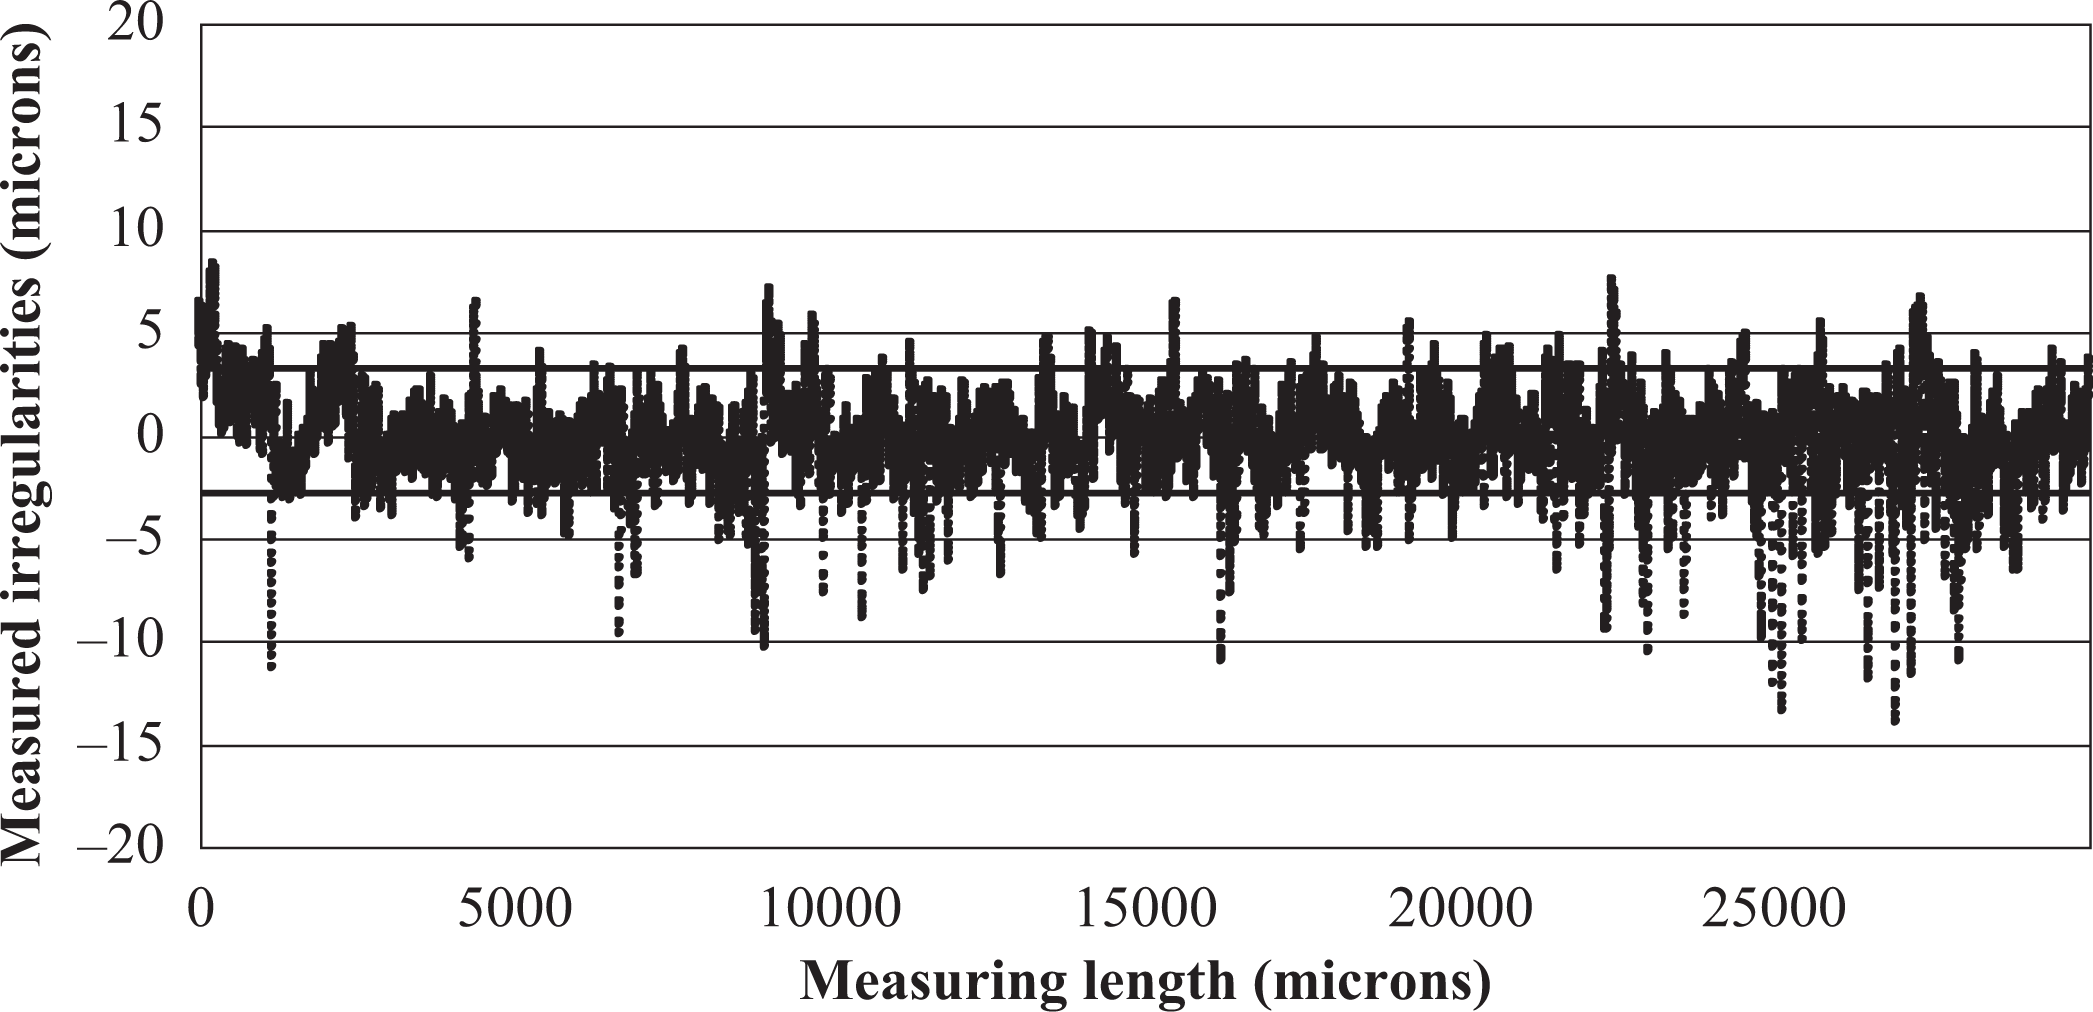
Roughness profile of WPC type A2 composition with thresholds delimiting the core roughness from outlying peaks and valleys.
The surface roughness of A2 was similar with the roughness of A7 and A8 compositions for the majority of parameters. It was noticed that those compositions, A2, A7, and A8 had the same percentage of wood flour (50%) and no mineral filler (Table 1). The compositions A2 and A8 differed slightly. A8 had 0.4% less polymer and 0.4% more antioxidant than A2. Composition A7 had 3.6% more polymer than A2 compensated with 3.6% less additives (no Zinc borate, but 0.4% more antioxidant). These slight differences in composition did not change the surface roughness results as measured by Ra, Rq (Figure 5), Rk + Rpk + Rvk (Table 2), but the core roughness Rk slightly decreased to 3.8 μm for A7 and 3.6 μm for A8 in comparison with 4.3 μm for A2, while the peaks measured by Rpk increased to 4.5 μm for A7 and 4.3 μm for A8 in comparison with 3.6 μm for A2 (Table 2; Figure 6). The parameter Rsk was 0.9 μm for both, A7 and A8 compositions, in comparison with −0.2 μm for A2 (Table 2). This shows again a slight trend for the irregularities on the surface to display isolated peaks rather than valleys. It is not clear if these results can be attributed to the 0.4% addition of antioxidant in A7 and A8 compositions.
WPC surfaces having the highest wood flour percent (60%) had the highest roughness values (A9 followed by A4), but A5 having the smallest wood flour content (40%) wasn’t the smoothest surface (Table 2; Figures 7 and 8). It was noticed that not only the wood flour percentage matters, but the combination wood flour–mineral filler is also important. Thus, compositions having the highest wood flour–mineral content contributed to the highest roughness values of WPC composites (Table 2). The roughest surface, judged by Ra, Rq, Rk, Rpk, Rk + Rpk + Rvk, was measured for A9, which had 70% wood flour–mineral filler (60% wood flour, 10% mineral filler; Table 2; Figures 7 and 8). It was followed by A4, A6, and A5 with 60% wood flour–mineral filler (60% wood flour, 0% mineral filler in A4, 50% wood flour and 10% mineral filler in A6, and 40% wood flour plus 20% mineral filler in A5; Table 2; Figures 7 and 8). As the amount of mineral filler was replaced with wood flour in the composition, the surface roughness of the WPCs increased (Table 2; Figures 7 and 8). This was attributed to the lower particle size (0.15 mm) of mineral filler as compared to the wood flour (0.25 mm). A4 and A9 had identical flour composition (60%), but A9 had 10% more mineral filler and 4.5% less additives. Reducing polymer content and additives in favor of mineral filler has increased the surface roughness of WPC to an Ra of 2.2 μm in A9 compared to 1.9 μm in A4 (Table 2; Figure 7). The core roughness Rk increased in A9 to 5.2 μm compared to 4.4 μm in A4 (Table 2; Figure 8). Similarly, Rk + Rpk + Rvk incresed to 15 μm in A9 in comparison with 12.7 μm in A4, Rt increased to 35.5 microns in A9 in comparison with 26.4 μm in A4 (Table 2).
A6 and A5 have similar polymer contents, which were 29% and 30%, respectively, but the A6 differentiated from A5 by the percentages of wood flour and mineral filler. Ten percent more mineral filler complemented by 10% less wood flour in A5 led to a slightly smoother surface, which could be explained by the smaller size of mineral particles. The roughness parameters differed slightly. For example, Ra was 1.7 μm in A5 and 1.8 μm in A6, Rk + Rpk + Rvk was 12 μm in A5 and 12.4 μm in A6 (Table 2; Figure 7).
With regard to the polymer content, it can be seen from Tables 1 and 2 that WPC compositions with the lowest polymer amount, A9 (22.5%), followed by A4 (28%), A6 (29%), and A5 (30%) in favor of more wood flour and mineral filler, led to rougher surfaces in comparison with A7, for example, having the highest polymer percentage (43.7%; Figures 7 and 8). These differences were significant when analyzed with ANOVA (p < 0.05). Figures 9 and 10 are the details of roughness profiles, showing two extreme examples of a rough profile from A9 composition and a smoother profile from A2 composition. The thresholds, represented with thick horizontal lines, separate the core roughness in the middle, which is higher in magnitude for A9 in comparison with A2. In addition, by looking at the magnitude of peaks and valleys in those profiles, it is obvious that they are higher in A9. This can be explained by a higher wood flour content in A9 (60%) than in A2 (50%) which added more fuzziness and wood anatomical valleys. Ten percent mineral filler in A9 has increased the core roughness Rk to 5.2 μm and the parameter Rk + Rpk + Rvk to 15 μm in comparison with A2, with 0% mineral filler and Rk of 4.3 μm and Rk + Rpk + Rvk of 11.4 μm (Table 2). In general, the pretty high standard deviation values of the roughness parameters is an indication that surfaces are uneven and may require an improved mixing.
Conclusions
The surface roughness of various WPC compositions was evaluated by using a robust filtering method and a larger range of roughness parameters than previously used in the literature. The results showed that WPC groups A1, A2, and A3 were the most homogeneous and together with A7 and A8 provided the smoothest surfaces. The smoothest WPC compositions corresponded to a participation of 50% wood flour, 0% mineral filler, and around 40% polymer matrix. By increasing the fluidity of polymers, that is the MFI value from 3.6 to 12 and 25, the surface roughness decreased due to a better polymer penetration inside the wood cell cavities. At the extreme, the roughest surface was measured for A9 (60% wood flour plus 10% mineral filler), followed by A4, A6, and A5, where the wood flour percentage alone or in combination with mineral filler was the highest. The WPC compositions with lower polymer amount in favor of more wood flour and mineral filler led to rougher surfaces. It was noticed that not only the wood flour percentage matters but the combination wood flour–mineral filler was also important. As the amount of mineral filler was replaced with wood flour in the composition, the surface roughness of the WPCs increased. Reducing polymer content in favor of mineral filler, while keeping the same wood flour percentage increased the surface roughness of WPC. For similar polymer and additives participation, more mineral filler complemented by less wood flour led to a slightly smoother surface. These results should be helpful to anticipate the effect on surface roughness of the percentage participation for each amount of the wood or mineral filler, polymer matrix, and additives in further development of WPC combinations.
Footnotes
Declaration of Conflicting Interests
The author(s) declared no potential conflicts of interest with respect to the research, authorship, and/or publication of this article.
Funding
The author(s) disclosed receipt of the following financial support for the research, authorship, and/or publication of this article: We hereby acknowledge the structural funds project PRO-DD (POS-CCE, O.2.2.1., ID 123, SMIS 2637, ctr. No 11/2009) for providing the infrastructure used in this work.