
Abstract
An experimental investigation has been conducted to understand the effect of water aging on flexural fatigue performance of unidirectional polypropylene (PP)-glass (G) fiber–reinforced epoxy composites. Test specimens were fabricated using hand lay-up process with a constant total fiber volume fraction. The effects of the reinforcement hybridization, hybrid configuration, and stacking sequences on S–N curves were investigated. Deflection-controlled flexural fatigue tests with a frequency of 25 Hz at zero mean stress have been conducted. A 20% reduction of the initial applied moment was taken as a failure criterion. In the first stage, the flexural fatigue properties of un-aged composite specimens were studied in ambient temperature. In the second stage, flexural fatigue properties were investigated after a preliminary aging step in distilled water for 350 days. The specimen surface temperature rise was measured to ensure that there is no early damage happened in the tested specimens. Results indicated that the hybridization of PP fiber–reinforced composite with G fiber improves its flexural fatigue resistance but increase water uptake. Inter-intraply hybrid laminate with G-fiber layers at the specimen outer faces and PP-fiber layers in the specimen core exhibits the most favorable flexural fatigue behavior, that is, the highest cost ratio and the specific fatigue endurance strength. The water-sorption step induced a significant decrease in fatigue properties of the fabricated specimens. The highest measured temperature rise was observed to be about 9°C for G fiber–reinforced composite.
Keywords
Introduction
Fiber-reinforced plastic composites (FRPCs) have been successfully used in many industrial applications such as aerospace, automobile, marine, military, and so on. 1,2 Over the years, FRPCs have been replacing the use of metals because of the advantages they provide in terms of mechanical properties, corrosion resistance, low cost, and ease of processing. 3 Composites also offer significant freedom to the designer by allowing and optimizing the strength and stiffness of a component or structure for a particular application. 4
FRPCs are widely subjected to cyclic loading during their service life in most engineering applications. Fatigue can be considered the most common failure type in composite components. 5 The significance of studying fatigue life of engineering components is related to the fact that failure could occur at stress levels lower than that needed to induce static failure. Several factors can affect the fatigue life of FRPCs such as material constituents, fiber volume fraction, fiber orientation, loading frequency, stress level, and environmental conditions. 6
Failure of composites under fatigue loading is more complicated than for metals. In fact, the heterogeneous and anisotropic nature of composite materials leads to the formation of different stress levels within the material so that the fracture process includes various combinations of damage modes such as matrix cracking, fiber breakage, fiber splitting, delamination, fiber/matrix debonding, or a combination of them. Moreover, voids and defects contained in the fabricated composite can act as sites for nucleation of its fatigue failure. 7,8
In many engineering applications, FRPC components have to sustain not only various types of loads but also the environmental conditions. Humidity severely affects the mechanical properties of polymers and their composites. 9 All polymeric composites absorb moisture to some extent in humid atmospheres or when they are immersed in water. 10 The way in which polymeric composites absorb water depends on many factors, such as constituent materials, fiber volume fraction, fiber orientation, temperature, and area of the exposed surface. 11
In marines, FRPC mechanical structures are designed to have long service lives. So, determination of the resistance to cyclic stress is an essential problem. Also, these FRPC structures may be exposed to extreme humidity levels, which will affect their chemical structure and thereby their mechanical behavior. 12 It is important to understand the amount of degradation that water could cause on the mechanical properties of the material in order to consider them in the design phases. 13
Various studies have reported on the fatigue testing of dry composite specimens. 7,14 –19 On contrary, fatigue testing of wet composite specimens (under different preconditioning situations) is very limited although it is more severe than that being under normal conditions. In general, the elevated temperature and humidity preconditioning shorten the fatigue lives of fiber-reinforced composites. 20 Vauthier et al. 21 found that preconditioning under relatively low humidity may not have a significant effect on glass fiber–reinforced composites (GFRCs). However, preconditioning in elevated temperature in water has a deleterious effect on its fatigue performance. As reported by Jones et al., 22 the preconditioning in boiling water has no effect on the fatigue performance of carbon fiber–reinforced composite (CFRC) compared with samples tested under normal conditions, while GFRC does degrade at a much faster rate. According to Komai et al., 23 CFRC samples subjected to preconditioning in water before fatiguing show considerable reduction in fatigue life. McBagonluri et al. 24 reported that after preconditioning in salt water at 65°C for 5 months, the fatigue of E-glass/vinyl ester composite specimens in immersed salt water was considerably lowered compared with that of as-delivered samples fatigued in air. A great number of studies are reported in the literature on the flexural fatigue of hybrid composites tested under normal conditions. 4,25 –27 However, there are insufficient reports related to the preconditioning effects on the flexural fatigue performance of hybrid composites.
Polypropylene (PP) fiber is considered one of the recent promising materials for the fabrication of hybrid composites. 28 It has better strain to failure and lower density than glass (G) fiber and can easily be processed, eco-friendly and inexpensive. One of the disadvantages of PP fiber is its relatively low mechanical properties. To overcome this limitation, PP fiber could be hybridized with G or carbon fibers to form hybrid composites. The low density and low cost of PP fiber will ensure that the resulting hybrid composites will offer attractive specific mechanical properties and will save money. 29
To the best knowledge of the authors, no researches concerned with the flexural fatigue behavior of PP-G fiber–reinforced hybrid composites with different configurations, that is, interplay and inter-intraply and stacking sequences. Also the preconditioning effect, particularly water absorption, on the flexural fatigue performance of the abovementioned hybrids hasn’t been investigated. So the main concern of this study is to understand the influence of water immersion on the flexural fatigue behavior of PP-G fiber–reinforced epoxy with different stacking sequence and hybrid configurations. Deflection-controlled flexural fatigue tests were conducted in ambient environment on dry and wet samples. Wet samples were preconditioned in distilled water for 350 days.
Experimental work
Materials
Unidirectional roving PP and G fibers were used as reinforcements. A bicomponent epoxy resin, Kemapoxy 150RGL, was selected as polymer matrix. The characteristics of the composite constituents are listed in Table 1.
The main properties of the composite constituents.
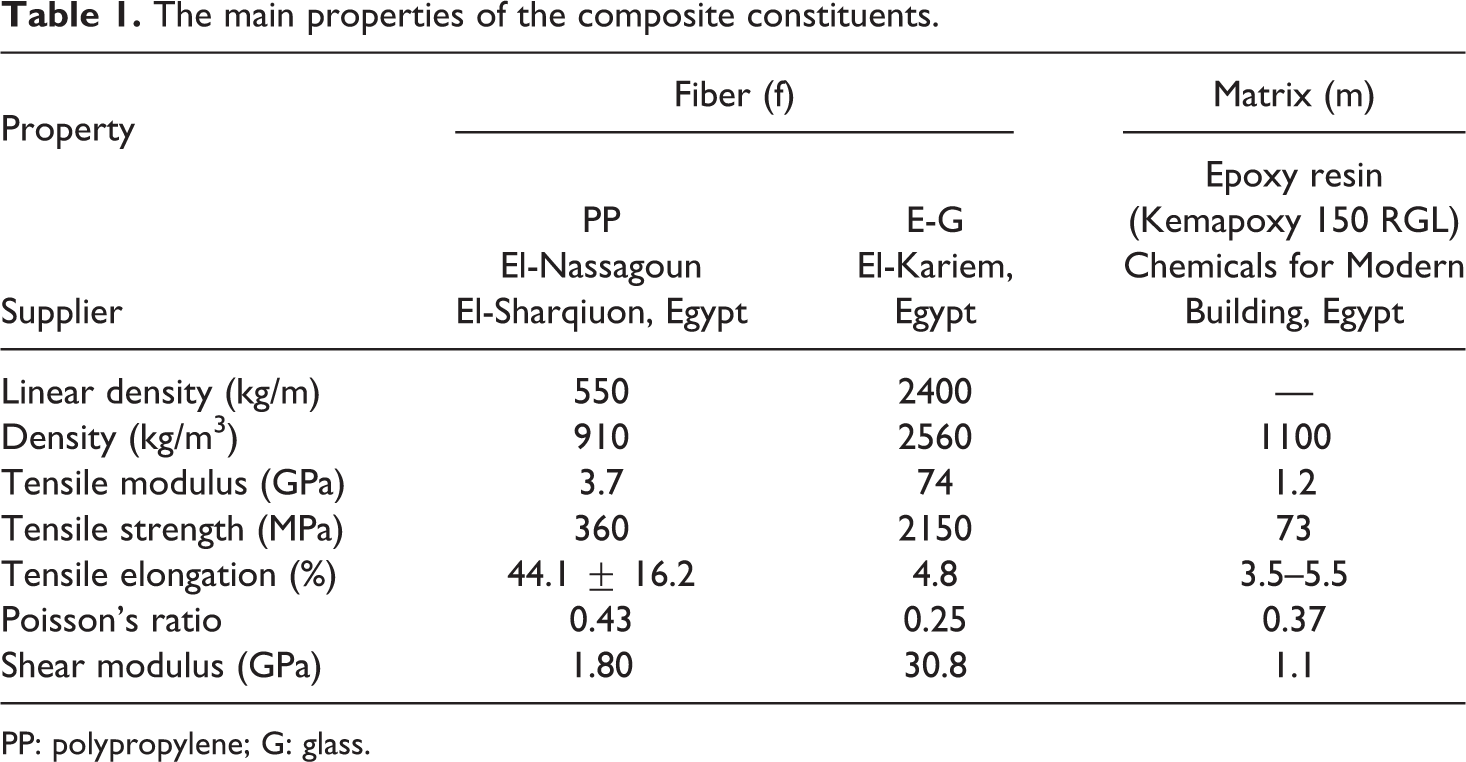
PP: polypropylene; G: glass.
Composite specimens’ preparation
A total of six PP-G fiber–reinforced epoxy composite laminates were fabricated using hand lay-up technique. For the fabricated hybrid composites, both G and PP fibers contribute with the same relative volume fraction (50%:50%). The fibers were fixed on the wooden frames using small pins. The distance between each adjacent two pins in the wooden frame is called the pitch. As the densities of the used fibers (i.e. G and PP) are different as shown in Table 1 and the same relative fiber volume fractions are used (50% G:50% PP), the pitch value changes according to the wound fiber type. The pitch values have been calculated to be as follows: When winding pure G fiber bundles, the pitch will be 5 mm. When winding pure PP fiber bundles, the pitch will be 3 mm. In intraply template containing both G and PP fibers, both G and PP will be wound around small pins in two rows on the wooden frame. The first row of pins has a pitch of 10 mm for G fiber. The second row has a pitch of 6 mm for PP fiber bundles. The total fiber volume fraction that is,
The descriptions and codes of the fabricated composite laminates.
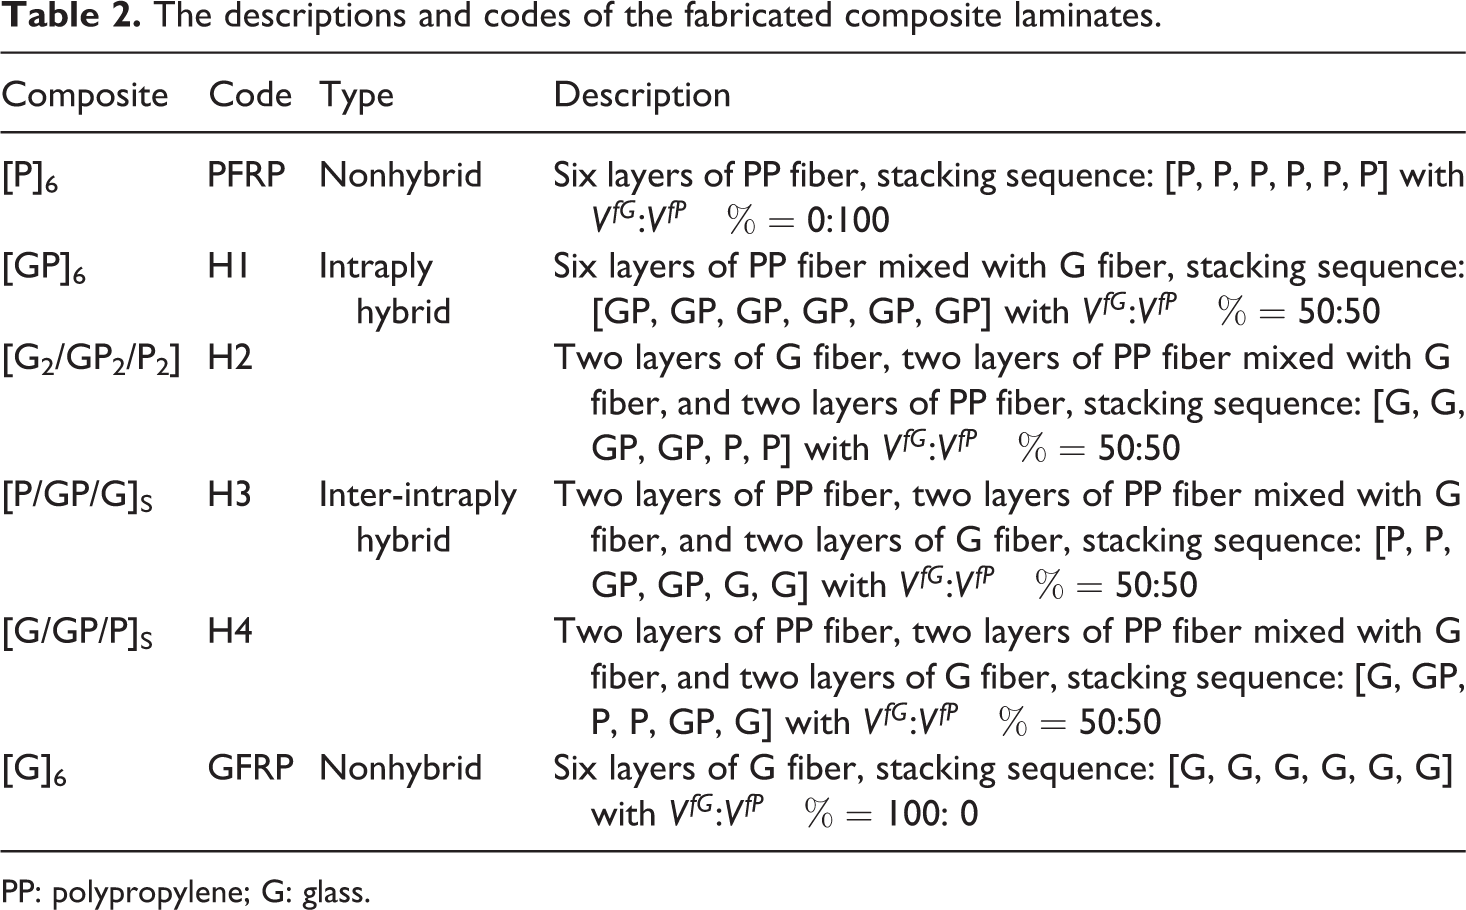
PP: polypropylene; G: glass.
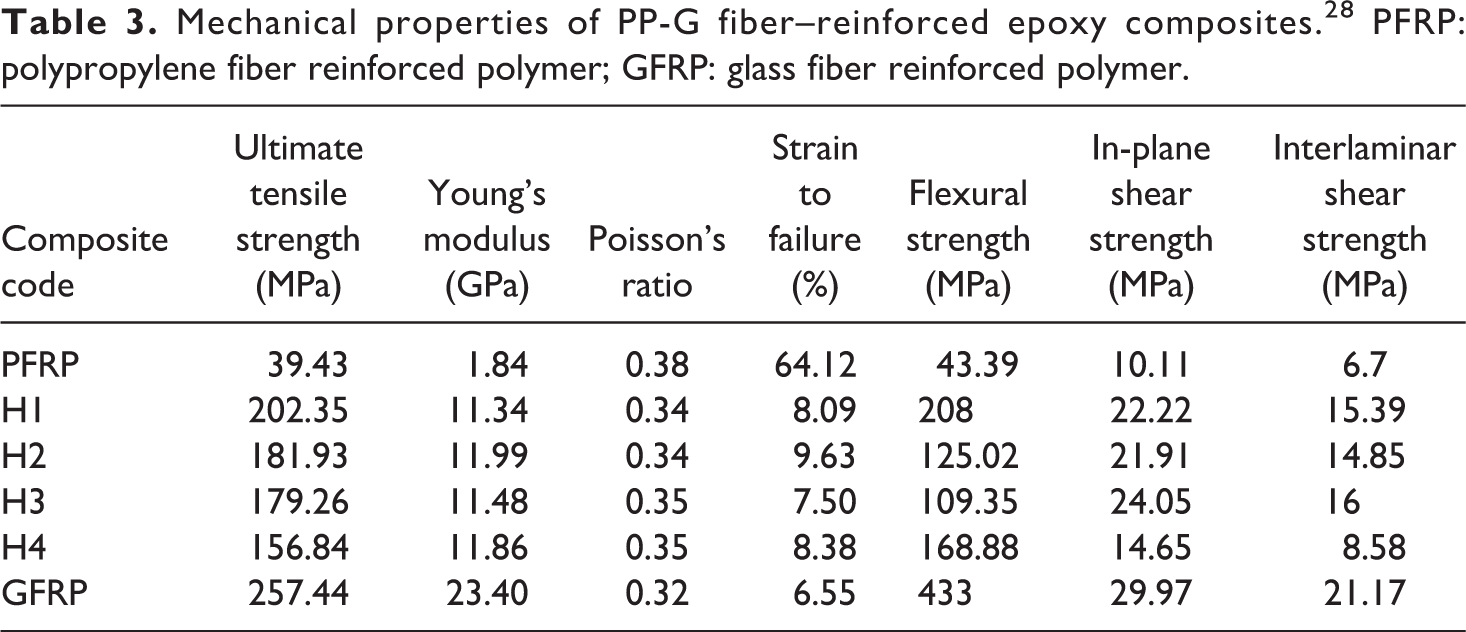
The fabrication process of PP-G fibers/epoxy composite laminates can be summarized as follows: First, the fibers were fixed on the wooden frames using small pins (Figure 1(a)). The lay-up mold was treated by a release agent and was left for 24 h to dry. A layer of epoxy resin was spread on mold. The first template with unidirectional fiber was placed on the resin. Then, the fibers were rolled to distribute the matrix and displace the air outward (Figure 1(b)). When the fibers were fully impregnated with epoxy, they were loosen from the wooden frame. The above procedure was repeated with alternate layers of matrix and fibers until the whole laminate was primarily constructed. When the last fiber layer was impregnated, a 25-kg steel plate was placed on the top of laminate to obtain a uniform pressure and consequently a constant thickness for the fabricated composite (Figure 1(c)). The constructed laminate shown in Figure 1(d) was left at room temperature for 7 days till it completely cured. Then the test specimens were cut according to the concerning standards. The mechanical characteristics of the fabricated composites are presented in Table 3.
28
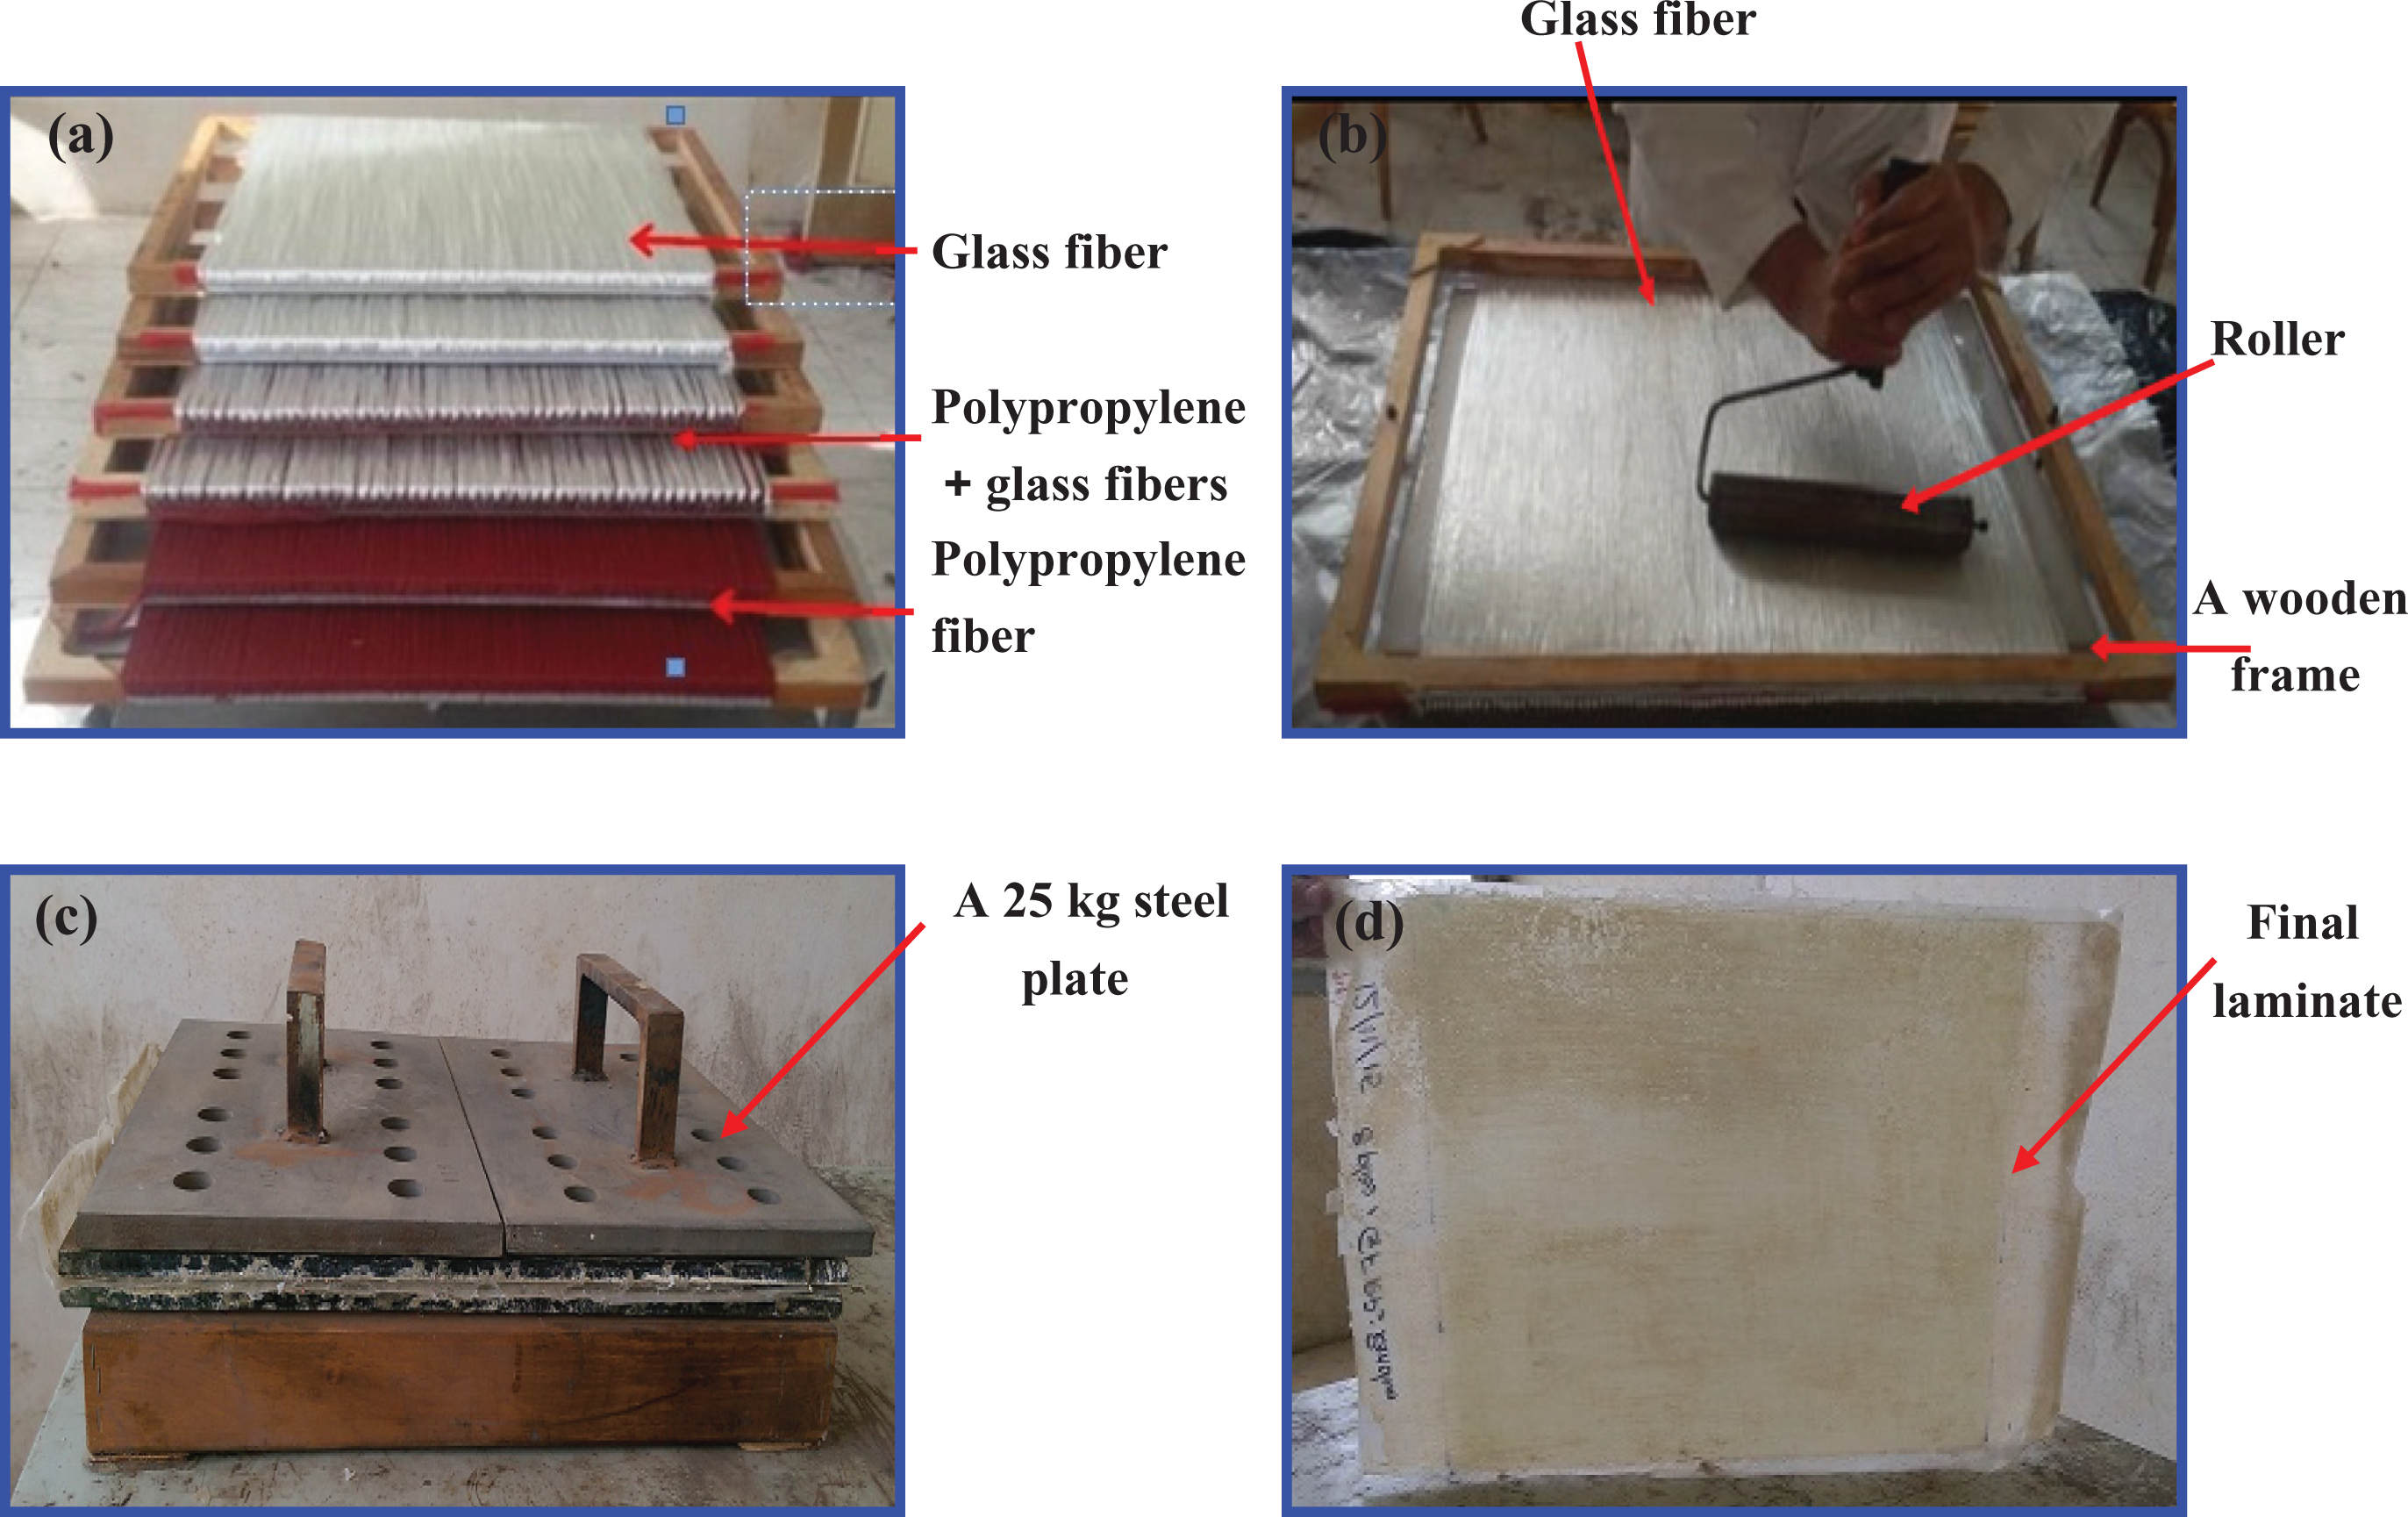
(a) Templates with fibers used in the laminate fabrication, (b) impregnation process, (c) a 25-kg steel plate placed on the top of the laminate, and (d) final laminate.
Mechanical properties of PP-G fiber–reinforced epoxy composites. 28 PFRP: polypropylene fiber reinforced polymer; GFRP: glass fiber reinforced polymer.
Water absorption test
Water uptake tests were carried out according to ASTM D5229 standard. 30 Specimens were immersed in distilled water at room temperature for 350 days. The specimens were withdrawn from water from time to time, wiped to remove water droplets, and regularly weighed using a digital balance with precision up to 10−4 g to measure the mass change during the water absorption process. The water uptake content M (t) was calculated as the mass gain (%) relative to its initial weight (wo) as follows 31 :

where wt is the sample weight after time t.
Flexural fatigue testing
Test procedure
Flexural fatigue tests were conducted on a deflection-controlled testing machine (Avery-Denison 7305 type), as shown in Figure 2. The machine was designed to apply a reverse bending stress with 1420 cycles per minute and a frequency of 25 Hz as recommended for the flexure fatigue tests of rigid plastics by the standards. 32,33 Many researchers employed a frequency of 25 Hz for studying the flexural fatigue behavior of polymer composites. 15,16,34,35
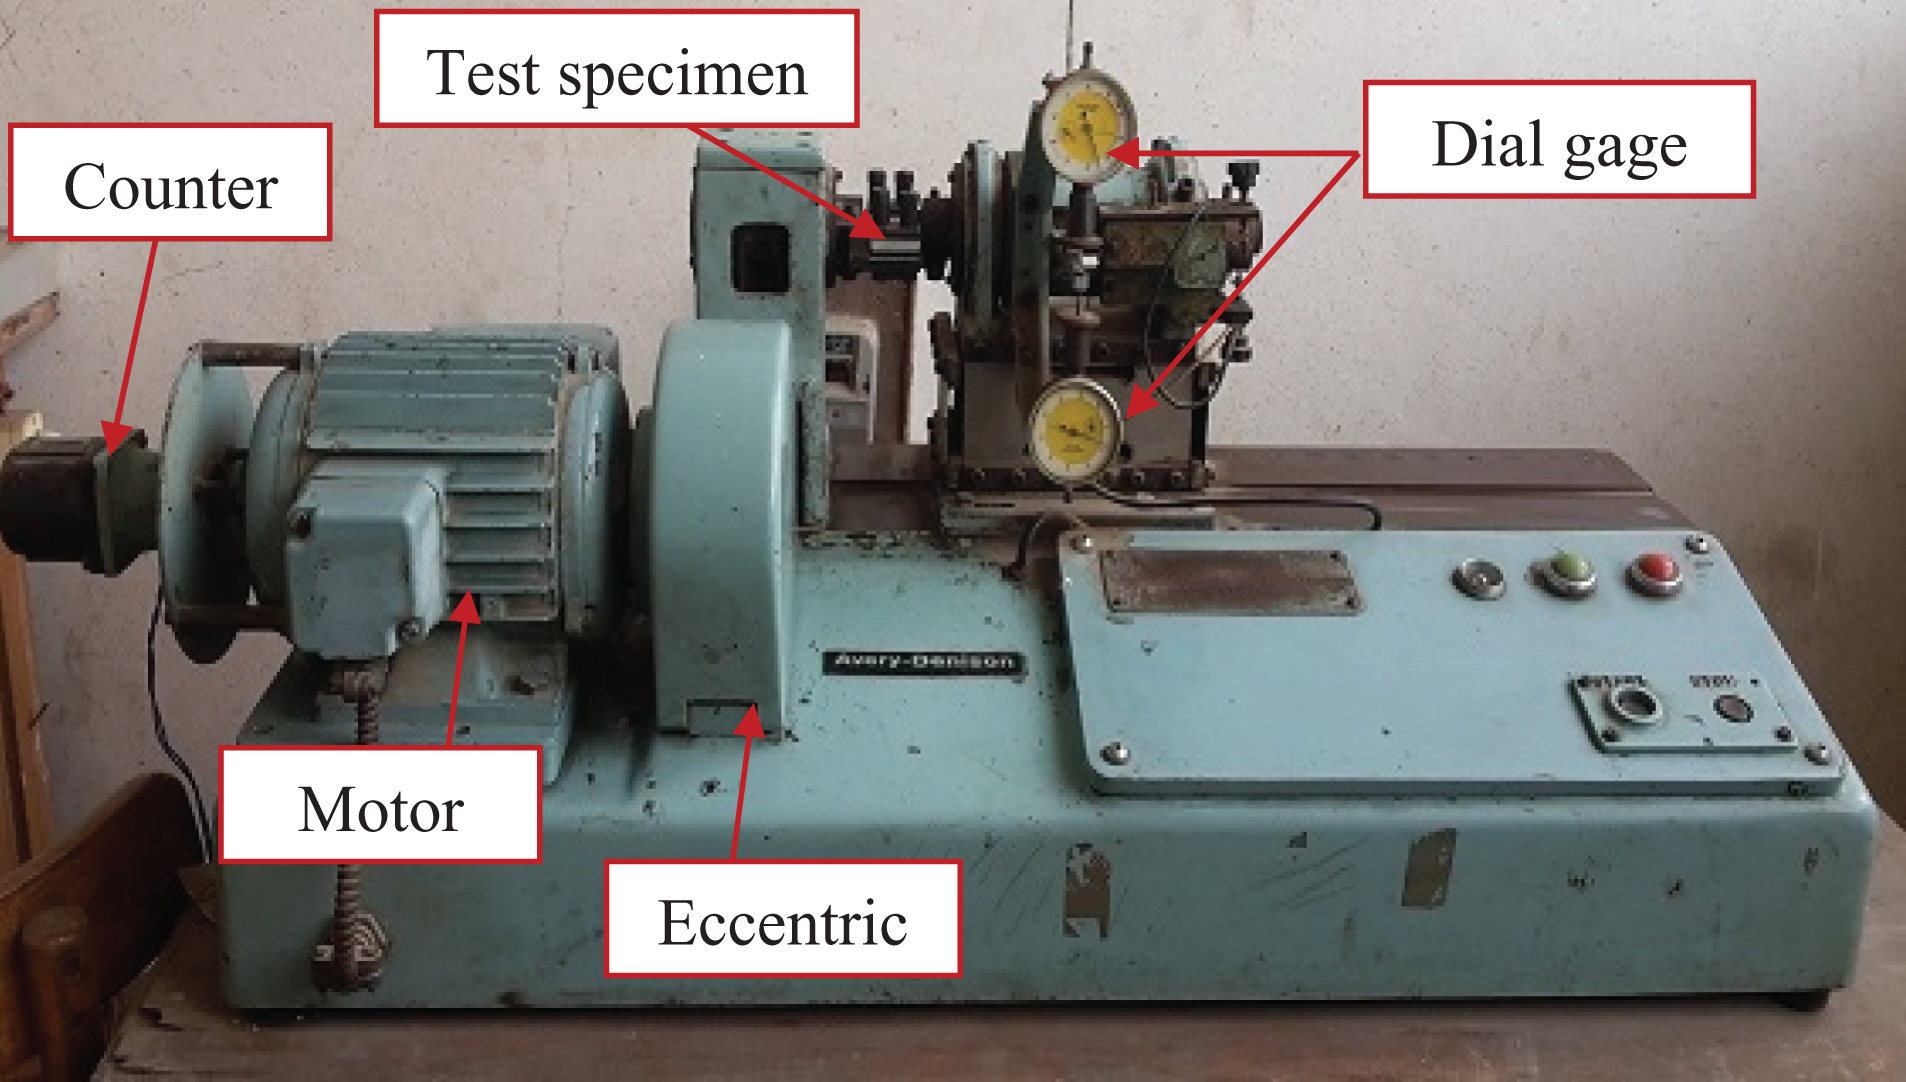
Flexural fatigue testing machine, Avery-Denison type.
The eccentric disk is adjustable to give the required bending angle range from 0° to 24°. The bending angle is registered on dial gauges in terms of divisions. A calibration curve for the machine dynamometer is provided giving the relationship between dial gauge reading in terms of divisions and imposed torque on the dynamometer. Four different bending angles (5°, 6°, 7°, and 8°) were adjusted to give four different stress levels for each composite type. Five specimens at each stress level were considered.
The oscillating load is imposed at the free end of the specimen by a reciprocating spindle driven by a connecting rod, crank, and double eccentric disk. The load is measured at the opposite end of the specimen by a torsion dynamometer with a moment of 30 Nm. Grips are provided for specimens’ fixation. Metallic packing shims are used to bring the centerline of the specimen on the machine axis. The revolution counter fitted to the motor records the number of cycles. When the specimen breaks, the machine is stopped automatically by cutout switches. The details of the machine adjustment and test procedure are reported in the machine catalogue. In the present study, 20 dry specimens and 20 wet specimens for each composite type were tested at room temperature. Wet specimens were preconditioned in distilled water for 350 days. The specimens were tested under flexural fatigue having a cyclic stress ratio
Mid-length surface temperature measurements
It is important to measure the temperature rise in composites during fatigue tests especially at high testing frequency to ensure that there is no early damage occurrence in the tested specimen. When a composite specimen is subjected to repeated loads, mechanical energy inside the specimen is converted to other types of energy such as heat and sound. As the thermal conductivity of composites is low, a part of this energy is stored inside the specimen as heat causing an increase in the composite temperature. 38
Theoretical work
Fiber volume fraction
The total fiber volume fraction of the fabricated composites can’t be measured experimentally using ignition technique according to BS 3691, 39 whereas the specimen is heated to 575°C ± 25°C. The PP fiber can’t withstand this high temperature because its melting point is 130–171°C. So it is very difficult to measure the fiber volume fraction experimentally for hybrid and pure PP fiber–reinforced composites.
The total fiber volume fraction of the fabricated composites was obtained theoretically. A piece from the fabricated composite laminate was considered and its volume was calculated (vC). The fiber length in all the layers (L) was estimated. Then, the weight of the fiber in the piece (Mf) was calculated as follows:

The fiber volume was calculated as
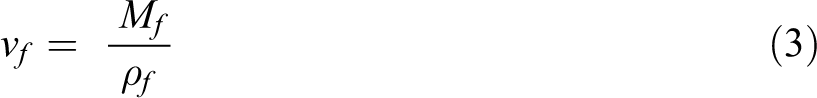
where ρl and ρf are, respectively, the linear and volumetric density of the used fiber.
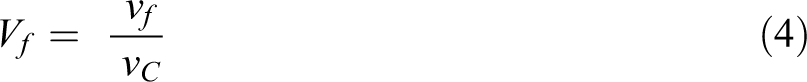
Finally, the estimated fiber volume fraction (Vf) was obtained using the following equation
Void content
The void is one of the most important problems that may be encountered in fiber-reinforced composite materials. The most common cause of voids is the incapability of the matrix to displace all the air which is entrained within the fibers as it passes through the matrix impregnation. 40 During the fabrication of fiber-reinforced composites, the trapped air or other volatiles exist in the composites causing the voids. 41 The existence of voids in the composite significantly reduces its mechanical and physical properties. 42 The void contents of the fabricated composites were calculated 43 using the following equation

where ρth and ρexp are the theoretical and experimental densities of the composite sample, respectively.
Following the rule of mixtures, the theoretical density (ρth) of the composite sample can be expressed as follows:

where V is the volume fraction, and the subscripts “m”, “fP”, and “fG” refer to the matrix, PP fiber, and G fiber, respectively.
A digital vernier caliper with precision up to 10−2 mm and a digital balance with precision up to 10−4 g were used to measure the specimens’ dimensions and mass, respectively, and the experimental density of the sample (ρexp) can be calculated as follows:
where M and v are the specimen mass and volume, respectively.
Results and discussion
Fiber volume fraction
The total fiber volume fraction for all tested composites was calculated and found to be 32.5%. Both G and PP fibers contribute with the same relative volume fraction (50%:50%). The G and PP fiber volume fraction is 16.25%.
Void content
The void content of the fabricated composites with different layering patterns is presented in Figure 4. PFRP composite exhibits the highest void content (1.04%) compared to the other composites. This may be due to the incompatibility between the epoxy and PP fiber and the incomplete wetting out of the PP fibers by the matrix which leads to the formation of voids, 44,45 while the lowest void content (0.19%) was observed for GFRP composite. As expected, PP-G fiber hybrid composites have intermediate void content between PFRP and GFRP. Intraply hybrid H1 has the lowest void content compared with the other three inter-intraply hybrids, H2, H3, and H4. For inter-intraply hybrid composites, stacking sequence has a significant effect on the void content. Using G fiber at the composite periphery and PP fiber in the core, that is, H4, decreases the void content by about 32.61% compared with the hybrid with the opposite arrangement that is, H3. That is because PP fiber in the specimen core is tightly packed by G fiber. It is clear from Figure 4 that the hand lay-up technique leads to a satisfactory fiber impregnation level and results in composites with low void contents. A good composite should have less than 1% voids, whereas a poorly fabricated composite can have voids up to 5%. 46
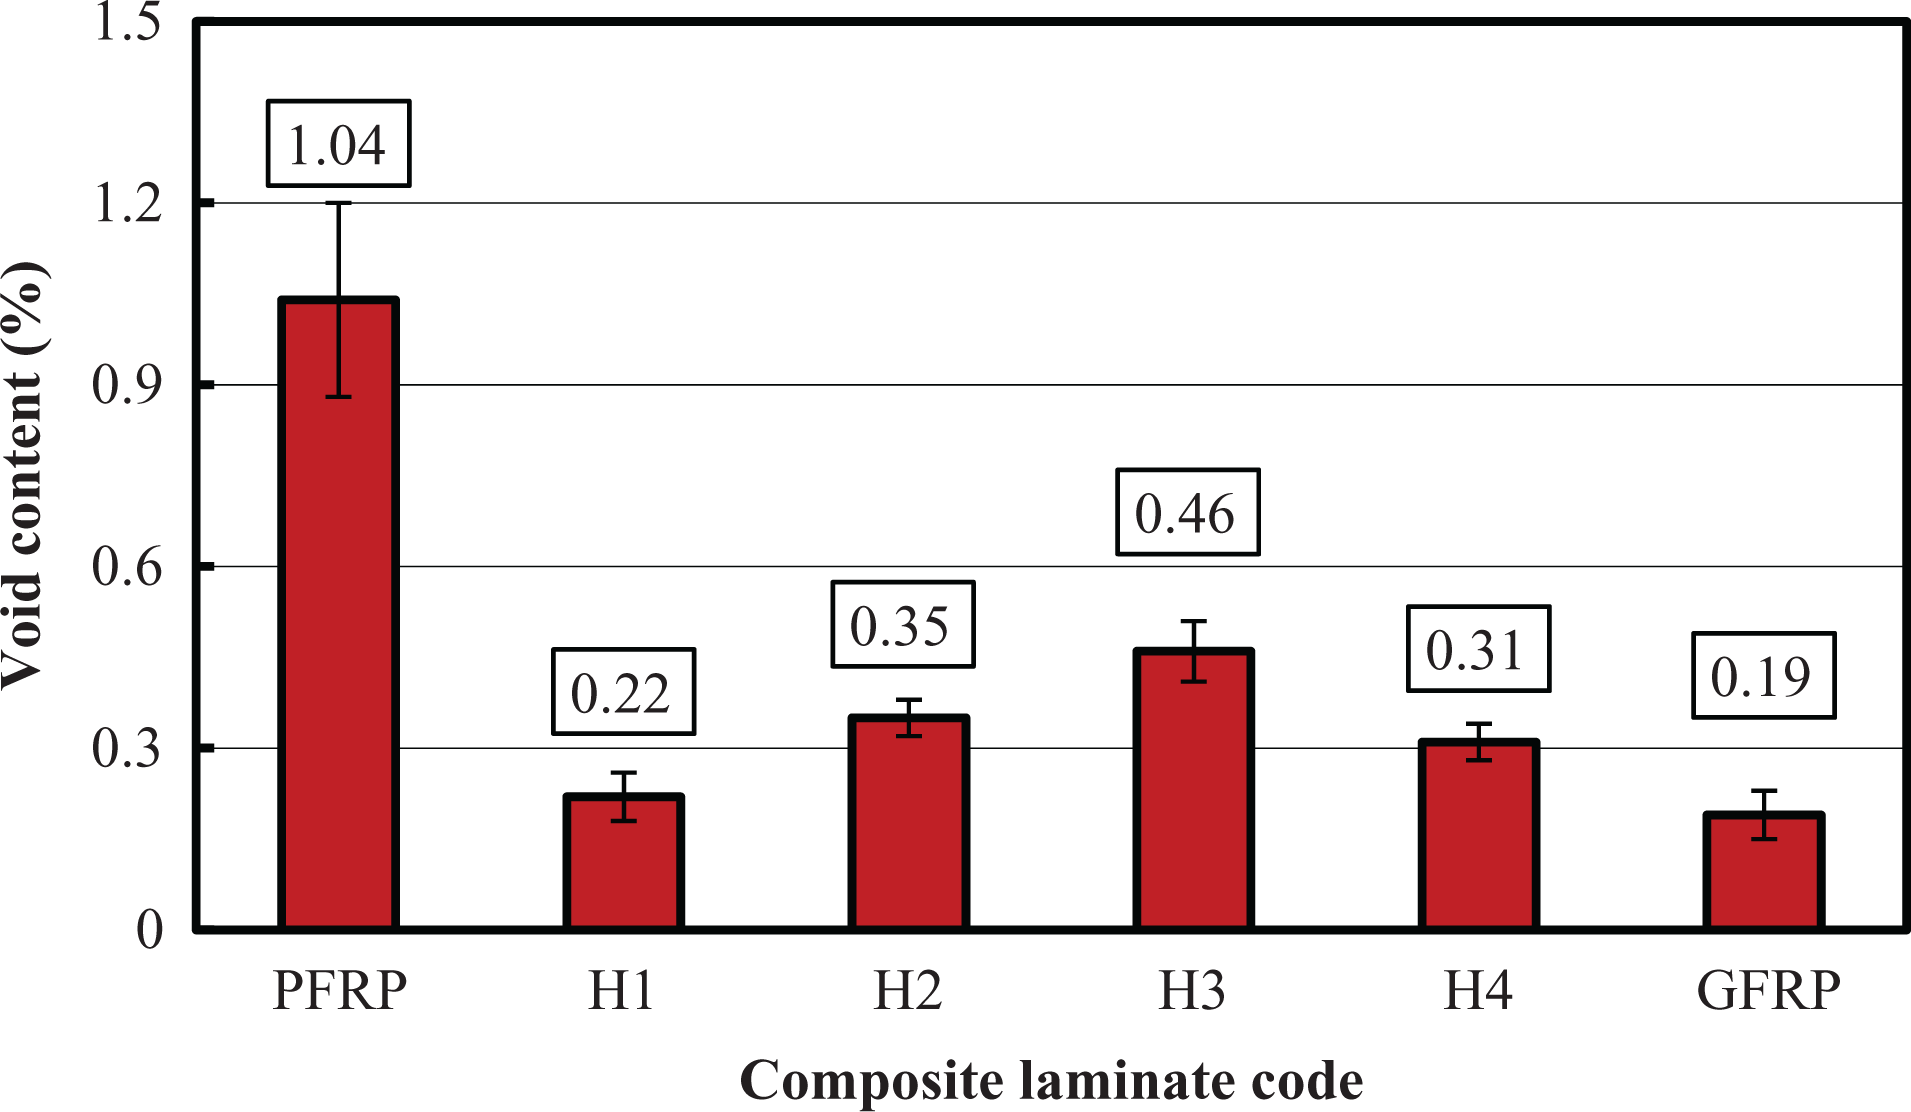
Void content for the fabricated PP-G fiber–reinforced epoxy composites. PP: polypropylene; G: glass.
Water absorption
Figure 5 displays the relation between the weight of the absorbed distilled water and the immersion time for the fabricated composite samples. It is obvious that the water uptake increases as the immersion time increases for all immersed specimens. This can be attributed to the fact that during water immersion, water molecules go through free spaces of micro-voids formed by cracks and cavities in the matrix. Additionally, water molecules can rapidly penetrate and diffuse along the interface because of the capillarity. This result agrees with those obtained by Khalil and Sartika 47 and Gu and Hongxia. 48
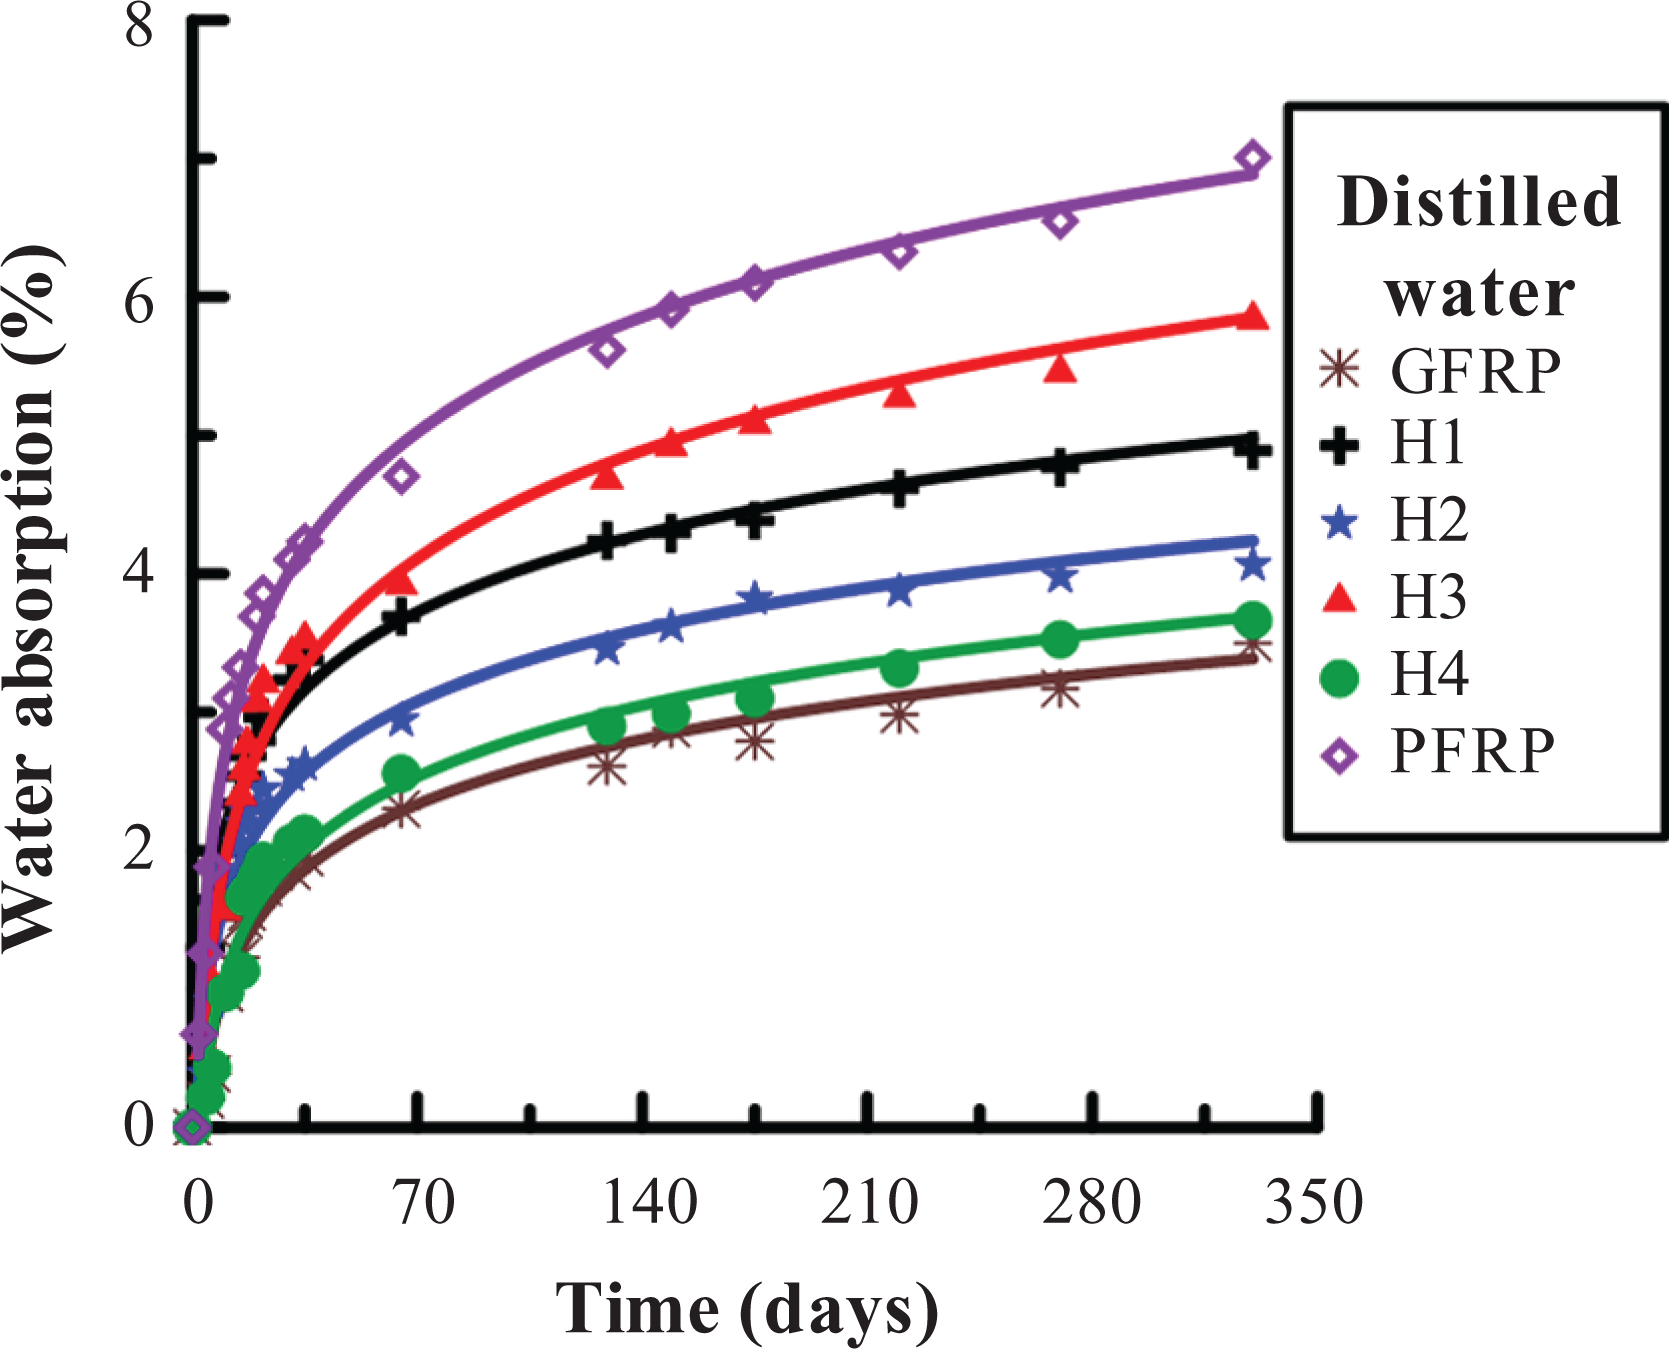
Water absorption behavior of PP-G fiber–reinforced composite specimens. PP: polypropylene; G: glass.
Water uptake of PFRP composite is the highest, while that of GFRP composite is the lowest. The main reason is the negligible water absorption capacity of water impermeable G fiber, as compared to PP one. Also, this can be due to the void content found in PFRP composite which in turn absorb more water and lead to diffusion of water molecules inside the specimen. Hybrid composites have intermediate water absorption properties between those of PFRP and GFRP composites. Hybrids show lesser water uptake compared to PFRP composite due to the incorporation of G fiber. Among the studied hybrids, the one with G fiber at the periphery and PP fiber at the core, that is, H4, has the minimum water uptake because G fiber acts as a barrier to the PP fiber, thus preventing the direct contact between the PP and water, while the hybrid with the opposite arrangement, that is, H3, has the maximum water uptake.
S–N curves
Figure 6 shows a series of S–N diagrams for dry and wet PP-G fiber–reinforced composite specimens. The ordinate denotes the initial applied stress, while the abscissa denotes the fatigue life (the number of cycles at failure, N). The experimental data were curve fitted by the power function. The obtained results show the influence of the reinforcement hybridization, hybrid configuration (intraply or inter-intraply), and stacking sequence on the fatigue life of the fabricated PP-G fiber–reinforced composites. Indeed, S–N curves of hybrid laminates lie below that of GFRP and above that of PFRP. The presence of PP fibers in the laminates makes them more sensitive to fatigue.
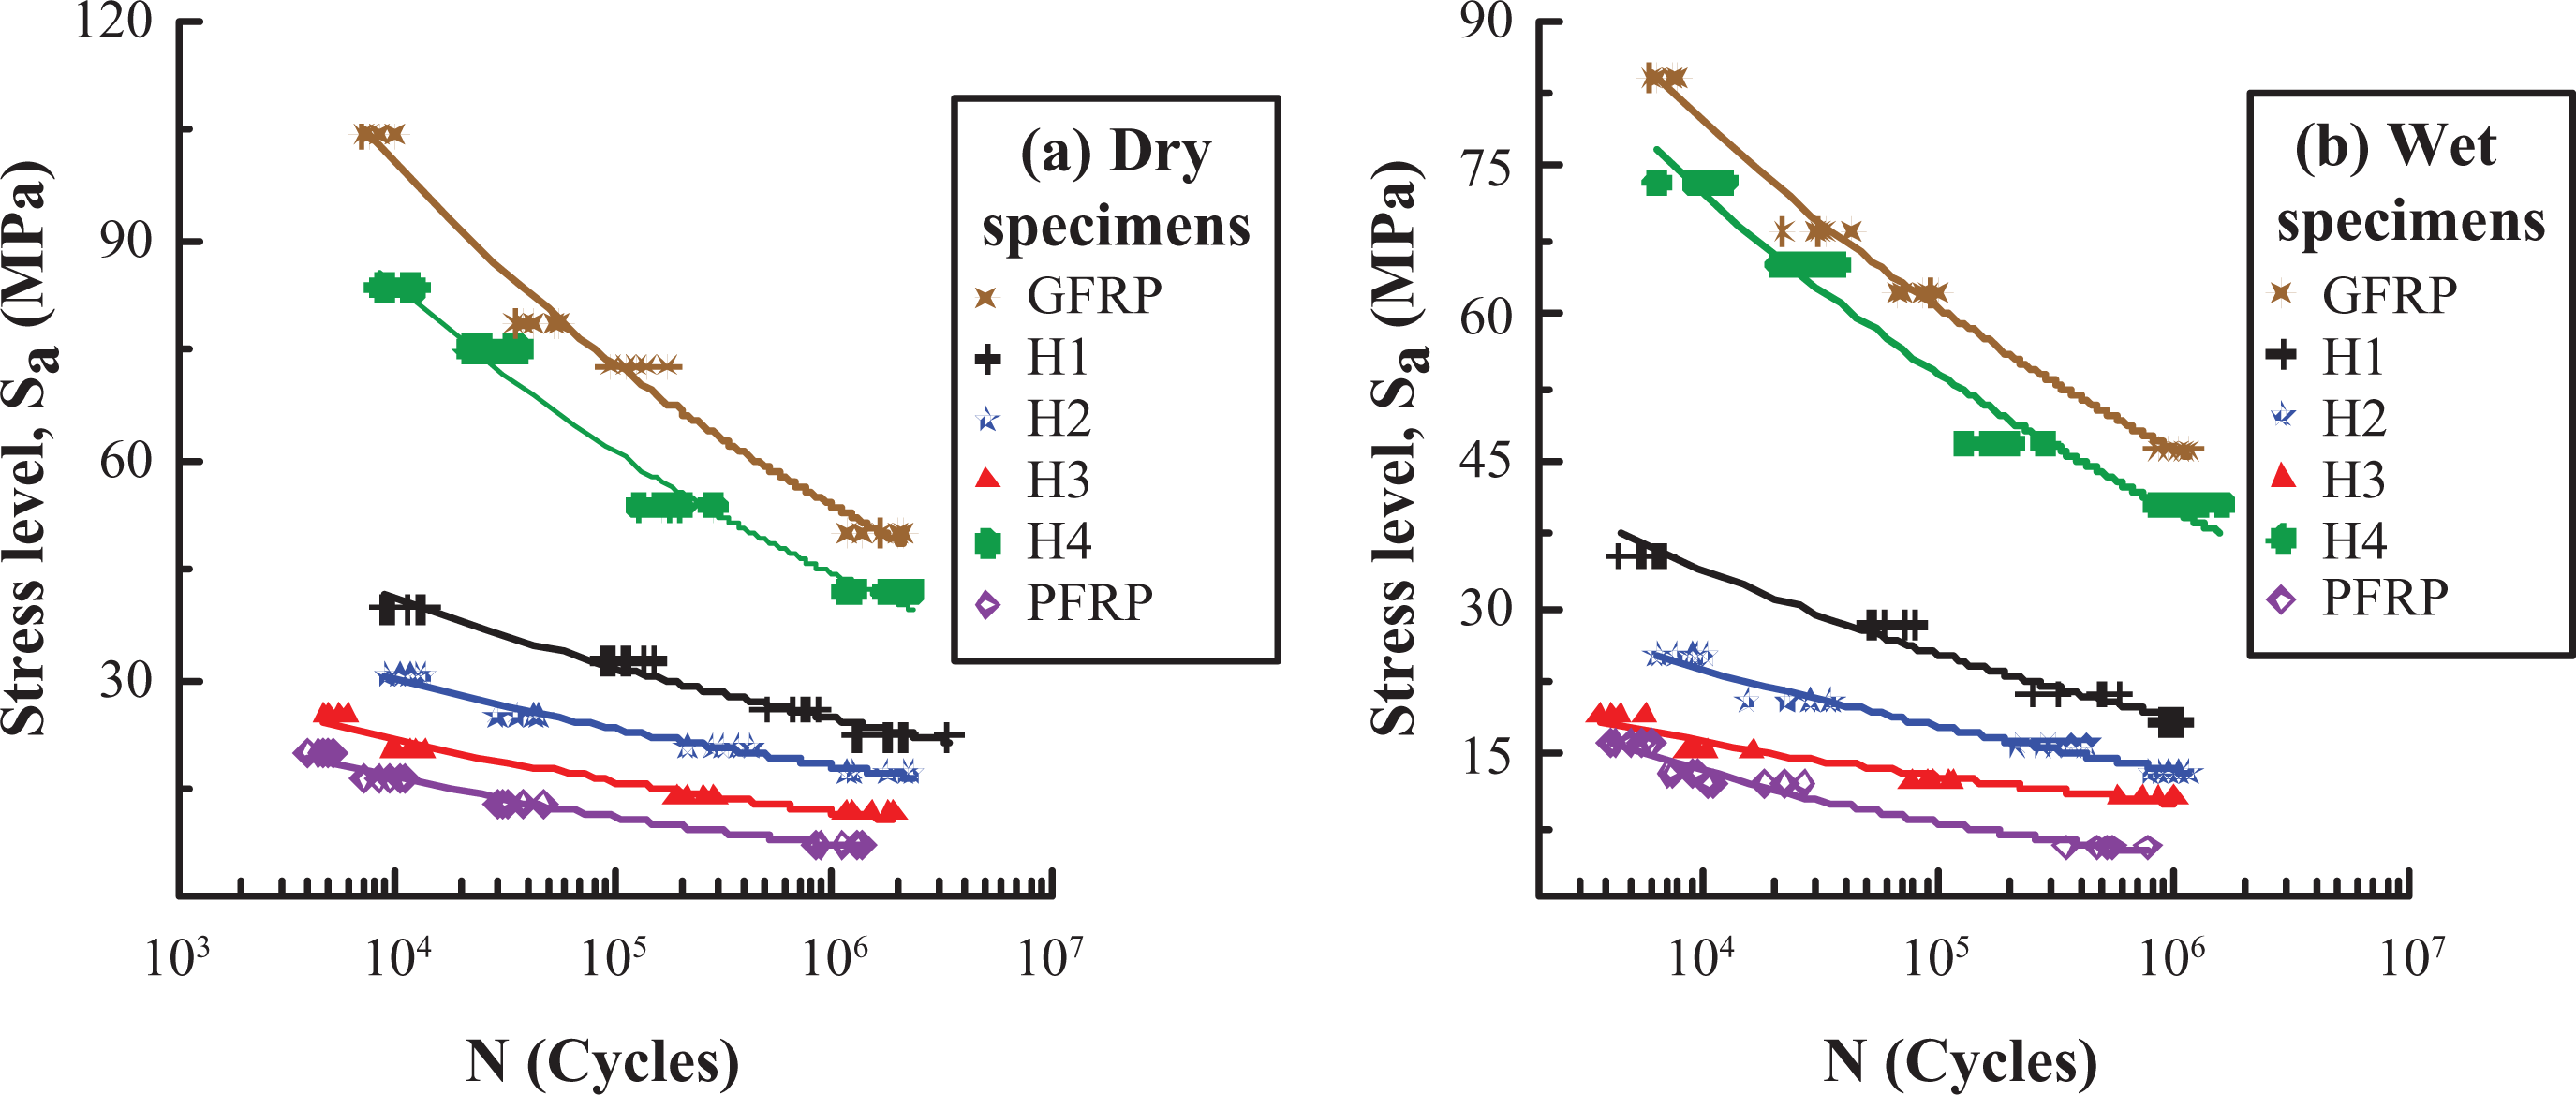
S–N curves for PP-G fiber–reinforced epoxy composite specimens. PP: polypropylene; G: glass.
Dry condition
Figure 6(a) shows the fatigue behavior of PP-G fiber–reinforced epoxy composites under dry condition. This figure shows that S–N curves for the specimens generally slope downward indicating that high stress level has fewer numbers of cycles to failure compared to lower stress levels. Furthermore, the slopes of S–N curve of GFRP and H4 composites are nearly similar, which means that the addition of PP fiber in the specimen core does not result in a significant change in the fatigue sensitivity. Also, the slopes of S–N curve of PFRP and H3 are approximately the same. The highest fatigue resistance was obtained for GFRP composite and the least was associated with PFRP. This is attributed to the high static flexural strength of GFRP compared with PFRP as seen in Table 2.
The effect of the stacking sequence on the fatigue resistance of PP-G fiber–reinforced composites is shown in Figure 6(a). The results obtained show that for the same number of stress cycles, the inter-intraply hybrid laminate with external G fiber layers and PP fiber core, H4, has higher initial stress than the hybrid with the opposite arrangement, H3. This occurs because the flexural fatigue strength increases with the increase of static flexural strength. For the tested composites, Attia et al. 28 showed that the static flexural strength increases with the presence of G fiber at specimen’s outer faces and PP fiber in the specimen’s core. The maximum flexural stress occurs at the outer faces. The flexural stress tends to be zero at the neutral axis, that is, at the specimen core for symmetric laminates. With respect to the hybrid configuration, at the same number of stress cycles, the inter-intraply hybrid with G fiber outer layers, H4, has higher initial stress amplitude than the intraply one, H1.
Figure 6(a) shows the endurance fatigue strength, S end, calculated at N = 10 6 cycles for the tested composites. Endurance fatigue strength value of GFRP specimens equals 6.57 times that of PFRP specimens. Endurance fatigue strength values of hybrid composites containing (50% PP:50% G) depend on the hybrid configuration and stacking sequence. The S end for (H4) inter-intraply hybrid composite having external glass layers equals 1.89 times that of (H1) intraply hybrid. Inter-intraply hybrid, H4, having external glass layers has endurance strength 3.58 times that of inter-intraply hybrid with the opposite arrangement, H1.
For better comparison, the fatigue ratio of the fabricated composites with different configurations and stacking sequence is shown in Figure 7. In this figure, the fatigue strength is divided by the corresponding ultimate flexural strength. H4 composite has the highest fatigue ratio and PFRP has the lowest one compared to other composites. The fatigue ratios of H1, H2, H3, and GFRP are close to each other for different number of cycles.
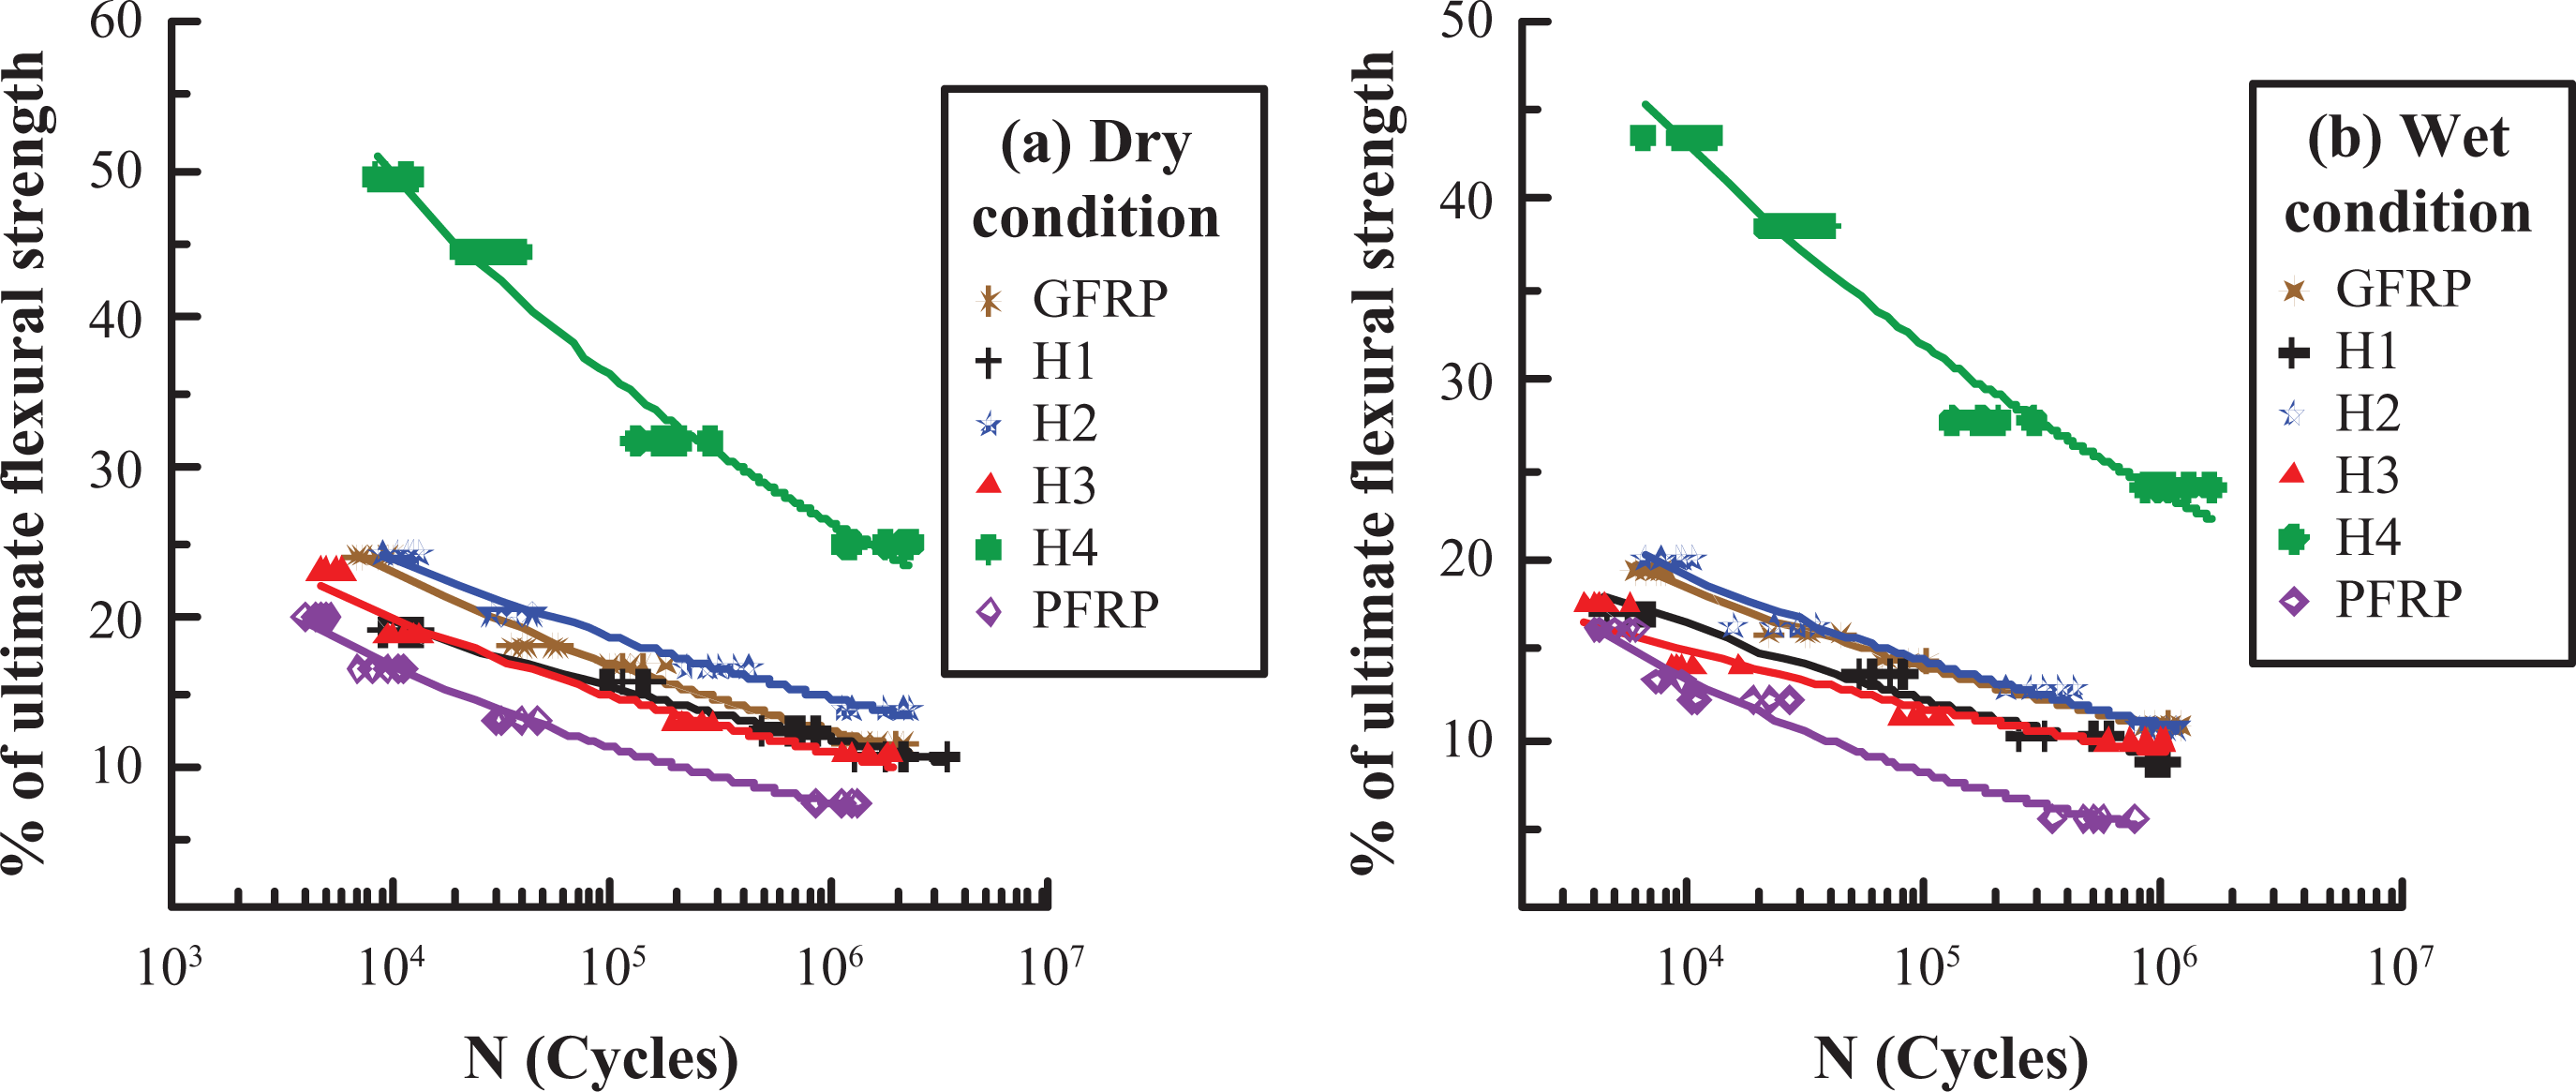
Fatigue ratio of PP-G fiber–reinforced epoxy composite specimens. PP: polypropylene; G: glass.
Wet condition
Figure 6(b) shows the fatigue behavior of PP-G fiber–reinforced epoxy composite specimens under wet condition. The least fatigue strength under wet condition is obtained by PFRP composite, while the best fatigue strength was for GFRP composite. This means that hybridizing PP fiber/epoxy composite with G fiber improves the fatigue resistance under wet condition. Comparing the fabricated hybrids, H4 hybrid with external G-fiber layers and PP-fiber core is the best, while H3 with the opposite arrangement is the worst.
As shown in Figure 7(b), the fatigue ratio of H4 composite (in wet condition) is the best, while PFRP has the lowest one compared to other composites. The fatigue ratios of H1, H2, H3, and GFRP are close to each other for different number of cycles and have intermediate values between PFRP and H4 composites.
Figure 8 shows a comparison of S–N curves between dry and wet condition for each fabricated composite. Water ingress appears to have a deleterious effect on the fatigue performance of PP-G fiber–reinforced epoxy composites. Samples subjected to preconditioning in distilled water for 350 days before fatiguing show considerable reduction in fatigue life. The rate of degradation in fatigue of PFRP, H1, and H2 is approximately the same for both wet and dry conditions, as the inclinations of S–N curves are nearly the same. The decrease in fatigue strength of wet specimens compared to dry ones is originated from the interfacial degradation caused by water diffusion along the interface between the fibers and matrix. The presence of such amount of water at the interface weakens the interfacial strength which in turn accelerates the fatigue failure process. It has been shown that the mechanical properties for many commonly used polymer systems for composites do degrade under environmental loads. 11 The obtained results agree with those obtained by McBagonluri et al. 24 and Franco et al. 49 Water absorption during fatigue considerably accelerates the crack initiation and crack propagation and consequently shorter fatigue life is expected by Meng et al. 50 The major difference is that dry specimens resist more cycles than wet specimens for the same stress level. Ferreira et al. 10 attributed this to the interfacial strength loss caused by water absorption, thus decreasing the fatigue life.
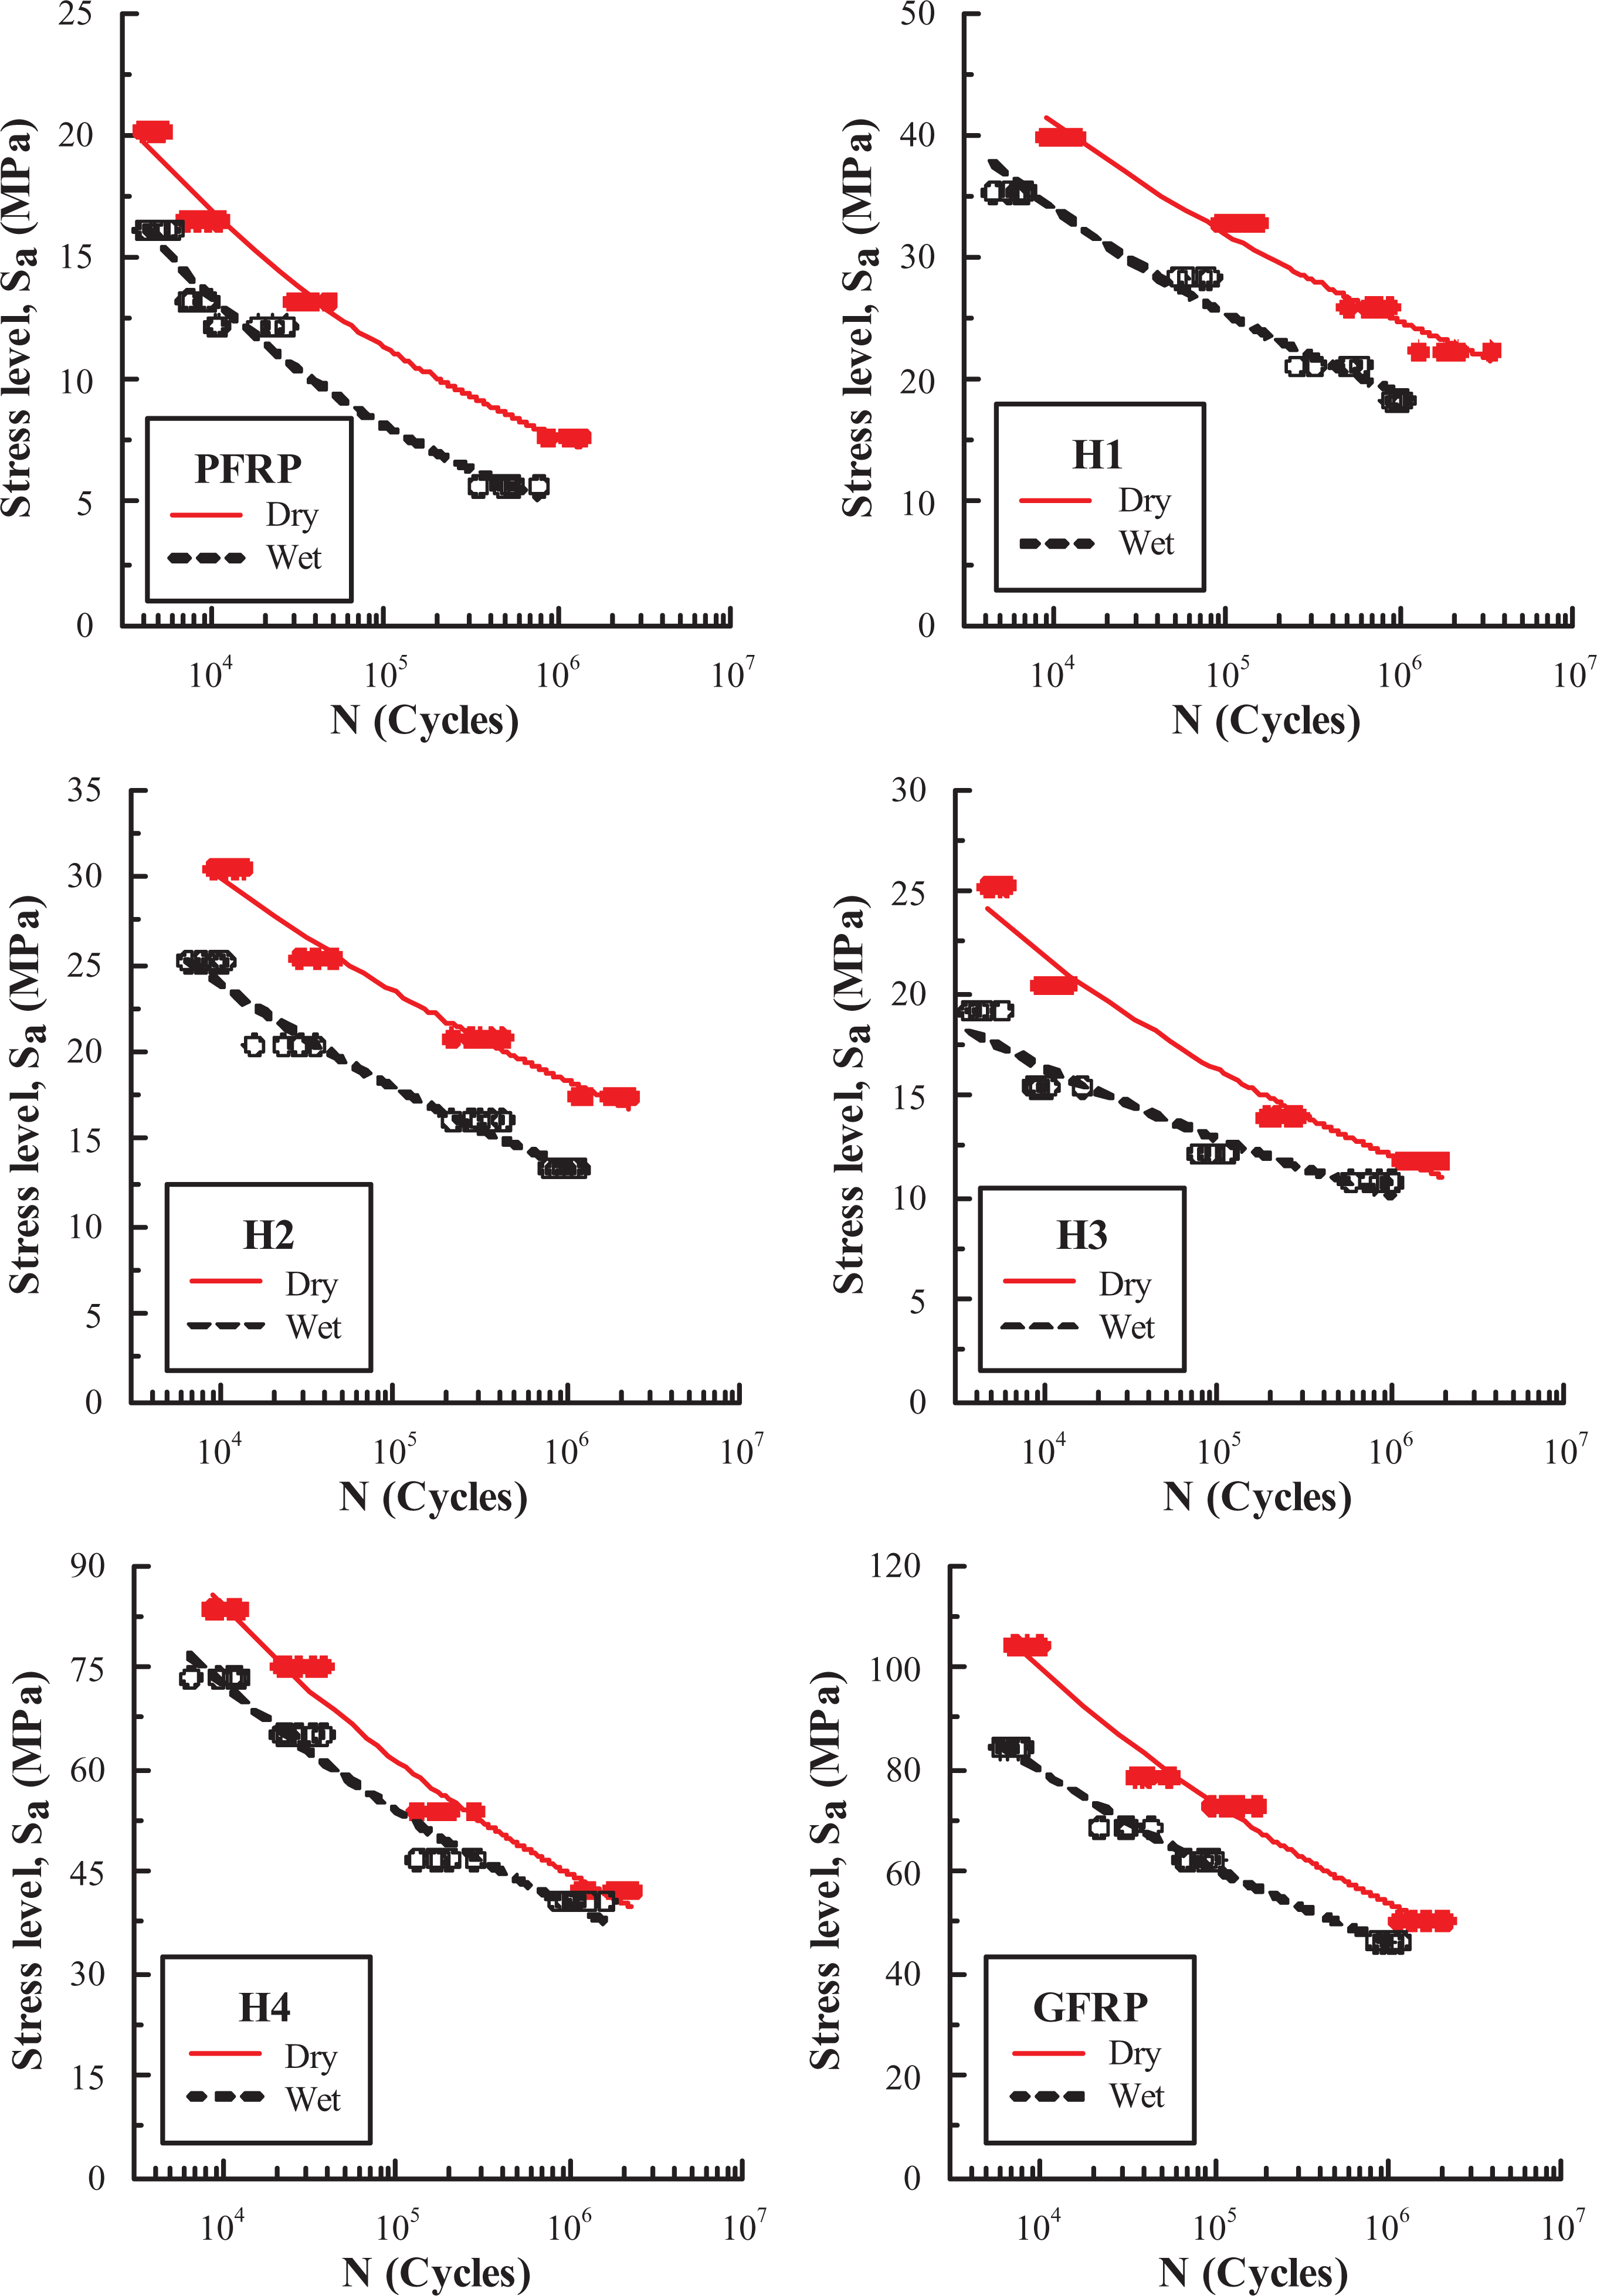
Effect of water uptake on fatigue behavior of PP-G fiber–reinforced epoxy composites. PP: polypropylene; G: glass.
Surface temperature
The mid-length surface temperature rise of all test specimens, at different stress levels, has been traced and recorded during the testing using thermocouples except for the endurance limit because of its long duration time.
Dry condition
Figure 9 shows the variation in the mid-surface temperature of dry specimens with the number of cycles at different stress levels (Sa ). It was observed that, Sa has a significant effect on the surface temperature of the tested specimens. As Sa increases, the surface temperature rise increases. This result may be attributed to that increasing the applied alternating stress, increases the corresponding internal strain deformation. The internal strain deformation is partially converted into heat which leads to rise in the sample’s surface temperature. The temperature rise in GFRP is nearly five times in average that in PFRP. This result agrees with those obtained by Selmy et al. 18,27,36 and Dally and Broutman. 38
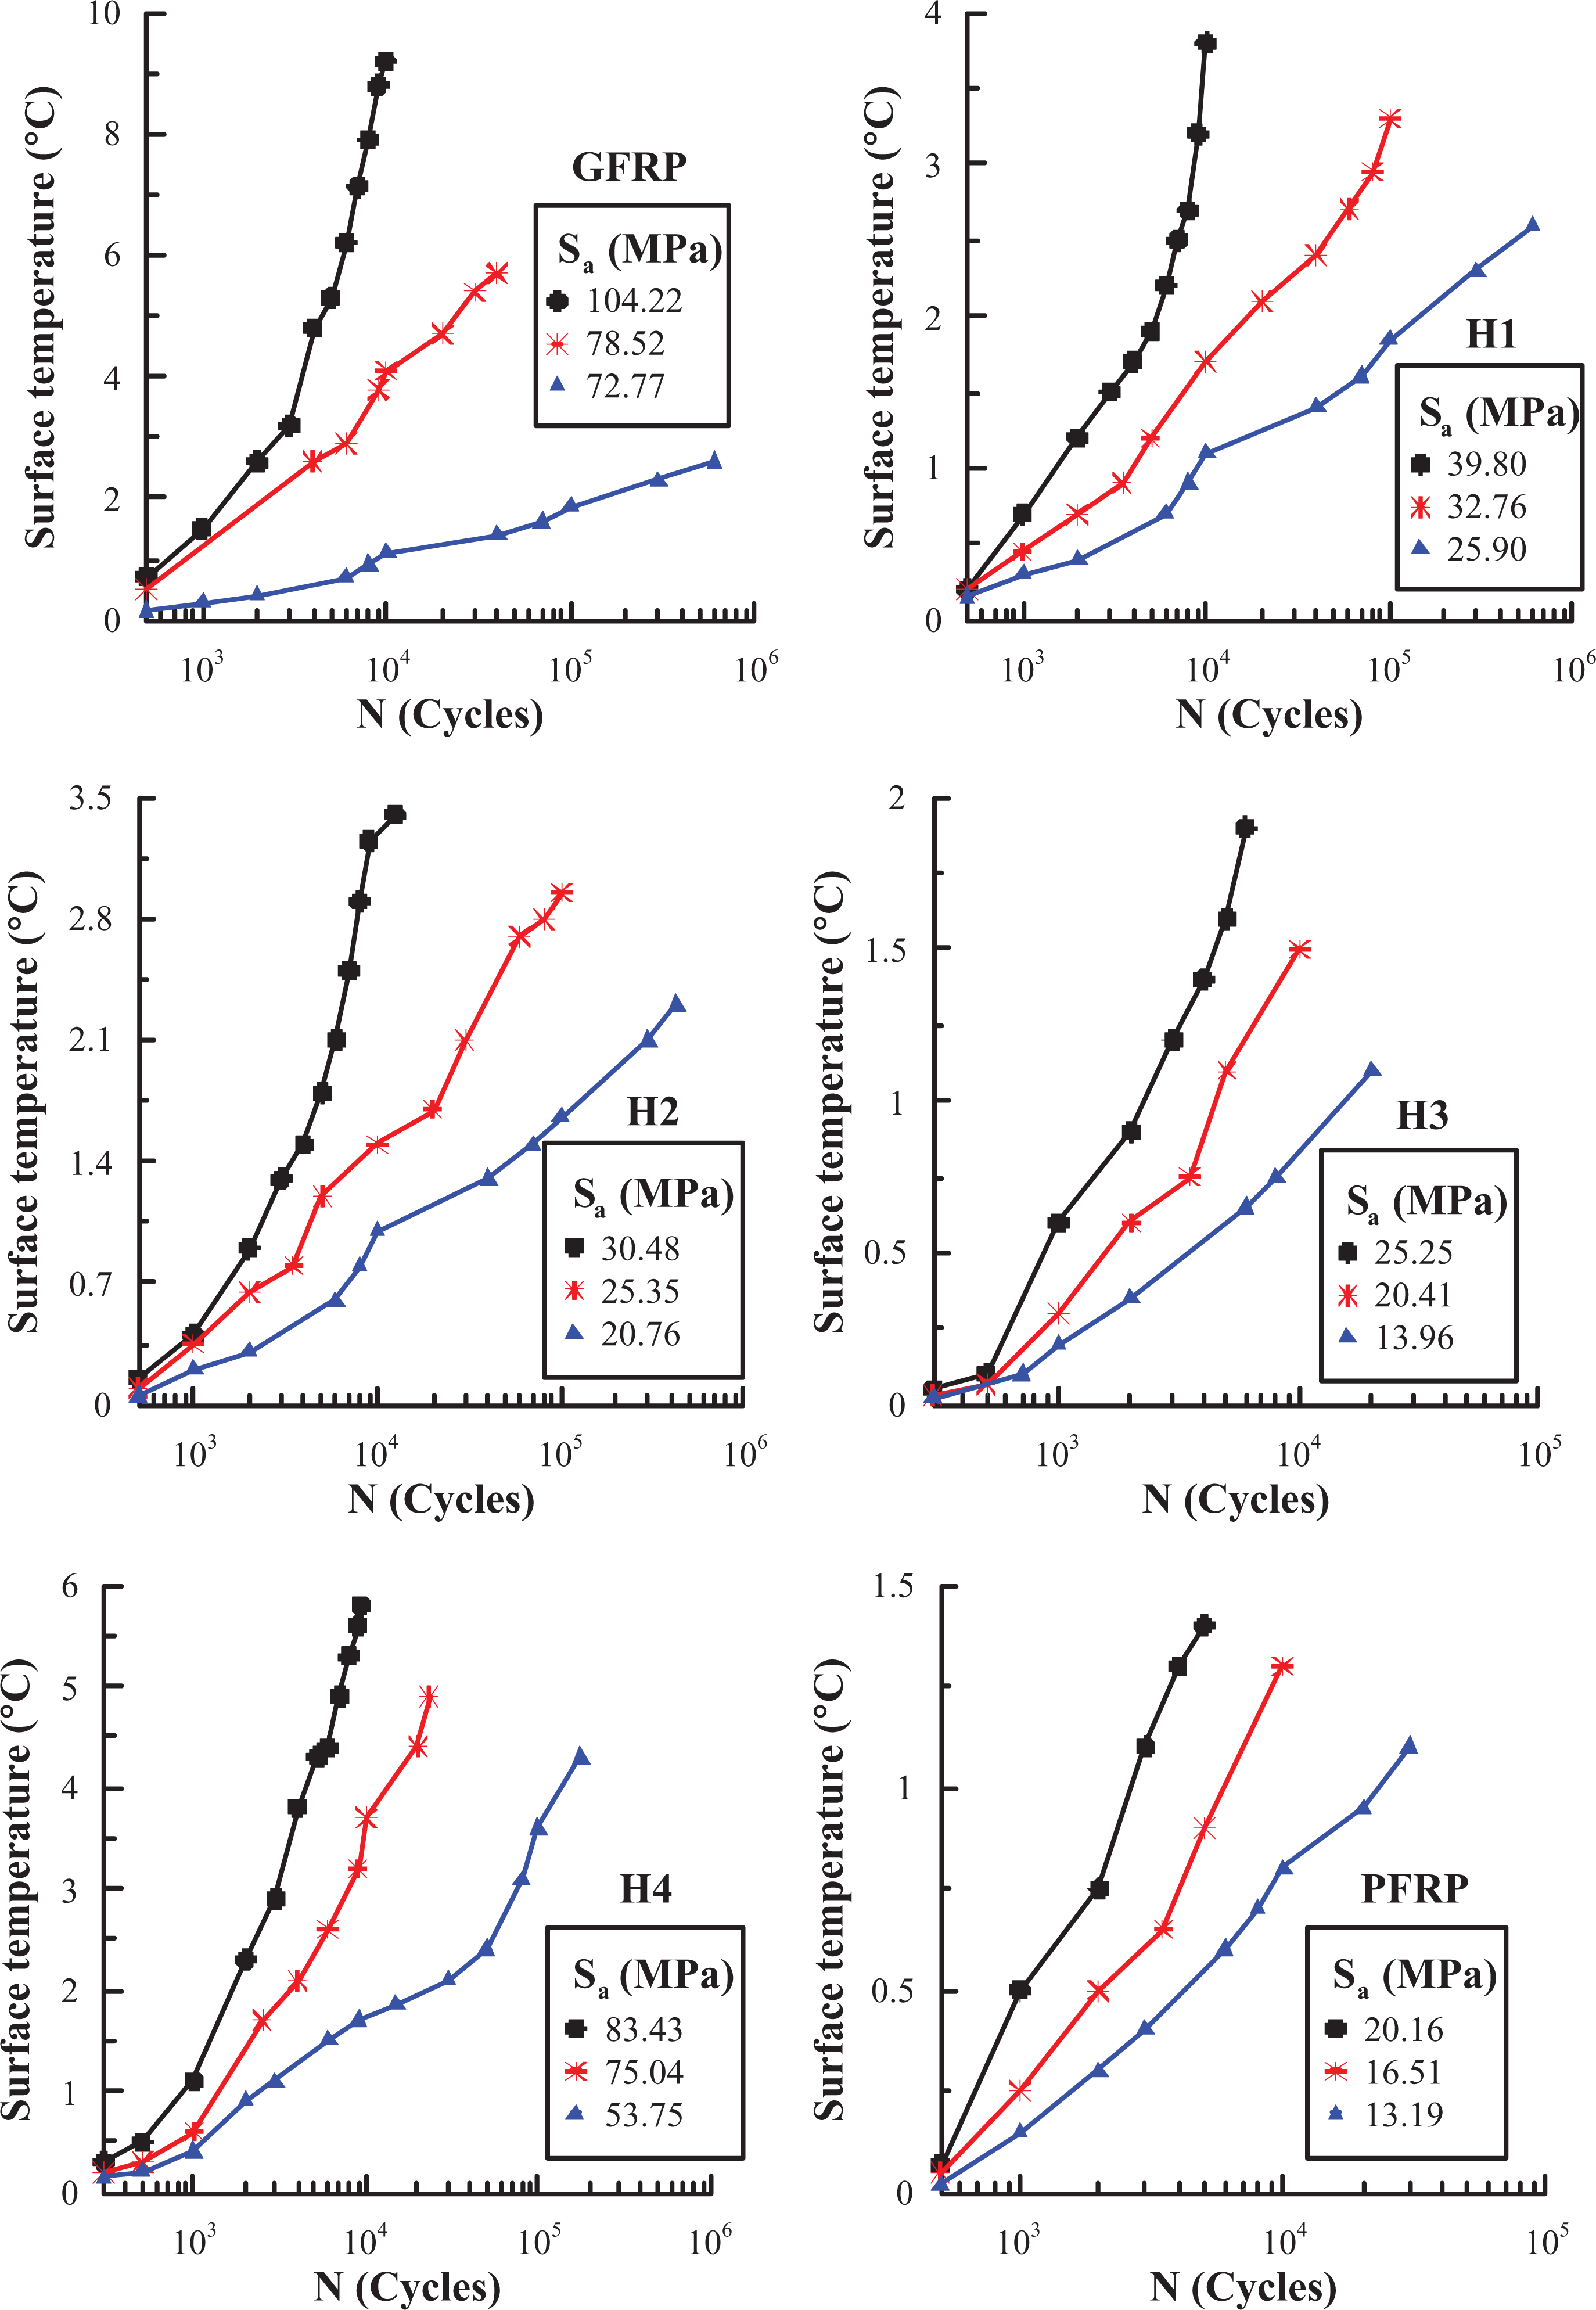
Surface temperature measurement in PP-G fiber–reinforced epoxy dry specimens. PP: polypropylene; G: glass.
It was also found from Figure 9 that the rise in surface temperature of GFRP composite specimens at Sa (MPa) = 104.22, 78.52, and 72.77 is 9.2°C, 5.7°C, and 4.2°C, respectively. The rise in surface temperature of PFRP composite specimens at Sa (MPa) = 25.25, 20.41, and 13.96 is 1.4°C, 1.3°C, and 1.1°C, respectively.
Wet condition
Figure 10 shows the variation in the mid-surface temperature of wet specimens with the number of cycles at different stress levels, Sa . The surface temperature measured in wet specimens was lower than that measured in dry specimens. That is due to the water intake effect. As mentioned above, as Sa increases, the surface temperature increases. The highest surface temperature was observed for GFRP but the lowest was for PRFP. The rise in surface temperature of GFRP composite specimens at Sa (MPa) = 84.22, 68.52, and 62.17 is 4.7°C, 3.7°C, and 2.9°C, respectively. The rise in surface temperature of PFRP composite specimens at Sa (MPa) = 16.13, 13.22, and 12.19 is 1°C, 0.8°C, and 0.6°C, respectively.
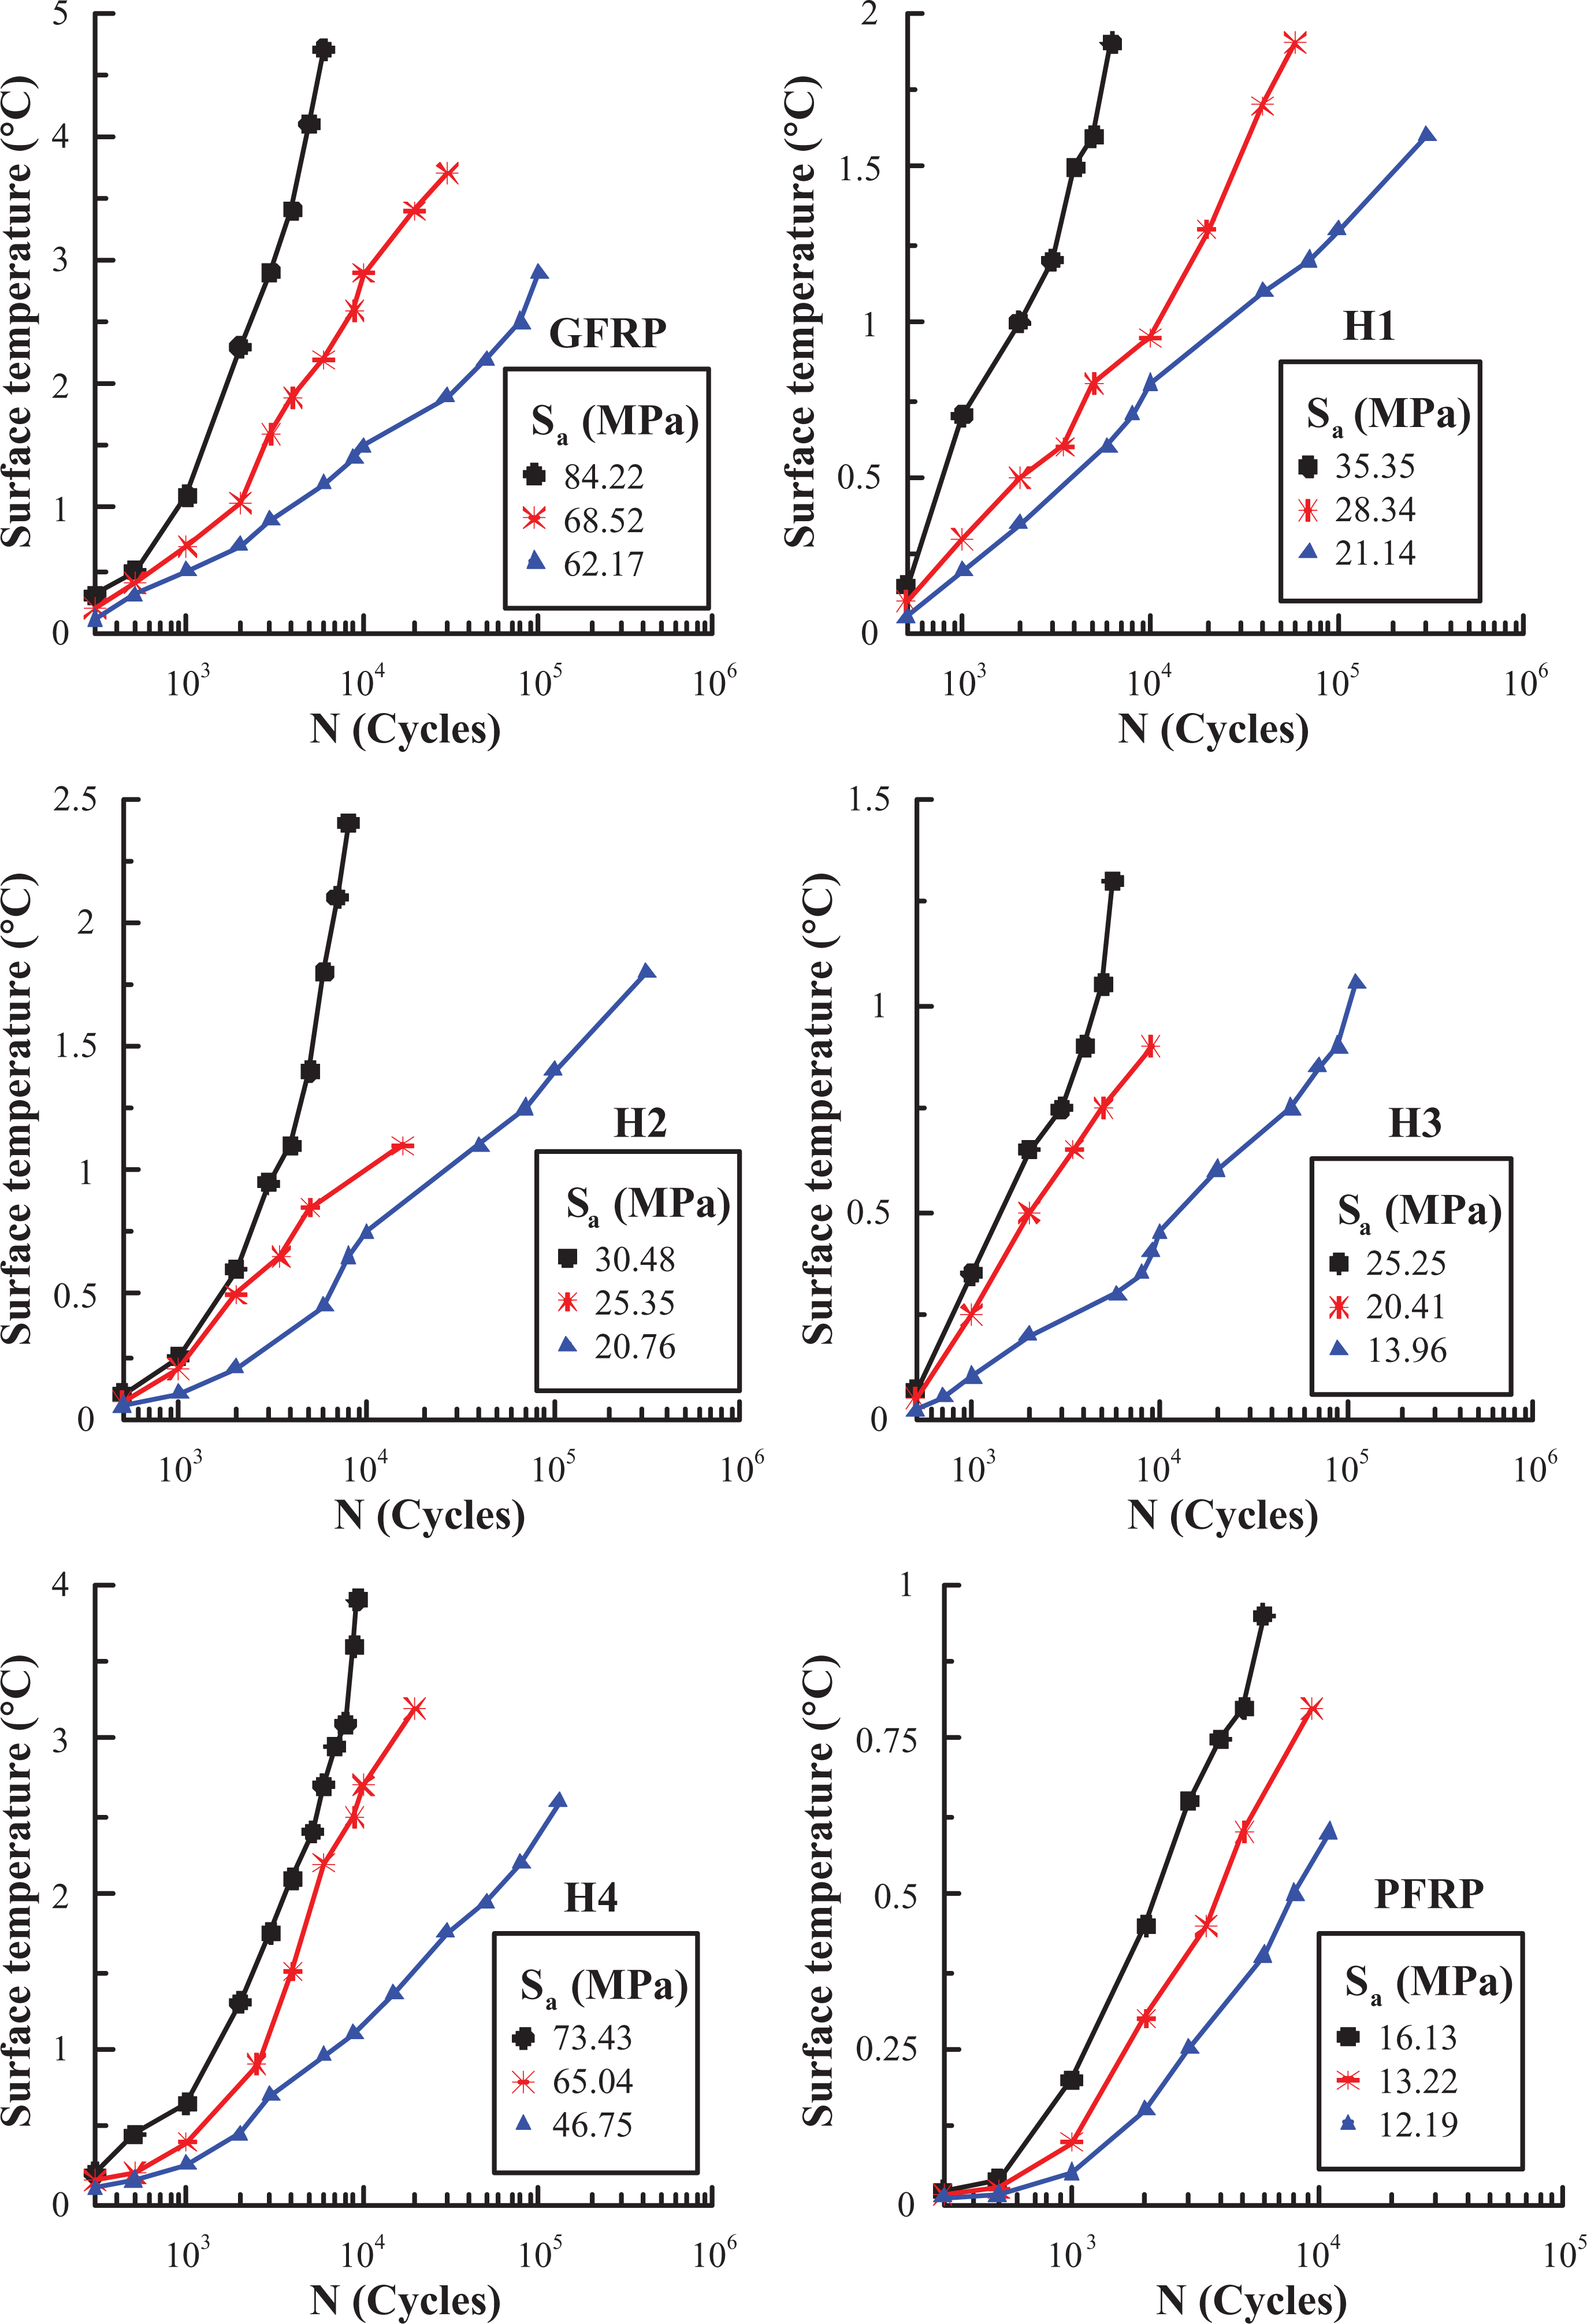
Surface temperature measurement in PP-G fiber–reinforced epoxy wet specimens. PP: polypropylene; G: glass.
Conclusion
The flexural fatigue behavior of PP-G fiber–reinforced epoxy composite laminates has been investigated. The influences of the hybridization process, hybrid configuration, that is, intraply or inter-intraply, and plies stacking sequence on the fatigue behavior have been studied. Both dry and wet specimens were tested. Based on the experimental results, the following remarks can be drawn: PFRP composite exhibits the highest void content compared to the other composites. On contrary, GFRP has the lowest void content. Among the studied hybrids, intraply hybrid, H1, has the lowest void content, while inter-intraply hybrid with glass core, H3, has the highest void content. The water uptake increases as the immersion time increases for all immersed specimens. Water uptake of PFRP composite is the highest while that of GFRP composite is the lowest. Among the studied hybrids, the one with G fiber at the periphery and PP fiber at the core, that is, H4, has the minimum water uptake. Endurance fatigue strength value of GFRP specimens equals 6.57 times that of PFRP specimens. Endurance fatigue strength values of hybrid composites containing (50% PP:50% G) depend on the hybrid configuration and stacking sequence. The S
end for (H4) inter-intraply hybrid composite having external glass layers equals 1.89 times that of (H1) intraply hybrid. Inter-intraply hybrid, H4, having external glass layers has endurance strength 3.58 times that of inter-intraply hybrid with the opposite arrangement, H1. Water ingress has a deleterious effect on the fatigue performance of PP-G fiber–reinforced epoxy composites. Samples subjected to preconditioning in distilled water for 350 days before fatiguing show considerable reduction in fatigue life. The mid-length surface temperature rise of all test specimens, at different stress levels, has been traced and recorded. The maximum surface temperature rise (9.2°C) was observed for GFRP dry specimens at 104.22 MPa. This temperature rise has no effect on specimen and doesn’t cause any early damage. As Sa
increases, the surface temperature rise increases.
Footnotes
Declaration of Conflicting Interests
The author(s) declared no potential conflicts of interest with respect to the research, authorship, and/or publication of this article.
Funding
The author(s) received no financial support for the research, authorship, and/or publication of this article.