
Abstract
The article presents the effect of a lower extrusion speed and compression moulding processes on the thermal properties of polyamide 6 (PA-6)/aerogel composite. Scanning electron and optical microscope images showed that although most of the aerogel was destroyed during extrusion at 65 r/min, extrusion at 5 r/min showed a better retention of the aerogel structure. However, when subjected to moulding in a compression press, both composites extruded at different speeds suffered significant damage. Nevertheless, the extruded samples did show a lower thermal conductivity compared to the virgin polymer. Further, it was observed that the sample extruded at 5 r/min had a lower damage coefficient value with an overall loss of around 33% to the aerogel structure when compared to the material extruded at 65 r/min, which endured a structural loss of 41% to the aerogel in it.
Introduction
Aerogels are materials with a gelatinous structure wherein the liquid is replaced by a gas with almost no shrinkage. 1 This results in an open-celled mesoporous structure producing an ultra-lightweight material. 2 Although the potential applications of the aerogel are numerous, the most significant application is thermal insulation in transport vehicles, portable coolers, cryogenics, pipes, space vehicles, casting moulds and architectural insulation, to name a few, 3,4 due to its low thermal conductivity of 0.012 W/(m K). 5 Additionally, these materials also have low density (3 × 10³–1 × 10⁵ g/m3), low dielectric constant (1.1–2.0), high specific surface area (500–1200 m2/g) and low refraction index (1.05) 6,7 values. These properties make the aerogel a highly promising candidate for a multitude of thermal protection applications. However, the extreme fragility of this material limits its widespread usage. 8
One method of increasing the strength of the aerogel is to use a binding matrix to combine the mechanical strength of the matrix with the thermal properties of the silica aerogel. 3,9 When considering thermoplastic binding matrices, Mielke and Dungen 10 mixed and moulded various combinations of aerogel with a binder containing an aqueous suspension of magnesium montmorillonite and a thermoplastic styrene/butyl acrylate aqueous polymer emulsion. The authors reported that in all the cases, the thermal conductivity of the composite did not exceed 0.020 W/(m K). Vo et al. 11 reported a decrease in the thermal conductivity of an extruded thermoplastic foam when cavities filled with aerogel were introduced in the parent material. According to their work, the thermal conductivity of the extruded thermoplastic foam dropped from 45 mW/(m K) to 30 mW/(m K) for cavities with 9-mm aerogel and to 27 mW/(m K) for cavities with 18-mm aerogel. In another study, Schmidt and Schwertfeger 3 showed that the addition of aerogel to a polyvinyl butyral (PVB) matrix results in a decrease in the thermal conductivity of the material, wherein the addition of around 90% (volume fraction) of aerogel resulted in a thermal conductivity close to 25 mW/(m K) (compared to 120 mW/(m K) for PVB). Kim and Hyun 12 also measured the thermal conductivity of aerogel/PVB composites and discovered that the thermal conductivity decreased significantly when the volume fraction of the aerogel went above 70%. However, the authors noted that dry mixing of these two materials was challenging due to the differences in their material densities. Although the work also considered wet mixing and dual mixing methods to ensure uniformity, the resultant composites had higher thermal conductivity (for the former) and lower modulus of rupture (for both). Williams et al. 13 considered MXD6 polyamide in their work and showed that the thermal conductivity of the aerogel/polyamide composite was around 40% lower than a neat MXD6 sample; however, they also report a breakage of the aerogel particles inside the twin-screw extruder which could affect the thermal performance of the material.
Thus, it is evident from the literature that the inclusion of aerogel in a thermoplastic binding matrix does result in a material with superior thermal insulation properties. However, as was noted by Kim and Hyun, 12 the difference in densities between the materials may result in an inhomogeneous dry mix. One alternative to overcome this limitation would be the use of a twin-screw extruder. These types of extruders have, among other advantages, good mixing abilities, heat transfer, melting and control over a range of temperatures. 14 Additionally, it would be ideal for medium- to large-scale manufacturing as extrusion is a continuous process.
Nevertheless, Williams et al. 13 showed that the extrusion process described in their study damaged the aerogel structure. Therefore, the present study explores the possibility of using a lower extrusion speed to improve the retention of the aerogel structure in the composite. The material under investigation is composed of silica aerogel (henceforth referred to as just aerogel) and polyamide 6 (PA-6/nylon). To achieve its objective, the article compares the thermal conductivity of pure PA-6 samples and composites processed using higher (65 r/min) and lower (5 r/min) extrusion speeds by measuring their density, specific heat and the thermal diffusivity values.
Material and methods
To prepare the test specimens, the aerogel and the PA-6 pellets were manually mixed, extruded and chopped in a pelletizer. The material was subsequently moulded into its final shape using a compression press, as this would enable further insight into the effect of the shape forming process on the final properties of the material. The following subsections present the detailed preparatory and manufacturing stages together with assessment techniques used to determine various properties of the material.
Sample preparation
Cabot (Boston, USA) Enova Aerogel IC3110 (particle size 100–700 μm) and Lanxess (Cologne, Germany) Durethan B30 polyamide 6 (PA-6) were used as base materials for the samples. Three different batches were extruded and compression pressed into plaques. The details of these batches are: Pure PA-6; run through the extruder twice at 65 r/min (sample A) PA-6 with 0.04 (mass fraction) aerogel; run through the extruder twice at 65 r/min (sample B) PA-6 with 0.04 (mass fraction) aerogel; run through the extruder once at 5 r/min (sample C)
The nylon pellets were initially heated in an oven at 80°C for 180 min to remove moisture. Next, in order to prepare samples B and C, 0.04 mass fraction of aerogel was added to each sample before extrusion and poured into the feeder as one material.
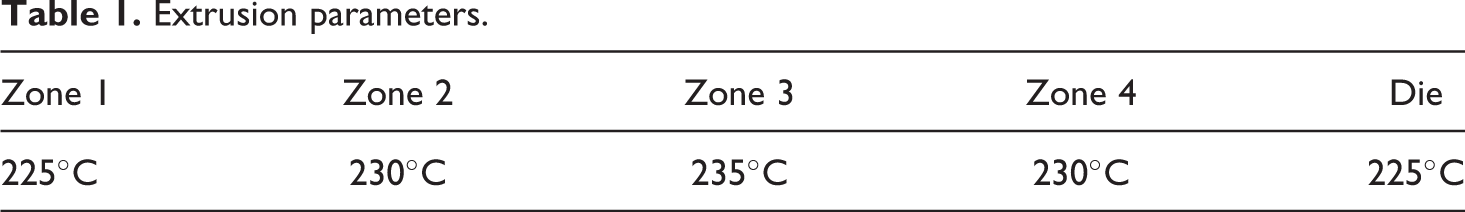
A Rondol (Nancy, France) twin-screw extruder with the processing temperatures as set in Table 1 was used to extrude the aerogel and the material was then compressed using the press.
Extrusion parameters.
The extruded material (samples A, B and C) was heated at 110°C for 270 min to remove any moisture. Then, it was poured into the mould, which was then placed inside the preheated compression press (230°C). Initially, both the moulding plates were brought into contact with the mould containing the sample material to facilitate heat conduction into the sample for 11 min. After this, the pressure was increased to 2.76 MPa for a further 5 min. The sample was allowed to cool inside the press for 65 min (maintaining a pressure of 2.76 MPa). Finally, the mould was removed from the press and left to cool to room temperature outside. For samples B and C, the hold time was increased from 11 min to 13 min to account for the presence of the silica aerogel.
Characterization of microstructural and thermal properties
This section presents the various methods used to measure the properties of the pure epoxy and aerogel/epoxy composites. These properties include density, specific heat capacity and thermal diffusivity. The microstructure of the samples is further characterized using optical and environmental scanning electron microscopes.
Density
The density of each individual plaque (sample) was determined by the equation used to calculate the density of a solid, uniform body. 15 The mass of the sample was measured using a weight balance and the volume was calculated by measuring the dimension of the plaques using a line gauge.
Differential scanning calorimetry (DSC)
One sample from each batch was subjected to a DSC run in a TA Instruments 2920 MDSC instrument. The sample was heated to 400°C at 5°C/min under a nitrogen gas flow. The recorded data were then used to calculate the specific heat capacity for each individual sample using the method outlined by O’Neill. 16
Thermal diffusivity
The thermal diffusivity of each batch was measured using a Thermal Wave Imaging ThermoScope II pulsed thermographic inspection system 17 equipped with a FLIR SC7600 MB Infrared camera. The frame size used was 640*512 pixels (full frame) and the flash pulse length was 10 ms. The acquisition time and frequency were 50 s and 25 Hz, respectively.
Morphology
The structure of the pressed plaques was studied under a Nikon Optiphot Image Acquisition system with a Leica Application Suite software (Version 4.8.0); magnifications of 5 × and 40 × were used. Further, the morphology and the chemical composition of samples were analysed using a Philips XL30 ESEM environmental scanning electron microscope (ESEM) fitted with an energy-dispersive X-ray spectroscope (EDX).
Thermal conductivity
To calculate the thermal conductivity of the samples, the following formula was used (equation (1)).

where k = thermal conductivity in W/(m K), α = thermal diffusivity in m2/s, ρ = density in g/m3 and c = specific heat in J/(g K).
Results
The data from the various experiments are as presented below. Initially, the microstructures of the extruded material (all three samples) were analysed under a scanning electron microscope (SEM) and an optical microscope. Then, the density, thermal diffusivity and the specific heat capacity of the materials were measured using the methodology identified in the previous section.
Morphology
SEM-EDX
SEM-EDX results of the extruded samples before being compression moulded are as seen in Figures 1 to 3 for samples A, B and C, respectively. From the EDX results, it can be inferred that silica was detected in samples B and C. However, further analysis on sample B (Figure 4) showed an almost continuous presence of silicon and oxygen across an extruded piece, thereby suggesting a uniform dispersion of silica. Additionally, the visual image of the SEM showed homogeneity across the cross section. Therefore, it can be concluded from the results that although sample B had silica along with PA-6, the structure of the aerogel had collapsed (almost completely) and only particles of silica have been dispersed uniformly in the PA-6 matrix.
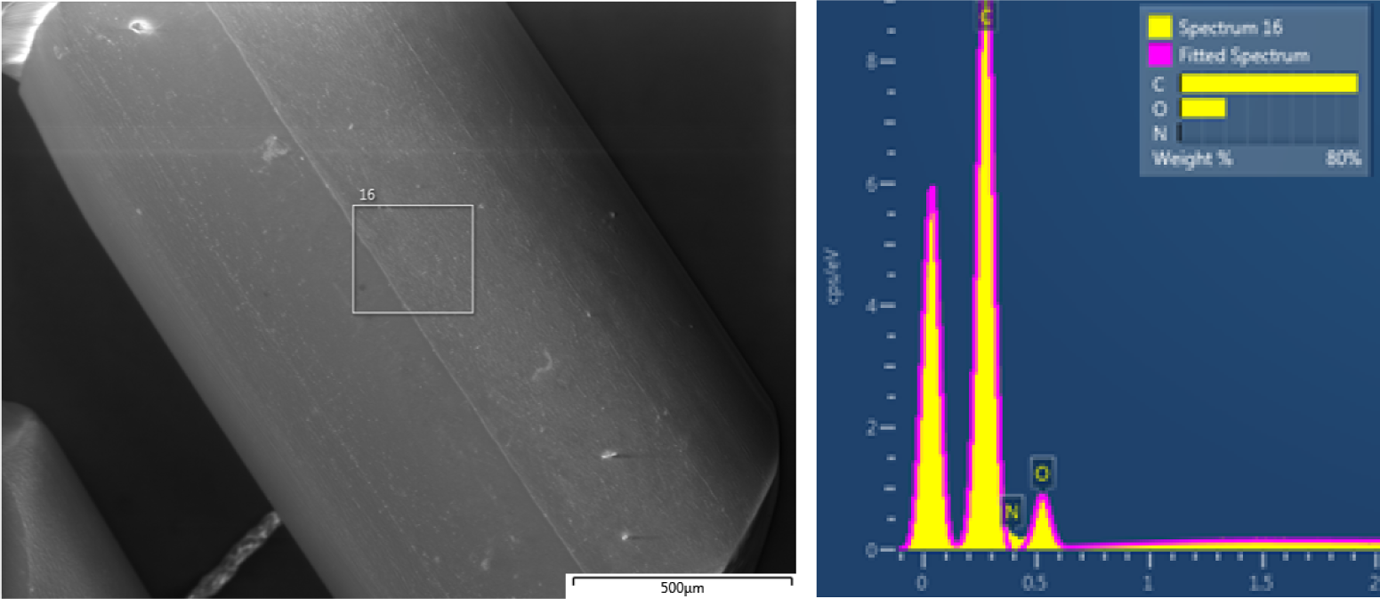
ESEM and EDX results of extruded PA-6 (sample A). The image on the left is the ESEM image of the sample and the spectra on the right correspond to the EDX spectra of the selected area in the microscopic image. X-axis in keV. ESEM: environmental scanning electron microscope; EDX: energy-dispersive X-ray spectroscope; PA-6: polyamide 6.
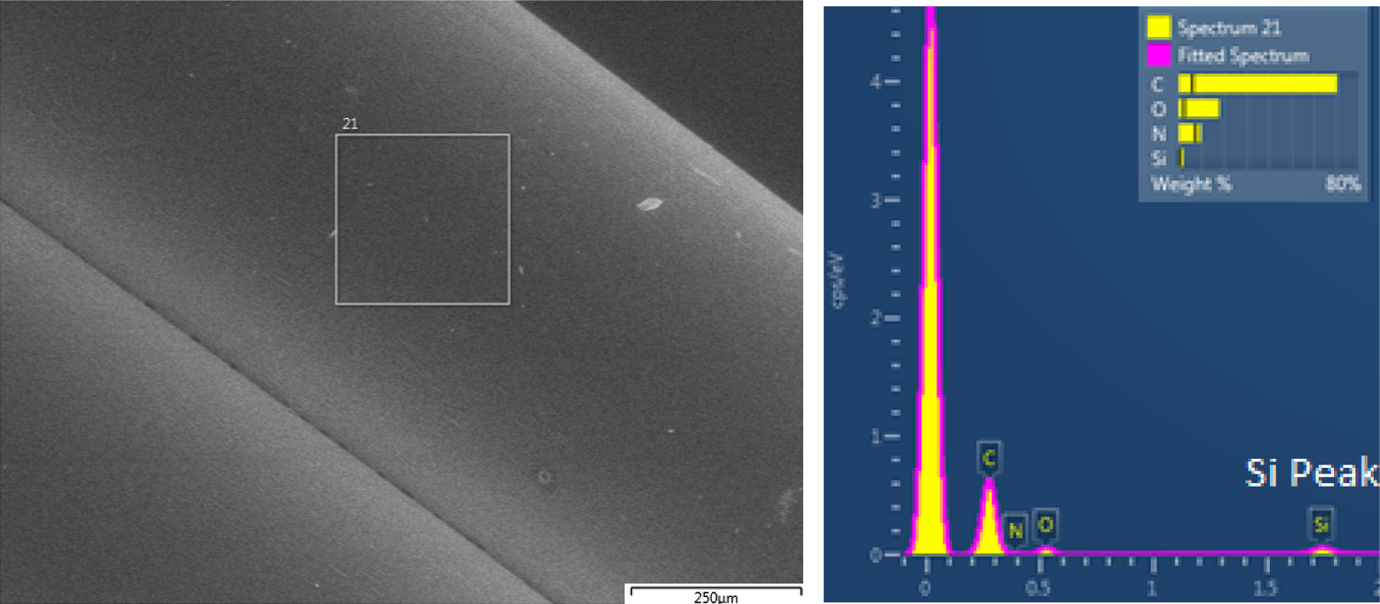
ESEM and EDX results of extruded PA-6 with SiO2 (sample B). The image on the left is the ESEM image of the sample and the spectra on the right correspond to the EDX spectra of the selected area in the microscopic image. X-axis in keV. ESEM: environmental scanning electron microscope; EDX: energy-dispersive X-ray spectroscope; PA-6: polyamide 6; SiO2: silica.
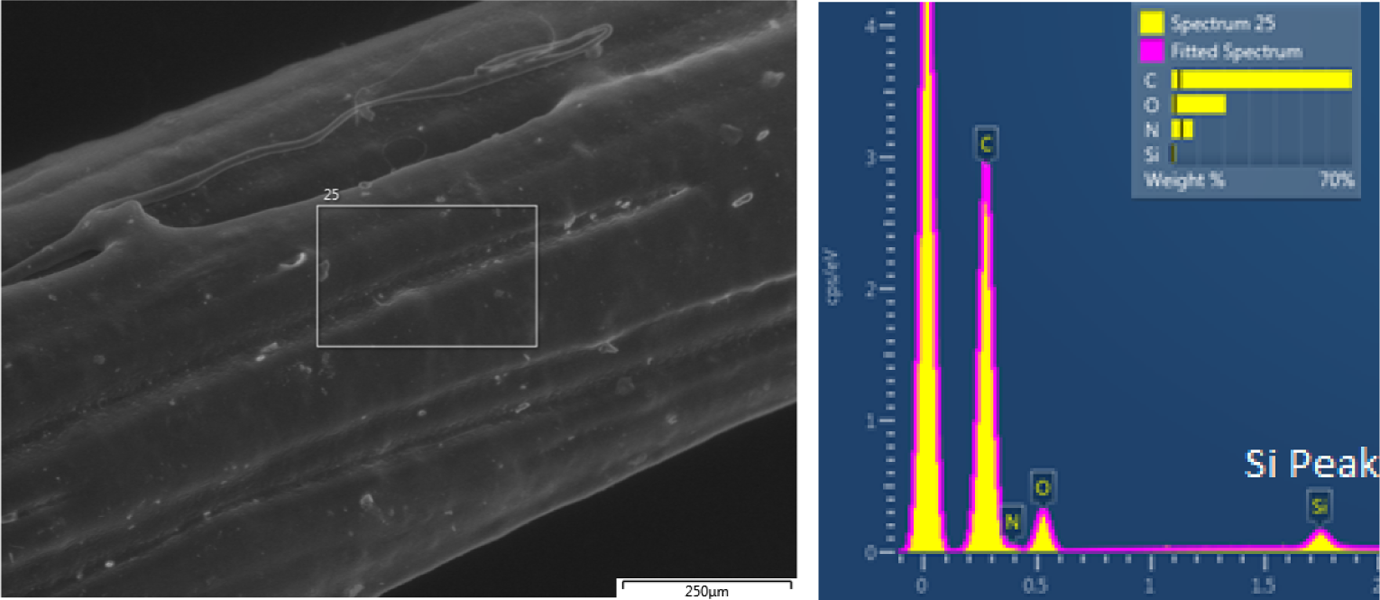
ESEM and EDX results of extruded PA-6 with SiO2 (sample C). The image on the left is the ESEM image of the sample and the spectra on the right correspond to the EDX spectra of the selected area in the microscopic image. X-axis in keV. ESEM: environmental scanning electron microscope; EDX: energy-dispersive X-ray spectroscope; PA-6: polyamide 6; SiO2: silica.
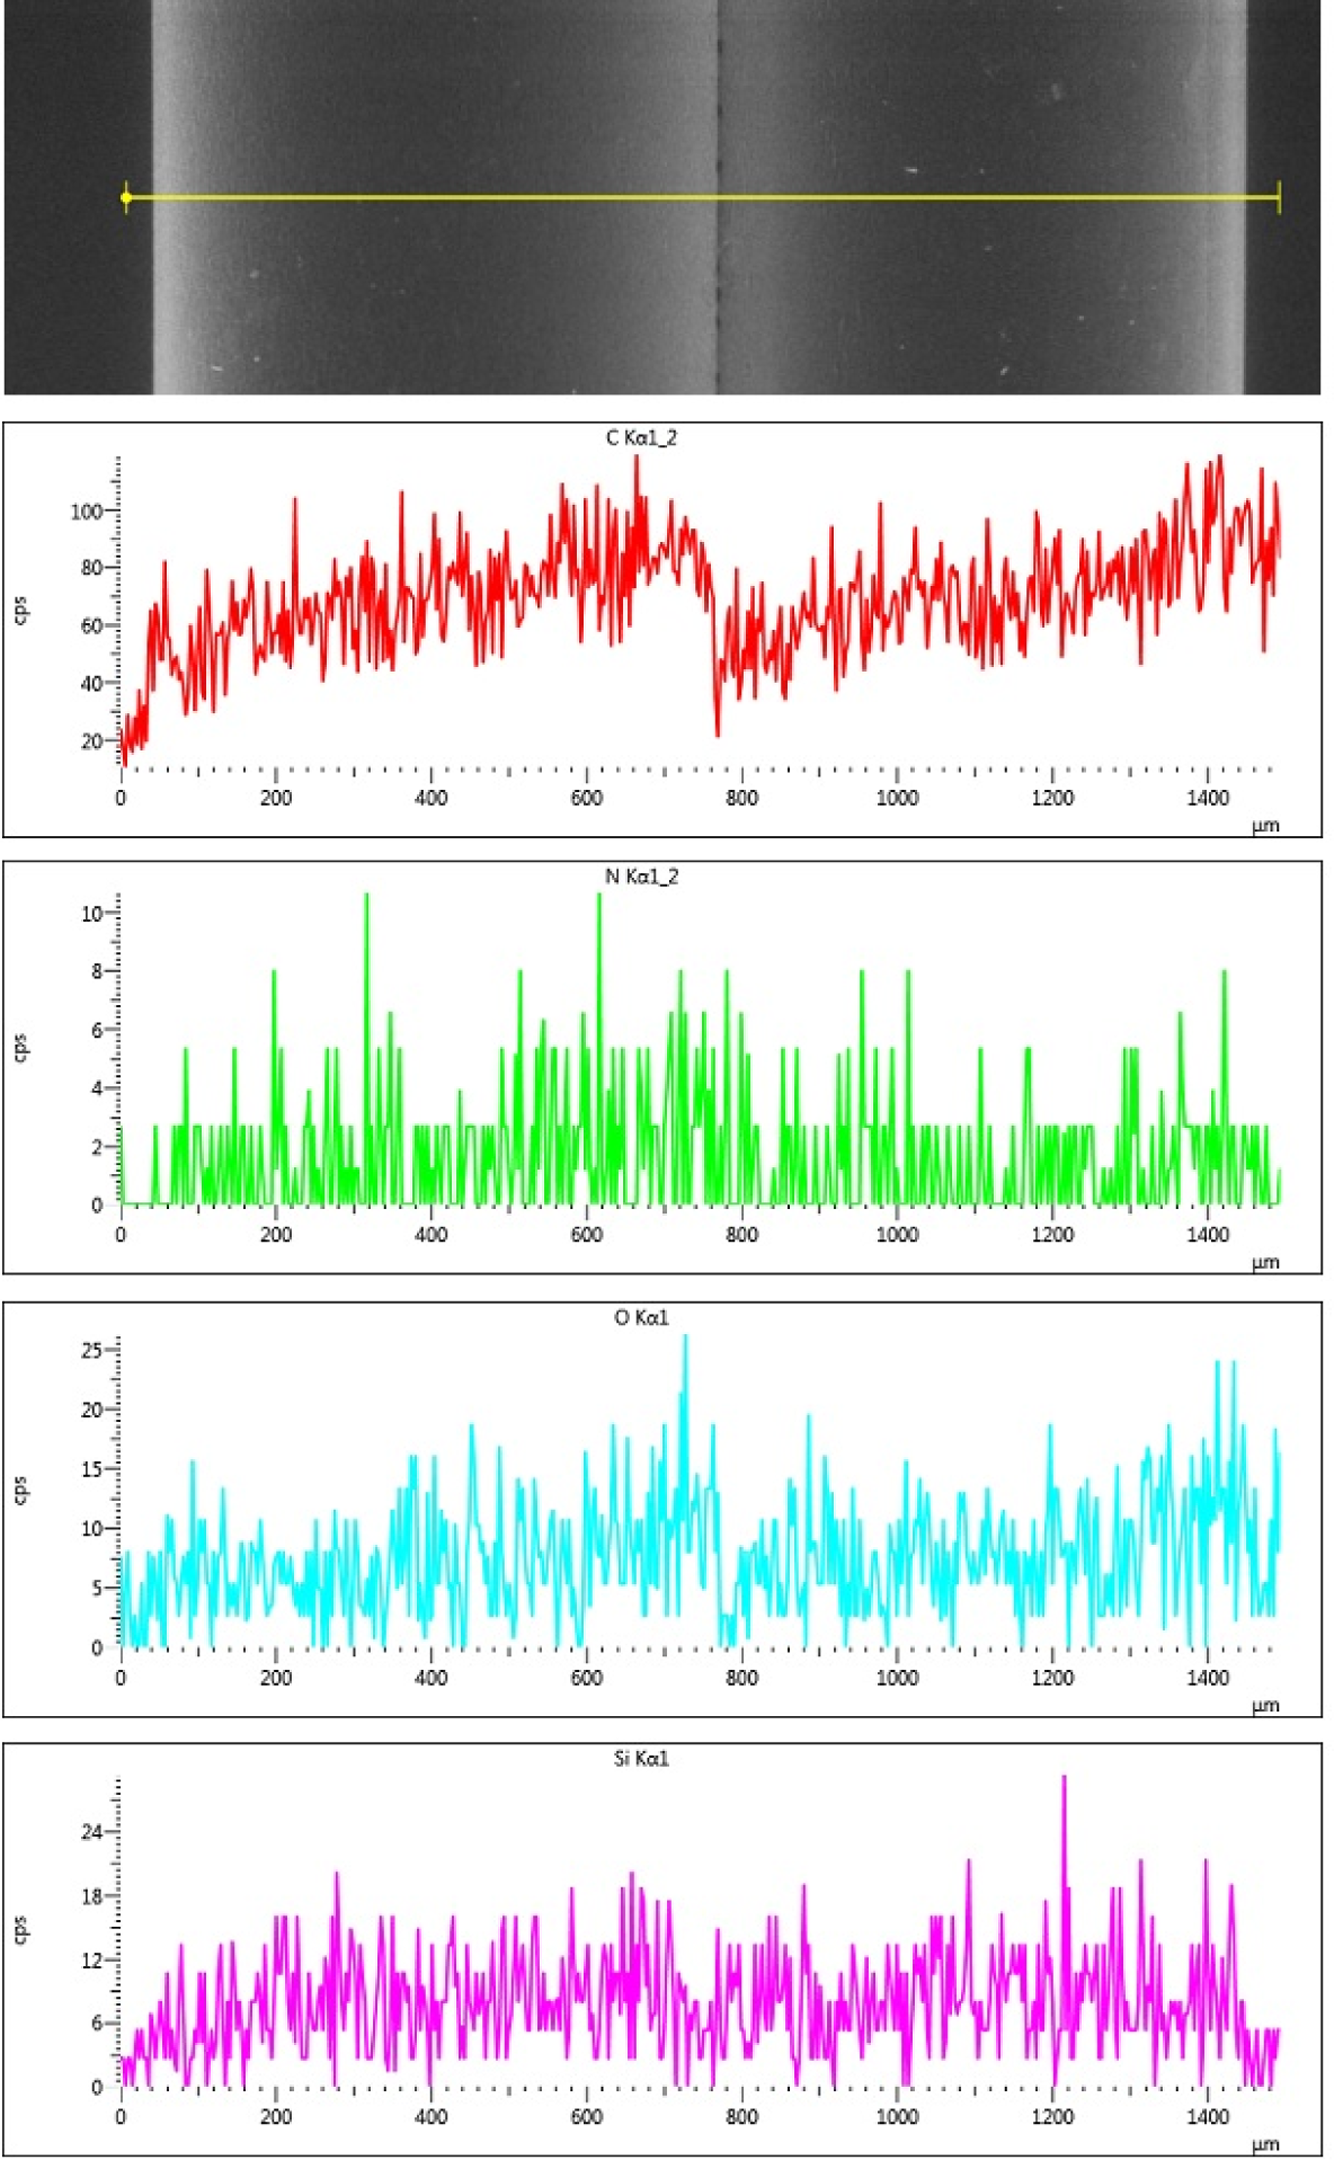
Line scan of a single extruded particle through SEM–EDX of sample B for (top to bottom) carbon (red), nitrogen (green), oxygen (blue) and silicon (purple). The vertical centre line in the sample is due to the application of a twin head die on the extruder and the subsequent joining of the two threads. SEM: scanning electron microscope; EDX: energy-dispersive X-ray spectroscope.
The SEM image (Figure 3) of sample C showed a more coarse structure when compared to the previous samples; although some extruded pieces of sample B did show some roughness, sample C had significantly more roughness which can be evidenced from the SEM scans. In addition, the sample was also scattered with small particle-like structures. When one of the structures was analysed (Figure 5), the EDX revealed a higher amount of silicon and oxygen compared to the matrix and previous samples. This was also confirmed by the weight percentages of the various elements (in sample C) as shown in Table 2. When compared to an area, shown in Figure 3 and represented as Spectrum 25, it was noticed that the particle (represented as Spectrum 29) has a higher silicon content (increased from 1% to 11.73%) and oxygen content (increased from 20.95% to 33.07%). It is believed that this could either be a result of agglomeration of the silica particles during processing or the retention of the aerogel structure, wherein these particles are the unmodified silica aerogel.
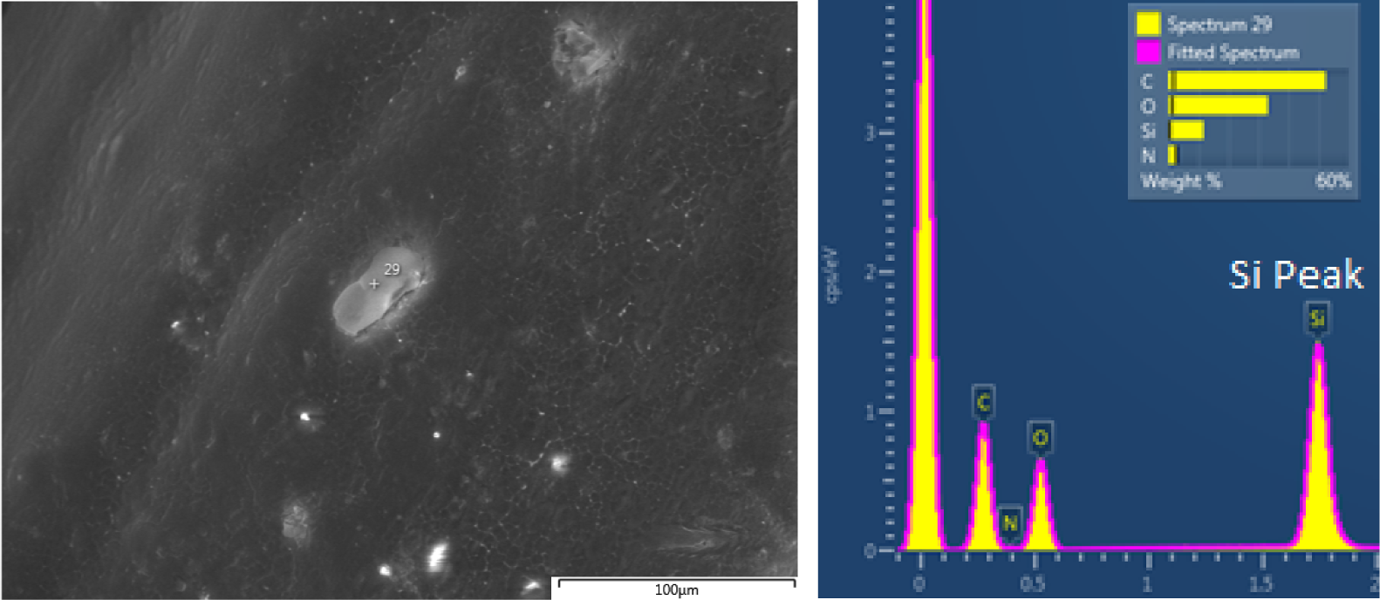
ESEM and EDX of a particle present in sample C. The image on the left is the ESEM image of the sample and the spectra on the right correspond to the EDX spectra of the selected spot in the microscopic image. X-axis in keV. ESEM: environmental scanning electron microscope; EDX: energy-dispersive X-ray spectroscope.
Weight percentages of the EDX spectrums of sample C.
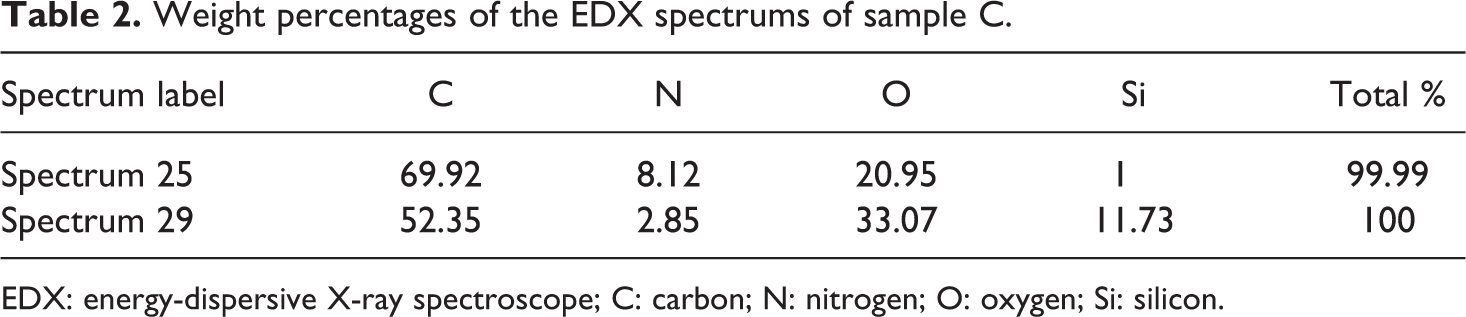
EDX: energy-dispersive X-ray spectroscope; C: carbon; N: nitrogen; O: oxygen; Si: silicon.
Optical microscope
The optical microscope showed a similar structure between samples A and B; however, the ESEM and EDX results (discussed in the previous section) confirmed the presence of silica in sample B, thereby suggesting that the aerogel structure completely collapsed in sample B. Further, Figure 6 indicates certain particle-like structures (circled in white) in sample B. It is believed that these are the silica particles that resulted from the destruction of the aerogel structure.
Sample B with possible Si particles (circled in white). Si: silicon.
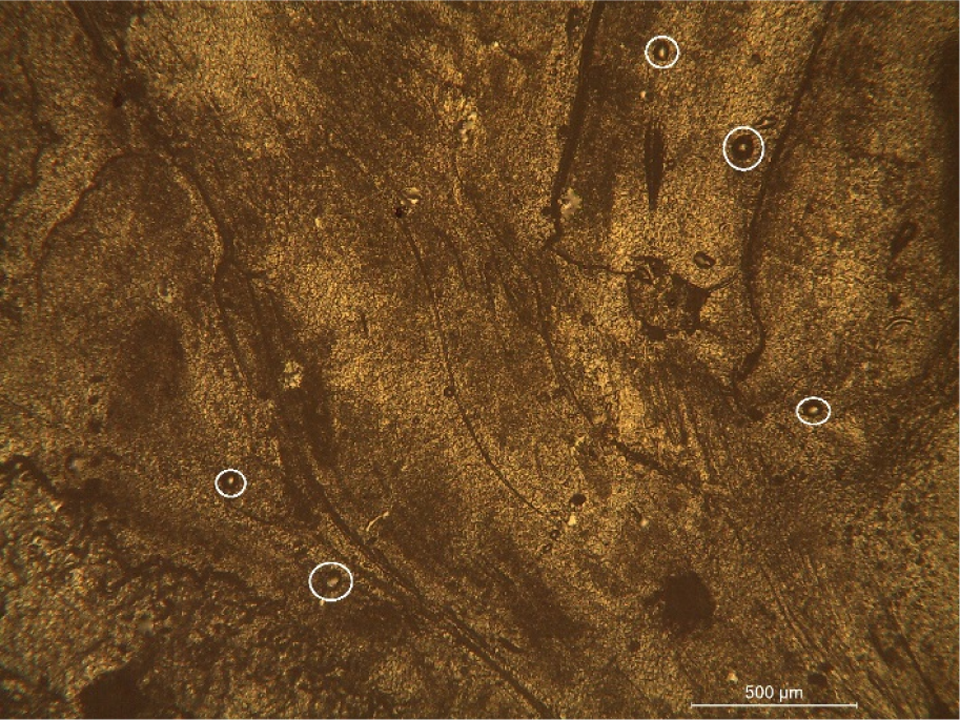
Sample C, on the other hand, showed a different morphology compared to samples A and B. Additionally, there were certain regions within the sample that were darker (Figure 7) suggesting the presence of silica; these regions being larger than the individual particles in sample B. It can also be inferred from the results that the aerogel structure was not completely destroyed as the silica particles stayed together. It is also possible that the pores within the aerogel could have been filled with the PA-6 matrix during extrusion and compression pressing. Thus, the single run at 5 r/min showed an improvement compared to the previous attempts.
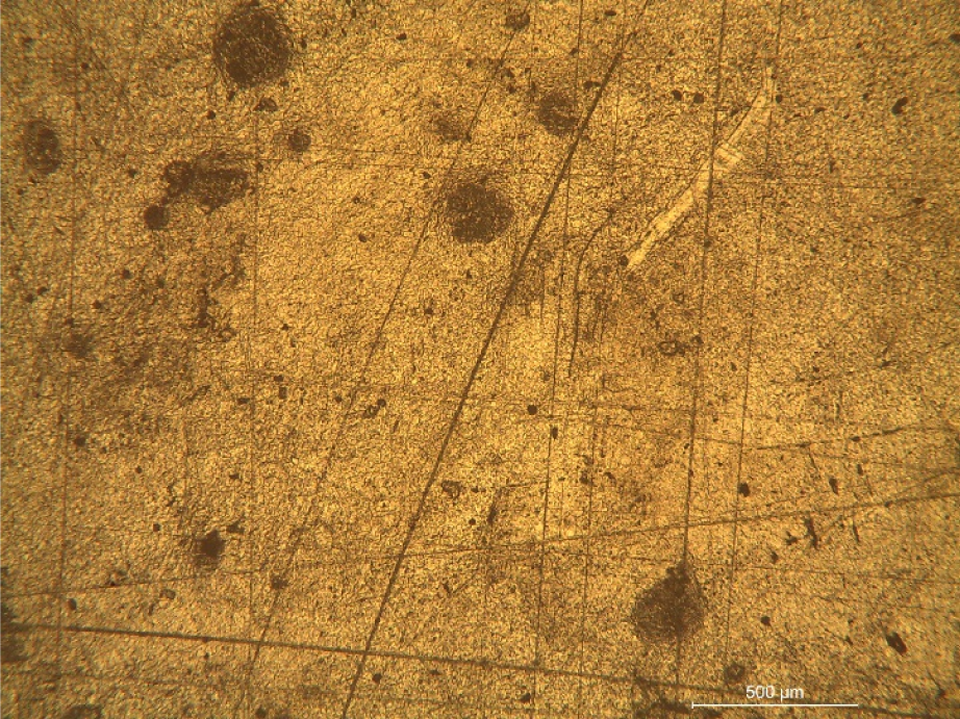
Sample C.
Density
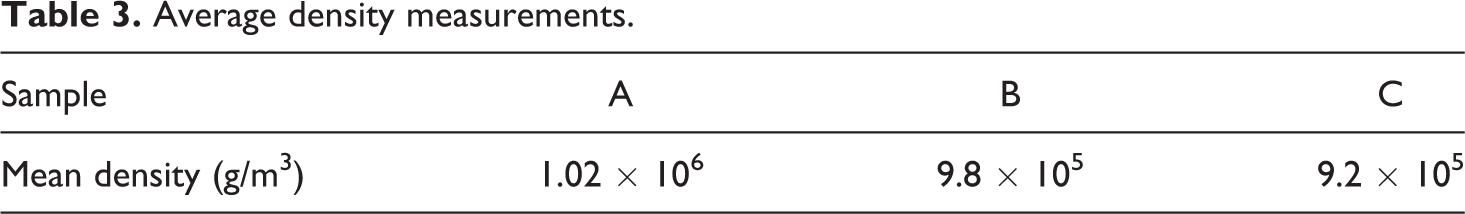
The density measurements were carried out on the compression-moulded plates for the three samples. The mean density for each sample are as tabulated in Table 3. To calculate the mean density, the density of the three different specimens per sample was measured and then averaged. The results show us that the density of pure PA-6 is 1.02 × 10⁶ g/m3 which agrees well with the manufacture’s number of 1.14 × 10⁶ g/m3. 18 The difference in the values could be due to the reduced accuracy of the measurement techniques used in the current work; the dimensions of the samples were measured using a line gauge, which has a least count of 1 mm. However, the samples with the aerogel (B and C) show slightly decreased densities of 9.8 × 10⁵ g/m3 and 9.2 × 10⁵ g/m3, respectively: possibly due to the contribution of aerogel in the material. As predicted, sample C showed the lowest density, which could be due to their improved ability to retain the aerogel structure.
Average density measurements.
Thermal diffusivity
Three samples were tested for thermal diffusivity, the average value for each type of sample was calculated 19 from the results obtained; one such set of diffusion maps is given in Figure 8. Table 4 lists the average mean diffusivity and standard deviation values for the three samples; the average values were calculated using the mean diffusivity and the standard deviation measurements across the three different specimens for each sample.
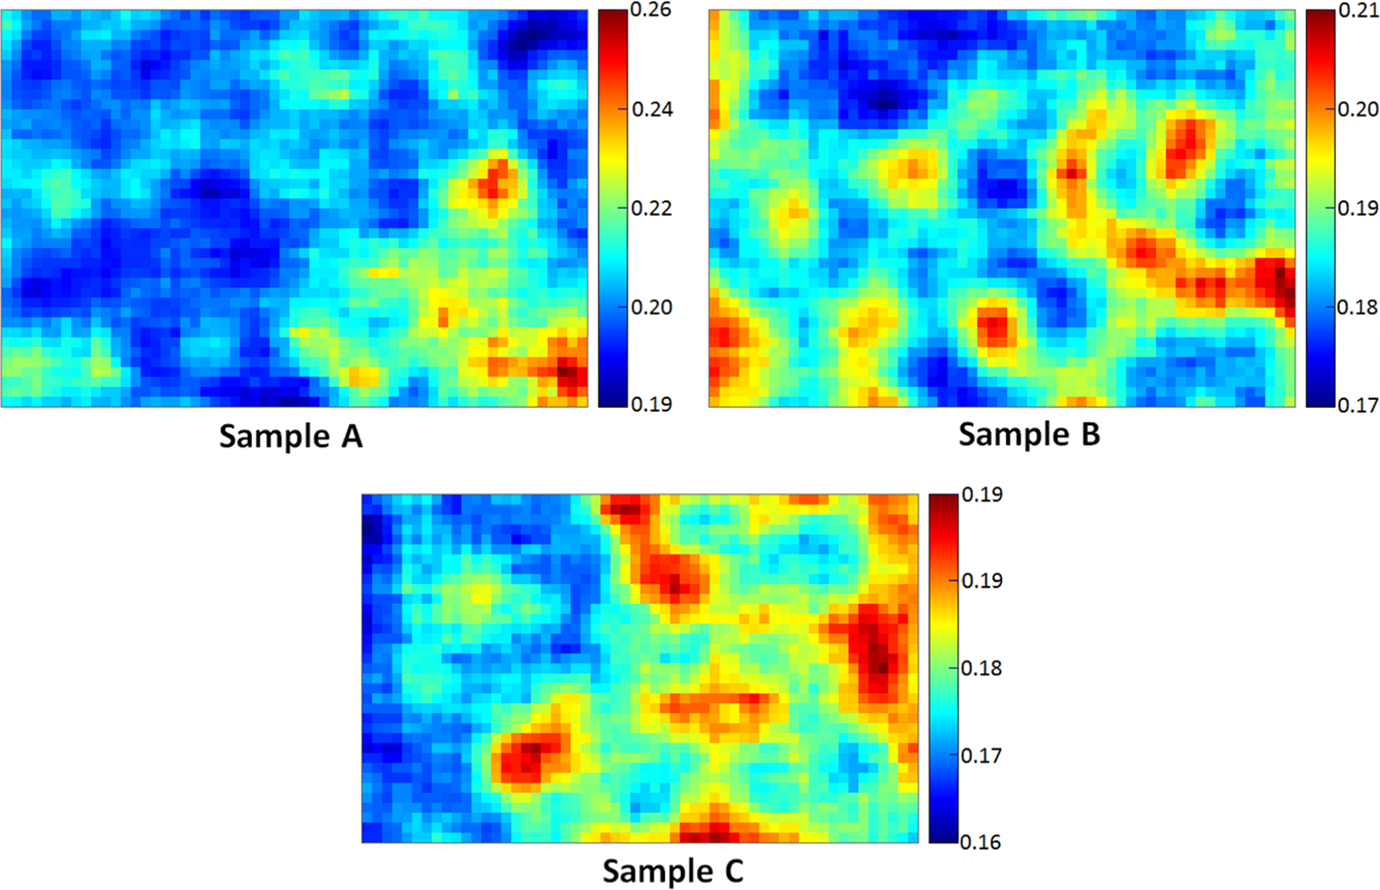
Thermal diffusivity maps of samples A, B and C where the diffusivity is indicated by the colour bar.
Average diffusivity and standard deviation values.
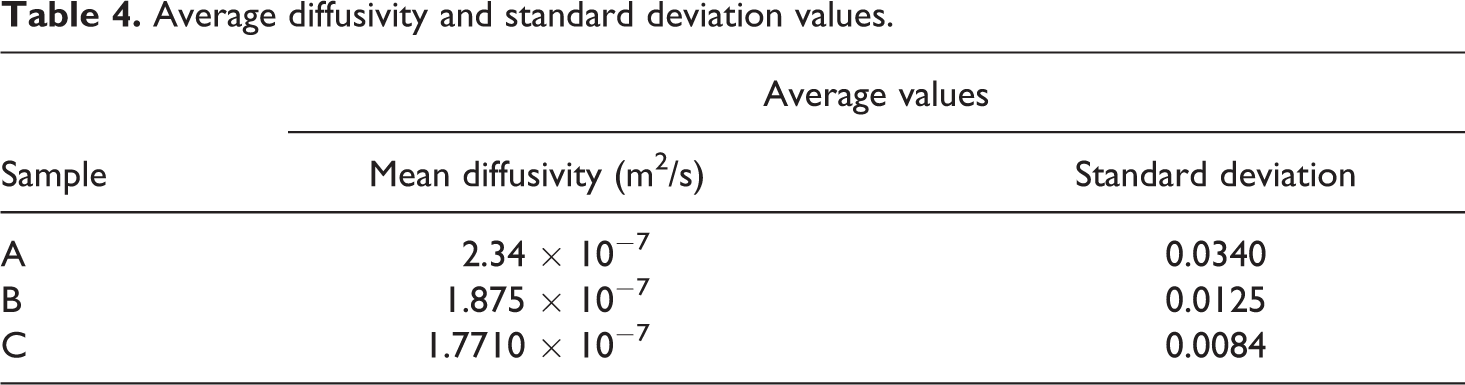
From the measurement results in Table 4, it was observed that the PA-6/aerogel composites showed lower diffusivity values compared to the pure PA-6 sample, thereby pointing to greater thermal insulation. Additionally, sample C showed the lowest mean diffusivity value of 1.7710 × 10⁻⁷ m2/s, confirming that the softer conditions during extrusion and pressing contributed to an improved thermal performance by retaining more aerogel (and its structure) within the composite. Further, it should be noted that the sample had the lowest average standard deviation suggesting that the sample has conducted heat more uniformly across a given cross section, thereby providing a potentially stronger thermal fatigue performance.
Specific heat capacity
The DSC profiles along with the baseline and sapphire standard calibration (both of which are needed for the specific heat calculation) for samples A, B and C are given in Figure 9. From the graphs, it was observed that there is an endothermic peak close to 225°C for all the samples. It is believed that this was due to the melting of PA-6, which, according to the manufacture’s data, 20 is at 222°C. Furthermore, sample C also showed an endothermic peak at around 395°C (unlike the other two samples) which was in addition to the previously mentioned endothermic peak at 225°C.
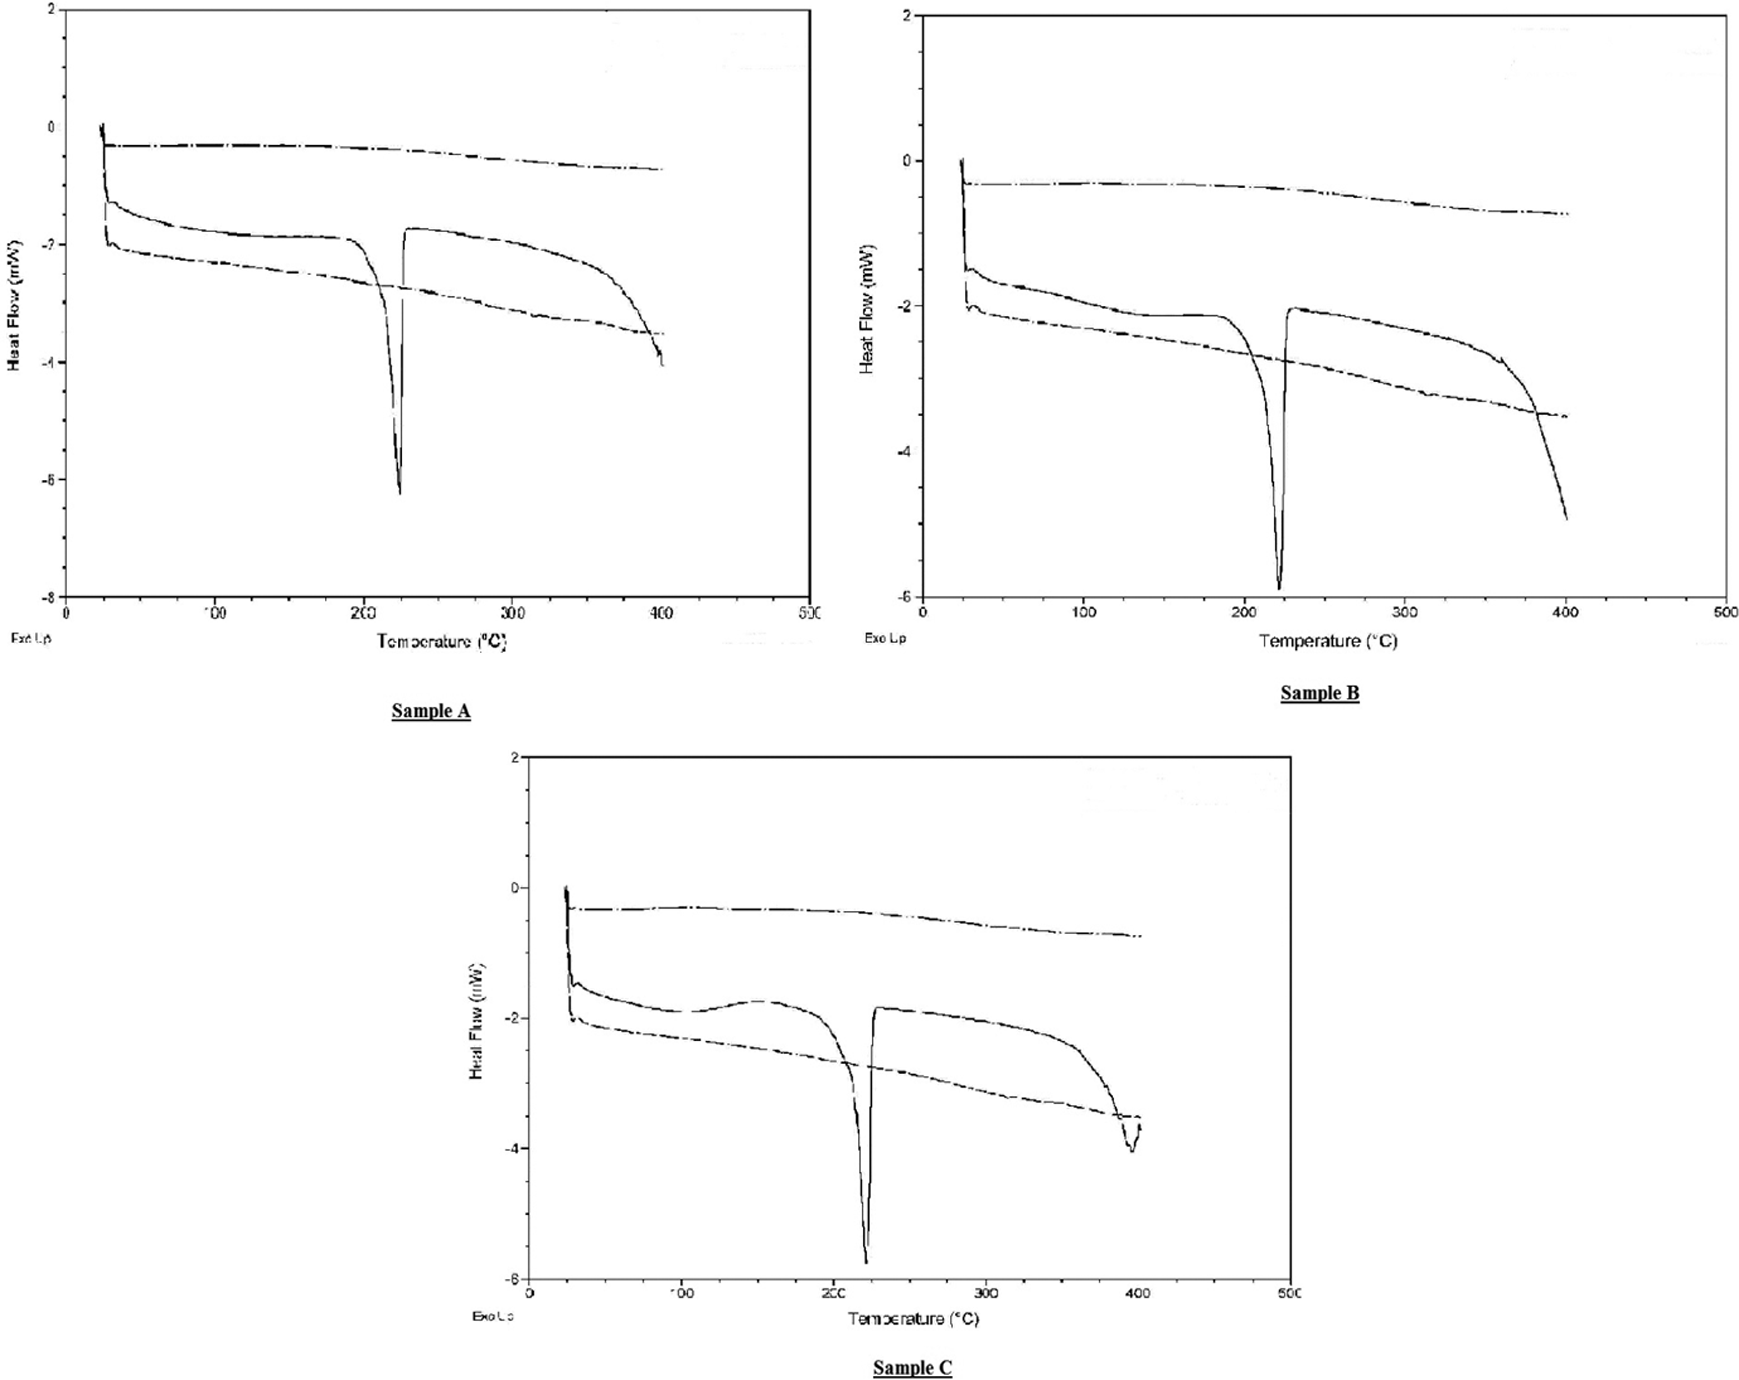
DSC maps of samples A, B and C (solid line) with the baseline (dashed and dotted line) and sapphire standard (dashed line) curves imposed on them. The heat flow (in mW) is on the y-axis and the temperature (in °C) is on the x-axis. DSC: differential scanning calorimetry.
The endothermic peak at 395°C in the DSC of sample C is thought to be due to the thermal degradation of nylon. Although the peak is only seen in sample C, a similar trend is observed in the other DSC graphs for samples A and B and it is predicted that they too will show an endothermic speak (at a higher temperature). The reason for sample C’s premature peak could be due to the destabilizing effect of the aerogel as described by Levchik et al. 21 The authors studied the thermal decomposition of nylon 6 along with various fire retardants and concluded that the destabilization of nylon 6 could reduce the thermal decomposition temperature by as much as 70°C (as in the case of ammonium polyphosphate).
Calculations
Specific heat capacity
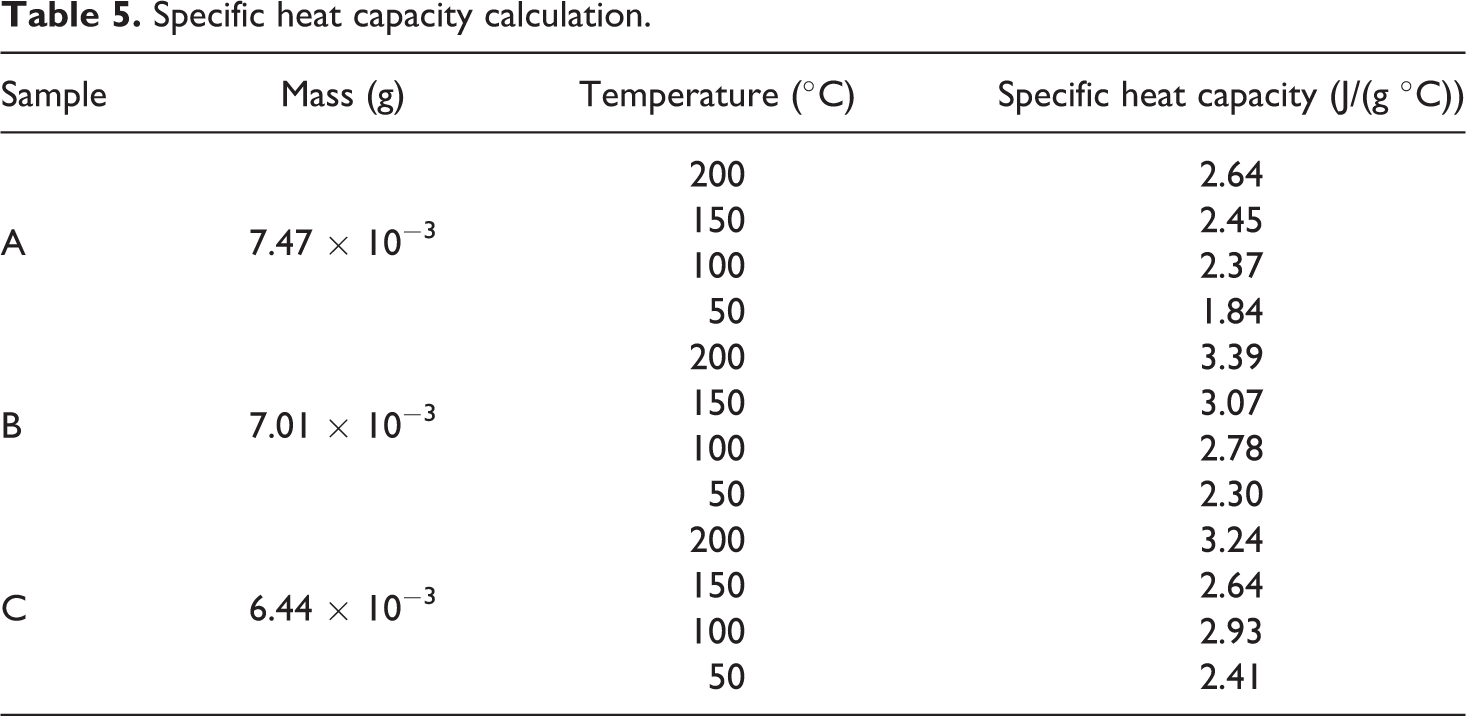
The specific heat capacity of the samples was calculated using the DSC curves in Figure 9. The values of the specific heat capacity of the sapphire standard were taken from Ditmars et al. 22 and the mass of the reference sample was measured to be 0.02626 g. Because the specific heat capacity of the standard sapphire was given for every 10K, the closest value corresponding to the required temperature was considered. Therefore, for example, if the specific heat capacity at 50°C (323K) was required, then the value corresponding to 320K for the standard sapphire was chosen from. 22 The calculated specific heat capacity for the samples A, B and C is listed in Table 5 and graphically plotted in Figure 10.
Specific heat capacity calculation.
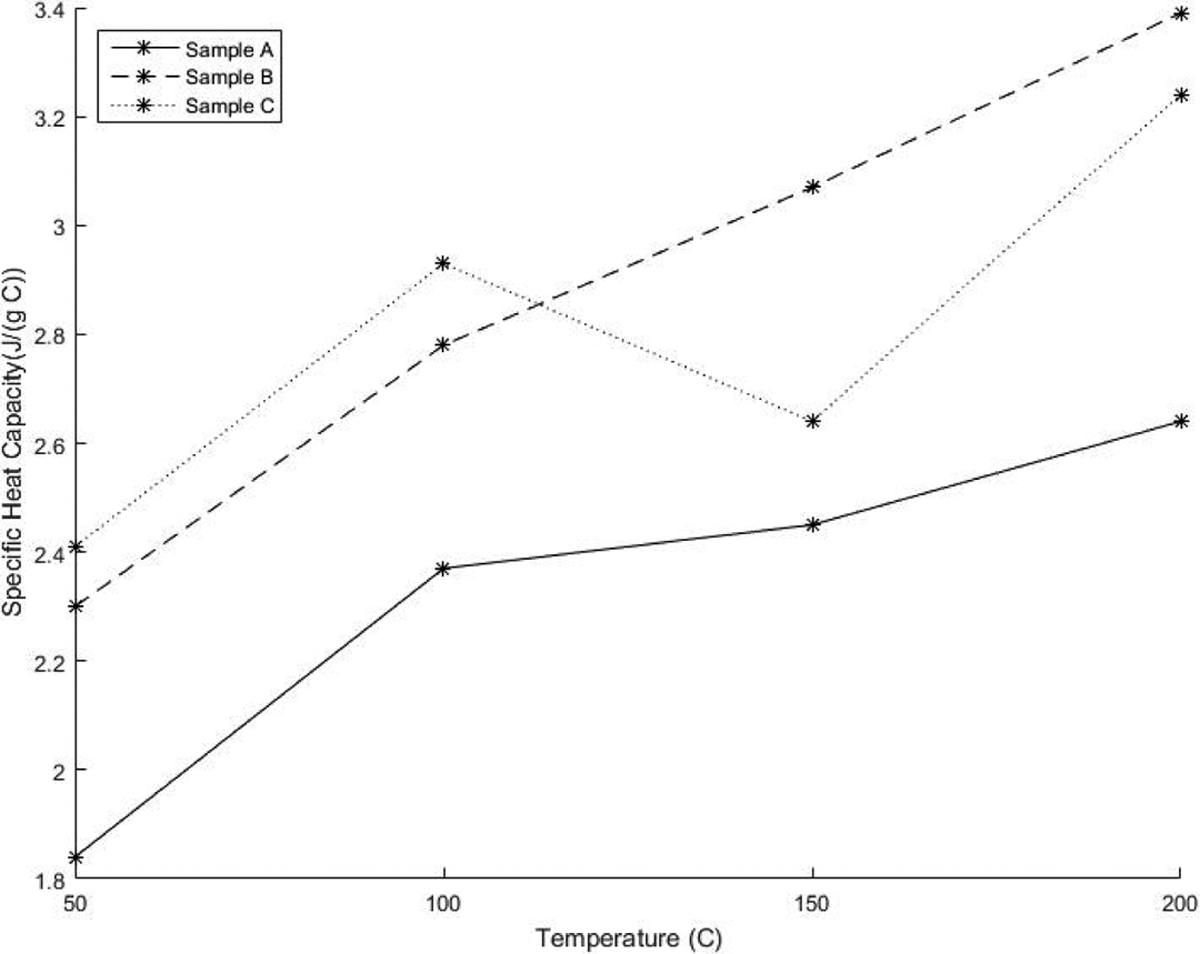
Specific heat capacities of PA-6/aerogel composites. PA-6: polyamide 6.
From Figure 10, it can be seen that sample A has lower values of specific heat across the whole temperature regime and that the specific heat of all the three samples increases with temperature. However, sample C exhibited a decrease between 100°C and 200°C; this is shown in DSC curve as a broad endothermic peak (Figure 9).
Thermal conductivity
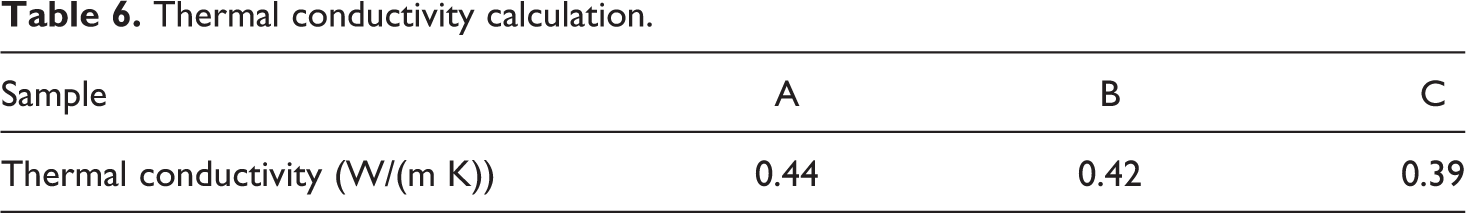
The data for the density, thermal diffusivity and specific heat were taken from Tables 3 to 5, respectively. For thermal diffusivity and density, the average values were considered and for the specific heat, the value at 50°C for each of the sample was used since this was the closest to room temperature. The thermal conductivity values are presented in Table 6.
Thermal conductivity calculation.
In order to analyse the calculated values of the thermal conductivity and to predict the amount of damage to the aerogel structure, a parameter known as the damage coefficient is defined.
Damage coefficient
In this section, the damage to the aerogel structure in a polymer matrix is quantified by placing the calculated thermal conductivity of the samples in relation to the theoretical upper and lower thermal conductivities. The derived term, known as the damage coefficient, would allow an approximate mathematical measure of the destruction of the aerogel structure for the aerogel in a matrix.
The thermal conductivity values for the PA-6/aerogel composite were theoretically calculated using the model described by Hamilton and Crosser. 23 This model enabled the calculation of the thermal conductivity for two-component heterogeneous mixtures. The values calculated analytically provide the upper and lower bounds for the composite in this study. The thermal conductivity of the composite determined using the thermal conductivity of the silica aerogel provides the lower bound, while the value calculated using the thermal conductivity of normal silica (simulating the complete destruction of the aerogel structure) defines the upper bound.
For the purpose of data analysis, a thermal conductivity value (kb) of 0.44 W/(m K) (from Table 6) was adopted for PA-6. For ka, a value of 0.012 W/(m K) 24 (for the aerogel) was chosen together with a value of 1.4 W/(m K) 25 for pure silica. The volume fraction was calculated to be 0.327 (from a mass fraction of 0.04). The values of the theoretical thermal conductivity at the lower and upper bounds were calculated at 0.261 W/(m K) and 0.651 W/(m K), respectively.
Since, the theoretical bounds for the thermal conductivity of the composite used have now been calculated, a damage coefficient property is defined to assist the analysis. The damage coefficient (for the purpose of this study) is as given in the following equation.
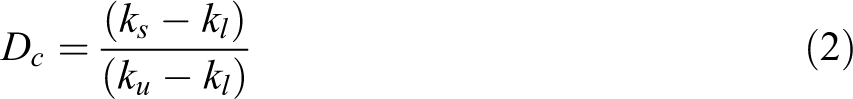
where ks = thermal conductivity of the sample, kl = lower bound thermal conductivity and ku = upper bound thermal conductivity.
Using equation (2), it is seen that the values of the damage coefficient (Dc) at the lower and upper bounds are 0 and 1, respectively. This agrees with the previous assumption that when the aerogel structure is unaffected, then there is no damage, hence the damage coefficient (Dc) is 0. However, when there is complete destruction of the aerogel such that only silica particles (without the aerogel structure) are present, then the value of Dc becomes 1.
The results from Table 6 were used to determine the damage coefficient for samples B and C using equation (2), wherein the calculated values are 0.41 and 0.33, respectively.
Discussion
The research in this article compares the thermal conductivity of PA-6/aerogel composites extruded using two different extrusion speeds; 65 r/min and 5 r/min. The results point towards a lower thermal conductivity for the material processed using a lower extrusion speed. Additionally, a damage coefficient to quantify the loss of the aerogel structure was defined. When considering the values of the damage coefficients, samples B and C show values of 0.41 and 0.33, respectively; this could roughly be translated as sample B losing the structure of around 41% of the aerogel and sample C losing around 33% of its aerogel. Therefore, although the lower extrusion conditions of sample C did provide a relatively better material with reference to thermal conductivity through a better retention of the aerogel structure, it is believed that the compression moulding contributed to the destruction of a significant number of the aerogel particles within the sample. This statement is based on the initial ESEM and optical microscope studies, which pointed to an improvement in the retention of the aerogel in sample C compared to B. Further, it can be evidenced from the literature that the thermal conductivity of the ‘as-extruded’ aerogel/nylon (MXD6) composite reduced as much as 47% when compared to the virgin polymer. 13 However, when comparing the results obtained in this study, it is seen that even sample C’s value (which achieved the lowest thermal conductivity of all the samples tested) was only around 11% lower than that of sample A. Therefore, further research must look to negating this effect of compression moulding by either studying the moulding parameters and/or other processing techniques which build upon the initial advantage offered by the lower extrusion speeds. This is thought to be critical because the final moulding (of the extruded material into its final shape) is important for the material to attain the required shape for practical applications.
It must also be noted that the damage coefficient to the aerogel was predicted purely based on the thermal conductivity results. For a more accurate description, additional material properties must be evaluated and incorporated into the calculation. One such method could incorporate an evolution of equation (2) into equation (3).
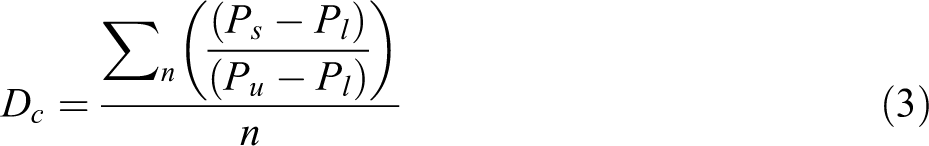
where Ps = required property of the sample, Pl = lower bound of the required property, Pu = upper bound of the required property and n = number of properties tested.
The results in this study do show some promising trends with respect to the thermal conductivity values with the aerogel composites showing lower thermal conductivity values. A similar trend was also seen in the work of Jabbari et al., 26 who show the reduction of thermal conductivity for a poly(vinyl chloride) matrix containing aerogel. This is believed to be due to the Knudsen effect which allows aerogels to have high insulation capabilities as discussed by Raed and Gross in Jabbari et al. 26 When comparing the results of samples B and C, it is observed the lower speeds of the extruder for sample C helped preserve more aerogel and hence a lower thermal conductivity. Additionally, because sample C showed a lower standard deviation during thermal diffusivity measurements, it is suggested that there would be a lower temperature gradient across its cross section during heat transfer and could result in a better thermal ageing and fatigue performance. The more uniform distribution of heat in sample C also points towards a homogenous material and good mixing of the aerogel particles within the PA-6 matrix, thereby negating one of the limitations of using lower extrusion speeds.
It is therefore recommended that although there was a significant damage to the aerogel during the processing of the samples, further research especially towards alternatives to compression moulding would enable the production of an aerogel/PA-6 composite with superior thermal conductivity and a more efficient thermally insulating material. Finally, further testing with reference to the material’s mechanical properties would be beneficial in determining its practical applicability.
Conclusions
Aerogel/PA-6 composites were mixed using a twin-screw extruder and moulded using a compression press using two different speeds in the extruder (along with a pure nylon sample as a control). According to the experimental results, both composite samples had a lower thermal conductivity compared to the virgin polymer, with the lower revolution per minute sample showing improved thermal performance (0.39 W/(m K)) compared to the batch processed using a higher revolution per minute (0.42 W/(m K)). These results were also corroborated with the calculated damage coefficient values. The damage coefficient allowed a quantification of the damaged aerogel structure and the equation described in this article can be used for similar aerogel/polymer composites.
These results thus point to a promising direction for thermal insulation materials, but more research is required to optimize the final moulding process since it is thought that the majority of the aerogel was destroyed in this step, especially for the samples with a lower extrusion speed, as observed with the microscopic and EDX images.
Footnotes
Acknowledgements
Declaration of Conflicting Interests
The author(s) declared no potential conflicts of interest with respect to the research, authorship, and/or publication of this article.
Funding
The author(s) received no financial support for the research, authorship, and/or publication of this article.