
Abstract
Damage detection using the wavelet transform was investigated and appropriate approaches to raising the method’s sensitivity level were proposed. In addition, the current study attempted to implement the impulse wavelet design algorithm in order to present appropriate wavelet function with respect to the characteristics of the signal. The initial wavelet function corresponding to the impulse response of composite plate was achieved using impulse wavelet algorithm in time domain. The function was optimized using lifting scheme method. To detect damages, an appropriate signal was selected through applying wavelet transform. To enhance damage identification, first, the edges’ effect of wavelet transform was removed, then a higher accuracy was observed by summing the wavelet coefficients in all scale factors for each mode shape and the wavelet coefficients for all mode shapes. The article also presents a quantitative measure to compare different wavelets.
Introduction
Over the last decades, various non-destructive diagnostic tools haven been widely employed for condition assessment of composite structural elements. However, detection of damage in composite materials, especially composite laminates, becomes critically important due to their wide range of application in industry.
Recently, a number of researchers have developed the application of wavelet transform for damage detection in the composite structures. 1,2 Katunin 3 used a three-dimensional wavelet analysis for detecting and classifying the damage in reinforced composite plates using X-ray computed tomography (CT) scanning. Application of 3D discrete wavelet transform (DWT) together with the CT scanning allowed to effectively classify the defects into three classes: delamination, air pockets and measurement noise. The problem of detecting and locating damages in plate-like structures has been studied by Dziedziech et al., 4 Huang et al. 5 and Qiao and Fan. 6 All of these studies have utilized Continuous Wavelet Transform (CWT) and various types of two-dimensional wavelets such as Gabor, Gaussian, reverse biorthogonal and Mexican hat. Additionally, Gao and Yan 7 have used Daubechies, Morlet and Mexican hat wavelets for machine condition monitoring and diagnosis. Wavelet transform can also be applied to mode shape vectors or their derivatives to detect minor changes caused by the damage. 8 Nevertheless, numerous studies have shown that modal displacements are not very sensitive to small defects both in beams and plates, despite using many measurement points. In an attempt to ameliorate the sensitivity of mode shapes related to defects, mode shapes derivatives were used for damage detection. 9 Natural frequencies are not suitable for direct detection of faults. However, the second-order derivatives of natural frequencies (modal curvatures) have been recently utilized to weigh the effect of mode shapes in intact and damaged states, alongside using mode shapes differences of intact and damaged states. 10 An effective algorithm based on two-dimensional B-spline wavelets was presented by Katunin 11 in application to damage diagnostics in layered composite plates, being performed for three types of a damage location and shape and three natural modes. The study by Castro et al. 12 detected the damage in Carbon Fiber Reinforced Plastic (CFRP) composite plate using entropy spectrum. It utilized frequency response of the system. Additionally, Katunin 13 proposed the use of multi-wavelet and multi-scaling functions instead of common methods with one base wavelet and one scale function. This was mainly because summing all the necessary features is a difficult task in a single base wavelet. Results of the study showed that some features of multi-wavelet transform could improve damage detection, resulting in replacement of the old single-wavelet methods. Moreover, Solis et al. 14 proposed a new wavelet-based method of damage detection which combined modal parameters and wavelet parameters. This method is based on analysis and summation of continuous wavelet transform related to the differences between intact mode and damaged shapes. To sum these coefficients, changes in natural frequencies are utilized to assign weighting coefficients to mode shape differences of intact and damaged states. Results of recent studies indicate that the application of DWT is more suitable for both one-dimensional and two-dimensional problems, due to sensitivity and computational advantages over CWT and other related transforms applied for structural damage detection. However, classical algorithms based on DWT leave some undesired artificial effects on results’ pattern, that is, boundary effect, which increases the detailed wavelet coefficients in pattern’s boundaries. 13 Through using the impulse response of the system as the scaling function, a new method, called the impulse wavelet method, was proposed by Yan and Gao 15 to design base wavelet. It uses the measured impulse response on a rolling bearing as the basis to formulate a scaling function. Besides, it satisfies the dilation equation, which is generally provided in standard base wavelets. The scaling function is subsequently used for constructing a base wavelet (i.e. an impulse wavelet), being utilized to analyse vibration signals measured on the bearing. Tewfik et al. 16 developed a technique for finding the optimum discrete orthogonal wavelet that leads to the best approximation, proper to a special signal with infinite scale factor. Recently, Evenbly and White 17 presented a novel algorithm to design discrete wavelet functions for construction of electronic circuits. Jiang et al. 18 suggested a new wavelet method based on lifting scheme with desirable properties while exploiting the flexibility of lifting scheme, allowing for potential extraction of weak fault feature. This transform improves the efficiency of signal decomposition by increasing the wavelet vanishing moment. The lifting scheme as a simple construction of second-generation wavelets was presented by Sweldens. 19 Moreover, Daubechies and Sweldens 20 used the Euclidean algorithm to show how any DWT or two band sub-band filtering with finite filters can be obtained with a finite number of lifting steps starting from the Lazy wavelet (or polyphase transform).
In the present article, a new method is proposed for more sensitive damage detection via wavelet transform. First, a new wavelet was designed for composite laminate. Then, the second-generation wavelet (i.e. lifting scheme) was utilized to obtain the final wavelet function with a high capability of damage detection. The strain energy was used as the main data which showed the highest level of information about the damage in comparison to other damage indices based on modal properties. Besides, the effect of natural frequencies and mode shapes was considered in the form of strain energy. This increased the information of signal with the number of mode shapes and as a result, damage detection was conducted with a higher accuracy. Moreover, in the current study, edges’ singularities were removed to detect damage near the edges. The simultaneous effects could be evaluated by taking into account the various effect of damage in different mode shapes and scale factors. This could be achieved by summing the wavelet coefficients in different mode shapes and scale factors. Finally, the proposed method was applied for a composite plate sample made in both intact and damage forms.
Strain energy criterion
The strain energy is a type of potential energy that arises from a structure’s elastic deflections. The strain energy-based damage detection has been found to be a powerful approach for evaluating the changes in the stiffness matrix as a result of damage. It was found that among the classical methods of vibration-based damage detection based on modal characteristics, those based on strain energy change have the highest sensitivity to the presence of damage. 21 –23
Noting that delamination damage can cause a significant reduction of the stiffness of the composite materials. For a composite laminate composed of N layers, the strain energy associated with the mode shape’s flexibility for a specified mode shape, such as ‘
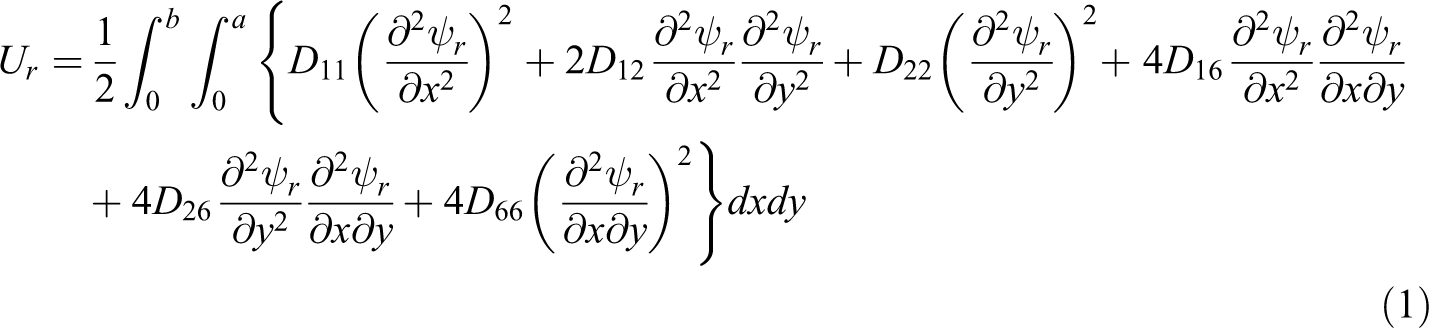
in which D ij is the coefficient of the bending stiffness matrix of the composite material, 25 a is the plate length and b is the plate width.
In a discretized finite element model, the portion of energy stored in each typical element with all nodes occupying the region am−1 < x < am and bn−1 < y < bn can be expressed by
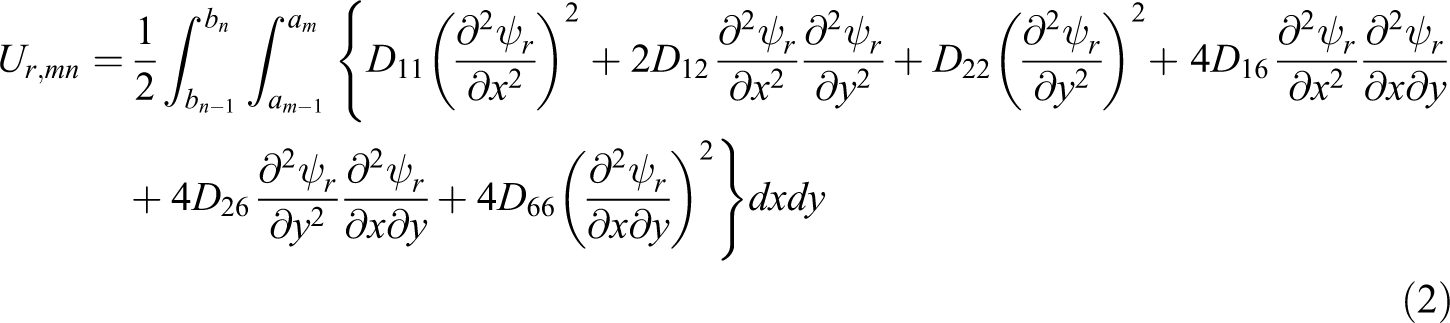
in which a m−1, a m , b n−1, and b n are the mn-th element node coordinates in directions of x and y, respectively. Therefore, the contribution of the mn-th layer energy to the total energy of the plate in r-th mode shape is obtained as follows 26 :
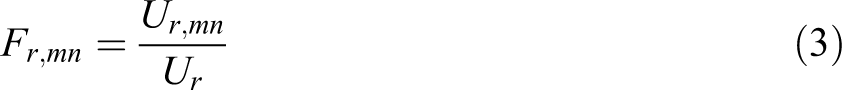
If the structure’s mode shape in the damaged state is represented by
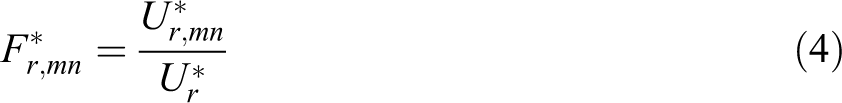
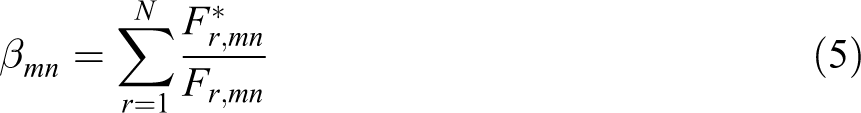
Here the symbol * represents the damaged state of the plane. Eventually, the damage index in terms of the all mode shapes is calculated according as follows:
Wavelet design
Using the proper wavelet to detect the damage and identify its location based on wavelet transform is a critical challenge. The selection criterion for an appropriate wavelet transform in classical methods is trial and error, without considering the signal’s characteristics for each case study. As such, in the current article, design algorithm was presented and studied with an attention to the signal’s nature. Besides, the qualification of wavelet was improved by lifting scheme algorithm, called as second-generation wavelets.
Impulse wavelet design method
The impulsive response function can be used as a basis vector to construct any response of the system which is unique and belongs to system’s nature. The wavelet function can be obtained from the impulsive response of the specimen in the impulse wavelet method. 7
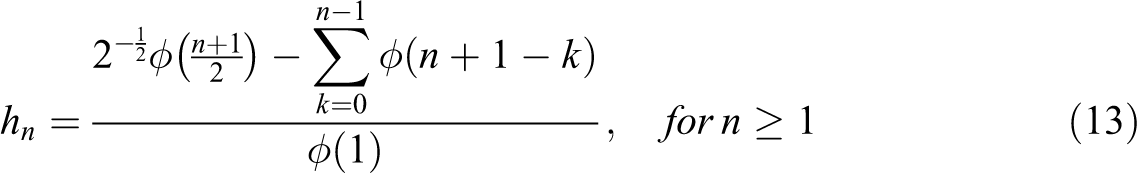
The wavelet can be constructed from a scaling function which describes its scaling properties. The reconstruction procedure can be possible, if a scaling function ϕ(t) satisfies the following dilation equation:
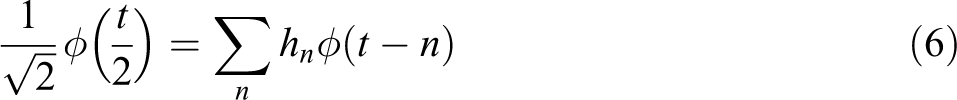
where hn is the scaling coefficients applied to ϕ(t − n). Accordingly, constructing the base wavelet function, ψ(t), can begin from the scaling function ϕ(t). On the condition of satisfying equation (6), the impulse response can be used as a scaling function. The first step is to dilate the impulse response so that its support tends to be greater than one. Then, a recursive relationship that is extracted from dilation equation can specify the coefficients hn. For constructing the base wavelet, several impulse responses have been taken through hammer strikes. Once an impulse input is applied to a system, an output signal can be produced and defined by the convolution integral in discrete form as the following equation:

in which h(t) represents the impulse response of the system, R(n) denotes the impulsive input and x(t) denotes the output signal. Due to the kind of extraction, it is anticipated that the designed wavelet based on impulse response can exhibit a more powerful decomposition of the signal than classic wavelets. For t = 1,
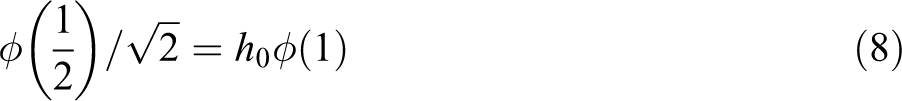
Since the compactly supported ϕ(t) is zero for t ≤ 0, the terms h1ϕ(0), h1ϕ(−1) and so on do not appear. Thus, h0 is defined as follows:
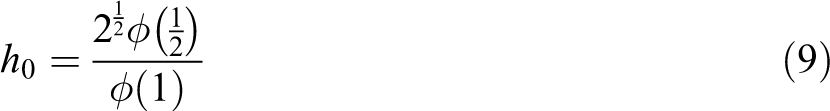
Similarly, for t = 2, t = 3 and t = N + 1:


Equations (9) to (12) can derive a recursive description for each low-pass filter coefficients as the first coefficient h0 given by equation (9). The remaining coefficients can be obtained as the follows:
Additionally, the dilation equation can be described as:
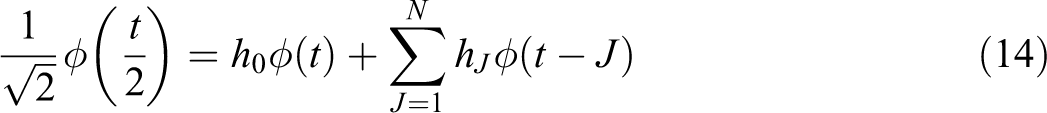
Since hn is derived from equation (13), the dilation equation can be rewritten as:
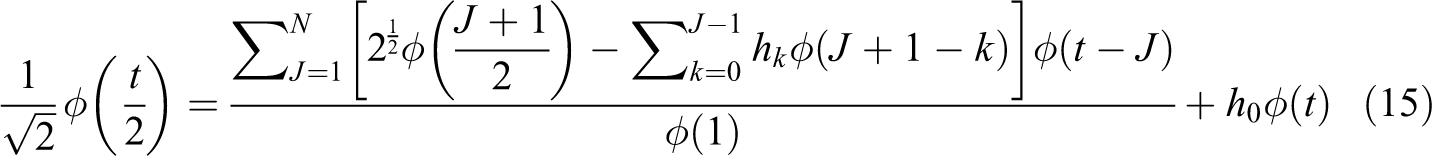
The final form of the dilation equation is according to the following equation:
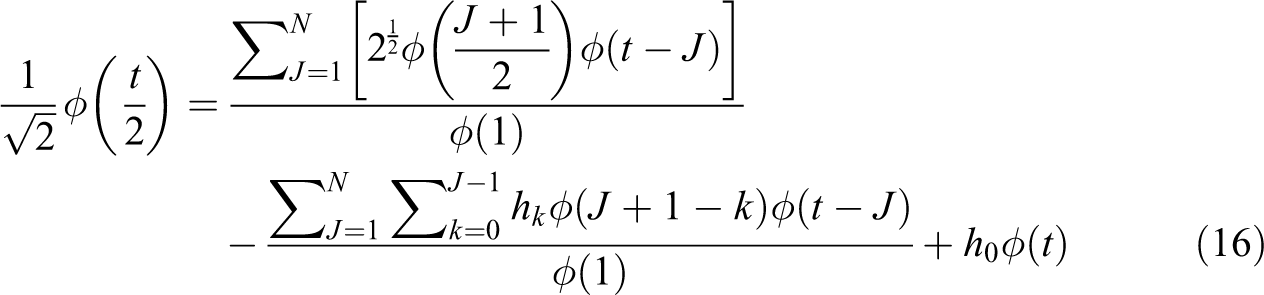
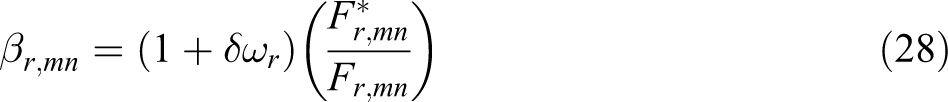
hn represents the low-pass filter coefficients that only exist in the second term of the right-hand side of equation (16). In practice, an impulse scaling function is first applied to obtain an initial set of filter coefficients, optimized by minimizing the following error function:
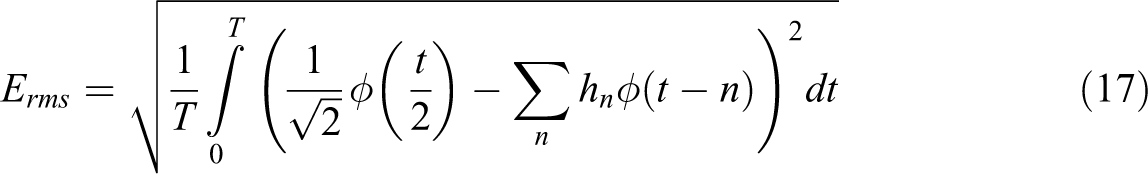
Erms shows to what extent the dilation equation has satisfied the vector hn. Minimizing Erms can be the best set of filter coefficients obtained from ϕ(t). The high pass coefficients, g, can be achieved from the following equation 16 :

The high-pass filter coefficients, g, derived from equation (18), can be used for determining the corresponding wavelet function ψ(t). The wavelet function, ψ(t), can be achieved from the following equation after calculating the scaling function, ϕ(t).
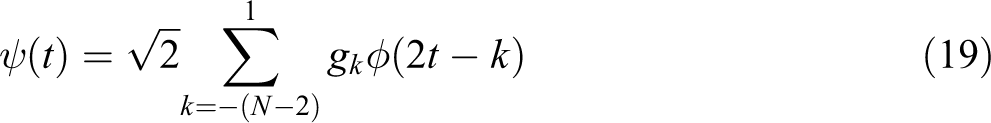
in which {gk,k = −(N − 2),..., 0, 1} has been dilated back with the amount of −(N − 2). It should be noted that ψ(t) has the support on the
Lifting scheme algorithm
Improving the initial wavelet function and increasing the vanishing moments for production of the second-generation wavelet are the basis for the lifting scheme performance. This method is simple; the first step is to choose an initial set of biorthogonal filters, and then improve the properties of the set of biorthogonal filters through lifting and dual lifting procedures. 18
Consider (h, g) as a complementarity pair filter that allows complete reconstruction. Then, the pair

However, this is right for each pair

The reverse is also true. If the filter banks (h, g) and

Any transformation similar to the filter bank is called lifting step. Alternative lift is included in a string of lifting steps. Upon consistency of the low-pass filters, the high-pass filters change leading to an inversion in the next level. The steps which are successful in the same directions can synthesize together. An initial set of biorthogonal filters must be considered as the following:

Then, a new set of finite biorthogonal filters can be described as the following equation:
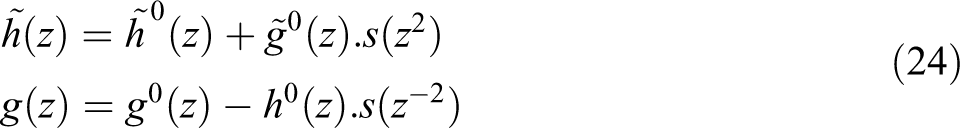
This procedure is called lifting in which S is lifting operator as a Laurent polynomial. Also, the dual lifting can be described as a new set of biorthogonal filters
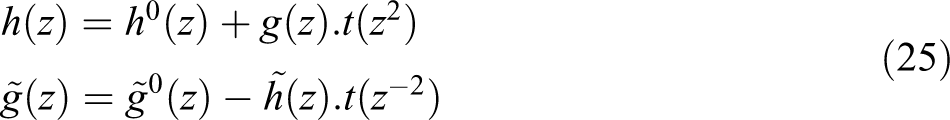
This procedure is known as dual lifting, in which t is dual lifting operator as a Laurent polynomial. Figure 1 illustrates the procedure of lifting and dual lifting.
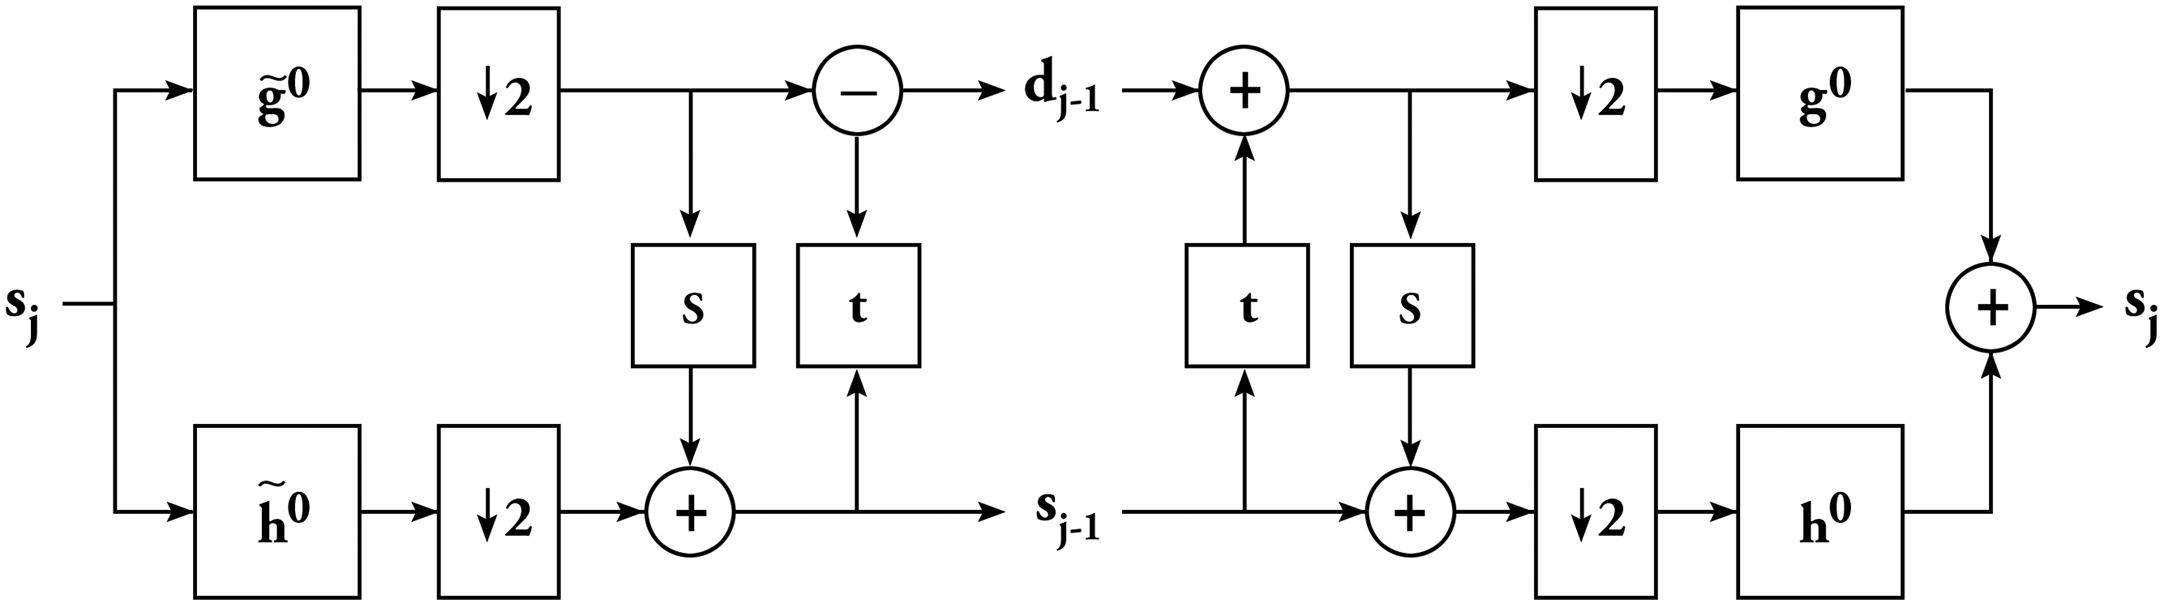
Lifting and dual lifting process.
It is proven that the number of vanishing moments of ψ, N and

The following set of equations is preserved for z = 1.

The basic aim of lifting is to increase the vanishing moments. Lifting process for
Numerical validation
In order to numerically validate the method, first, numerical models of an intact composite plate and of damaged plates comprising delamination damage of different intensities were considered. The proposed method was used to detect the damage parameters inside the plates.
Numerical model
The case studies were eight-layered epoxy/glass rectangular composite plates with dimension of 300 mm × 300 mm and a total thickness of 1.6 mm, including a delamination between layers 3 and 4. The laminate was modelled in ANSYS Workbench Mechanical software using multi-layered SOLID186 elements.
The laminate configuration was [0/90/90/0] s and the material constants were as follows: the total mass density is ρ = 1700 kg/m3, the elastic moduli are E 1 = 30 GPa, E 2 = E 3 = 9 GPa, G 12 = G 13 = 4.7 GPa and G 23 = 3.28 GPa, and the Poisson’s ratios are υ 12 = υ 13 = 0.254 and υ 23 = 0.428.
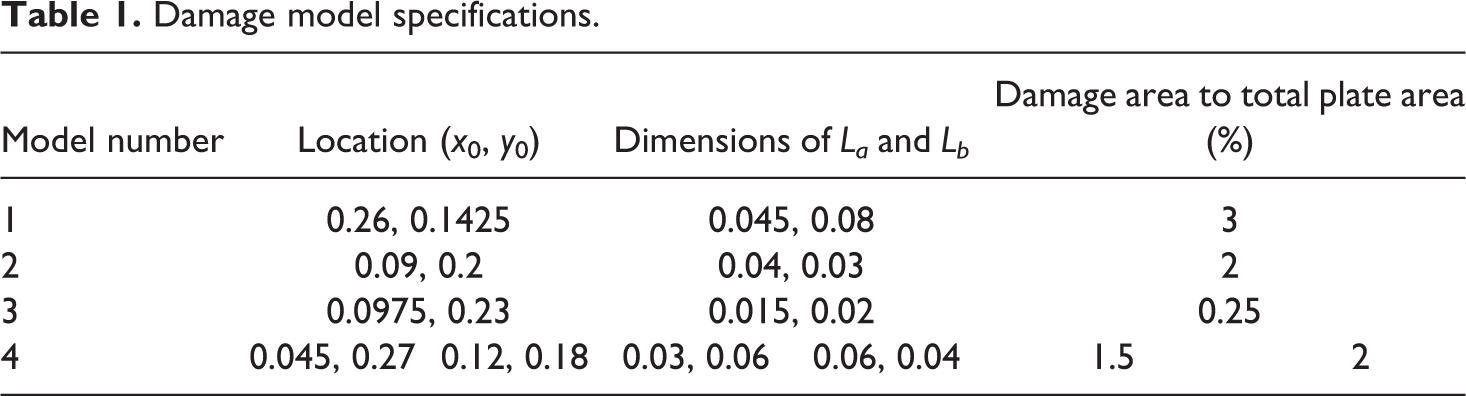
To model the delaminated laminate, the entirety was considered as two sublaminates, an upper three-layered sublaminate above and a lower five-layered sublaminate below the plane of delamination, while preserving a consistent mesh pattern for both sublaminates. To create an intact model, all degrees of freedom of each node located at the plane of delamination were merged together. In order to create delamination region in the damaged plate, the paired nodes between adjacent layers over the delaminated area were fully decoupled; instead the contact elements were used in the delamination zone to prevent mesh interpenetration. Figure 2 shows the general geometrical properties of a damaged plate. In order to assess the performance of the method, four damaged composite plates with properties as defined in Table 1 are modelled. The convergence of the solution was evaluated by the ANSYS® solver and the samples were meshed with a consistent pattern of 200 × 200.
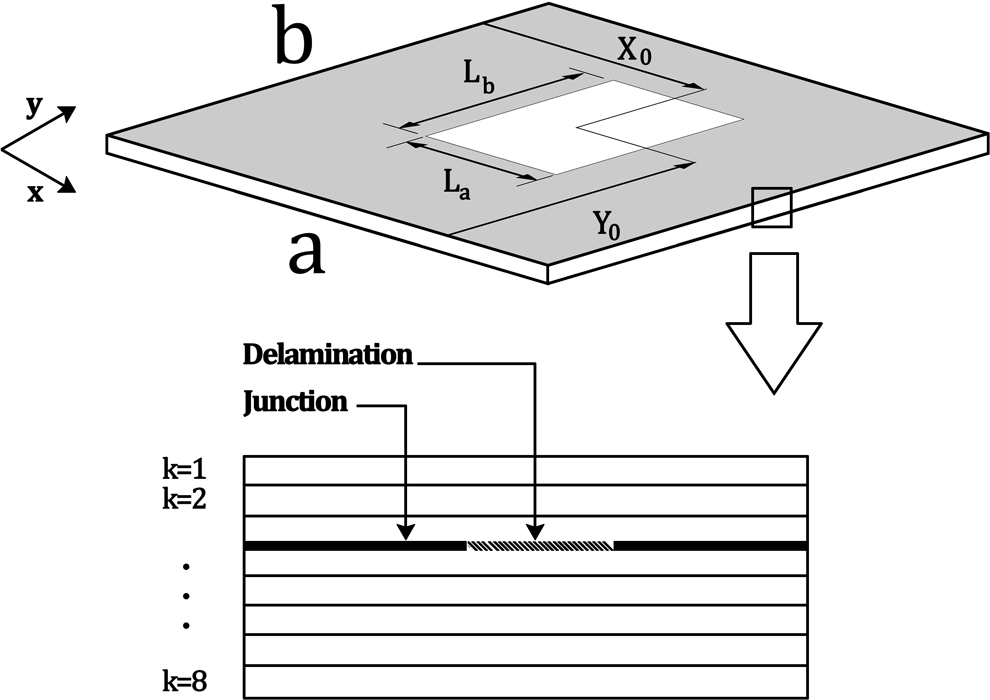
Schematic of a damaged composite plate with its layers.
Damage model specifications.
Removing the edges’ effects in wavelet transform
Detecting and analysing dissimilarities in the behaviour of a signal can be considered as a basis for damage detection using wavelet transform. Planar singularity along with the edges of two-dimensional mode shapes which behaves as the dissimilarity in signal can exhibit comparable effect which makes it impossible to detect defects on the edges. 27 –29 Such boundary effects have been studied in recent years, 30 but not been given an explicit solution.
Another aim of this study was to overcome this problem and eliminate the boundary effects of edges by converting mode shape signal from two-dimensional to one-dimensional. To this end, plate nodes are sequentially taken in the form of a single string to represent the entire signal, as shown in Figure 3. This transferring procedure can be performed either along or direction. Through this procedure, the singularities of edges are fully removed and detecting damage near the edges becomes possible. This is the justification for applying one-dimensional wavelet transform instead of two-dimensional transform.
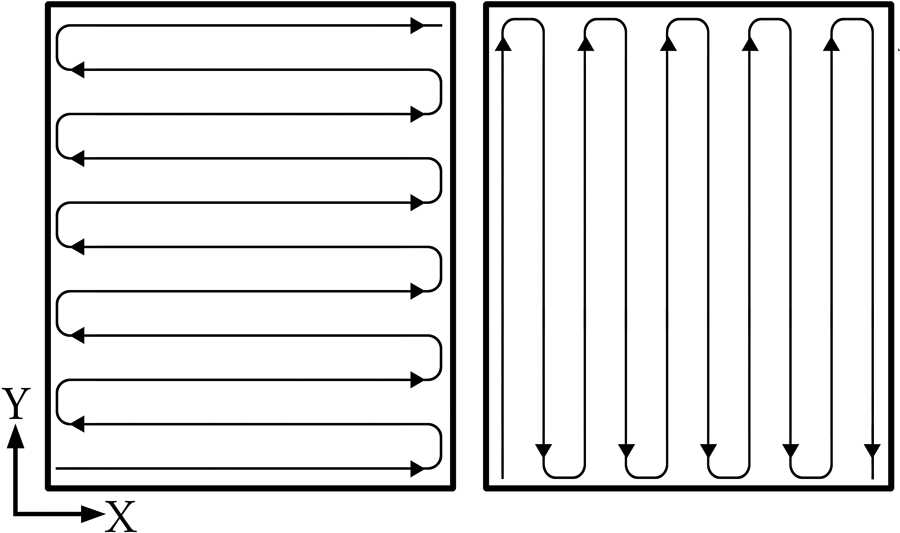
The procedure of transforming the two-dimensional signal to one-dimensional using the stringed method.
After wavelet transformation, for the purpose of inspecting the damage location, stringed mode shape is again transformed from the stringed form to plane form. This helps to separately obtain wavelet transform for the plate in different wavelet scale factors in each mode shape. Considering the effectiveness in all directions, it is suggested to sum plane form wavelet coefficients along the two directions in this stage.
Assessment of different scale factors and mode shapes
Considering the two-dimensional form of mode shape signal of the composite plate, its wavelet transform is changed to four-dimensional. Hence, it is possible to separately study this transform in each scale. Since the effect of defect in different scale factors is not viewed in a similar way, it is advised to use the summation of wavelet coefficients in all scale factors for each mode shape to avoid losing data. Additionally, wavelet factors in different mode shapes are incorporated to inspect the effect of all mode shapes.
Damage detection in the numerical models
The first wavelet function is achieved by the impulse response method. 7,16 Transient analysis was performed by ANSYS® to generate the impulse response which can be obtained from the dynamic response to the unit force excitation at the centre of the intact plate in the time domain. 31 Then, the second-generation wavelet, lifting scheme wavelet, can be extracted to optimize the operation of the first wavelet. 18 The curve shown in Figure 4 is used as the initial scaling function corresponding to impulse response of the intact composite plate. The final wavelet and scaling function can be achieved as depicted in Figure 5, after optimization by GA to obtain the low-pass and high-pass coefficients using the impulse response of intact composite plate. Considering the lifting scheme algorithm, the final wavelet function for the analysis of vibrational data of composite plate is identified in Figure 6.
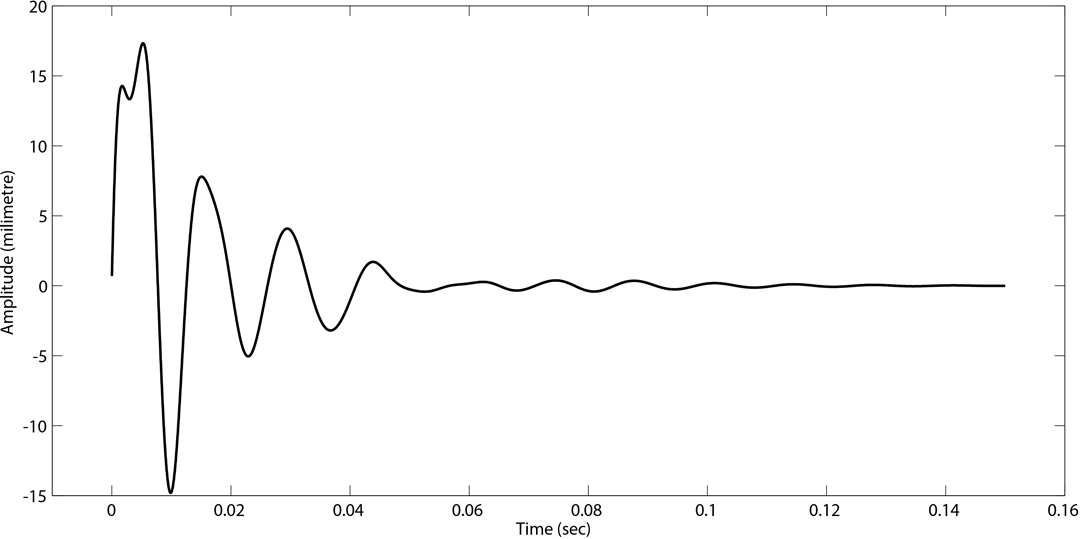
The numerical impulse response of the intact composite plate.
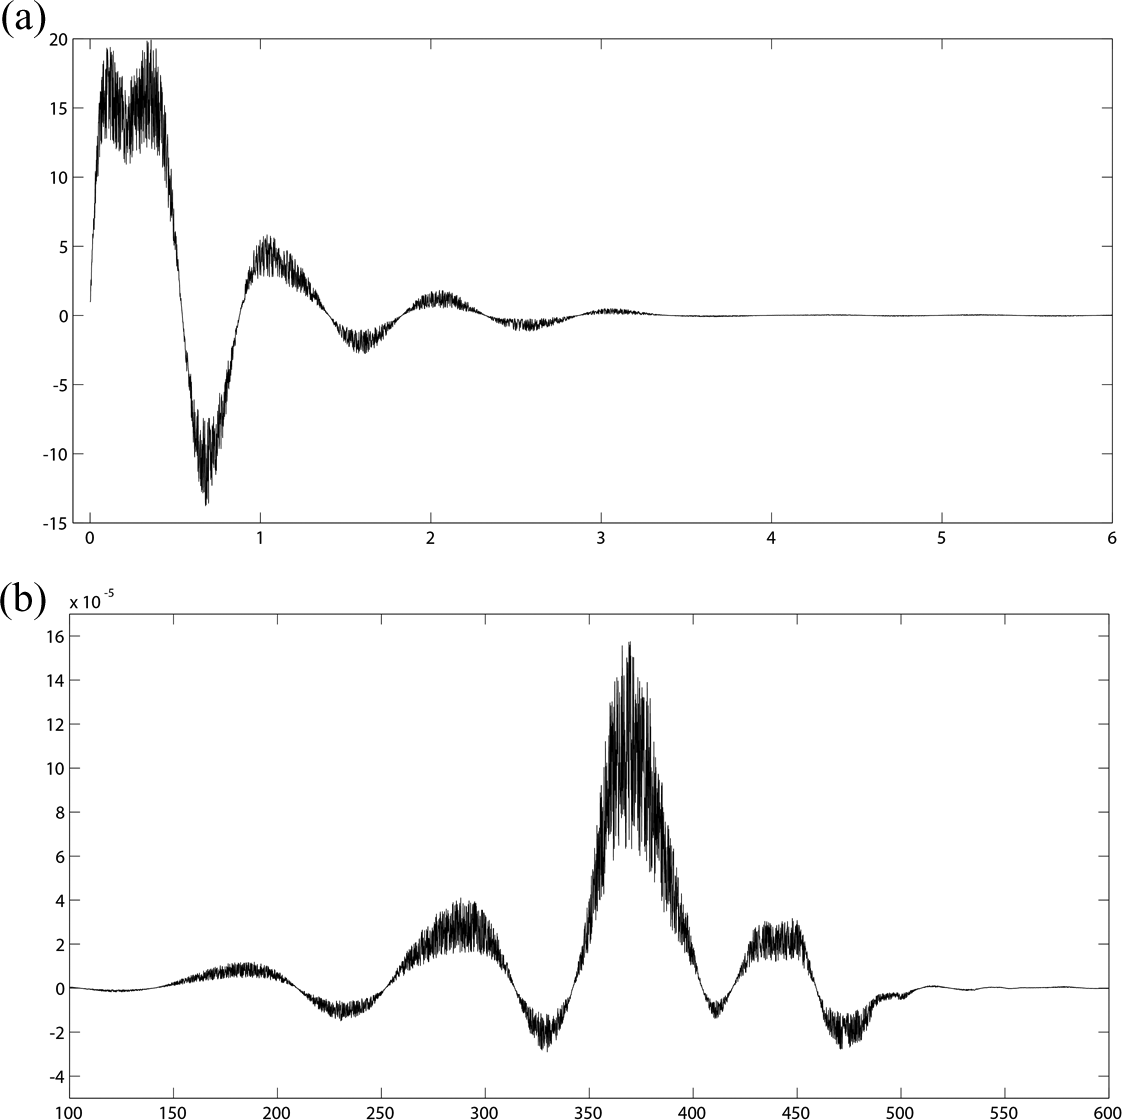
Impulse wavelet design of the numerical model. (a) Scaling function and (b) wavelet function.
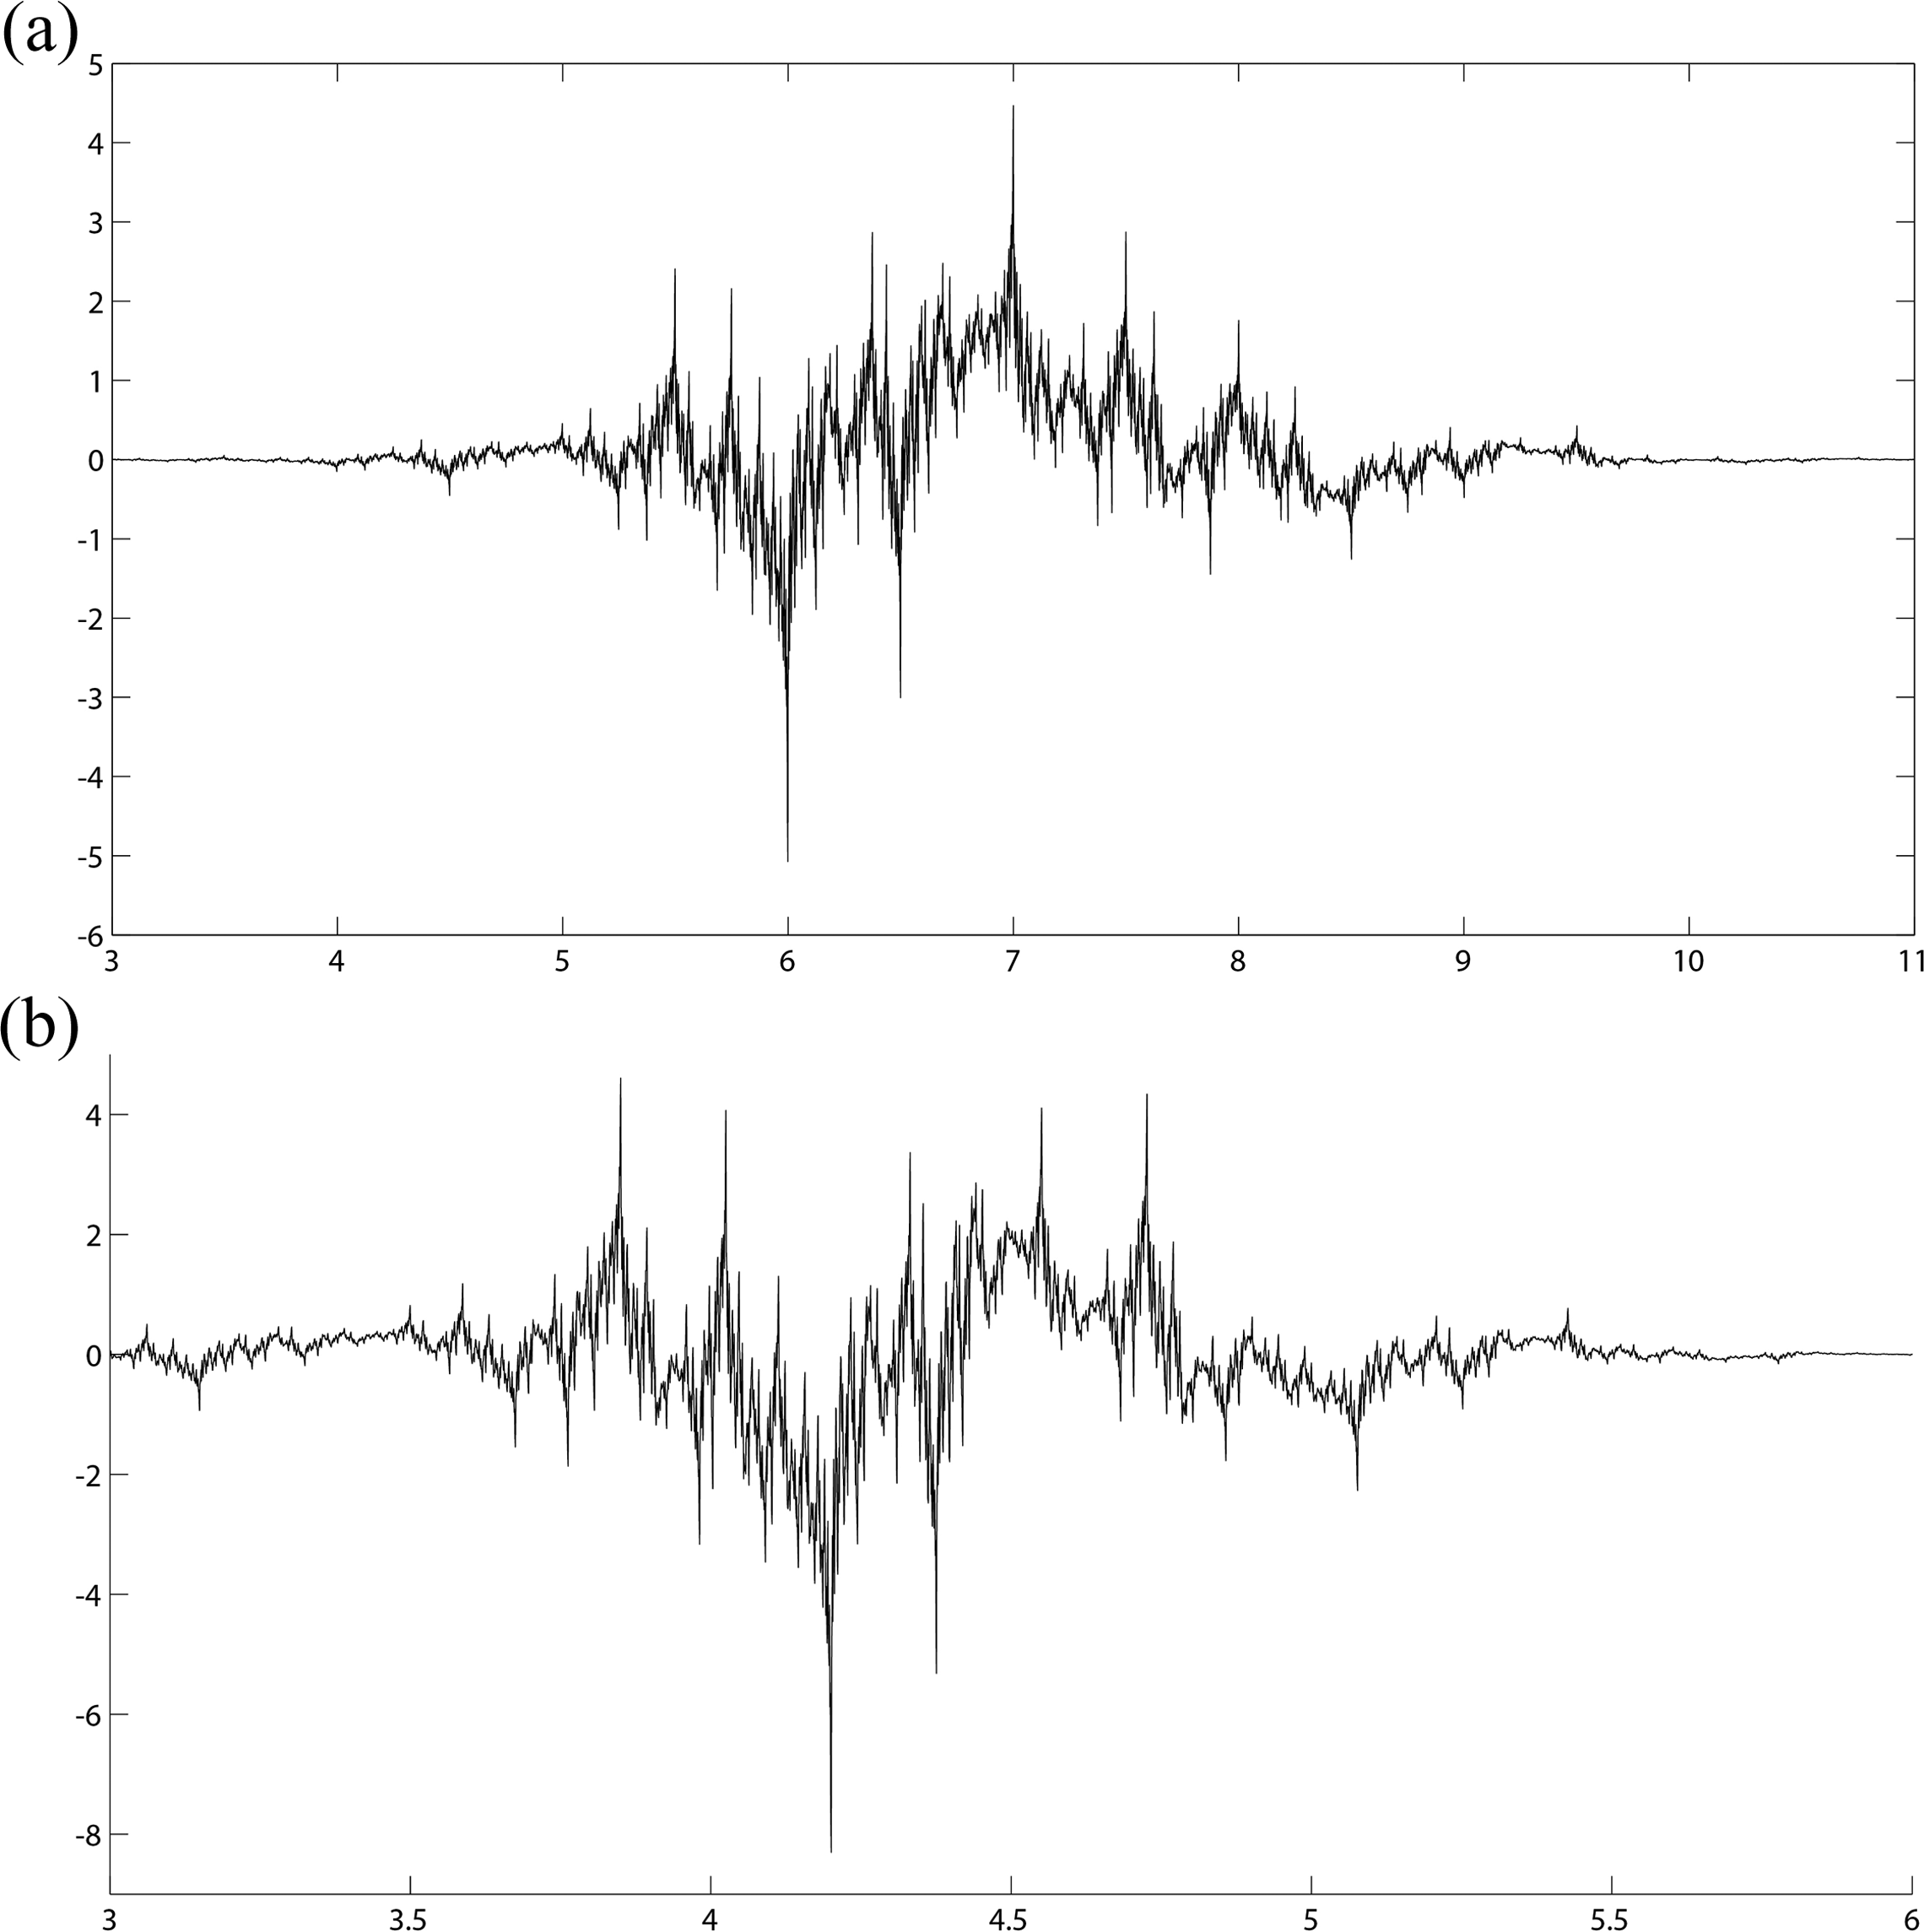
Lifting scheme wavelet of the numerical model. (a) Scaling function and (b) wavelet function.
Strain energy signal can be derived after modal analysis of the samples. Applying the wavelet transform on the weighted signal of strain energy ratio in intact and damaged form (see equation (28)) can provide a good estimation of the possible damage location.
in which F and F* are according to equations (3) and (4), respectively. Additionally, δωr is defined as follows:
where υr is the r-th eigen frequency of the system. Using solely mode shapes in intact and damaged states is too weak to provide enough data to detect the damage. Also by including difference of natural frequencies (see equation (29)) in the energy term, the effect of natural frequencies can be obtained alongside the effect of mode shapes.
Moreover, the robustness of the model and measurement uncertainties form one of the important issues in damage detection studies. The contaminated mode shapes are represented as follows 32 :

where
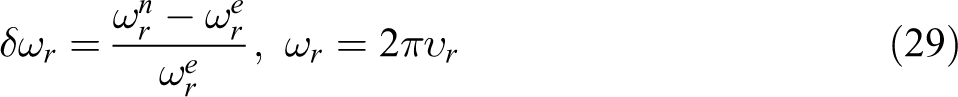
The operation of impulse wavelet lifting scheme for detecting damage is presented in Figure 7. Accordingly, the maximum tolerable noise for each damage scenario has been shown in Figure 7. Given the various effects of damage in different mode shapes and scale factors, and the use of summation of wavelet coefficients in different mode shapes and scale factors, the whole simultaneous effect can be provided. Quantitative effectiveness of each wavelet can be compared in the result section.
Wavelet transform of the numerical samples. (a) 1st damaged sample. (b) 2nd damaged sample. (c) 3rd damaged sample. (d) 4th damaged sample.
Experimental validation
The existence of noise in the experimental data may be considered as the main source of difference between the experimental and simulated data. Moreover, the number of mode shapes used in the experimental case was usually less than those used in the numerical case through the present measurement limitations. In order to validate the experimental results in the presence of uncertainties such as noise, both intact and damaged specimens of the composite plate were tested in this study.
Experimental model
The plates were eight-layered epoxy/glass composite laminates with dimensions of 300 mm × 400 mm and a total thickness of 1.6 mm, containing a delamination between adjacent layers 3 and 4. The laminate configuration was [0/90/90/0] s and the material constants were as follows: mass density is ρ = 1900 kg/m3, elastic moduli are E 1 = 50 GPa, E 2 = E 3 = 15.2 GPa, G 12 = G 13 = 4.7 GPa, G 23 = 3.28 GPa, and Poisson’s ratios are υ 12 = υ 13 = 0.254 and υ 23 = 0.428.
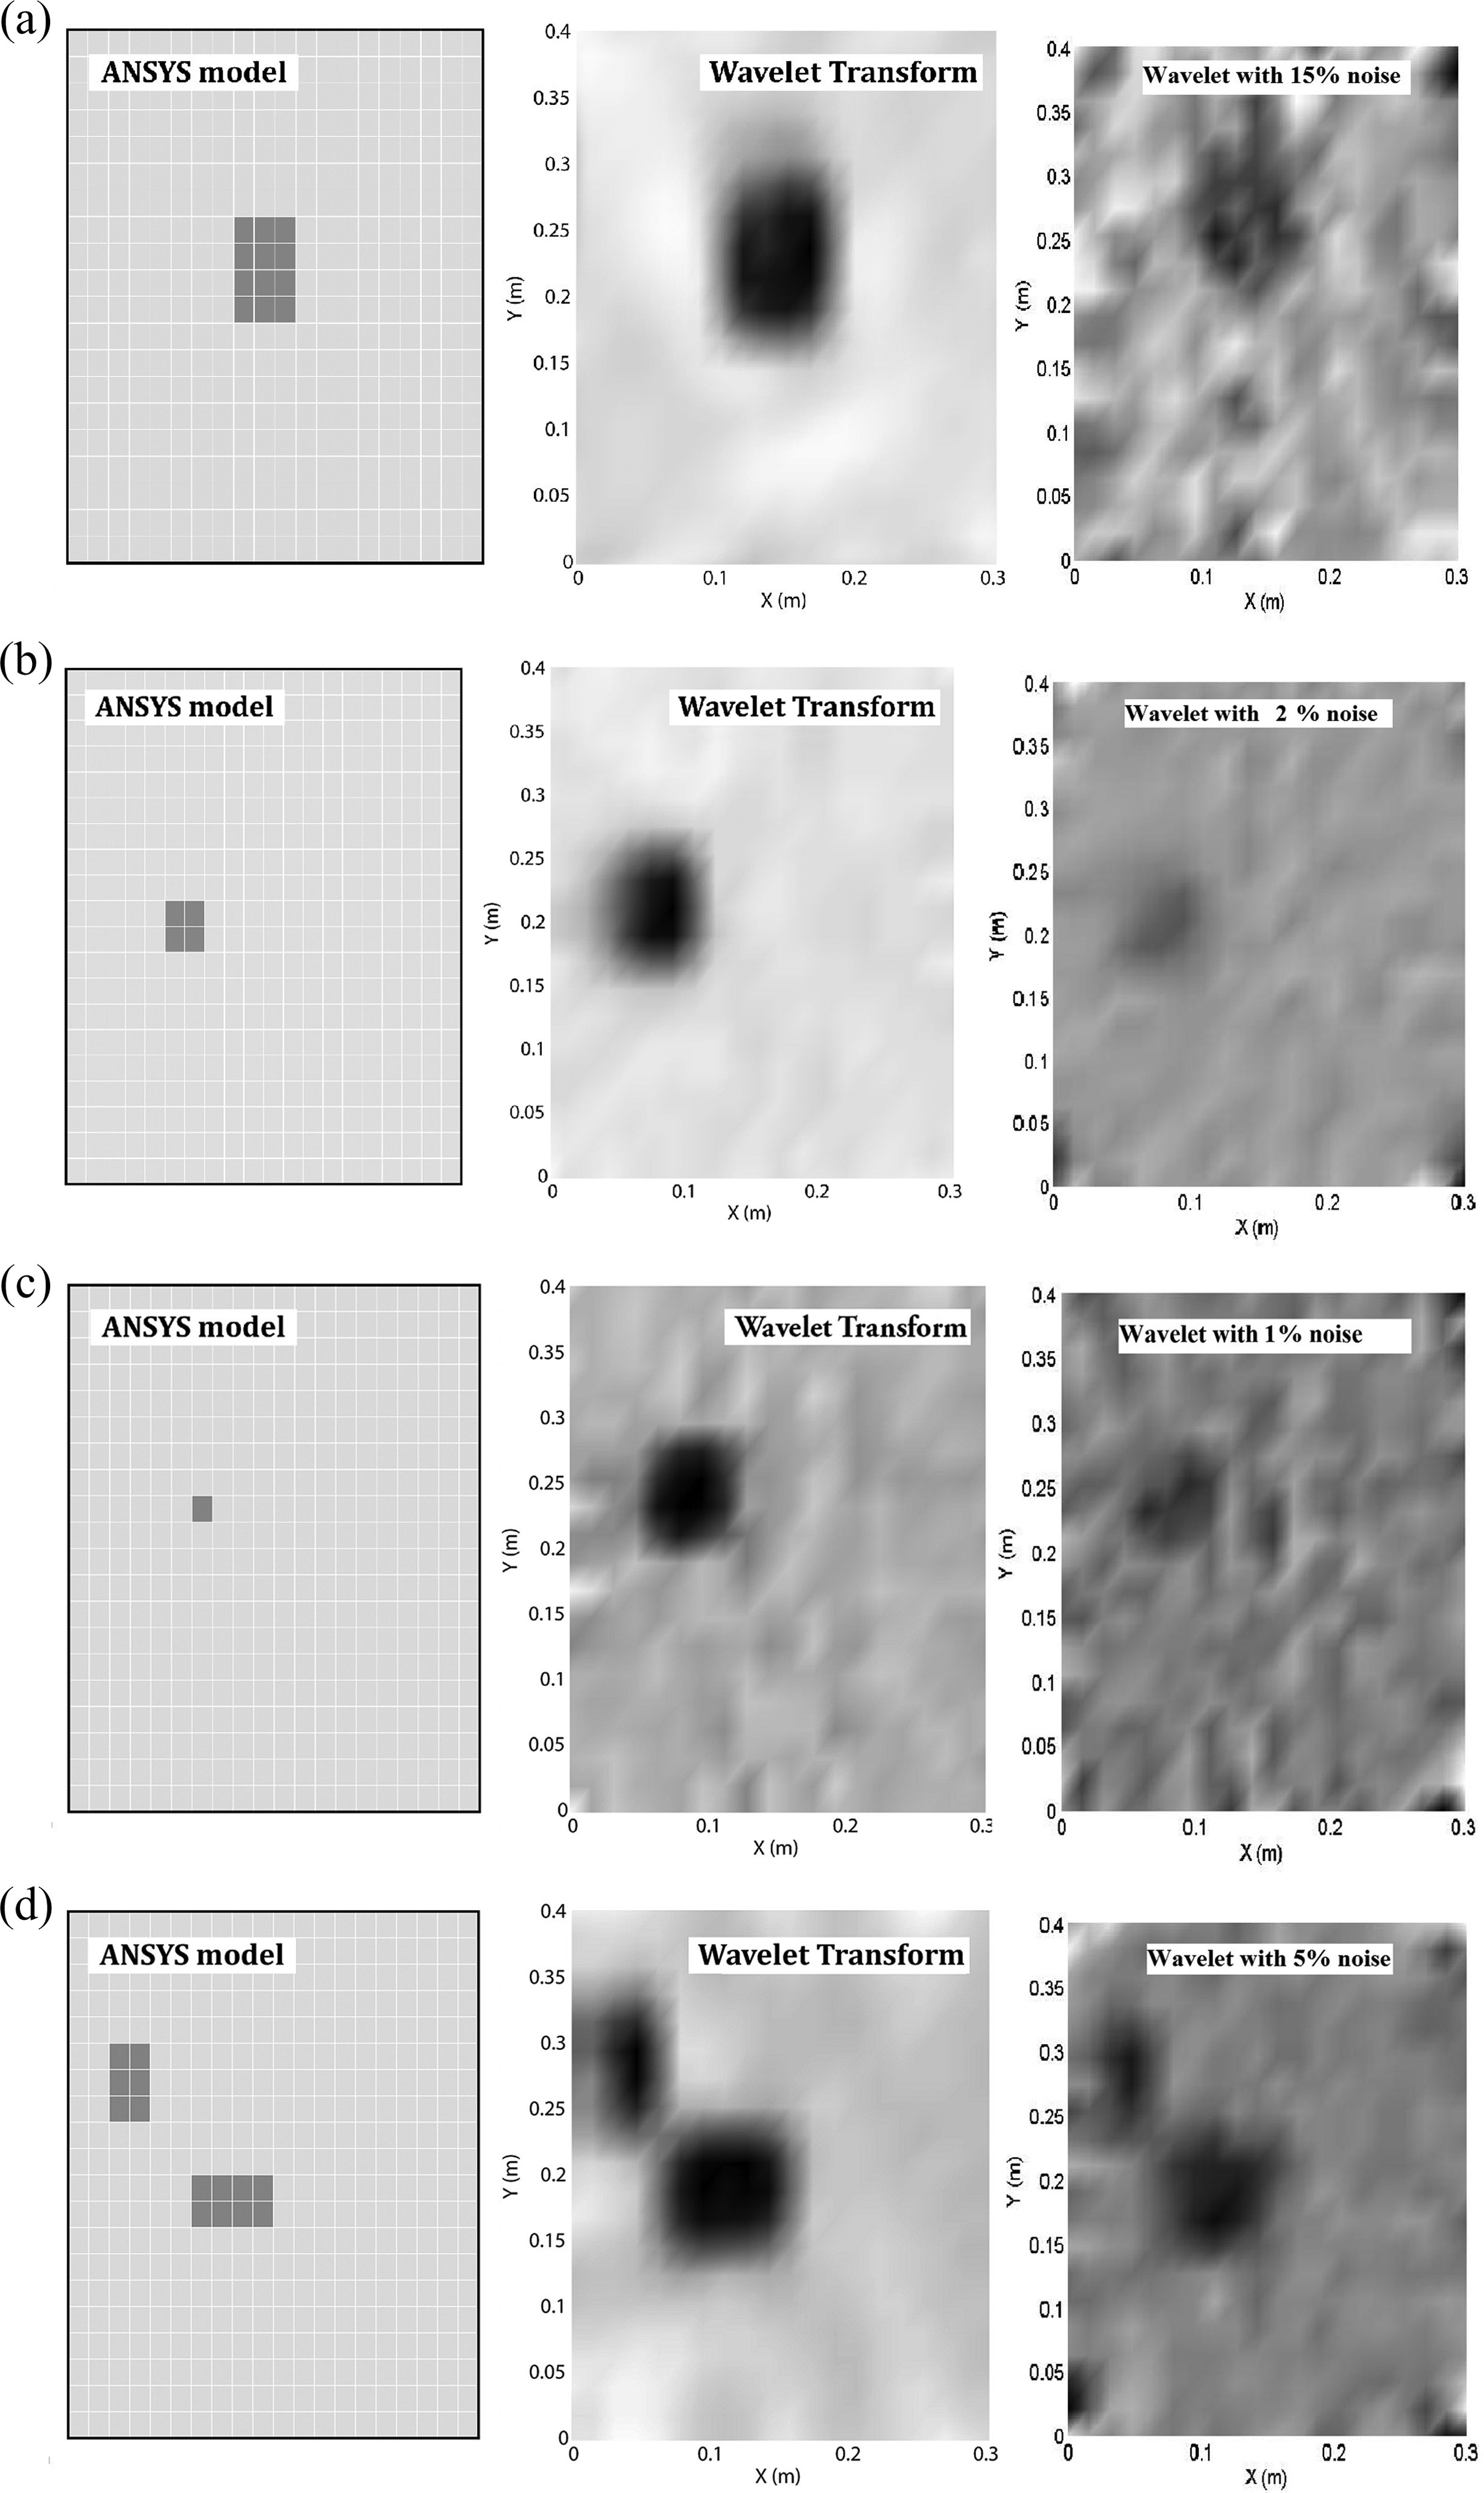
The damaged plate includes a delamination embedded at (x 0 = 120 mm, y 0 = 90 mm) with the size of 60 mm × 80 mm (4% damage). The damaged plate was manufactured in a two-step process. First, a three-layered laminated composite was built, then a two-layered plastic piece was set and located on the delamination zone to model the delamination damage. Finally, a five-layered laminate was fabricated and adhered to three-layered laminate fabricated earlier for the entire installation.
To reduce the uncertainties resulting from a lack of repeatability in the manufacturing, the intact and damaged specimens were made by cutting slices from a piece of a sheet. The number of measurement points in the modal test was 11 × 11 (totally 121 points). The manufactured plates are shown in Figure 8. The specifications of the damage in the plate are shown in Figure 2.
Composite specimens for experimental modal testing.
Modal test
We used a B&K data logger which is capable of recording data simultaneously in six channels. In addition, the PULSE LabShop v.8.0.0.111 software was utilized to process the data and a KISTLER hammer was used for excitation.
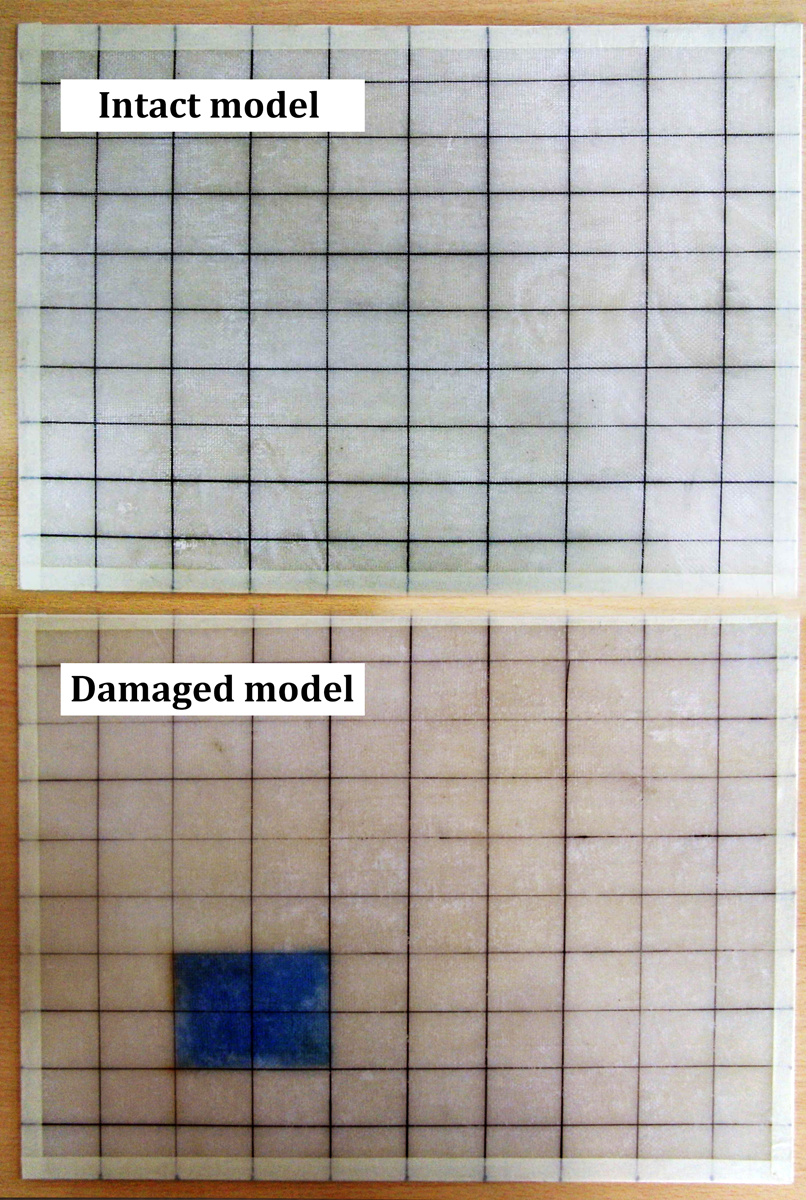
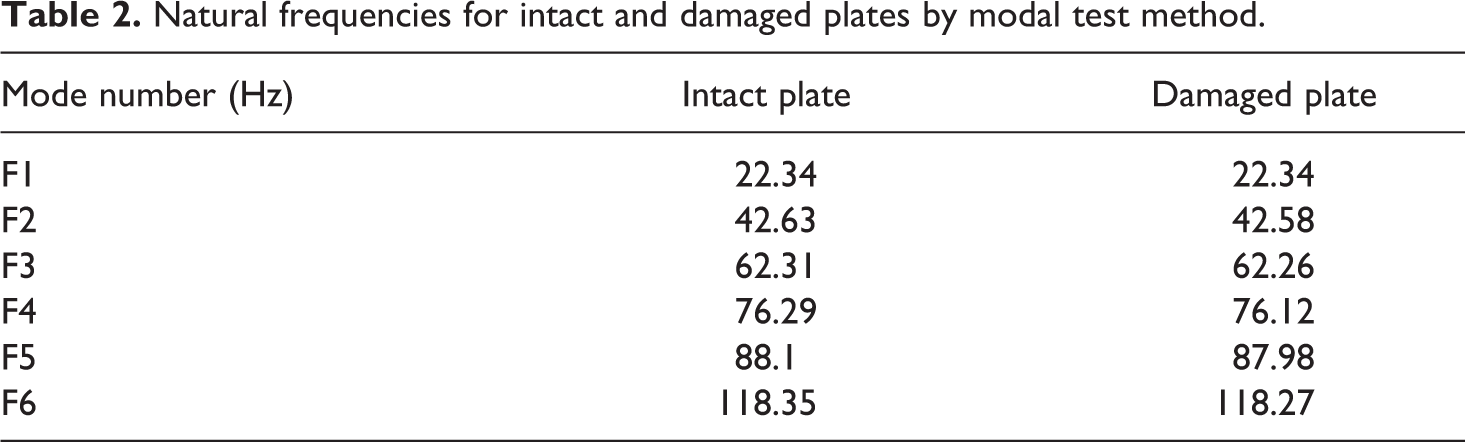
The plates were meshed by rectangular of 3 × 4 cm2. Figure 9 shows the configuration in which the plate was hung to simulate free–free boundary conditions. Also, a sensor was similarly located at the edge of the plate in both intact and damaged states which must be cancelled its effect by the mass cancellation method in the classic modal analysis. But, given the similarity of the installation in these cases, added mass sensor was not effective in the damage detection and just the difference between the modal properties of the intact and damaged states was used to detect the damage. Table 2 shows the first six natural frequencies from the modal test measurements by hammer excitation. 33
Modal test set-up.
Natural frequencies for intact and damaged plates by modal test method.
Damage detection in the experimental model
This section mainly focuses on the extraction of strain energy ratio using mode shape data. The number of measurable modes in this case was the first N = 6 elastic modes. To extract the lifting scheme wavelet as the final wavelet function, the impulse response function similar to the approach described in numerical validation should be considered.
After the application of the proposed wavelet function on the signal obtained from equation (28) with experimental data, damage detection process on the defected sample is carried out. The identified damage location is according to Figure 10.
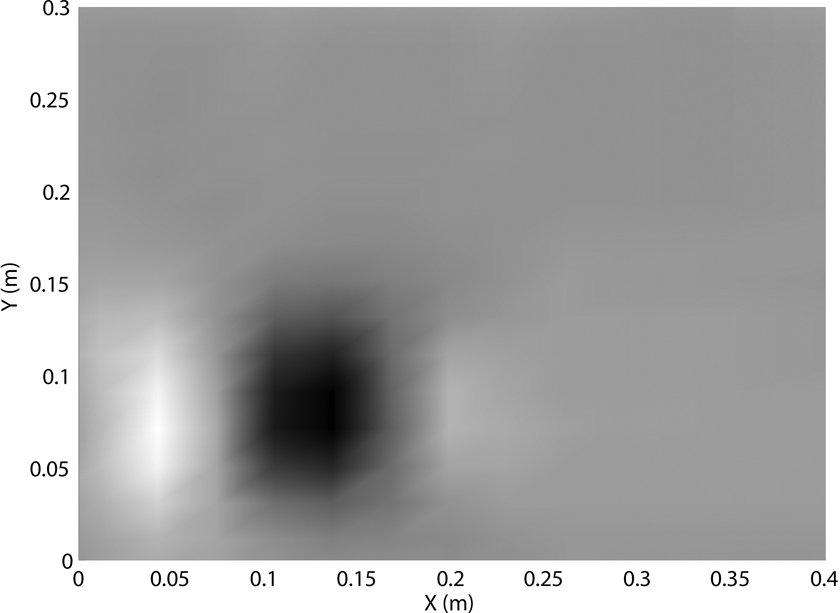
The result for damage location identification in the experimental sample.
In that case, the effect of all scale factors and six mode shapes are simultaneously taken into account.
Presentation of a criterion for the comparison of wavelet capability for damage detection
Due to lack of any specific criteria to quantitatively inspect the wavelet transform effectiveness of damage detection, an experimental criterion σ for evaluating the accuracy of wavelet is presented. It aims to assess the proposed method for the selection of wavelet function based on trial and error.

in which D is the wavelet maximum amplitude in damage area, a is the ratio of identified area to the true damage area in case this proportion is less than unity; otherwise it is reciprocated, and finally, d is the ratio of plate’s diameter to the plate’s diameter plus wavelet’s geometric centre distance from the defect.
In equation (31), all the parameters have the same contribution. This indicator is normalized relative to unity as follows:

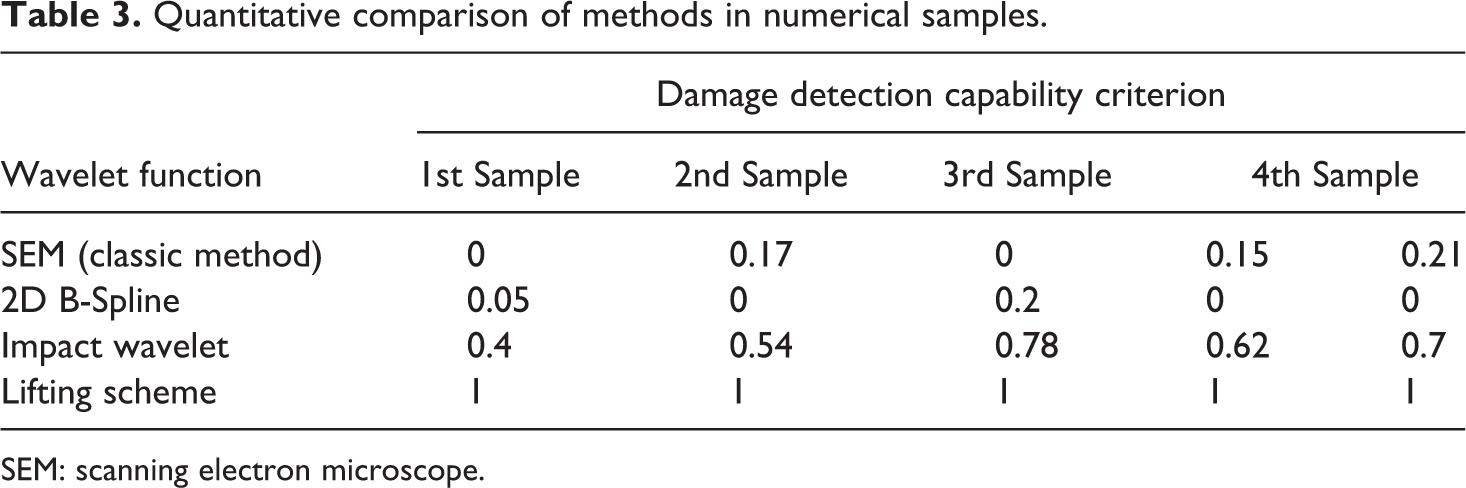
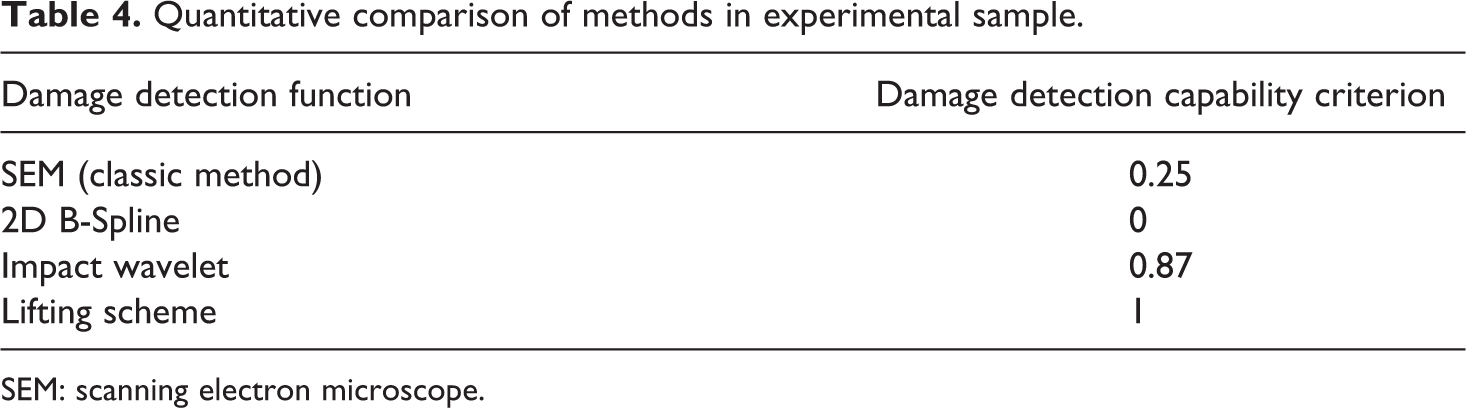
As a result, the better choice is the effectiveness of the wavelet possessing a closer damage detection indicator to unity. Using this criterion, analysis and comparison are carried out on the presented wavelet with one of the common wavelet that was suggested in references for damage detection (B-Spline). 11 The natural frequency, mode shape or a combination of them is the most common signal used for the classical wavelets. Mode shape signal is exploited as a sample for 2D B-Spline wavelet. The results of numerical samples and experimental samples are presented in Tables 3 and 4, respectively.
Quantitative comparison of methods in numerical samples.
SEM: scanning electron microscope.
Quantitative comparison of methods in experimental sample.
SEM: scanning electron microscope.
The proposed wavelet can help in providing a more proper result to detect the damage for both numerical and experimental samples. However, the selected signal exhibited high quality and possessed the highest sensitivity with regard to the presence of damage.
Summary and conclusion
The current study considered DWT since it has lower computational cost than continuous wavelet transform. In the classical methods, selection criterion of an appropriate wavelet transform is in the form of trial and error for each case study without considering the signal’s characteristics. Therefore, this study presented and examined design algorithm with attention to the signal’s nature. Moreover, through lifting scheme algorithm named as second-generation wavelets, the qualification of this wavelet was enhanced. Considering the results of this study and the goal of detecting damage in composite plates, the proposed wavelet can result in a more proper result for the numerical sample (without noise and possession of many modes) and experimental sample (having noise and limited modes). Choosing the right signal for the application of wavelet transform is crucial after designing the best wavelet function for damage detection. An appropriate signal is the one which has a suitable sensitivity relative to the presence of the defect and can converge to a desired output with minimum number of mode shapes. Thus, the present study applied the weighted strain energy ratio signal as the main signal using natural frequency. To eliminate the effect of boundaries in wavelet transform, first, the two-dimensional signal was converted to a stringed signal. Then, through the application of wavelet transform, wavelet coefficients were transformed from string to plane form. It is suggested to consider effectiveness in all directions by summing plane form wavelet coefficients in two directions. Summation of these coefficients for different scale factors was used to investigate wavelet coefficients in all scale factors. Additionally, summing wavelet coefficients in various mode shapes was used for simultaneously assessing wavelet in all mode shapes. Finally, this study introduced a quantitative criterion that compares the common wavelet methods and classical damage detection methods for examining the superiority of the selected wavelet function.
Footnotes
Declaration of Conflicting Interests
The author(s) declared no potential conflicts of interest with respect to the research, authorship, and/or publication of this article.
Funding
The author(s) received no financial support for the research, authorship, and/or publication of this article.