
Abstract
Tailoring the properties of natural polymers such as electrical conductivity is vital to widen the range of future applications. In this article, the potential of electrically conducting multi-wall carbon nanotube (MWCNT)/polylactic acid (PLA) composites produced by industrially viable melt mixing is assessed simultaneously to MWCNT influence on the composite’s mechanical strength and polymer crystallinity. Atomic force microscopy observations showed that melt mixing achieved an effective distribution and individualization of unmodified nanotubes within the polymer matrix. However, as a trade-off of the poor tube/matrix adhesion, the tensile strength was lowered. With 10 wt% MWCNT loading, the tensile strength was 26% lower than for neat PLA. Differential scanning calorimetric measurements indicated that polymer crystallization after injection moulding was nearly unaffected by the presence of nanotubes and remained at 15%. The resulting composites became conductive below 5 wt% loading and reached conductivities of 51 S m−1 at 10 wt%, which is comparable with conductivities reported for similar nanocomposites obtained at lab scale.
Keywords
Introduction
Polylactic acid (PLA) is a promising bio-based and biodegradable thermoplastic, envisioned to increasingly replace oil-based plastics. It has already been successfully established for applications ranging from textiles, medical appliances to food packaging. 1,2 The demand for bio-based polymers is expected to grow significantly during the next few years. Based on 2012 capacities, the bioplastic production in Europe has been forecasted to increase 400% by 2017. 3 Plastics are generally electrically insulating materials (specific volume conductivity σ < 10−9 S m−1), due to the very low conductivity of their polymer matrices. 4 As a consequence, electrical charges may accumulate at plastic product surfaces resulting in detrimental effects that range from the electrostatic attraction of dust to the induction of electrical shocks to handlers and electronic systems. To prevent the accumulation of surface charges, the conductivity of the material must be larger than 10−9 S m−1, which classifies them as electrostatic dissipative materials. 1 Various additives and treatments have been developed to increase the conductivity of oil-based polymers above this limit. 4 Achieving the same for biopolymers, i.e. controlling the electrical conductivity of biopolymers, it is essential to enable a much broader range of applications spanning from packaging of electronic items and dangerous goods containers, to automotive components. 1,4 –8
Conducting fillers such as carbon fibres (CFs), carbon black (CB), metallic fibres and powders, as well as powders of layered minerals, are commonly used to enhance the permanent conductivity of composites. 4 Depending on filler type and loading, the composites can reach conductivities above 10−3 S m−1 and thereby enter the group of electrically conductive materials. 4 Recent research on conductive composites has been focussed on the utilization of carbon-based nanofillers, especially on carbon nanotubes (CNTs). 9 –11 CNTs are particularly attractive as they combine many outstanding properties including mechanical strength and stiffness as well as thermal and electrical conductivities that are superior to most other fillers. 12–14 Additionally, their high aspect ratio (length/diameter, typically up to 10,000) leads to particularly low electrical percolation thresholds, offering also a large surface area to interact with the matrix. 13–14
The preparation of electrically conducting materials based on CNTs has been described. 4,15 It was found that to achieve the desired high conductivities, a good dispersion of the CNTs in the polymer matrix is critical. Poor dispersion resulting from bundling and entanglement of the CNTs leads to unnecessarily high percolation thresholds, leading to CNT wastage and poor composite homogeneity. 16 For optimal CNT dispersion, various preparation methods have been tested among which melt processing is the most suitable for industry. 15,17 During melt processing, high shear forces are applied to the material by a co-rotating twin extruder. 15 Shear forces can be increased by using high rotation speeds and highly viscous mixtures. 15 The latter is exploited by loading the polymer with higher concentrations of CNTs to produce masterbatches, followed by diluting them with pure polymer to the desired concentration. 15,17
While the degree of dispersion of the filler is mostly determined by the processing of the melt, subsequent shaping processes may also have an effect on the properties of the resulting composite. 16,17 Different shaping processes such as injection moulding, compression moulding, extrusion and film blowing can be employed depending on the object to be produced. Injection moulding is known as one of the most common procedures in industry. 18 An interesting example is mentioned by Peget et al. 16 where injection moulding with CNT at low pressing speed and high temperatures was performed. They observed secondary CNT agglomeration during pressing, which also induced an increase in electrical conductivity of the composites due to improved contacts between the CNTs. 16,19
Another critical issue for CNT-composite manufacturing is the interaction between the filler and the polymer. 20 –23 Filler–polymer adhesion can be improved by using polymers with higher affinity to the filler or by CNT surface modifications such as grafting and oxidation. 2,17,22,23 In general, improved filler–matrix adhesion leads to improved CNT dispersion and enhanced mechanical properties. 2,17 However, aggressive surface treatment such as oxidation degrades the CNTs and therefore compromises their properties. Thus, on one hand, chemical modification of the CNT surfaces enables good dispersion of the tubes in the polymer matrix, which shifts the practical electrical percolation threshold towards a lower loading. On the other hand, chemical modification requires an additional and complex processing step and may decrease the aspect ratio of the MWCNT and hinder the direct contacts between the nanotubes. As a consequence, percolation threshold may increase, which degrades electrical conductivity of the composite. 17,24
Most of the prevalent literature on CNT–PLA thermoplastic composites is concerned with the effects of surface modification of multi-wall carbon nanotubes (MWCNTs) on material properties and the development of mixing processes. 19,25–26 The MWCNTs are attractive, as they are the cheapest type of CNT to produce and they offer the opportunity of surface modification without detrimental effects on the inner layers. 10,11,13 However, surface modification may not be necessary to sufficiently disperse the tubes in the polymer matrix as shown in the studies by Mack et al., 22 Villmow et al. 15 and Novais et al. 27 These authors used unmodified MWCNTs in polycarbonate and PLA to produce composites by melt mixing followed by compression moulding or injection moulding, obtaining reasonable dispersion and electrical conductivities. Novais et al. 27 even obtained higher conductivities on compressed plates when adding unmodified MWCNTs to PLA instead of PLA-grafted MWCNTs. This is consistent with the hypothesis that grafting hinders electrical tube/tube contacts.
The MWCNTs have also been demonstrated to influence the crystallization of semi-crystalline thermoplastics. The relatively low crystallization rate makes the PLA more elastic, which is of interest for blow-forming and film production processes. 28,29 However, for the production of technical plastics, crystallinity closer to the maximal crystallinity of PLA is preferred, as it is associated with a higher glass transition temperature, improved thermal resistance, enhanced barrier properties and higher mechanical strength. 28,29 Of particular interest is to maximize the crystallinity of plastic materials during high productivity production processes, for which the cooling time is minimized. 28 Therefore, the ability of different nanofillers, including MWCNTs, to nucleate PLA crystallization has been studied. 11,17,21,28–32 Through nucleation, the formation of numerous and more homogenous repartitions of spherulites are induced throughout the composite. 29 Zhang et al. 33 could demonstrate the nucleation effect of MWCNTs but also reported that crystallization would affect the MWCNTs environment in various ways. On the one hand, some studies explained that when MWCNTs act as a nucleating agent, their surface will be covered by a crystalline polymer layer. 17,15,25,34,35 This is of importance when using MWCNTs to build a conductive network in a semi-crystalline polymer as it could prevent direct contact between the MWCNTs and thereby hinder the transfer of electrons through the composite. 17,18,35 On the other hand, other studies described that the MWCNTs were more present in amorphous regions after crystallization. 1,25 Leute 4 explains that in semi-crystalline polymers, nanosized fillers such as carbon black (CB) are excluded from the crystalline regions during crystallization and remain in amorphous regions.
Only few researchers related the electrical conductivity of nanocomposites to its crystallinity. 31,35 Among them, Alig et al. 35 found that through annealing (between 210 and 220°C for less than 15 min) MWCNT-polypropylene (PP) composites, increased conductivity of the composites could be reached. To our knowledge, the present study is the first one characterizing the effect of unmodified MWCNTs on electrical conductivity, with simultaneous measurements of the polymer crystallinity and the mechanical properties of injection-moulded PLA-based composites. As no modification of the MWCNTs surface was performed, the interaction between MWCNTs and the polymer matrix is supposed to be weak. 30,32 Therefore, we expect a decrease in tensile strength as the content of MWCNTs is increasing, as observed before, for example, by Yoon et al. 32 We suggest that the MWCNTs are having a nucleation effect on the PLA crystallization after injection moulding, which affects MWCNTs distribution and thereby the electrical conductivity of the composite. Through our research, we are suggesting an industrially viable way of processing electrically conductive and injection-moulded nanocomposites.
Experimental
NatureWorks® IngeoTM (Minnetonka, Minnesota, USA) 3251D Injection grade PLA was used. This PLA type has a melt flow index of 70–85 g 10 min−1 (at 210°C 2.16 kg−1); ASTM D1238) and a density of 1.24 g cm− 3 (ASTM D792). With the low D-isomer content of 1.40 ± 0.20%, higher crystallinity levels are anticipated.
MWCNTs were provided by a local supplier as a powder. The MWCNTs were produced through catalytic chemical vapour deposition process followed by separation of the CNTs from the catalyst by rinsing with citric acid and subsequent drying between 600°C and 1000°C. The amount of the metal catalyst remaining after purification was monitored by thermogravimetric analysis under air. A mean residual mass of 3 wt% ± 1.2 at 700°C was determined from five MWCNT samples. According to the supplier, the tubes had a diameter of less than 50 nm and their average length varied between 1 µm and 20 µm. This was further confirmed by scanning electron microscopy (SEM) using the Field Electron and Ion Co. (FEI) Inspect S50 environmental SEM with a tungsten gun. The dimensions were determined using ImageJ64 software and an average diameter of 38 ± 10 nm was found for 45 randomly selected MWCNTs. It was difficult to assess the length of the nanotubes, as they were entangled but the observable length was found to be higher than 1 µm for all tubes. MWCNTs had a density between 1.6 g cm− 3 and 1.8 g cm− 3. The specific electrical conductivity of the individual MWCNTs as given by the producer was 105 to 106 S m−1 with a maximum electric current density of up to 1013 A cm−2.
A 10 kg masterbatch of 15 wt% MWCNT in PLA was produced by mixing dry MWCNTs with melted PLA in a ZSE 27MAXX extruder (Leistritz (Nürnberg, Germany)) equipped with co-rotating screws (MAXX 40 D) suitable for nanomaterials compounding. The used rotation speed was 450 rpm, and the temperature profiles were set between 200°C and 230°C. The masterbatch was diluted with neat PLA to a MWCNT content of 0, 0.5, 1, 2.5, 5, 7.5 and 10 wt% through melt mixing using a miniature Collin® ZK25 (Ebersberg, Germany) counter-rotating twin screw extruder. During the second extrusion step, the melt temperature was kept constant at 175°C and the pressure measured at the output varied between 24 bar and 42 bar. The extruded strands were cut into granules (length 4 ± 2 mm) for further processing. To limit sticking of the granules in the injection moulding feeding zone, the PLA crystallinity was increased by thermal annealing for 4 h at 120°C and subsequent storage at 80°C to avoid water uptake. Bars were injected following the standard ISO 179/1eU specifications on a Battenfeld (Vienna, Austria) HM 60/210 with the barrel temperature set to 180°C. Injection pressure varied between 631 and 996 bar and injection temperature was kept constant at 175°C. Prior to testing, test bars were stored in a climate room at 23°C and 50% relative humidity for 2 weeks.
Scanning electron microscopy
The pure nanotubes were observed with a scanning electron microscope FEI Inspect S50® under high vacuum mode, using 15 kV acceleration voltage and a medium spot size of 3 mm. This SEM and a Quanta™ (http://www.fei.com/products/sem/Quanta-SEM-for-Materials-Science/) 250 FEG SEM were used to observe fractured surfaces of the composites after tensile tests.
Atomic force microscopy
Atomic force microscopic (AFM) images of sample cross sections of the injection-moulded composites were acquired to investigate dispersion and distribution of the MWCNTs in the matrix. Cross-section surfaces for AFM imaging were prepared with a diamond knife mounted in an ultramicrotome. The AFM measurements were performed using a Veeco® (Plainview, New York, USA) Dimension Icon scanning probe microscope with ScanAsyst™ (Madison, Wisconsin, USA) in tapping mode. Soft tapping mode aluminium (Al)-coated probes with a force constant of 5 N m−1 and tip radius of <10 nm were used. Images on minimum five different locations were recorded on each sample. Topography images were complemented by phase images to visualize surface stiffness. Stiffer regions show a more positive phase shift and therefore appear lighter in the phase images. 36
Mechanical properties
Tensile tests were carried out on a Zwick-Roell ZmartPro (Ulm, Germany), following ISO 527. Charpy unnotched impact tests were conducted following ISO 179/1eU. Each test was repeated 10 times. Mean values are plotted with the corresponding standard deviation.
Polymer crystallinity
The effect of MWCNTs on polymer crystallization was assessed by a differential scanning calorimetry (DSC) 200 F3 Maia® (Netzsch [Selb, Germany]). Measurements were done on three samples for each compound containing 0, 1, 2.5, 5 and 10 wt% MWCNT. The samples for crystallinity determination were cut from the tensile test bars, with masses between 5 mg and 15 mg, and were then placed into the aluminum DSC pans. Samples were heated and cooled twice under nitrogen atmosphere, between 25°C and 200°C, at a heating rate of 10°C min−1. Crystallinities were calculated following equation (1) and indicated by
In equation (1),
Polarized light microscopy
Polarized light microscopy was used to determine the position and amount of crystalline regions in the composites depending on the cooling speed. Thin sections were cut from the centre of the injected-moulded bars through microtoming for MWCNT loadings of 0 and 1 wt%. The sections were placed between two glass slides and kept in an oven at 175°C for 20 min to obtain a thin layer of material. To assess the effect of cooling speed on the crystallization process of PLA, the melted samples were cooled down at two different cooling speeds. A first set of six sections was taken out from the oven and stored in a cooled room at 15°C for 2 h. The second set of samples was kept in the oven when cooling the oven temperature down to ambient temperature at a slow cooling rate of around 1°C min−1. Images of the films were obtained with an Axio Scope A1 (Zeiss [Oberkochen, Germany]), equipped with polarized light module.
Electrical conductivity measurements
The specific electrical conductivity was determined by the four-point method following European standard EN ISO 3915 (Figure 1), performed on rectangular samples sized 70 × 10 × 4 mm3. In the four-point measurement configuration, the electrodes are fixed on the cut surfaces and the sensor electrodes measuring the actual electric voltage are positioned on an unmodified surface. The advantage of this configuration is that the contact quality between the shell electrodes and the sample does not influence the electric tension measured between the sensor electrodes. The four electrodes are positioned in a row parallel to injection direction. The required voltage of up to 60 V was generated by the digital DC power supply D3022 (CYE) applied by clamped shell electrodes. Two sensor electrodes were fixed at a constant distance (d) of 10 mm. Three samples were measured for each MWCNT loading. The mean value of the conductivity for each composite was obtained by averaging the measurements.
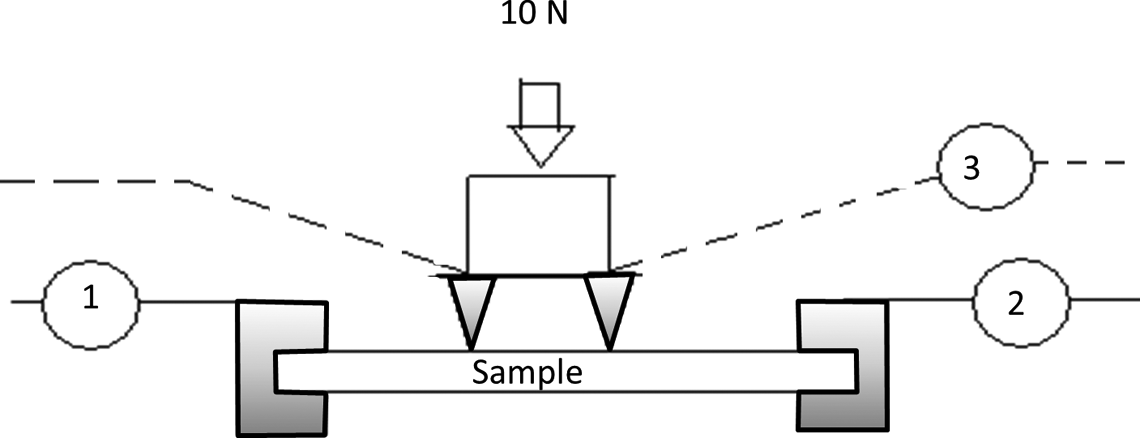
Installation of electrical conductivity determination, 1 is the voltage source, 2 the ammeter and 3 corresponds to the multimeter in the voltmeter mode. The electrodes are represented in grey colour.
The specific electrical conductivity σ was calculated using equation (2).
In equation (2), d is the distance between the sensor electrodes in m and A is the cross section surface of the sample in m2. The voltage ΔU was measured between the two sensor electrodes of a Solartron Schlumberger (Leicester LE4 9JQ, GB) 7150 Digital multimeter. The current value I provided by the power supply on the circuit was measured by an Amprobe® multimeter. This configuration measures the resistivity in the flow direction. Readings were taken after 1 min of stable current (set to values between 0.3 mA and 25 mA depending on sample conductivity) and stable mechanical loading on the sensor electrodes of 10 N applied by a Zwick/Roell ZmartPro. Because of the voltage source limitations, it was only possible to measure specific resistivity from 1 Ω.cm to 1 kΩ.cm. However, this corresponded to specific conductivities between 101 S m−1 and 102 S m−1, which includes the transition from conductive to semi conductive materials. The percolation threshold, which is usually determined at much lower conductivity ranges, could therefore not be precisely determined.
Results and discussion
Filler distribution and dispersion
Fracture surfaces of the PLA composites with increasing MWCNT loadings were investigated by SEM (Figure 2). The addition of 0.5 wt% of MWCNTs (Figure 2(a)) did not significantly affect the appearance of the surface and the filler could not be located. However, increasing the loading to 1 wt% rendered the fracture surface flaky (Figure 2(b)). The surface texture became even rougher at 5 wt% and 10 wt% (Figure 2(c) and (d)). Even though the nanotubes could not be resolved by SEM, their effect on the texture of the fracture surfaces was evident.
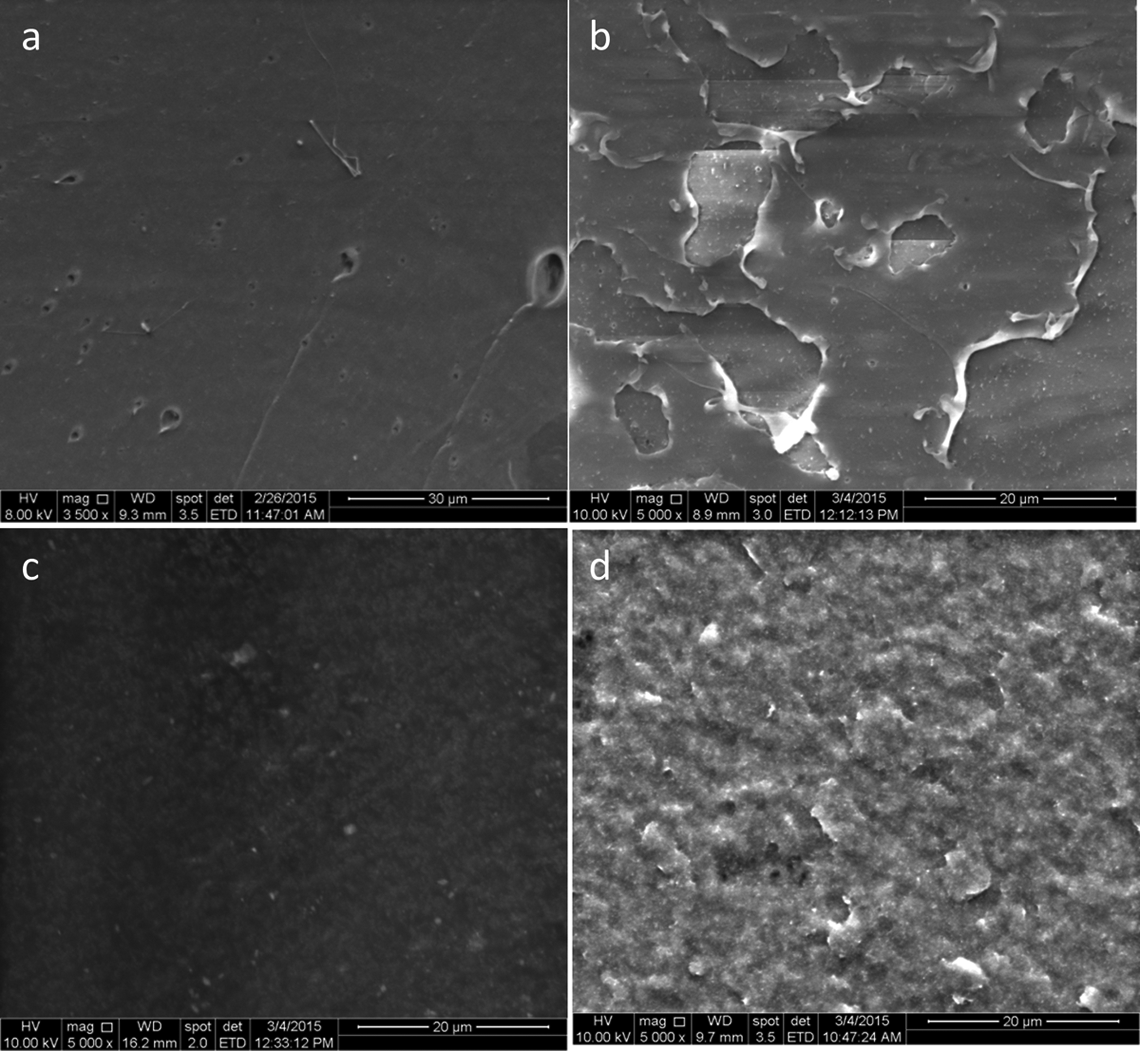
Scanning electron microscopic images of the fracture surface of PLA with (a) 0.5 wt%, (b) 1 wt%, (c) 5 wt% and (d) 10 wt%. MWCNT loading. The image (a) was recorded after applying a gold coating on the surface; the others images were recorded without gold coating. The scale bar in each image corresponds to 20 μm. MWCNT: multi-wall carbon nanotube; PLA: polylactic acid.
To elucidate in detail how the filler was incorporated into the polymer matrix, high-resolution AFM imaging was performed in tapping mode (Figure 3). For all tested composites containing MWCNT fibrous structures with diameters of around 20 nm could be observed. Considering the measurement error due to the comparatively large tip diameter, this was within the range of the diameter measured for the raw CNT, which suggests that the fibrous structures are MWCNTs. The AFM images indicated that the tubes are quite evenly distributed in the polymer matrix. Thus, it appears that for all of the investigated CNT loadings, the melt processing was effective in distributing the nanotubes homogeneously in the PLA matrix.
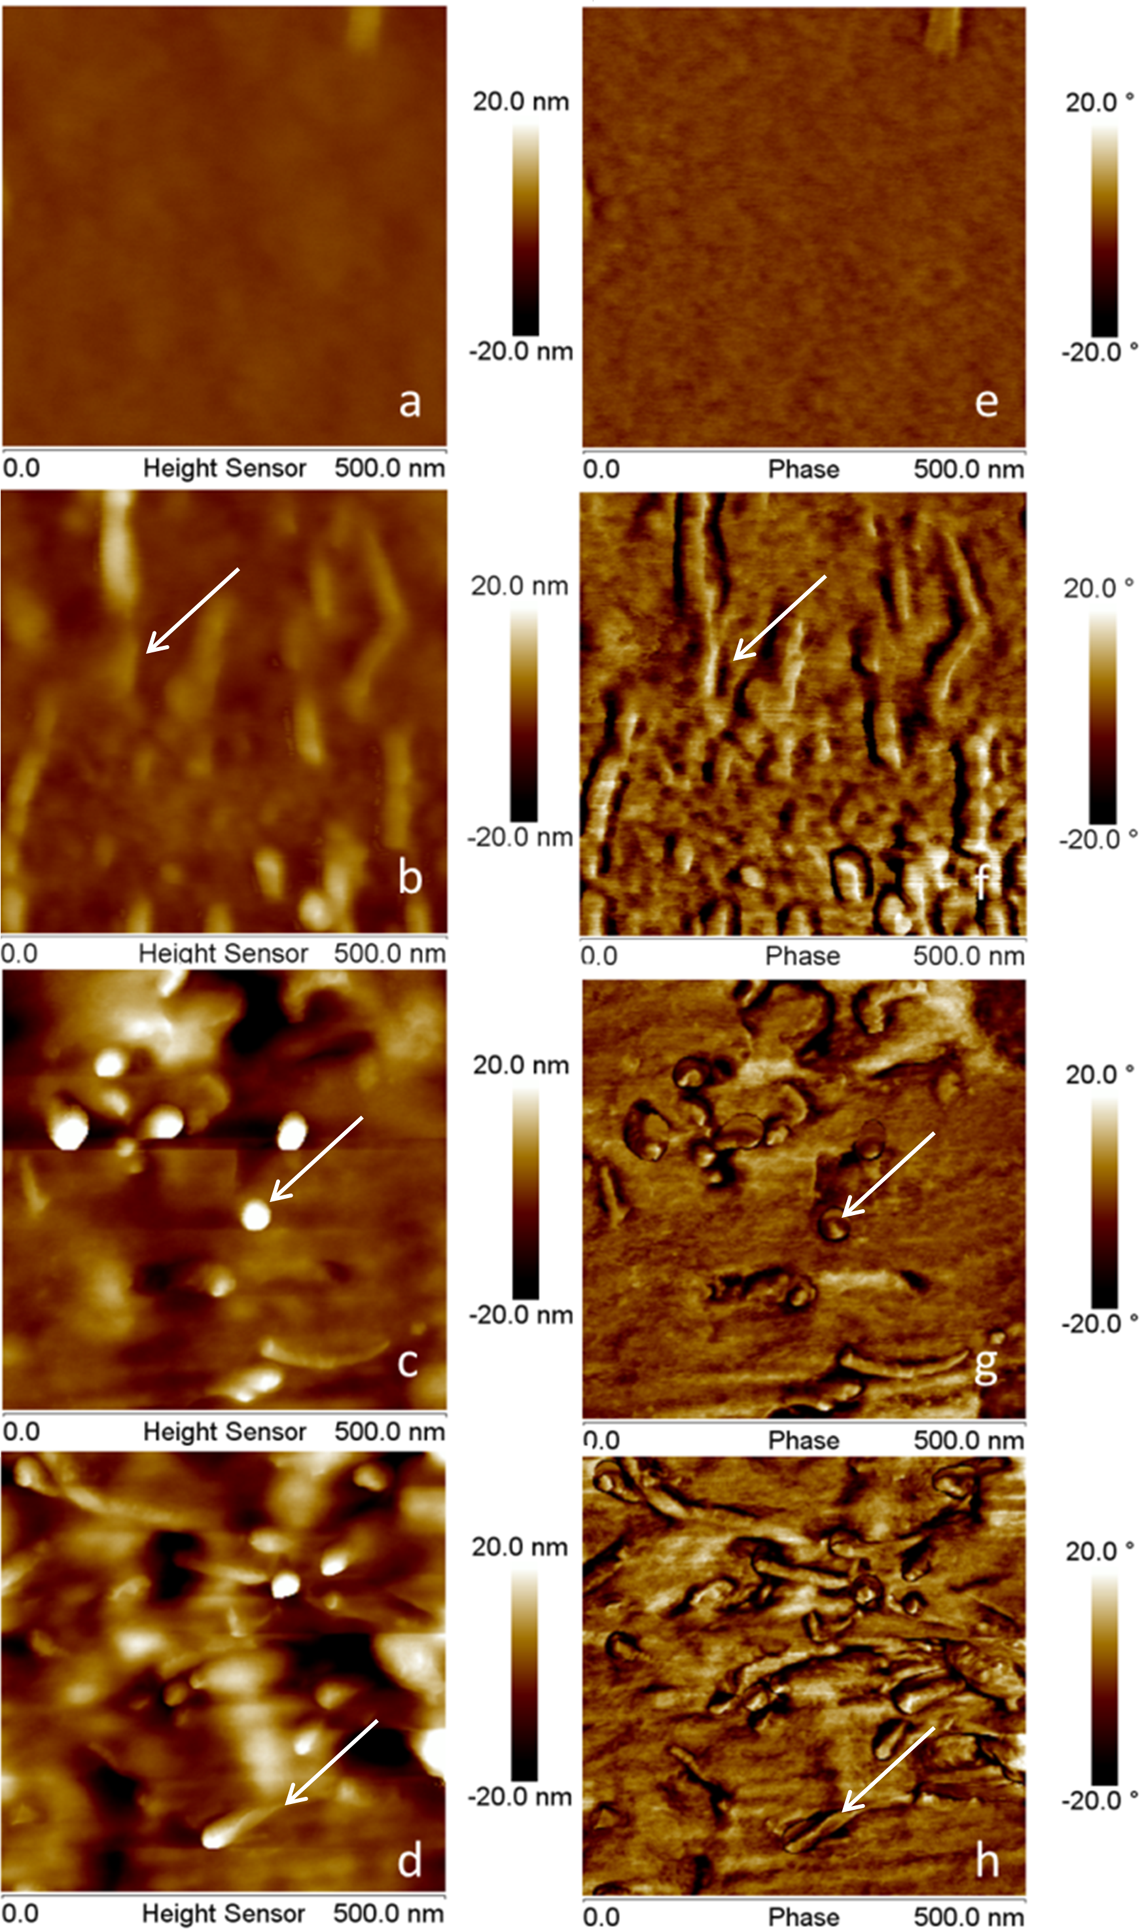
AFM topography (a–d) and corresponding phase images (e–h) recorded in tapping mode showing a section of 0.25 μm2 of the PLA composite with 0 (a, e), 1 (b, f), 5 (c, g) and 10 (d, h) wt% MWCNT. The arrows indicate MWCNT location. The cutting direction of the microtome is for every picture from the right to the left. MWCNT: multi-wall carbon nanotube; PLA: polylactic acid; AFM: atomic force microscopy.
In many of the AFM images recorded on the cross section of the composite containing 1 wt% MWCNT, the tubes appeared to be aligned (Figure 3(b)), whereas at 5 wt% and 10 wt% MWCNT (Figure 3(c) and (d)), no preferential orientation was found. The alignment can be due to flow alignment during injection moulding but as the cuts were made perpendicular to the flow direction, the nanotubes should be oriented perpendicular to the cutting direction, yet this was not the case. A more plausible explanation is a dragging of the MWCNTs by the microtome blade during cutting, as explained in the study of Ajayan et al. 39 Unexpectedly, the microtoming dragging effect on the tubes was not observed at higher nanotube loadings. The dominating features of the 5 wt% and 10 wt% MWCNT samples were curved tubes, and tubes that protruded from the surface (Figure 3(c) and (g)). This indicates to some degree an entanglement of the MWCNTs within the samples, having 5 wt% and 10 wt% MWCNT, which prevented pull out and secondary alignment of mobile MWCNTs on cut surfaces, which is assumed to take place with the 1 wt% loading.
In injection moulding, filler repartitioning and reorientation may occur depending on the mould geometry and filler shape. In the case of fibrous fillers, one expects the formation of two distinct regions: a skin layer and a core region. 18,21 –23 In the skin layer, an alignment of the fillers in injection direction is expected, due to the higher shear and quick cooling in this region. 18 As a result, this region is highly anisotropic. It has been found that the skin layer acts as an insulating layer when measured perpendicular to the skin layer (volume conductivity) but shows higher conductivities when measuring parallel to the plane of the skin layer. 21 –23 The AFM imaging from the core region of the composites with CNT loadings of 5 wt% and higher (Figure 3(c) and (d)) indicates interconnection without flow alignment and no dragging alignment due to cutting. This suggests that tube/tube contacts and MWCNT entanglement may inhibit the ordering and alignment in the skin layer, thereby improving electron transport into the material through the skin layer.
In the AFM images presented in Figure 3, the nanotubes appear distinct from the polymer matrix. Yoon et al. 32 described that the boundary between the PLA-grafted MWCNT and the PLA matrix was less discernible on the SEM of fractured surface, compared to unmodified MWCNT. This was explained by improved wrapping of the modified MWCNT by the polymer matrix. 32 The clear delimitation of the MWCNT in our study is in accordance with the expected restricted interaction between the unmodified MWCNTs and the PLA matrix, which results from the difference in their surface energies. Such a structure would favour the electrical tube/tube contact and potentially increase the conductivity of the composites.
In the AFM phase contrast images (Figure 3(e) to (h)), the CNTs can be clearly recognized because of their higher stiffness. It can also be seen that the stiffness of the polymer matrix increases as the proportion of filler increases. This suggests that the nanotubes might affect the mechanical properties of the matrix.
Tensile strength
To determine the effect of the interaction between the polymer and the unmodified filler, the tensile strength was measured (Figure 4). As the MWCNT weight fraction increases, the tensile strength decreases. At 10 wt% MWCNT loading, the tensile strength was 26% lower than for neat PLA. The poor interaction between MWCNTs and PLA is a plausible explanation for the observed decrease in tensile strength. Different trends for tensile strength, for unmodified MWCNT-filled thermoplastics, have been reported. Novais et al. 27 found an increase in tensile strength of hot-pressed panels when adding 0.5 wt% of unmodified MWCNT to PLA, but a decrease in tensile strength occurred with 1 wt%, compared to the neat polymer. Andrews et al. 8 studied the effect of unmodified MWCNT on polystyrene films and observed a tensile strength decrease of up to 55%, when 5 vol% (approximately 7.5 wt%) of MWCNT were added. They explained the initial decrease by the poor interaction between the MWCNT and the polymer and the presence of defects in the MWCNT structure. However, between 5 vol% and 15 vol% (7–22 wt%) MWCNTs, the tensile strength increased until it reached the value of neat polystyrene. This was explained by a bridging effect of clustered MWCNTs, which retarded the opening cracks induced by tensile stresses. Such behaviour was not observed in the present study.
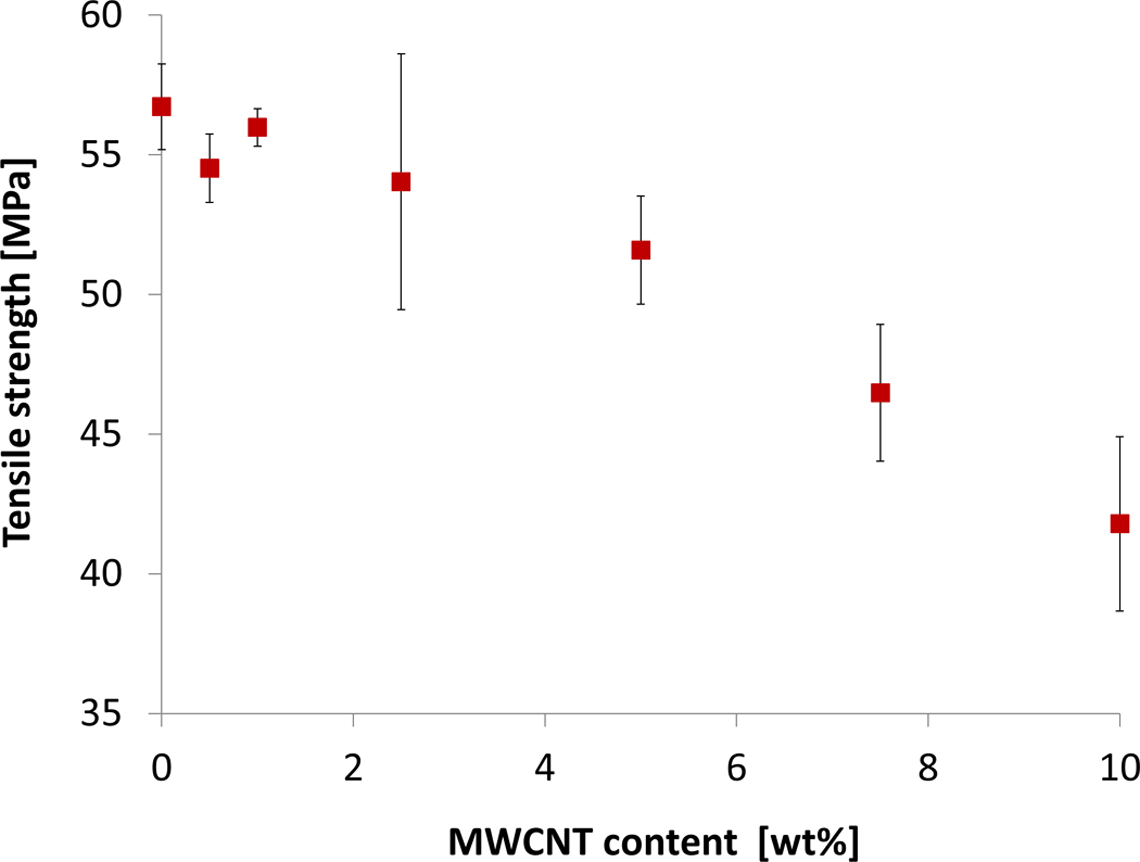
Mean tensile strength of 10 samples with corresponding standard deviation for each composite based on PLA at different MWCNT loadings. MWCNT: multi-wall carbon nanotube; PLA: polylactic acid.
MWCNT nucleation effect on polymer crystallization
DSC was used to assess the impact of unmodified MWCNT on the crystallinity of PLA in the injection-moulded parts (Figure 5). It is generally accepted that the crystallinity derived from the first heating cycle observed in DSC analysis corresponds to the thermal state obtained after injection moulding, while the second heating gives the crystallinity after a controlled cooling process. 37,40 As observed in Figure 5(a), the crystallinity measured during the first heating cycle is essentially unaffected by the MWCNT content. On the contrary, the crystallinity measured during the second heating was more than twice as high and generally increased with increasing MWCNT loading, reaching 57% crystallinity at 10 wt%. DSC curves (Figure 5(b)) revealed that for loadings higher than 2.5 wt% MWCNT, the onset of crystallization shifted to increasingly higher temperatures. The simultaneous increase of crystallinity and temperature at the start of crystallization is typical for heterogeneous nucleation induced by a filler. 31,32 As this was not observed during the first heating, we conclude that any potential nucleation effect of the MWCNTs was hindered by the relatively fast cooling during injection of the melt into the moulds, which were kept at 20°C.
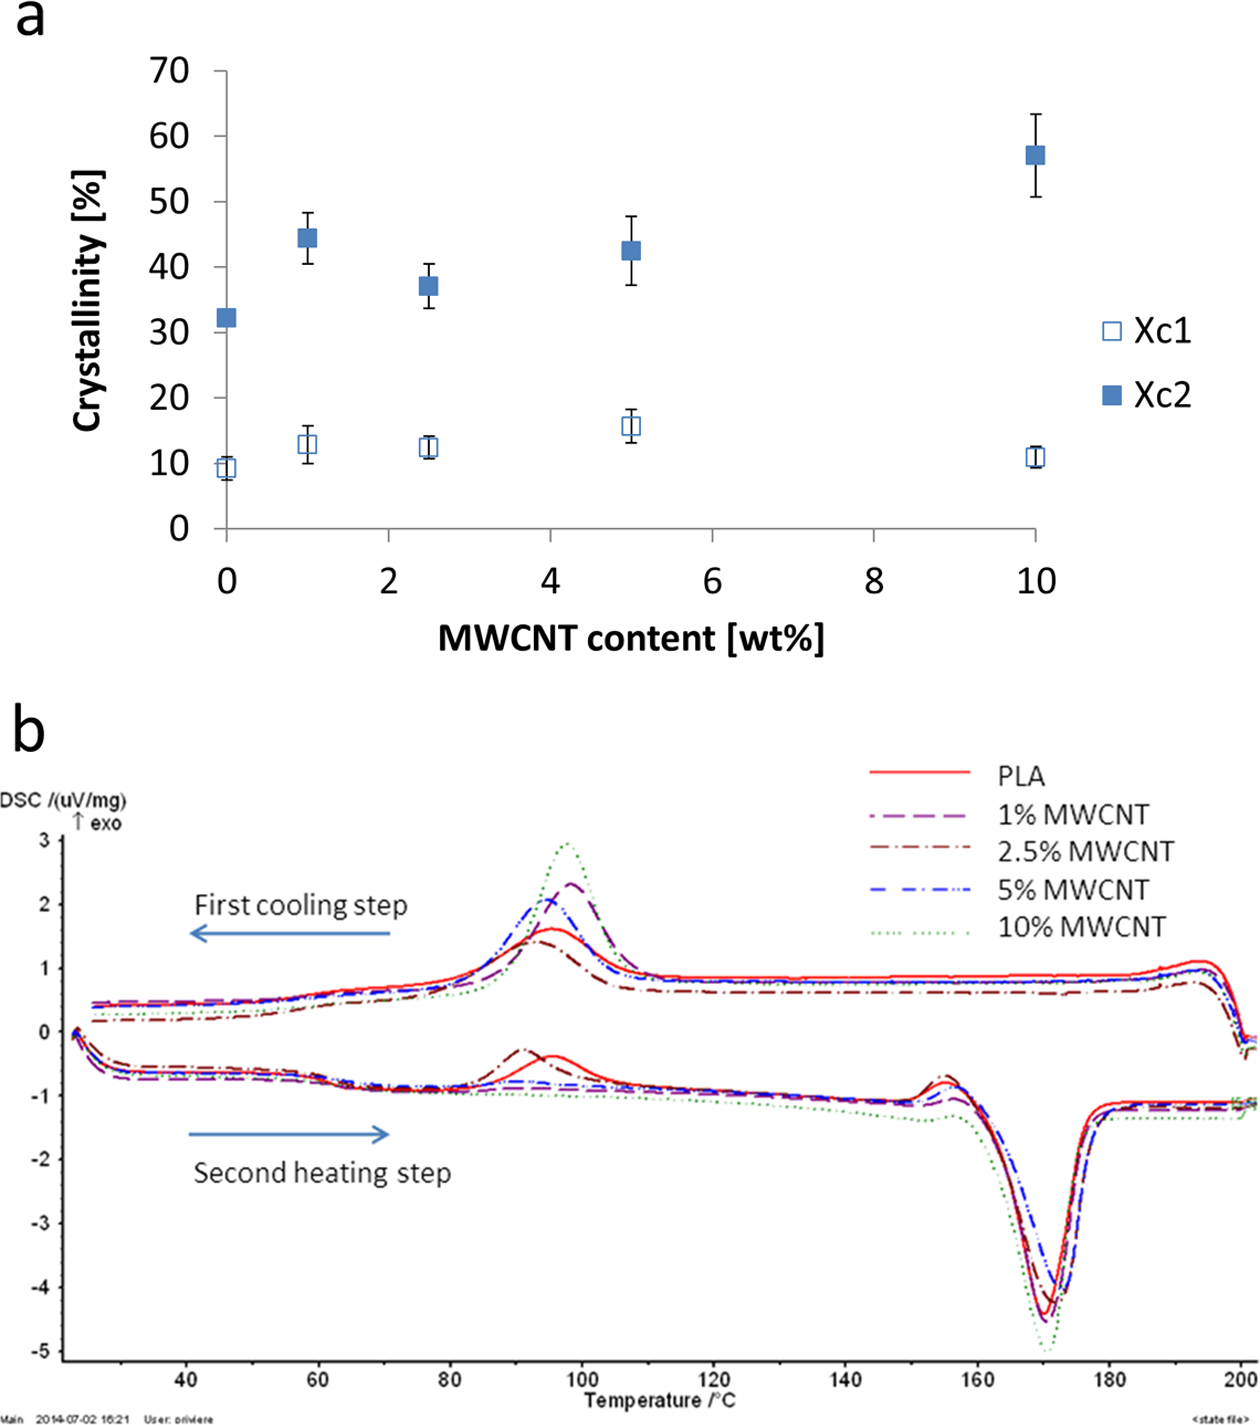
Crystallinity of injection-moulded PLA samples with 0–10 wt% MWCNT loading (a) calculated from DSC thermograms of first (X c1) and second (X c2) heating steps. The values are an average of three samples for each composite. The DSC thermograms on (b) show the first cooling step and the second heating step reflecting the nucleation effect of MWCNT on PLA obtained at low cooling rate. MWCNT: multi-wall carbon nanotube; PLA: polylactic acid; DSC: differential scanning calorimetry.
Papageorgiou et al. 29 reported an increase in the crystallization temperature but observed a decrease in crystallinity when adding oxidized MWNCT to PLA. They observed irregular spherulites at the MWCNT surface. It is argued that the irregular spherulites have limited polymer mobility, which in turn retarded the full crystallization of the polymer matrix. Zhang et al. 33 compared the crystalline structures of 2 wt% MWCNT-filled PP and neat PP. They found that crystallinity remained between 42% and 46% when adding MWCNTs, but it is also reported that the spherulites sizes have decreased. It is concluded that MWCNTs induced the formation of numerous smaller spherulites.
To observe the formation of crystalline regions in the nanocomposites exposed to slow and fast cooling, polarized light microscopy was employed on films prepared from injection-moulded parts. Figure 6 presents the images of cuts prepared from neat PLA and PLA mixed with 1 wt% nanotubes. No crystallization was observed for the films when cooled quickly from 175°C to 15°C, which is similar to the situation during injection moulding. In contrast, the slow cooling rate of 1°C min−1 led to a higher degree of crystallization. Comparing the slowly cooled samples containing pure PLA with those with 1 wt% of MWCNTs, it is apparent that the presence of the nanotubes reduced the spherulite sizes significantly (Figure 6, a′ and b′). This is consistent with the assumption that MWCNT induced heterogeneous nucleation as observed by Zhang et al. 33 In summary, it was observed that in the current work, MWCNTs can indeed nucleate PLA spherulites and induce a higher crystallinity than that reached with larger-sized spherulites in pure PLA with the cooling rate being low enough.
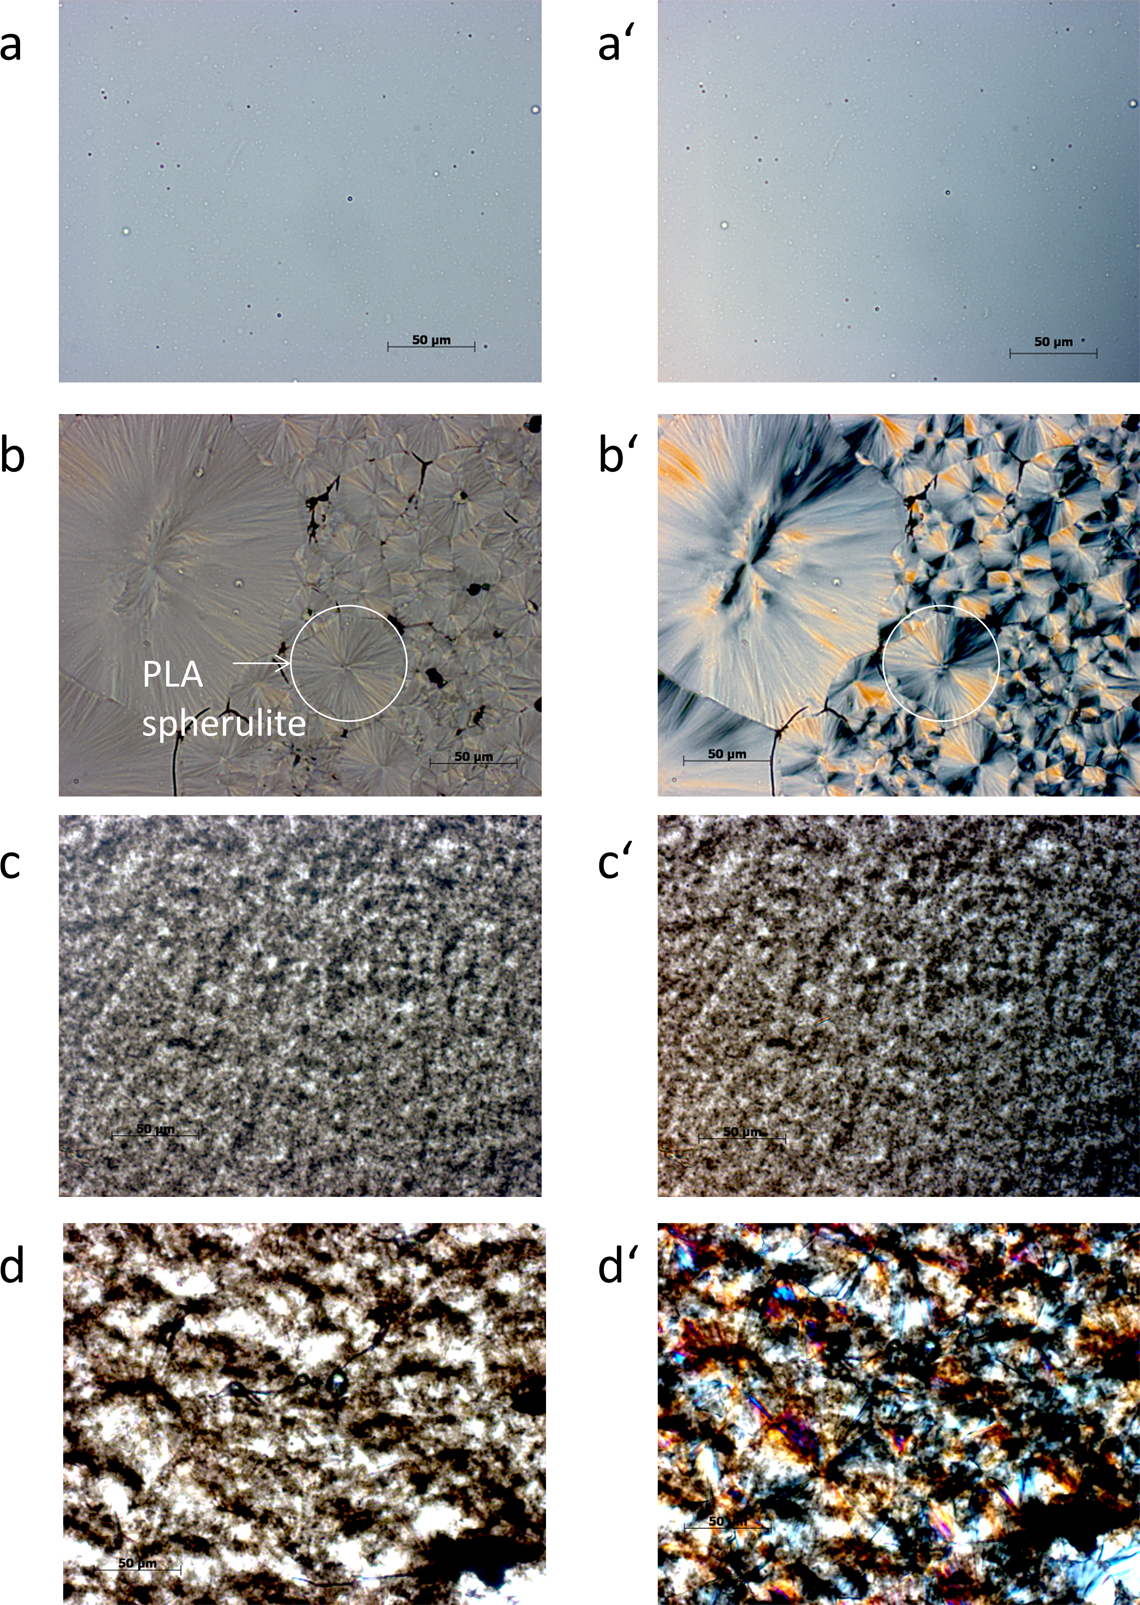
Microscopic analysis of crystalline structure of pure PLA films (a, a′ and b, b′) and PLA films with 1 wt% MWCNT (c, c′ and d, d′), exposed directly from 175°C to 15°C (a, a′ and c, c′) and under cooling rate lower than 1°C min−1 (b, b′ and d, d′). The image pairs corresponds to observation under non-polarized light (x) and under polarized light (x′). One PLA spherulite was circled in white on b and b′ pictures. All pictures are taken at the same magnification with the scale bar as shown in (a) corresponding to 50 μm. MWCNT: multi-wall carbon nanotube; PLA: polylactic acid.
Crystallinity and impact strength
In addition to the determination of crystallinity, we performed unnotched Charpy impact strength measurements (Figure 7). At loadings of 1 wt% and above, the impact strength seemed to be about 10% higher compared to lower loadings and pure PLA. However, due to the relatively large standard deviation values, no unambiguous trend could be identified. MWCNTs may affect the impact strength of composites in various ways, as reported in the literature. Prashanta et al. 41 observed a decrease of unnotched Charpy impact strength and a slight increase of the notched Charpy impact strength measurement when adding MWCNT. They concluded that MWCNTs in PP limit crack propagation, while their aggregates support crack initiation. Contrarily, Mack et al. 22 measured a decrease in notched impact strength when the loading of unmodified MWCNT added to polycarbonate was increased. 22
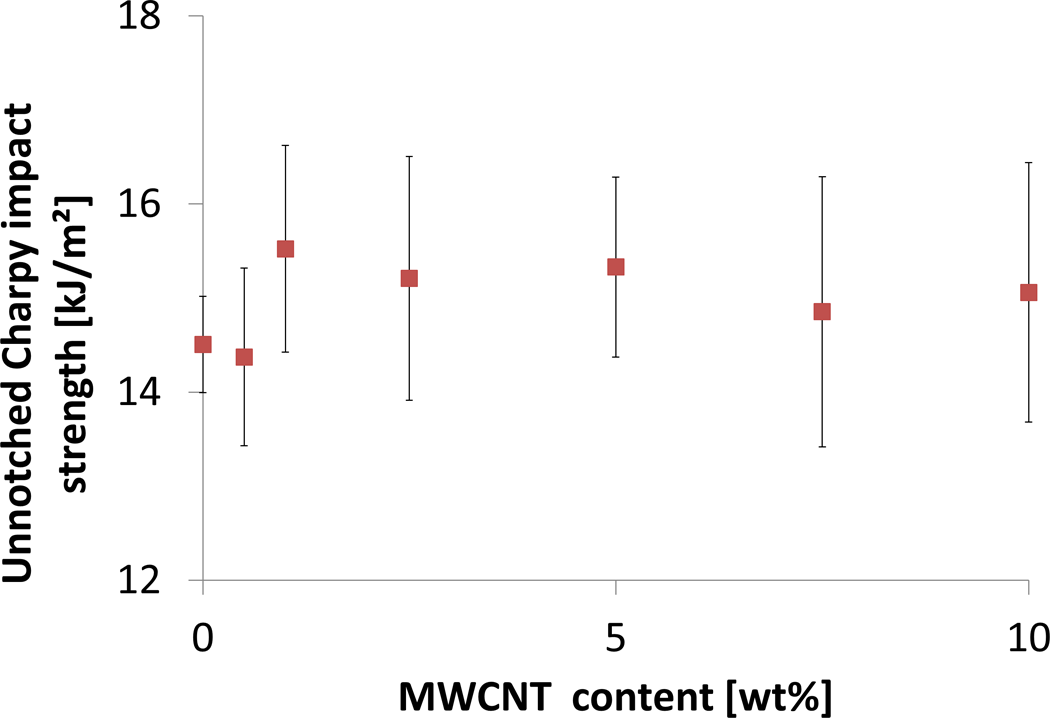
Charpy unnotched impact strength of the PLA composite with 0–10 wt% MWCNT loadings. The mean and standard deviation values are from 10 samples for each MWCNT loading. MWCNT: multi-wall carbon nanotube; PLA: polylactic acid.
In line with these studies and based on the resistance to tube pullout, observed by AFM, it seems likely that the slightly increased impact strength at higher MWCNT loadings results from the bridging effect and the resulting hindrance of crack propagation. The fact that no decrease in the impact strength was observed is consistent with our earlier observation of good dispersion and a low degree of aggregated MWCNT in the matrix.
Electrical properties
The electrical conductivities of the composites were measured using a four-point bulk conductivity measuring technique (see Figure 1). The specific electrical conductivities calculated from the resistivity measurement are plotted in Figure 8. The system used for this study was capable of measuring specific conductivities between 101 S m−1 and 103 S m−1. An arbitrary value of 0 S m−1 was assigned to the composites of 2.5 wt% MWCNT loading and lower, as no conductivity was registered with the available equipment. Starting at 5 wt% loading MWCNT reinforced PLA was found to be electrically conductive (σ > 10−3 S m−1). This indicates that the percolation threshold is located at a loading of less than 5 wt%. The conductivity increased with no levelling off to 51.7 S m−1 at 10 wt% MWCNT loading, which was the highest loading measured. These results are consistent with the existence of interconnected MWCNT networks observed by AFM imaging at 5 wt% and 10 wt% MWCNTs (see Figure 3) and the increase of the density of these networks with the increasing MWCNT loading.
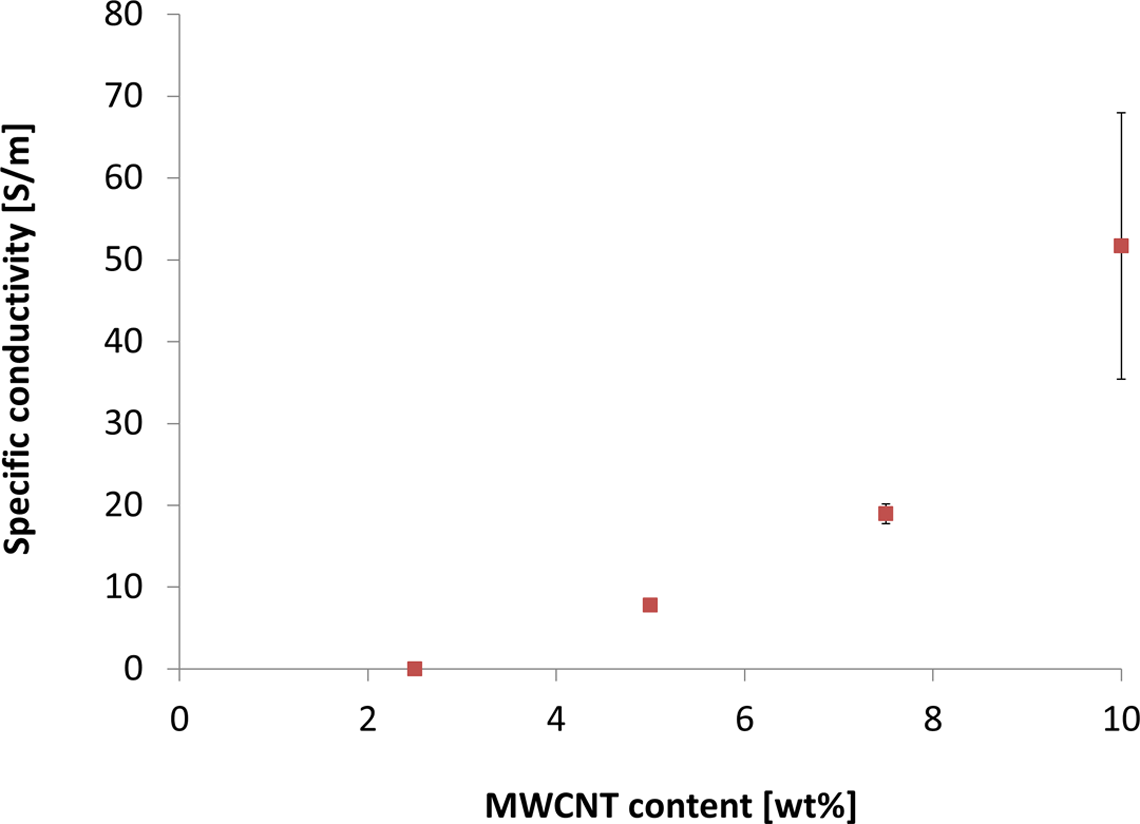
Specific volume conductivity of MWCNT loaded PLA composites from four measurements on three samples for each composite. MWCNT: multi-wall carbon nanotube; PLA: polylactic acid.
The achieved conductivities in the present study are comparable with the highest conductivities measured for the composites produced with entangled MWCNT and with the ones reported in Bauhofer and Kovacs. 42 Based on a comparison of 150 different types of polymer–CNT composites, these authors suggested that the electrical percolation and the maximum conductivities are more influenced by the polymer type and the dispersion method than by the CNT type and the production method. 42 Table 1 lists data from studies dealing with unmodified and probably entangled MWCNT in thermoplastics and dispersed by extrusion as well as studies on copper particles or CB-filled thermoplastics. Our results were within the ranges of other unmodified MWCNT-filled thermoplastic polymers, all presenting relatively high conductivities when compared to MWCNT-filled nanocomposites obtained after melt mixing (Figure 9). 22,27,43 –47 The conductivity of the composites in this work was found to be 30% higher than the conductivity measured by Moon et al. 26 for thin composite films containing 10 wt% MWCNT in PLA. To disperse the nanotubes within the polymer matrix they used ultrasonication, which is usually described as a very good method to disperse MWCNTs, and obtain random orientation of the filler after solvent evaporation. 17 However, this method is more laborious and of lesser industrial relevance than the melt processing that was applied here. Another difference between the measurements by Moon et al. 26 and the current approach is that they measured surface conductivity but expressed their results in S m−1, which indicates volume conductivity, thus leaving some uncertainty.
Comparison of electrical conductivity measurements for various composites reported in literature and in the current work.a
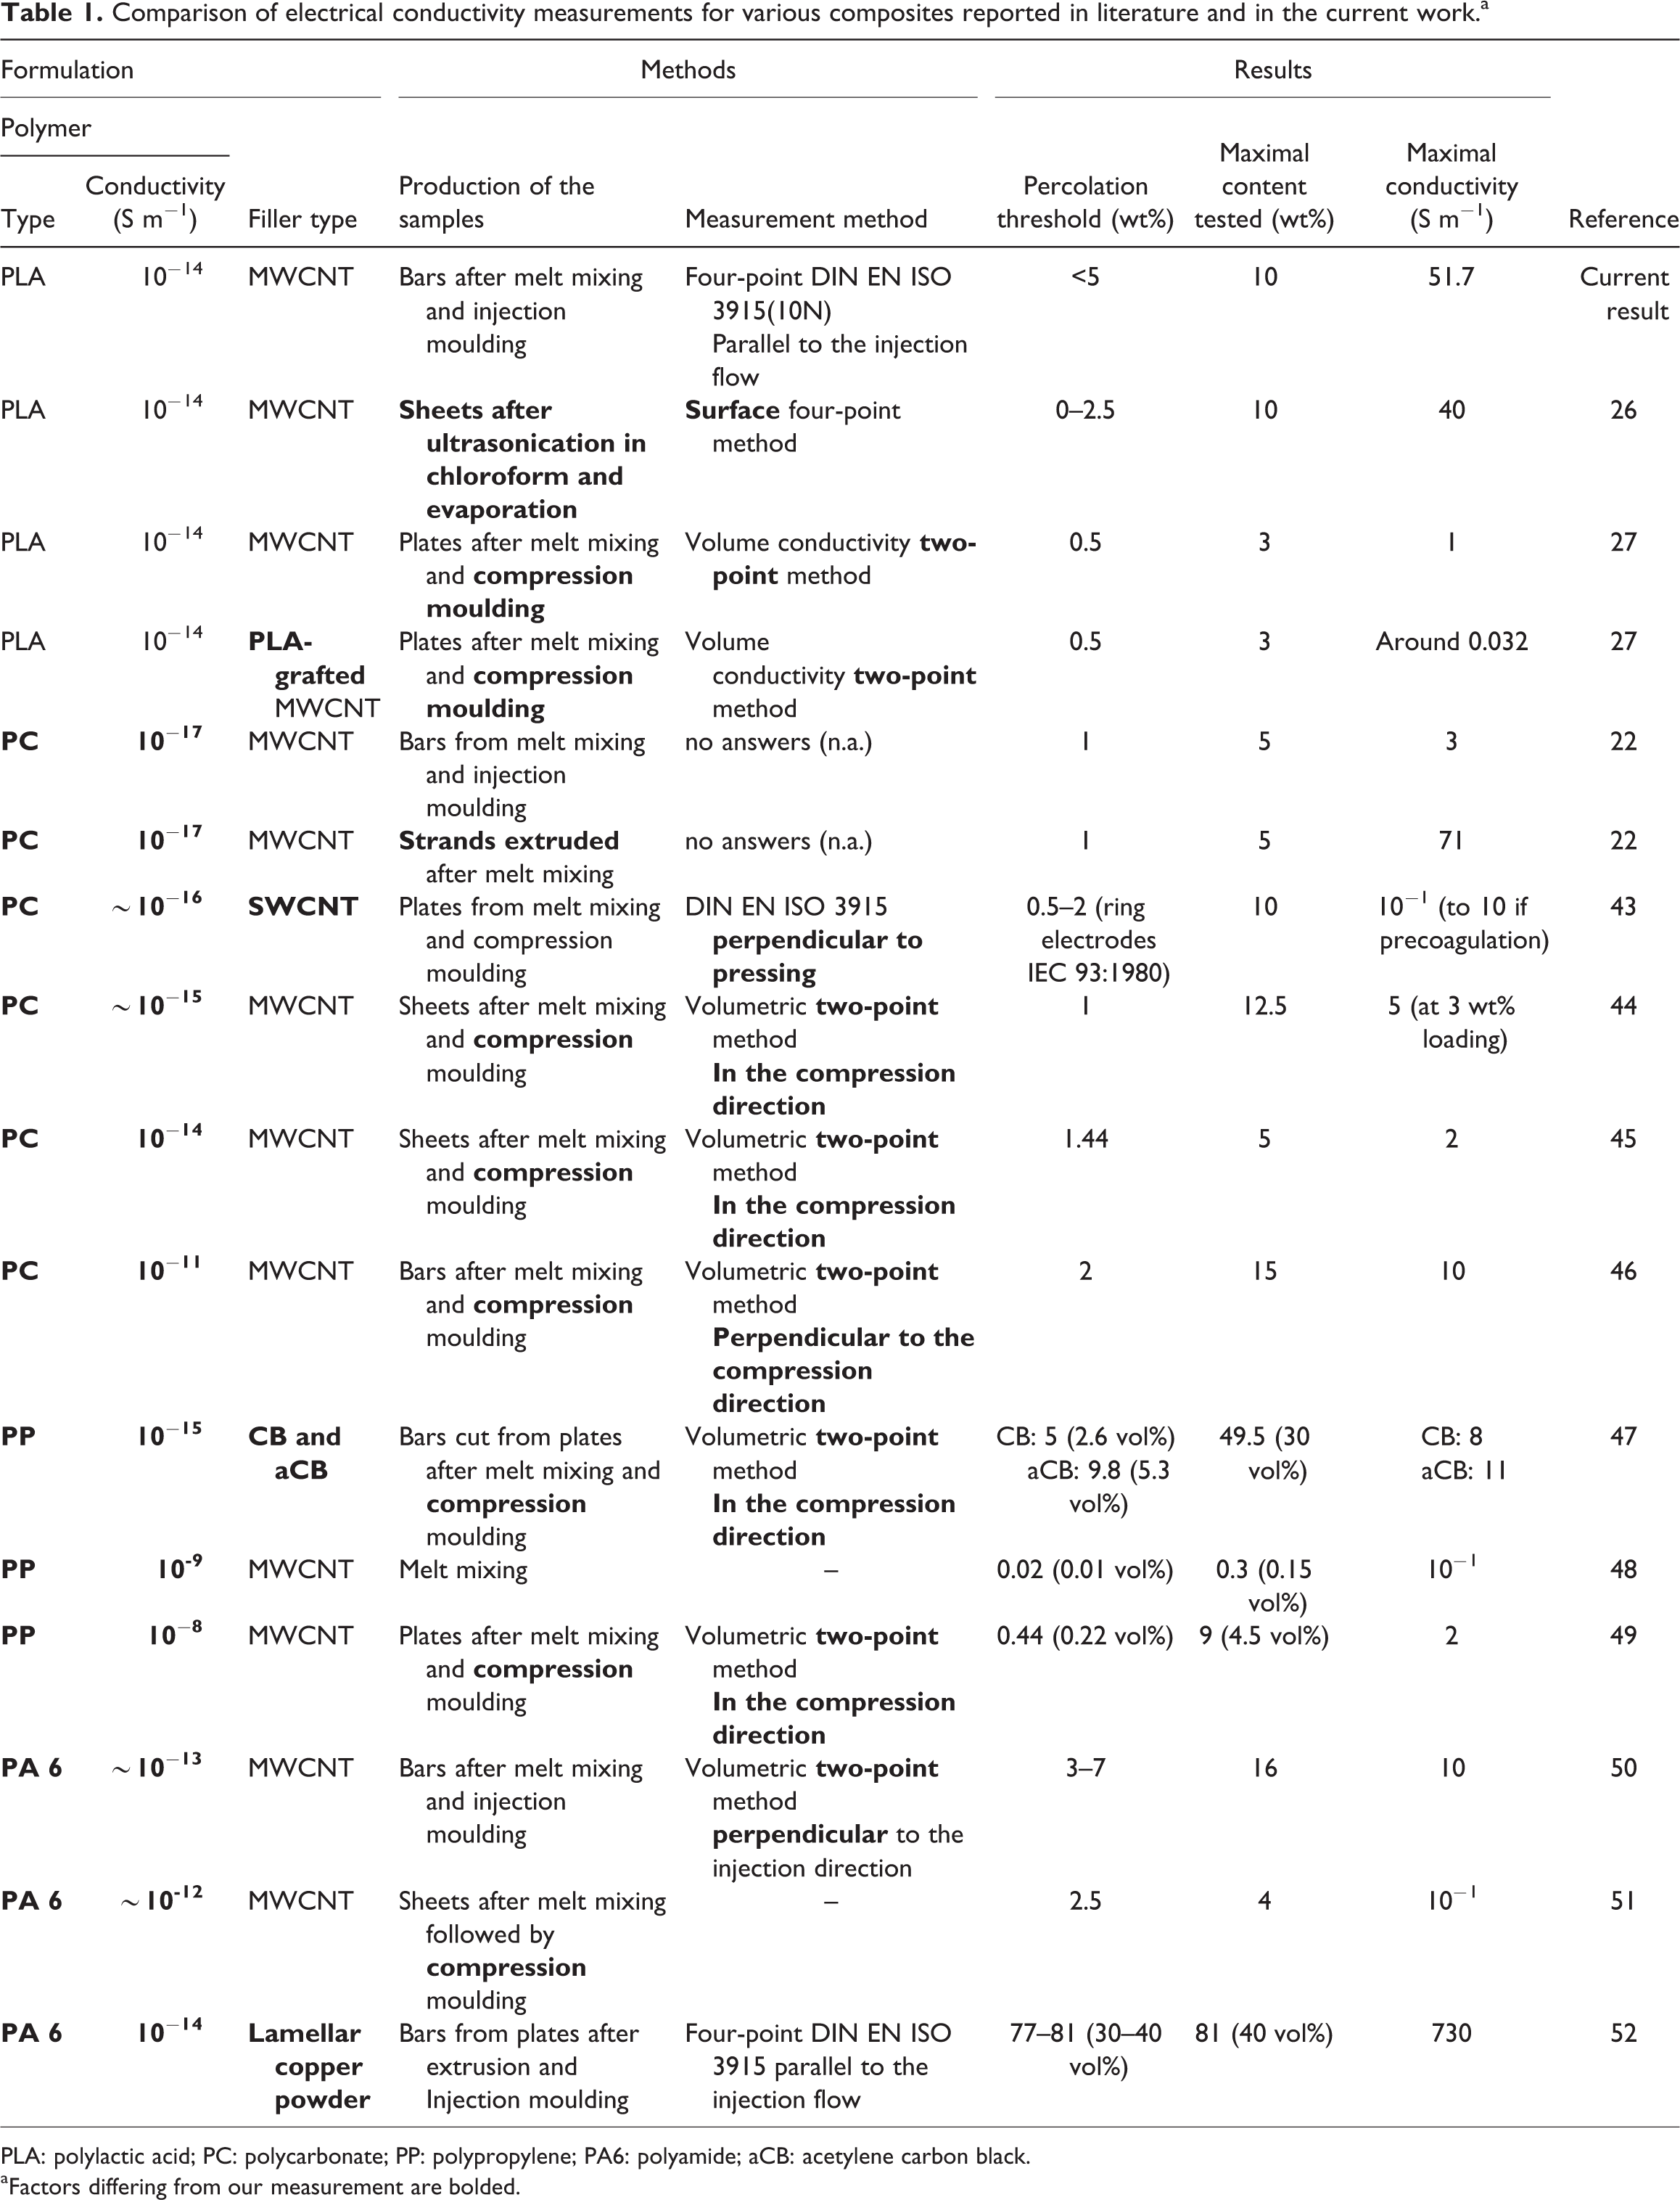
PLA: polylactic acid; PC: polycarbonate; PP: polypropylene; PA6: polyamide; aCB: acetylene carbon black.
aFactors differing from our measurement are bolded.
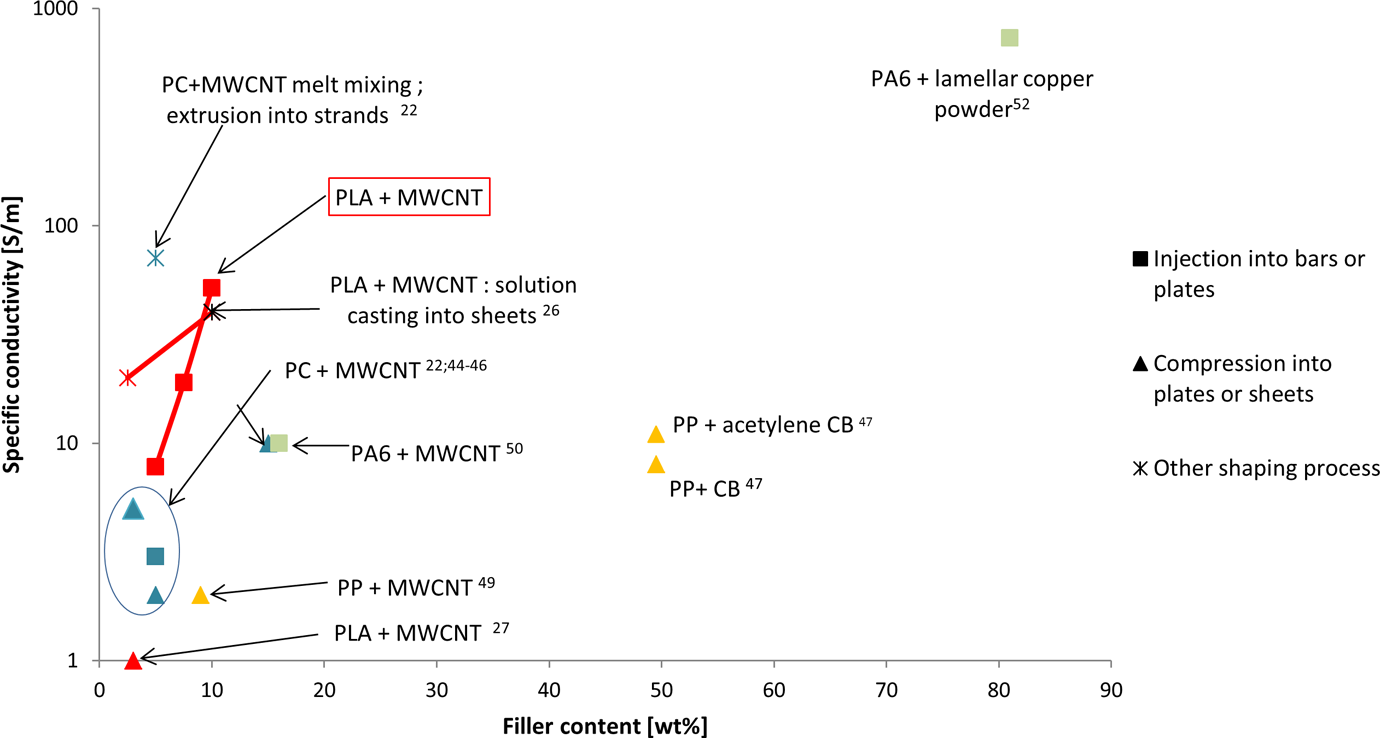
Comparison of the electrical performance of the composites produced in this study (boxed) with previously published works (See list of references for the cited publications in Table 1). The legend indicates the moulding process used after melt mixing (compression or injection moulding). If a different process was used it is described in the data label.
Another study on PLA filled with unmodified MWCNTs by Novais et al. 27 presents conductivities significantly lower than the data reported here (Figure 9). However, these lower values might at least partly be due to the two-point method used by these authors. Indeed, if the contact between the electrodes and the surface of the composites in the two-point method is not optimal, the resulting contact resistance is added to the composite resistance. 24 Interestingly, they observed similar percolation threshold but much lower conductivities for PLA-grafted MWCNTs compared to unmodified MWCNTs. This is in agreement with the hypothesis that a layer of grafted molecules can reduce the quality of the tube/tube contacts and therefore the conductivity of the network.
Some studies involving other biopolymers are listed in Table 1. 22,26,27,42 –52 For example, Hornbostel et al. 48 reported that single-wall carbon nanotube (SWCNT)-filled polycarbonate (PC) films reached the percolation threshold at concentrations between 0.5 wt% and 2 wt%, which is comparable to what we expect for our materials. However, the obtained conductivities were generally lower. This may be due to the notorious difficulty of dispersing SWCNTs and a higher degree of entanglement as compared to MWCNTs. Also, in general, the conductivity of MWCNT-filled polycarbonate was lower than that of MWCNT-filled PLA. This could be caused by the higher affinity and thereby more efficient embedment of MWCNTs in polycarbonate or may be due to the lower electrical conductivity of pure polycarbonate. Both effects would increase the tube/tube contact resistance.
In the study of Mack et al., 22 the conductivity of injection-moulded MWCNT–PC parts was compared to that of extruded strands. The authors explain the much higher conductivities of the strands by a flow alignment of the filler and the absence of a skin layer at the contact between the electrodes and the extruded samples. In the present study, the conductivity was measured in the direction parallel to the flow during injection. Thus, flow alignment may have contributed to the higher conductivity observed in comparison to other studies where the CNTs are differently oriented as in films, for example. 26
Conclusion
This study demonstrates that competitive eco-friendly and electrically conductive plastics can be produced by melt mixing of unmodified MWCNTs with PLA followed by injection moulding. At 10 wt% MWCNT, a conductivity of 51 S m−1 was achieved, which correlates well with the results of other studies at laboratory scale. SEM and AFM observations demonstrated that this processing methodology distributes and disperses the MWCNT very well in the PLA matrix leading to percolation of a conductive network at loadings below 5 wt%. However, the decrease in the composite tensile strength with the addition of MWCNT showed that the unmodified MWCNT did not strongly interact with the PLA, and no nucleation effect of the MWCNT on the PLA crystallization was detected after injection moulding. Crystallinity was only between 10% and 20%. This was attributed to the fast cooling after injection moulding whereas at lower cooling rates, unmodified MWCNTs were found to nucleate PLA crystallization and reach much higher crystallinities, for example, 57% at 10 wt% MWCNTs.
Footnotes
Acknowledgements
We gratefully acknowledge the assistance of the Institute of Wood Technology and Renewable Materials and the Institute of Natural Materials Technologies of the BOKU-University of Natural Resources and Life Sciences of Vienna. We also thank Ines Fritz (Institute of Environmental Biotechnology), Pum Dietmar (Department of Nanobiotechnology) and the Institute of Physics and Material Sciences of BOKU. We further thank Soledad Peresin for initiating and the Cost Action FP 1105 for providing funding for the cooperation between Dr T. Nypelö, H. Bock and P. Rivière. The companies NatureWorks® and C-polymers are acknowledged for providing the raw materials. G. Frieling from the Technical University of Dortmund, Prof. Achim Walter Hassel from the Johannes Kepler University Linz and Dorothea Schwarz from DEKRA EXAM GmbH are acknowledged for their help with the electrical conductivity measurements.
Declaration of conflicting interests
The author(s) declared no potential conflicts of interest with respect to the research, authorship, and/or publication of this article.
Funding
The author(s) disclosed receipt of the following financial support for the research, authorship, and/or publication of this article: The presented study received substantial financial support by the Government of Lower Austria.