
Abstract
An experimental study was conducted to investigate the effects of temperature and strain rate on tensile behavior of polybutylene terephthalate and polyamide-6 reinforced with short glass fibers. Tension tests were performed in several mold flow directions, at a range of temperatures between −40°C and 125°C, and a range of strain rates between 5 × 10⁻⁵ s−1 and 5 × 10⁻¹ s−1. Mathematical relationships were developed to represent the stress–strain response, as well as tensile strength and elastic modulus in terms of strain rate and temperature. Time–temperature superposition principle was also employed to superimpose the effect of temperature and strain rate on tensile strength. A temperature-dependent shift factor of Arrhenius type is suggested, which is independent of the mold flow direction. Mechanisms of tensile failure were also identified from fractured surface of specimens.
Keywords
Introduction
Increasing attention has been given to short fiber-reinforced polymer composites (SFRPCs) during the last few years. These are very cost-effective materials with sufficient tensile strength and elastic modulus for many engineering applications. High volume usage in the automotive industry is a common application of SFRPCs. The presence of short fibers improves strength, modulus, and dimensional stability of neat polymers. Mechanical performance of such materials is a function of fiber, matrix and fiber–matrix interface properties, processing conditions, loading, and environmental effects. 1
Tension properties provide information about stiffness, strength, toughness, and ductility of materials, often used in design and analysis of components or structures. Tensile behavior of SFRPCs has been the subject of several studies. Effects of fiber content, length, and diameter on tensile properties have been studied elsewhere. 2 –5 and effect of fiber orientation or anisotropy has been described previously. 6 –9 Water absorption and effect of moisture on tensile behavior are other related aspects considered elsewhere. 10 –16 Due to viscous behavior of polymers, mechanical behavior of SFRPCs is substantially affected by time and temperature. Therefore, strain rate and temperature are of particular interest in studying mechanical performance of SFRPCs.
Shi et al. 17 studied tensile properties of silica-filled epoxy composite at strain rates ranging between 10−5 s−1 and 10−1 s−1 and temperatures ranging between −40°C and 240°C. As temperature increased, tensile strength, yield strength, and modulus nonlinearly decreased with a steeper slope near glass transition temperature (T g), compared with temperatures above and below T g. Elastic modulus and yield strength linearly increased with log of strain rate. At temperatures near T g, many cavities were observed resulting from interfacial deboning, and at temperature above T g matrix cracking was the dominant mechanism. The fracture surfaces at higher strain rates were flatter than those at lower strain rates.
Wang et al. 6 studied effects of temperature ranging between 21.5°C and 100°C and strain rate ranging between 0.05 min−1 and 5.0 min−1 on tensile behavior of short glass fiber-reinforced polyamide-6 (PA6). Elastic modulus decreased as did temperature with a steeper slope at temperatures near T g. Elastic modulus increased linearly with log strain rate. An empirical strain rate and temperature-dependent constitutive model was also established to represent the stress–strain behavior.
Zhou and Mallick 7 studied the effect of strain rate on tensile properties of short glass fiber-reinforced polyamide-6.6 under strain rates of 0.05, 0.5, and 5 min−1. A linear relationship between both tensile strength and elastic modulus with strain rate was obtained in semi-log scale. A three-parameter nonlinear equation was established to describe the stress–strain relationship.
Mouhmid et al. 18 conducted an experimental study on tensile properties of short glass fiber-reinforced polyamide-6.6 with temperatures of 20°C, 50°C, and 80°C and strain rates of 0.0011, 0.0056, and 0.056 s−1. Tensile strength and elastic modulus increased linearly with log of strain rate and decreased with temperature in a nonlinear form.
Schoßig et al. 19 evaluated tensile behavior of short glass fiber polypropylene and short glass fiber polybutene-1 at strain rates ranging between 0.007 s−1 and 174 s−1. Tensile strength increased as log strain rate did, with a higher rate of change above the strain rate of 20 s−1. This transition at strain rate of 20 s−1 was inferred to be due to conversion from the isothermal behavior to the adiabatic behavior. G’Sell-Jonas model considering viscoelasticity, viscoplasticity, plastic strain hardening, and temperature effect was applied to the experimental data to represent dependency of stress to strain, strain rate, and temperature.
Peterson et al. 20 evaluated mechanical response of discontinuous glass fiber-reinforced styrene maleic anhydride at a wide range of strain rates between 1.67 × 10⁻³ s−1 and 6 s−1. Tensile modulus and strength linearly increased with increasing log strain rate. As strain rate increased, less stress relaxation near fiber ends occurred and, therefore, more efficiency in transferring load from matrix to fibers was observed. Tensile toughness increased slightly with increasing strain rate, whereas the unreinforced polymer indicated a significant reduction of tensile toughness as strain rate increased.
Hashemi 21 investigated effects of strain rate and temperature on tensile strength of short glass fiber-reinforced polybutylene terephthalate (PBT) containing 0, 10, 20, and 30 wt% glass fibers. Tensile tests were performed at displacement rates between 0.05 mm min−1 and 500 mm min−1 and at temperatures between 23°C and 100°C. At all fiber contents, tensile strength linearly increased with increasing log of strain rate and decreased linearly with increasing temperature.
Schultz and Friedrich 22 studied effects of temperature ranging between −80°C and 120°C and displacement rate ranging between 0.005 mm min−1 and 500 mm min−1 on tensile strength of short glass fiber-reinforced polyethylene terephthalate. At low temperatures or high strain rates, fiber pull-out and matrix brittle fracture were observed. At high temperatures, fiber pull out was accompanied by matrix viscous flow. Fracture behavior at room temperature was different from either low or high temperature such that matrix crazing was observed and resulted in specimen fracture at fiber tips or through the fiber pull-out mechanism. Tensile strength linearly increased with log strain rate, while it decreased as temperature increased except at −20°C.
Miwa and Horiba 23 studied the temperature and strain rate dependence of short fiber epoxy composites reinforced by glass, carbon, or hybrid glass-carbon fibers. In tensile experiments, strain rate varied between 0.0059 min−1 and 5.9 min−1 and temperature varied between 20°C and 100°C. Tensile strength increased with log strain rate and this effect slightly increased as temperature increased. Tensile strength was mathematically modeled from properties of materials constituting the composites. At higher strain rates or lower temperatures experimental results were below predictions, due to the remarkable influence of fibers as stress concentrations. A time–temperature dependence of Arrhenius type was derived by applying the superposition principle.
The objective of the present study was to investigate tensile behavior of two commonly used fiber-reinforced composites in several mold flow directions. Variations of tensile properties with temperature and strain rate in different mold flow directions are mathematically represented. Constitutive equations are developed to represent the stress–strain relationships. The superposition principle is applied to incorporate the effects of time and temperature on tensile strength. Microscopic studies were also performed on fractured surfaces to relate the effects of strain rate and temperature to microstructural characteristics.
Experimental program
The materials considered were a short glass fiber-reinforced PBT, containing 30 wt% glass fiber, and a short glass fiber-reinforced PA6, containing 35 wt% glass fiber and about 10 wt% rubber impact modifier (referred to as PA6). Mean fiber length and diameter were estimated at 0.253 mm (with a standard deviation of 0.135 mm) and 9.81 microns (with a standard deviation of 1.29 microns), respectively, based on burn-off test results of PA6. Most fibers were aligned with the mold flow direction. More details of the fiber length, diameter, and orientation variations and statistical distributions can be found in the study by Mortazavian and Fatemi. 9
The T g obtained from dynamic mechanical testing in dual cantilevers at a frequency of 1 Hz was found to be 60°C for both materials. Melt temperature is at 220°C for both materials. PA6 is commonly used in applications where high impact strength, chemical resistance, and good high-temperature performance are required (e.g. oil pan). PBT is commonly used in electrical connectors due to its good insulating properties.
Rectangular plaques with dimensions of 3.8 × 100 × 200 mm3 were made using injection molding process. Specimens were machined from plaques in 0° (longitudinal), 45°, and 90° (transverse) directions with respect to the mold flow direction. A distance of about 60 mm from the injection molding location in the plaque was discarded to prevent end effects. 9 The optimized specimen geometry used is shown in Figure 1. A linear elastic stress concentration factor of 1.05 was obtained due to the fillet in the transition region, based on a finite element simulation. To avoid the effect of moisture, PBT and PA6 samples were dried for 6 h at 120°C and 80°C, respectively, and preserved in a desiccator prior to testing.
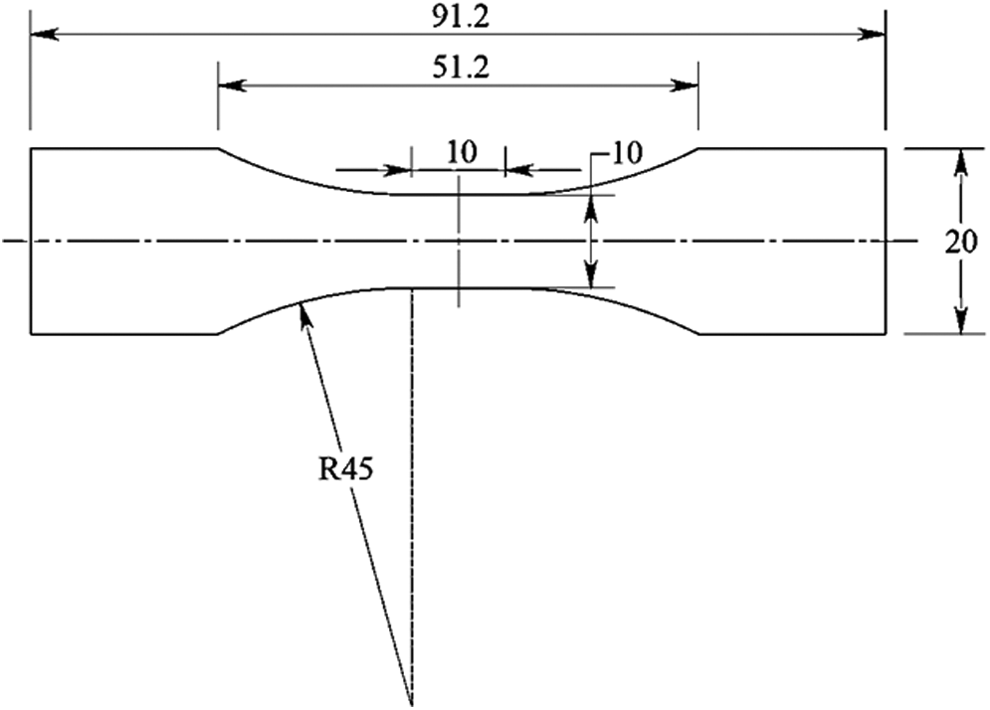
Specimen geometry used for tensile tests (dimensions in mm).
Tensile tests were performed on a servo-hydraulic testing machine and controlled by a digital controller. A load cell with capacity of 10 kN was used to measure the applied load to the specimen. Tests were performed in displacement control and strain was measured using a video extensometer. Two dots with a consistent distance of 8 mm were marked in specimen gage section. The distance between these two points and the resultant strain were measured during the test.
At room temperature (23°C), tensile tests were performed at the load actuator speed of 0.1, 1, 10, 100, and 1000 mm min−1. For the geometry used, these correspond to a strain rate of about 5 × 10⁻⁵, 5 × 10⁻⁴, 5 × 10⁻³, 5 × 10⁻², and 5 × 10⁻¹ s−1. To investigate the effect of temperature, tests were also conducted at −40°C, 85°C, and 125°C. An environmental chamber equipped with an electronic heating element and a liquid nitrogen cooling system was utilized for temperature effect study. A Hitachi scanning electron microscope (Japan) with an accelerating potential of 5–10 kV was used to study fractured surfaces of specimens. The fractured surfaces were sputter-coated with gold for 50 s, prior to microscopic analysis.
Results and discussion
From stress–strain curves, tensile properties were determined based on the ASTM D638 24 and ISO-527 25 standard test methods for tensile properties of plastics and ASTM E646 26 standard for metallic sheet materials. The average properties for each material and testing condition obtained from two or three duplicate tests are listed in Tables 1 and 2. These include maximum tensile strength (Su ), strain at maximum tensile strength (ε M), the 0.2% offset yield strength (S y), elastic modulus (E), strength coefficient (K), and strain hardening exponent (n). In this section, the influences of strain rate and temperature on tensile strength and elastic modulus of considered SFRPCs are discussed and mathematical relationships are developed to characterize tensile properties. Mechanisms of failure are distinguished from fractured surfaces, and the time–temperature superposition principle is applied to tensile strength data. It should also be mentioned that the location of fracture in tensile specimens was similar, regardless of strain rate or test temperature.
Testing condition summary and average monotonic tension properties of PBT.
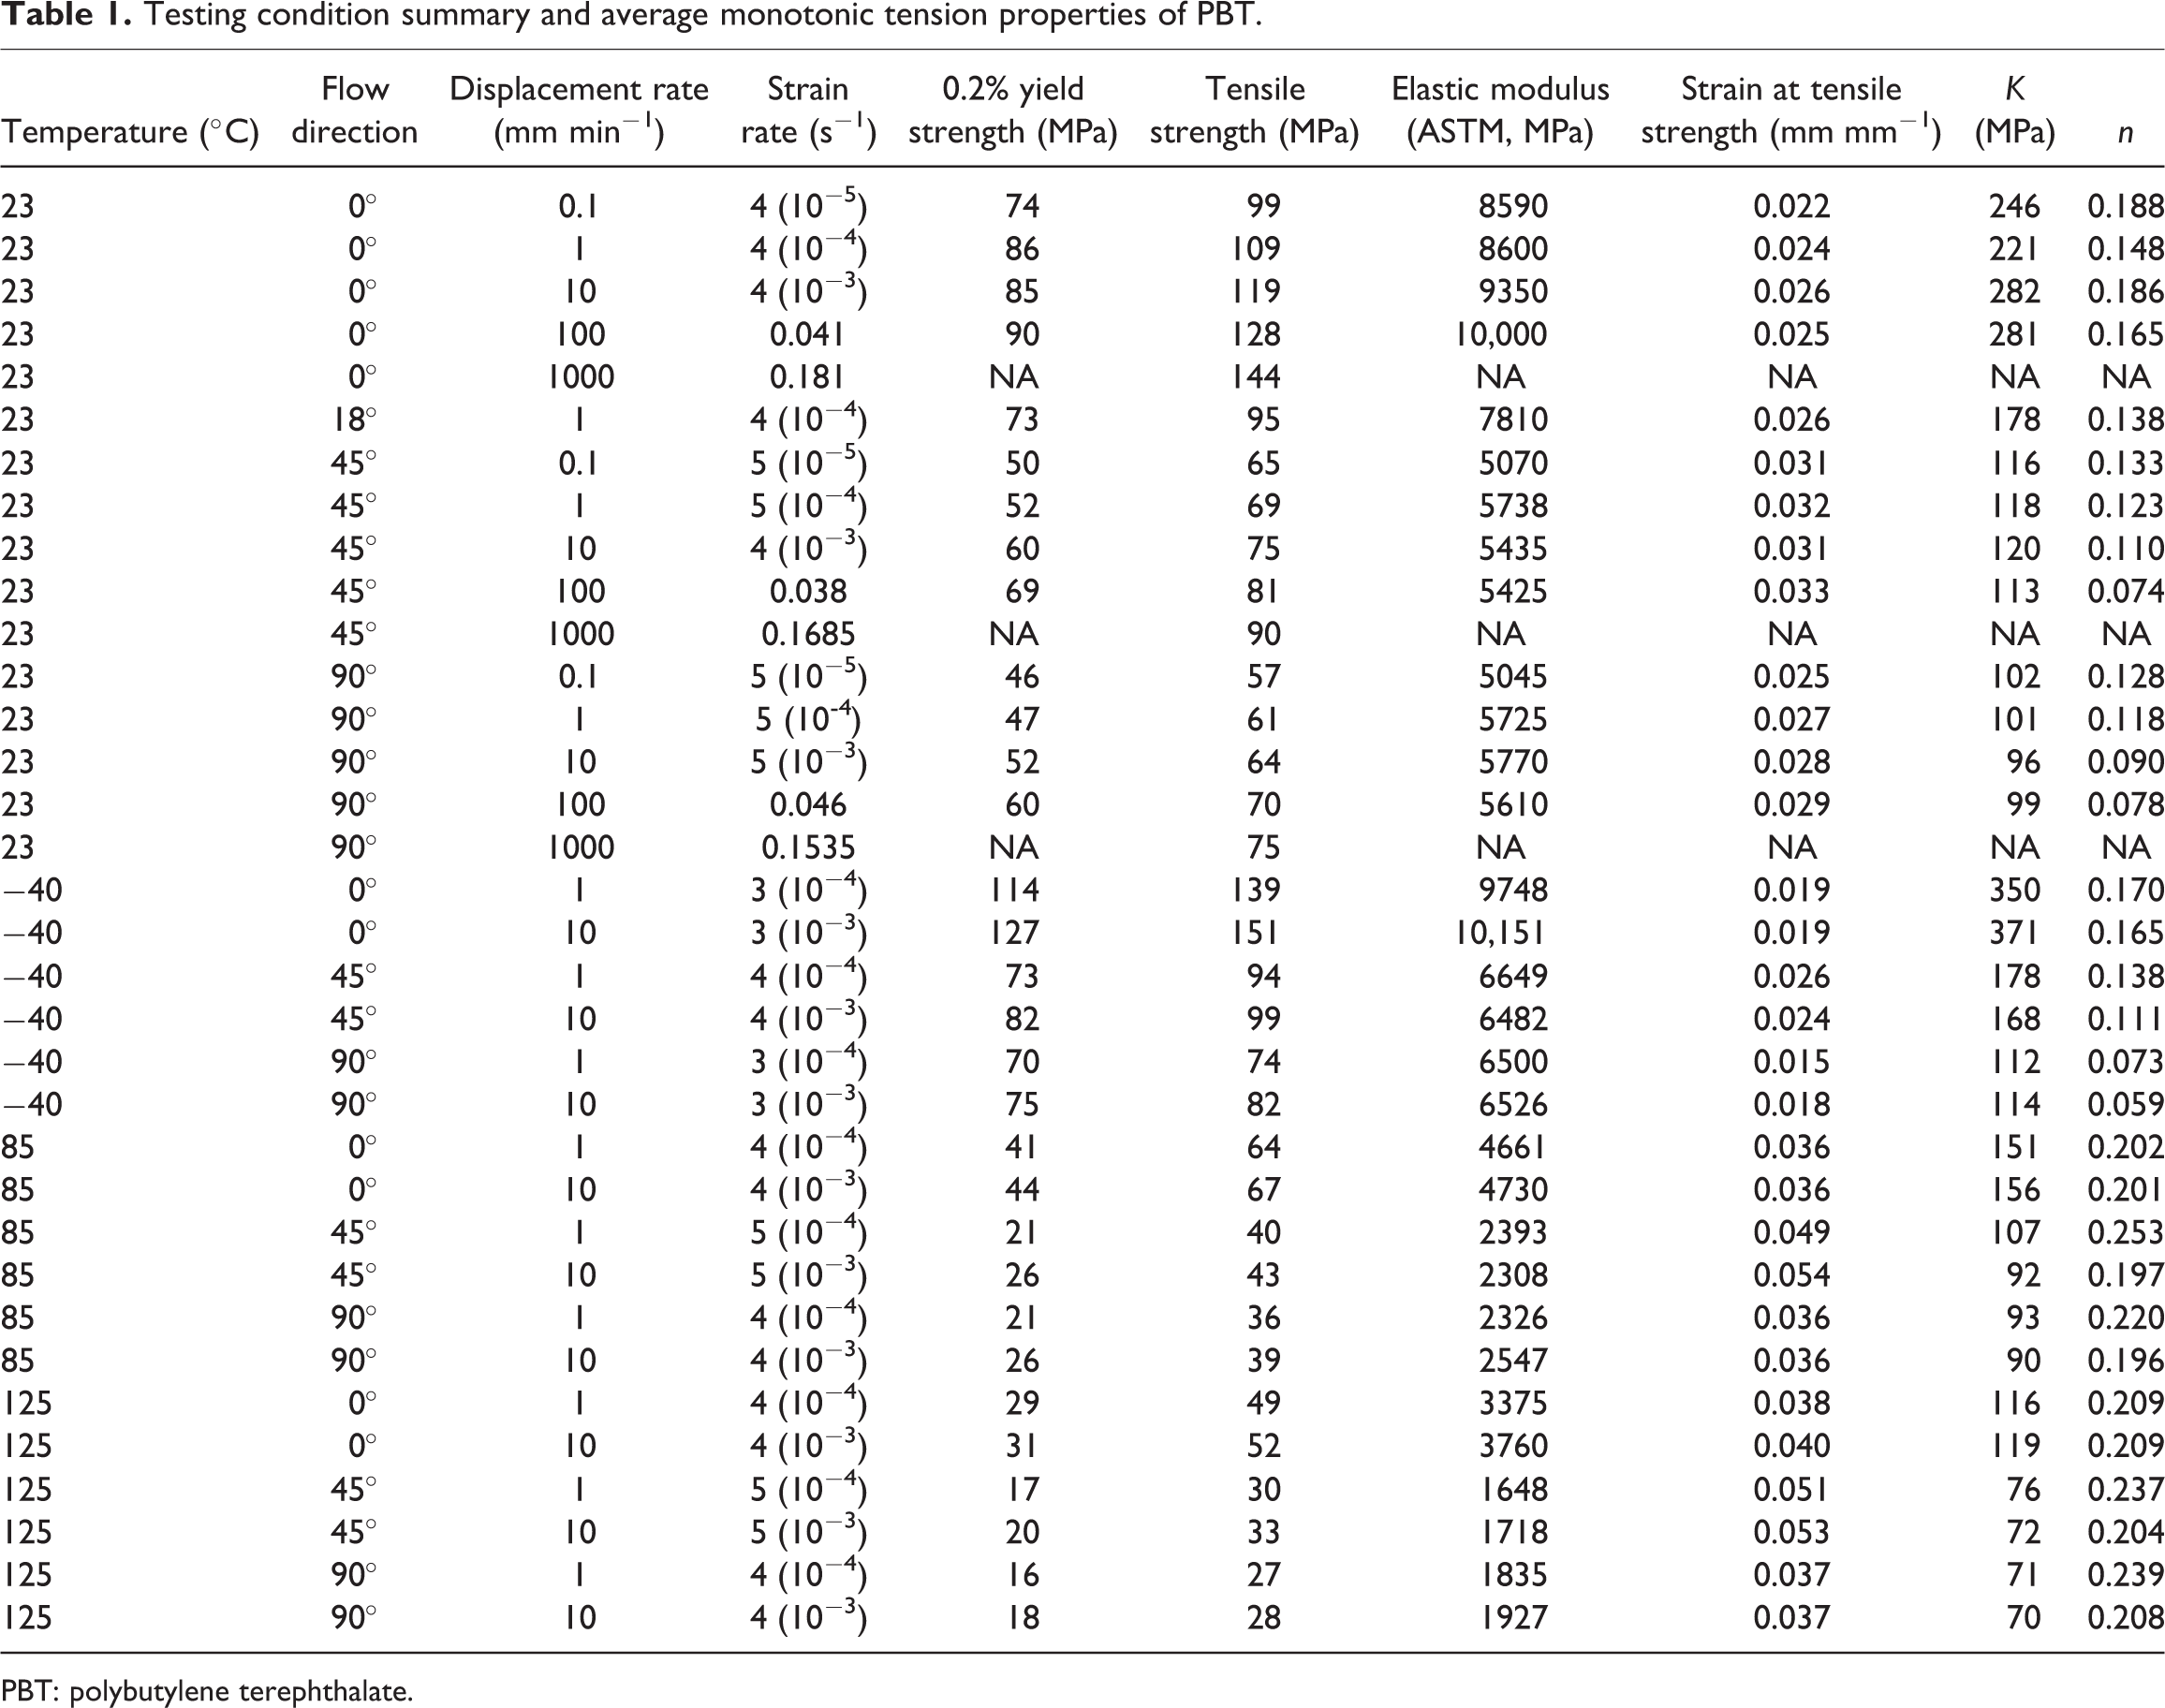
PBT: polybutylene terephthalate.
Testing condition summary and average monotonic tension properties of PA6.
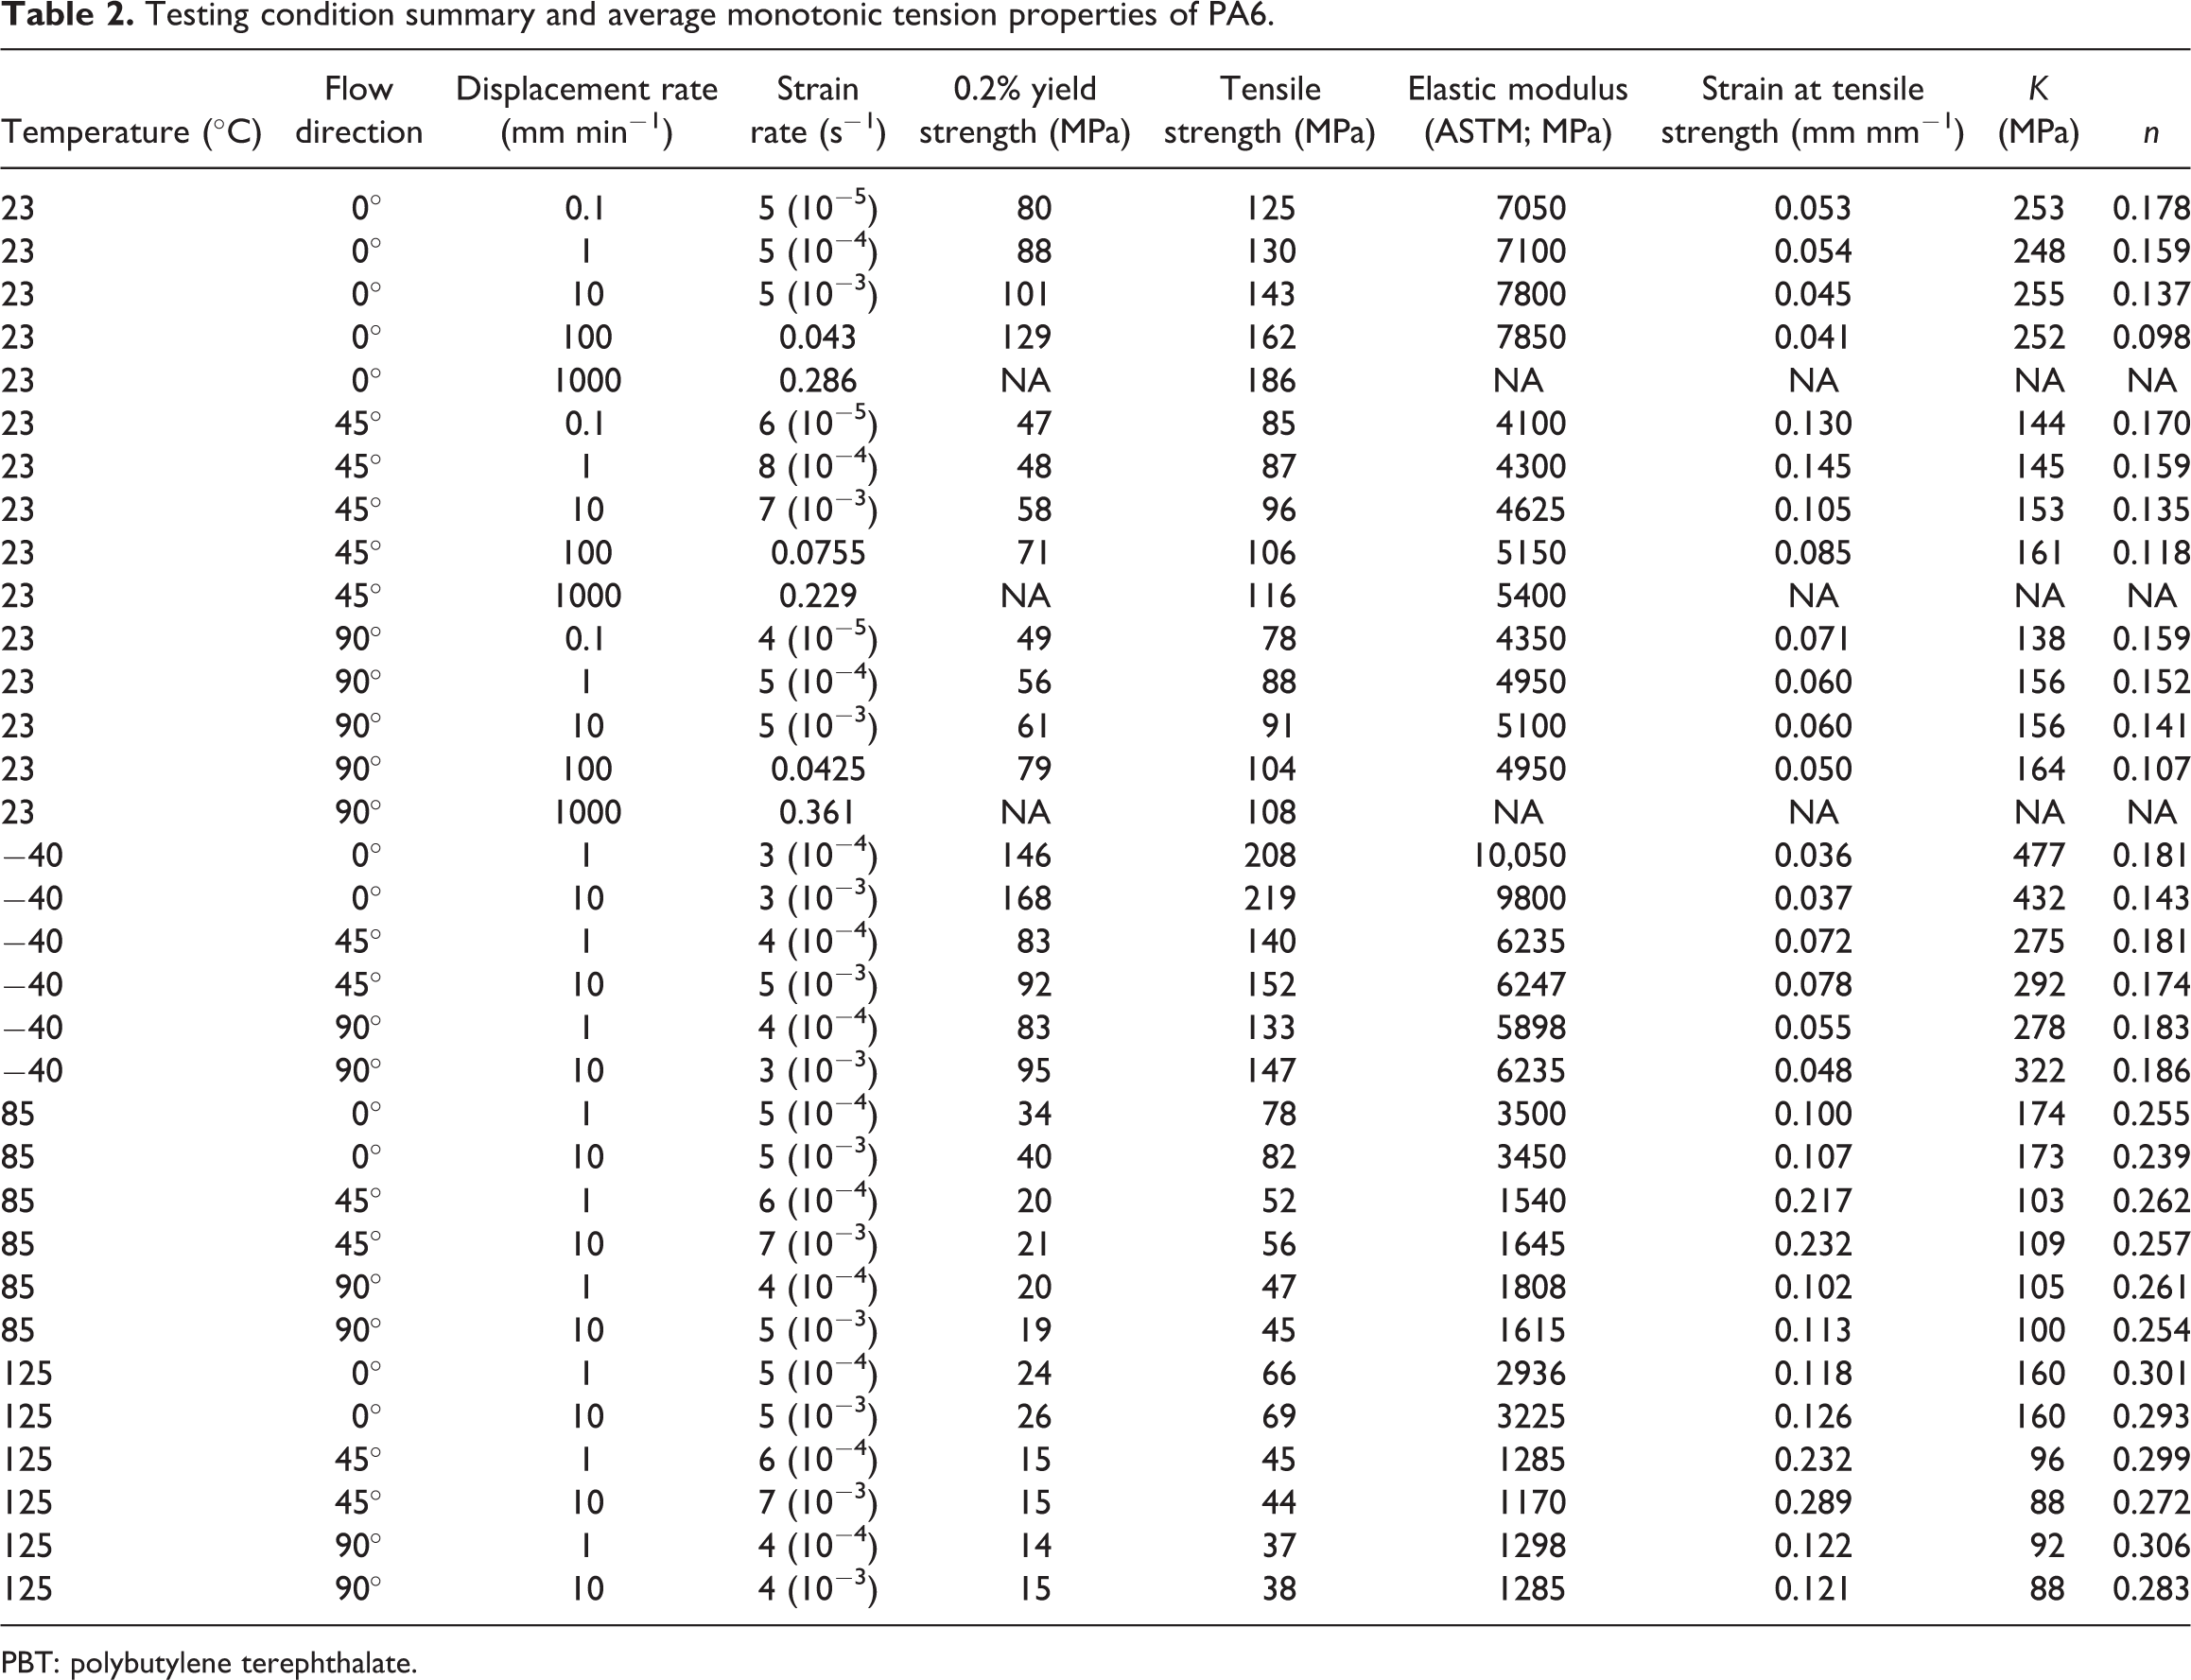
PBT: polybutylene terephthalate.
Strain rate effect
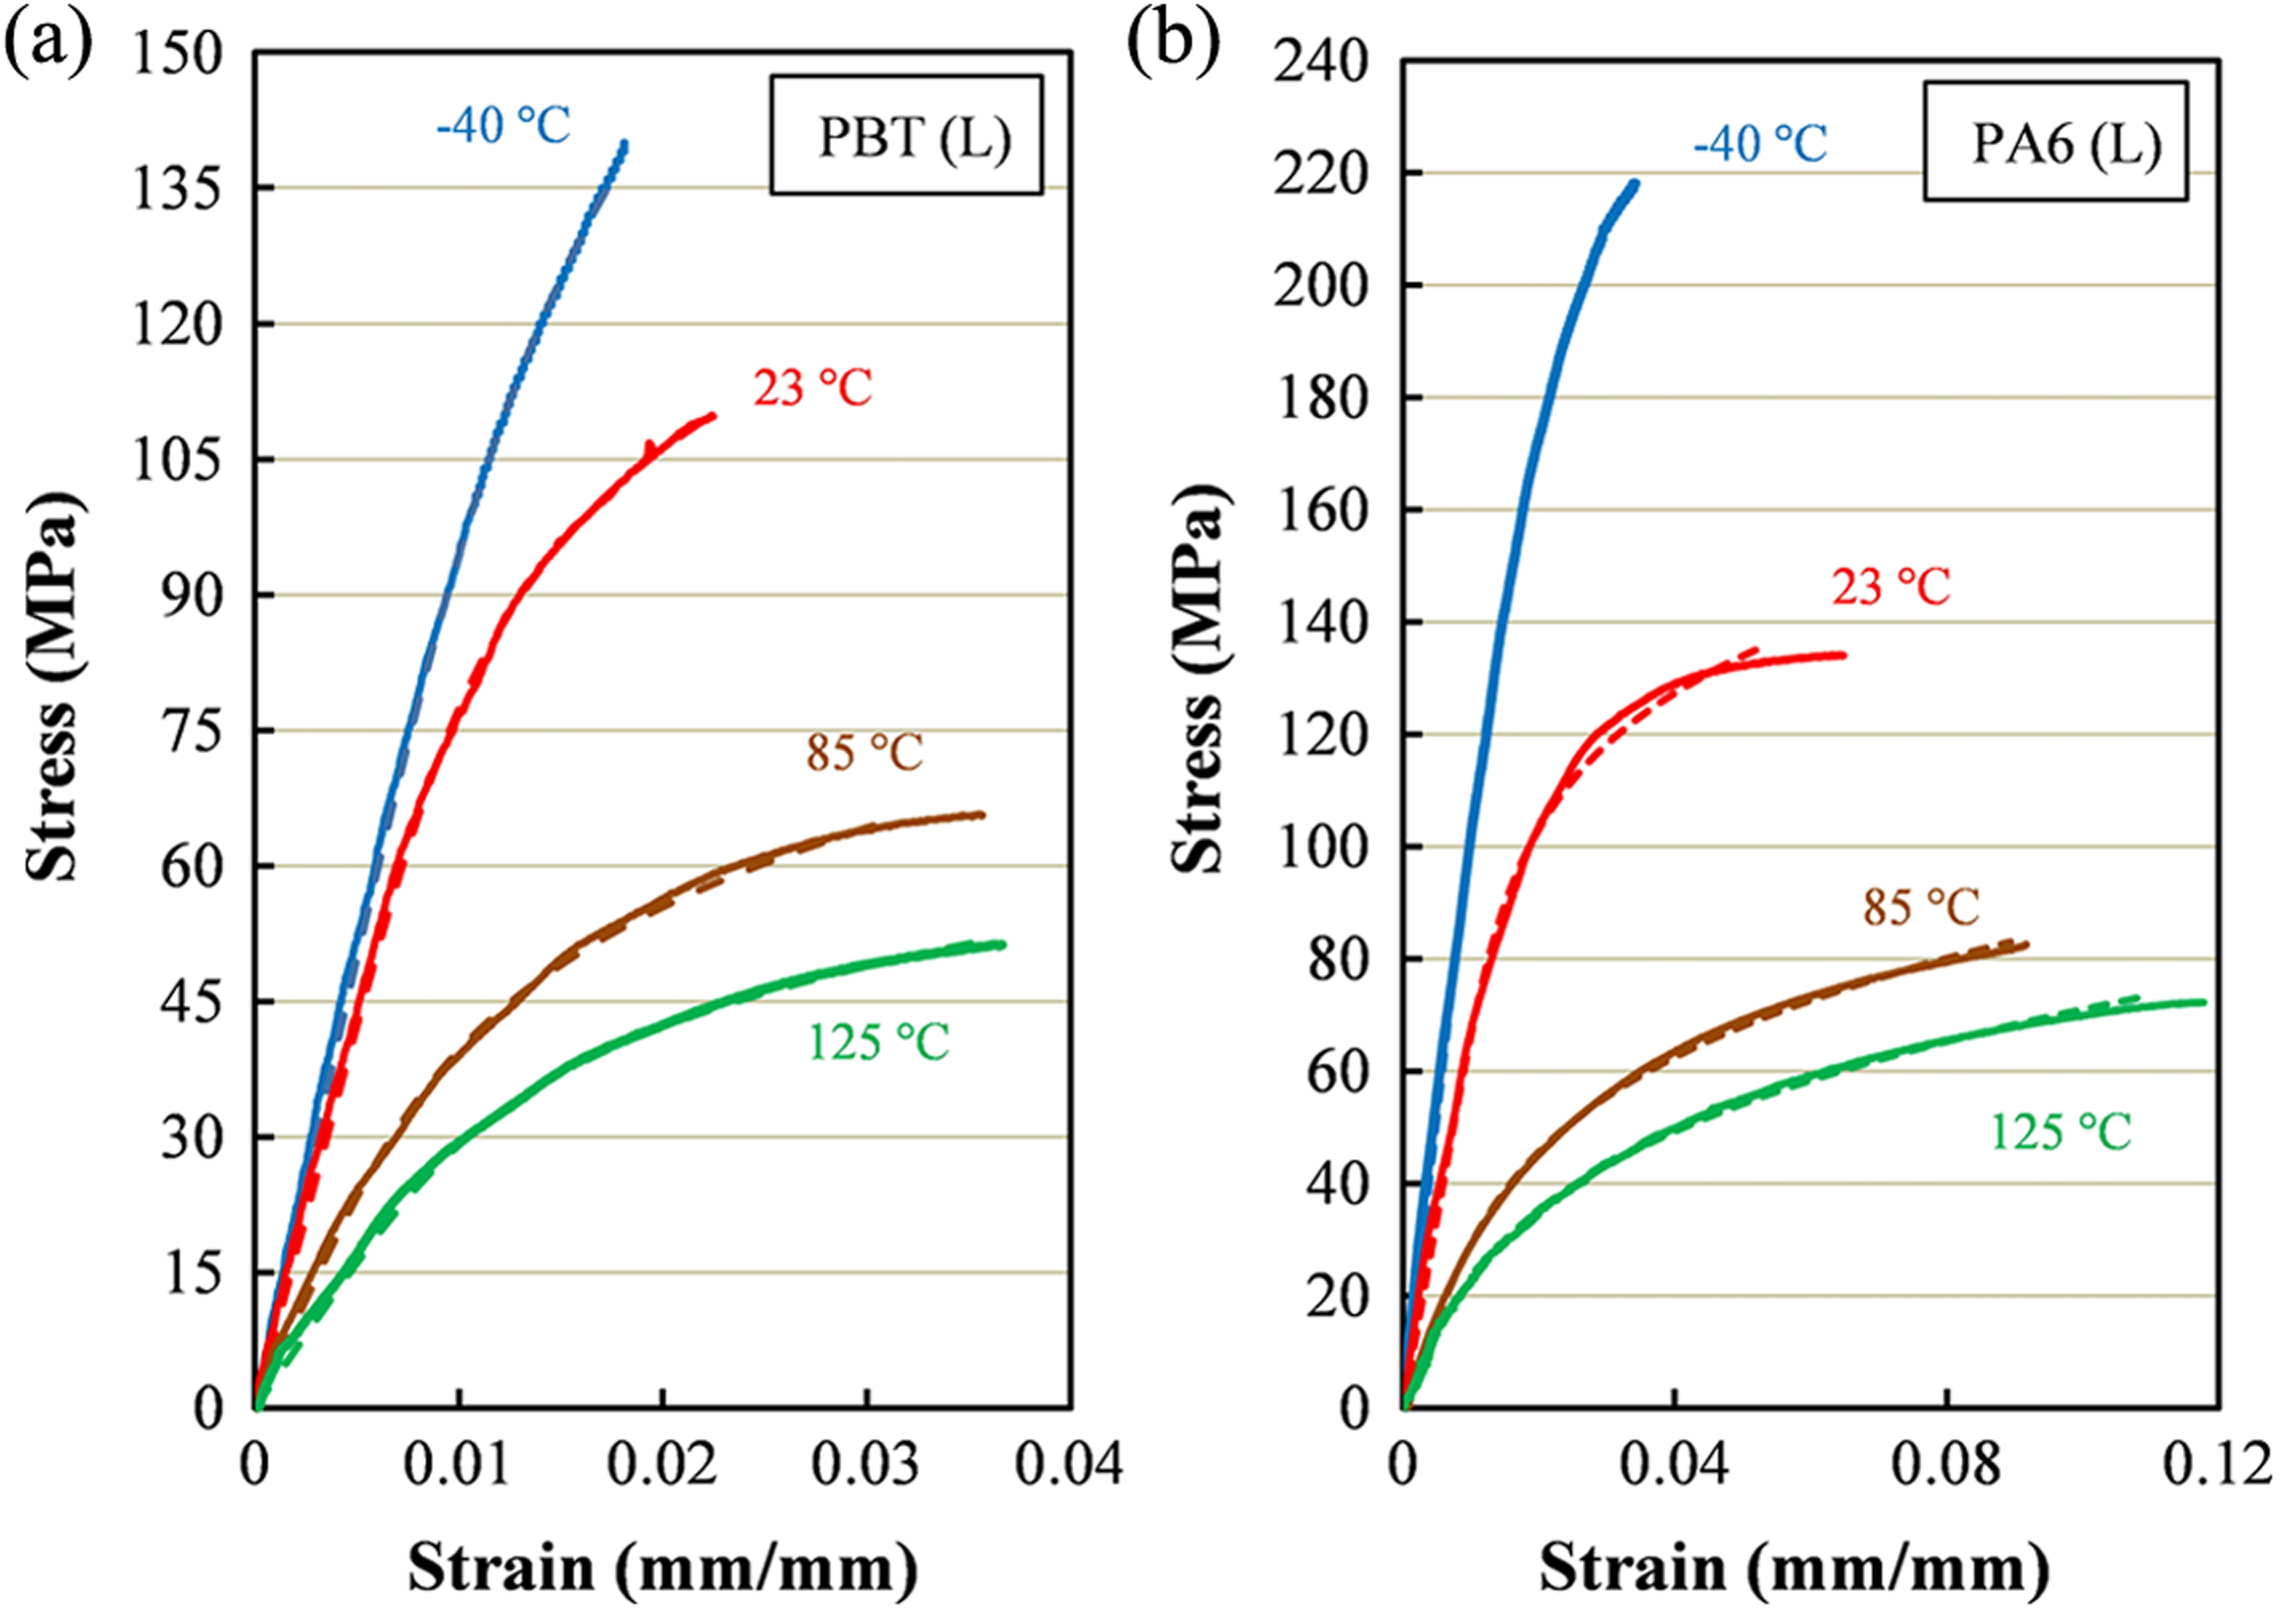
Stress–strain curves of PBT and PA6 at 23°C and at various displacement rates of 0.1, 1, 10, 100, and 1000 mm min−1 are shown in Figure 2 for both materials for the longitudinal, transverse, and 45° directions. The maximum strain in these plots corresponds to fracture strain. In all directions and for both materials, stress–strain curves at higher displacement rates are above the curves at lower displacement rates, indicating higher strength and elastic modulus.
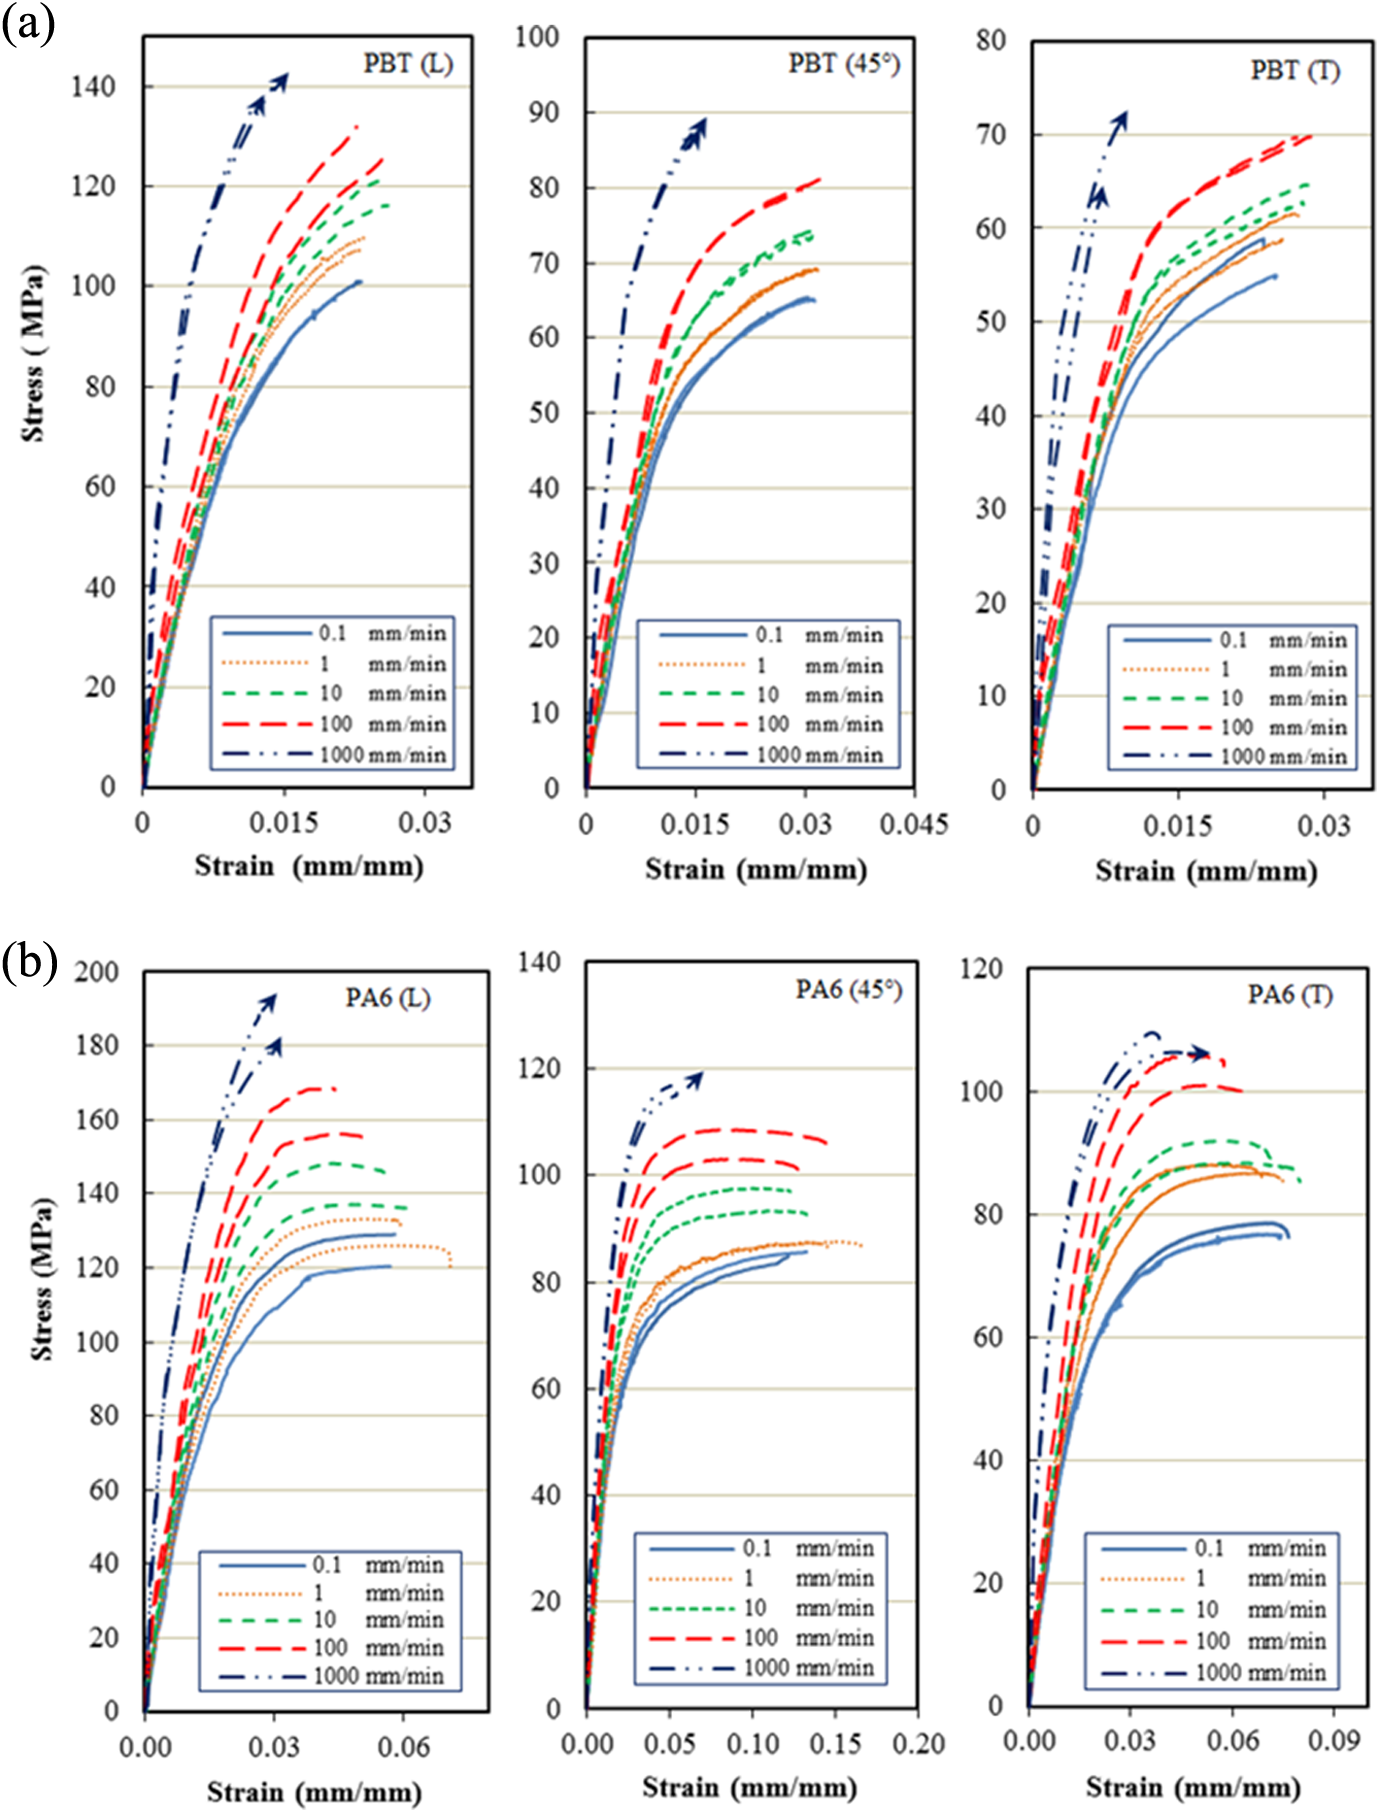
Tensile stress–strain curves at 23°C showing the effect of strain rate in different mold flow directions for (a) PBT and (b) PA6. The maximum strain in each curve corresponds to fracture strain. PBT: polybutylene terephthalate; PA6: polyamide-6.
For PA6, which has a ductile matrix, as strain rate increases, strain at tensile strength decreases. However, strain at tensile strength is nearly independent of strain rate for PBT due to relatively higher rigidity of PBT, as compared with PAs. Scanning electron microscopy (SEM) photographs of the fractured surfaces are shown in Figure 3 for mold flow-oriented samples of PBT tested at 1 and 100 mm min−1 displacement rates. As strain rate increases, a higher degree of fiber pull-out is observed confirming a higher strengthening effect of fibers, due to less stress relaxation near fiber ends. In a tension test of a viscoelastic material, stress relaxation continuously occurs along with deformation. As a result of stress relaxation process, randomly orientated coils of polymer chains are aligned in the displacement direction. As the strain rate increases, polymer chains are less prone to relaxation mechanism and, therefore, less chance to be oriented in the displacement direction. As a result, shorter effective length of polymer chains supporting the load and the material shows lower ductility and higher tensile strength and elastic modulus. 27,28 Macroscopic representation of specimen fracture paths is provided in the study by Mortazavian and Fatemi. 9
SEM of the fractured surface for tensile samples of PBT tested in the mold flow direction at (a) 1 mm min−1 and (b) 100 mm min−1. SEM: scanning electron microscopy; PBT: polybutylene terephthalate.
In order to specify the mechanical properties independent of the specimen length, a linear relationship was obtained between the actuator displacement rate and specimen gage section strain rate in the log–log scale, expressed as:

where
Tensile strength and modulus are plotted against log strain rate in Figure 4 for both materials and a linear relationship is fitted to data, expressed as:
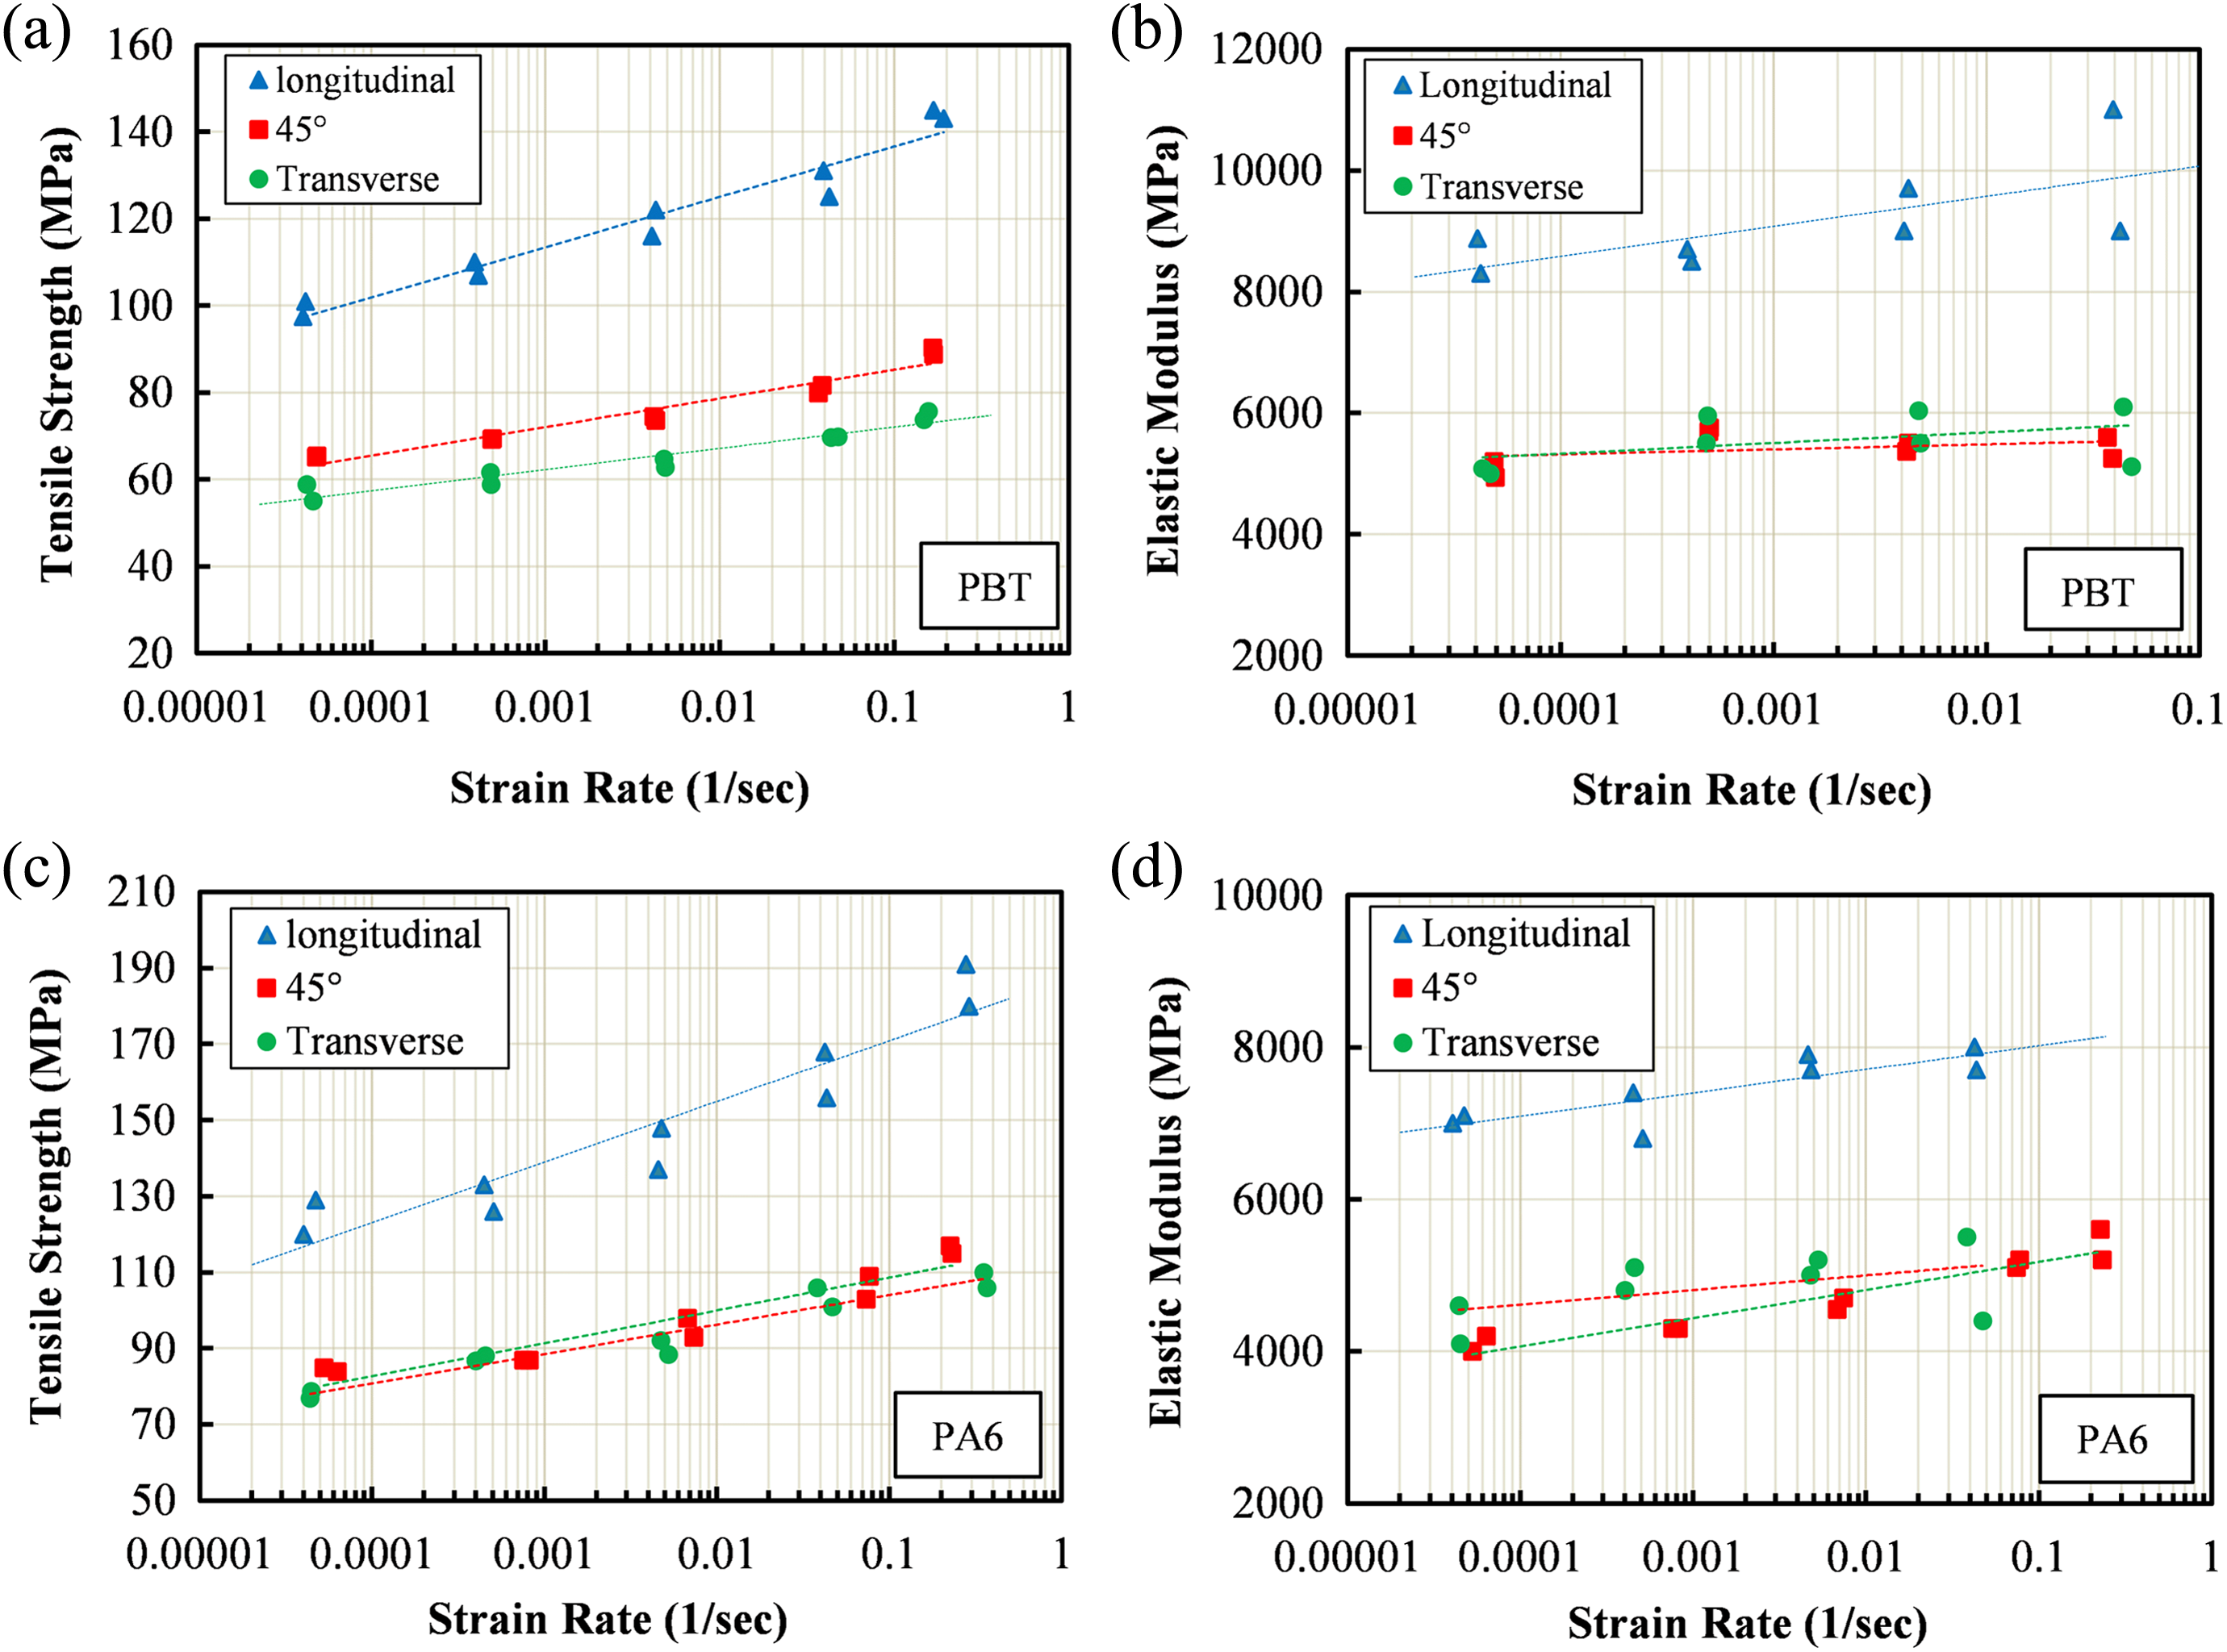
Variation of tensile strength and elastic modulus with strain rate at room temperature for PBT (a and b) and for PA6 (c and d). PBT: polybutylene terephthalate; PA6: polyamide-6.

where P represents either tensile strength or elastic modulus, and A and B are slope and intercept of the suggested line, respectively, listed in Table 3. Tensile strength increases with increasing strain rate and tensile strength in the longitudinal direction indicates a higher sensitivity to the strain rate, as compared with the transverse and 45° directions for both materials. This may result from less stress relaxation near fiber ends at higher strain rates and a higher load transfer efficiency from matrix to fiber in the mold flow direction-oriented fibers. However, the sensitivity of tensile modulus to strain rate is nearly the same for PA6 in all testing directions, as seen in Figure 4.
Constants of equation (2) for PBT and PA6.
PBT: polybutylene terephthalate; PA6: polyamide-6.
Variation of tensile toughness measured as the areas under stress–strain curve with displacement rate for PBT and PA6 is shown in Figure 5. Tensile toughness increases as both load bearing of fibers and matrix ductility increase. Tensile toughness of PBT increases with increasing displacement rate in all directions, while it is nearly constant for PA6. This is because for PA6 as loading rate increases, fiber load bearing increases and ductility reduces, due to less stress relaxation at fiber ends. However, for PBT as loading rate increases, a higher fiber load bearing occurs and ductility is less influenced by loading rate due to inherent rigidity of PBT matrix. At a given displacement rate, tensile toughness of PBT decreases as specimen angle increases. This results from both higher load bearing of fibers in longitudinal direction compared with off-axis specimens and high rigidity of PBT matrix. The 45° samples of PA6 show significantly higher tensile toughness as compared with 0° and 90° directions. This is due to the substantial ductility in PA6 matrix which its elongation has been less restricted in 45° direction compared with longitudinal and transverse directions. Tensile toughness is substantially higher in PA6 compared with PBT, resulting from high toughness of PA6 as well as addition of rubber impact modifier. This capability makes PA6 suitable for applications where high-energy absorption is required.
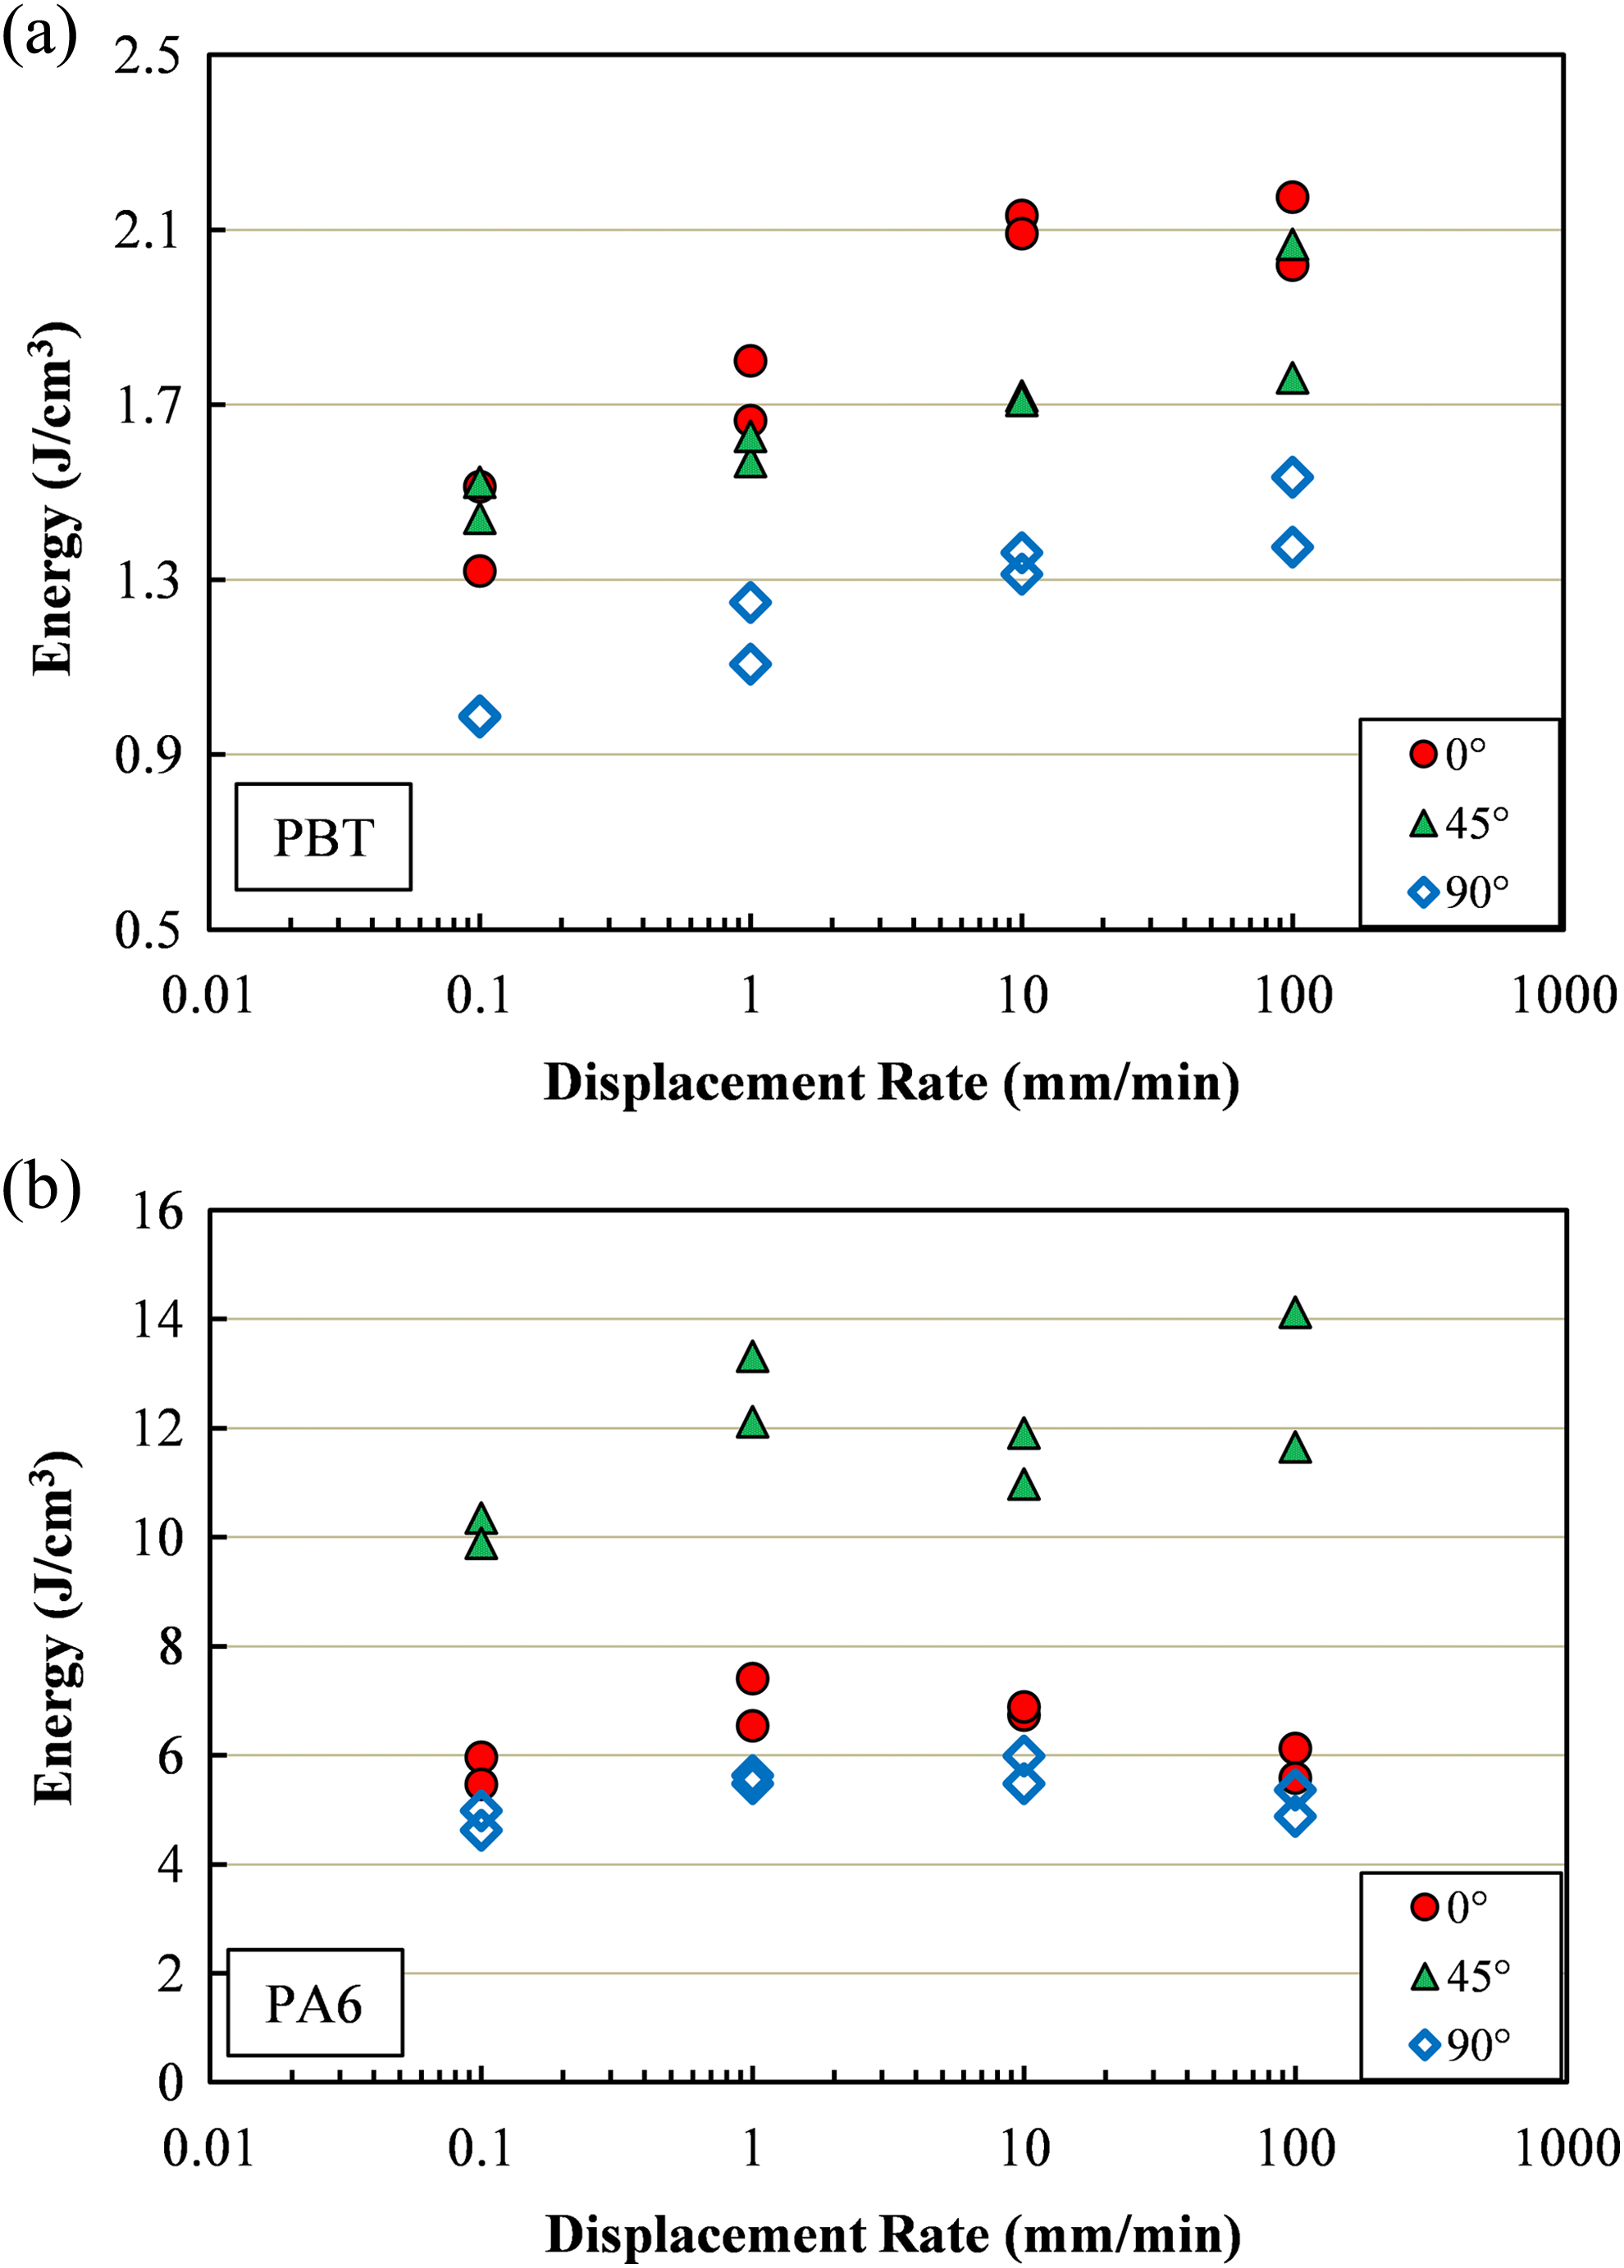
Variation of tensile toughness at 23°C with displacement rate for (a) PBT and (b) PA6. PBT: polybutylene terephthalate; PA6: polyamide-6.
Temperature effect
Tension tests conducted at temperatures of −40, 23, 85, and 125°C were with displacement rates of 1 and 10 mm min−1 for both materials. As seen in Figure 6 for displacement rate of 1 mm min−1, stress–strain curve is considerably influenced by temperature for both materials. The maximum strain in these plots corresponds to fracture strain. As testing temperature increases, tensile strength and elastic modulus decrease and ductility increases. Similar behavior was observed at the displacement rate of 10 mm min−1 for both materials.
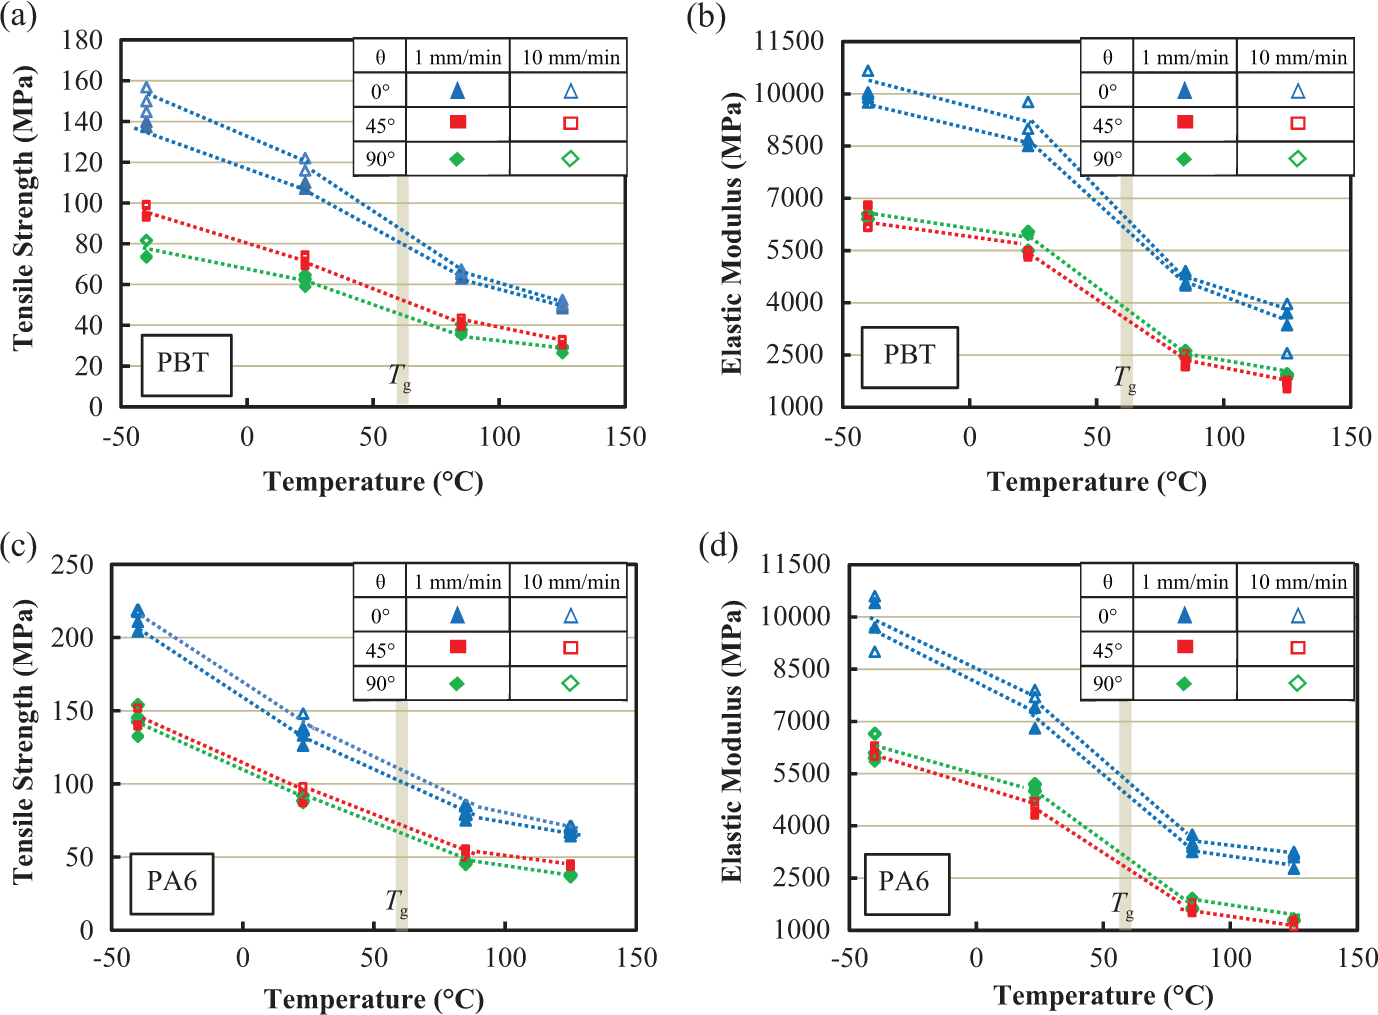
Tensile stress–strain curves at displacement rate of 1 mm min−1 showing the effect of temperature for PBT in the (a) longitudinal 30 and (b) transverse directions, and for PA6 in the (c) longitudinal and (d) transverse directions. The maximum strain in each curve corresponds to fracture strain. PBT: polybutylene terephthalate; PA6: polyamide-6.
Variations of tensile strength and elastic modulus with temperature at both 1 and 10 mm min−1 displacement rates are shown in Figure 7 for both PBT and PA6. The sensitivity of tensile properties to the temperature increases near T g. In various mold flow directions, nearly identical temperature sensitivity is observed at each temperature. This observation indicates the dominancy of matrix in temperature dependency of both PBT and PA6.
Variation of tensile properties with temperature at displacement rates of 1 and 10 mm min−1 for PBT for (a) tensile strength and (b) elastic modulus, and for PA6 for (c) tensile strength and (d) elastic modulus. PBT: polybutylene terephthalate.
As shown in Figure 7, three different slopes can be identified for the variation of tensile strength and elastic modulus of both materials at temperatures below, near, and above T g of considered polymer composites. At temperatures sufficiently below T g, elastic modulus reduces less rapidly with increasing temperature than at temperatures in the vicinity of T g. However, a linear fit is also a reasonable representation of data for both tensile strength and elastic modulus of both materials.
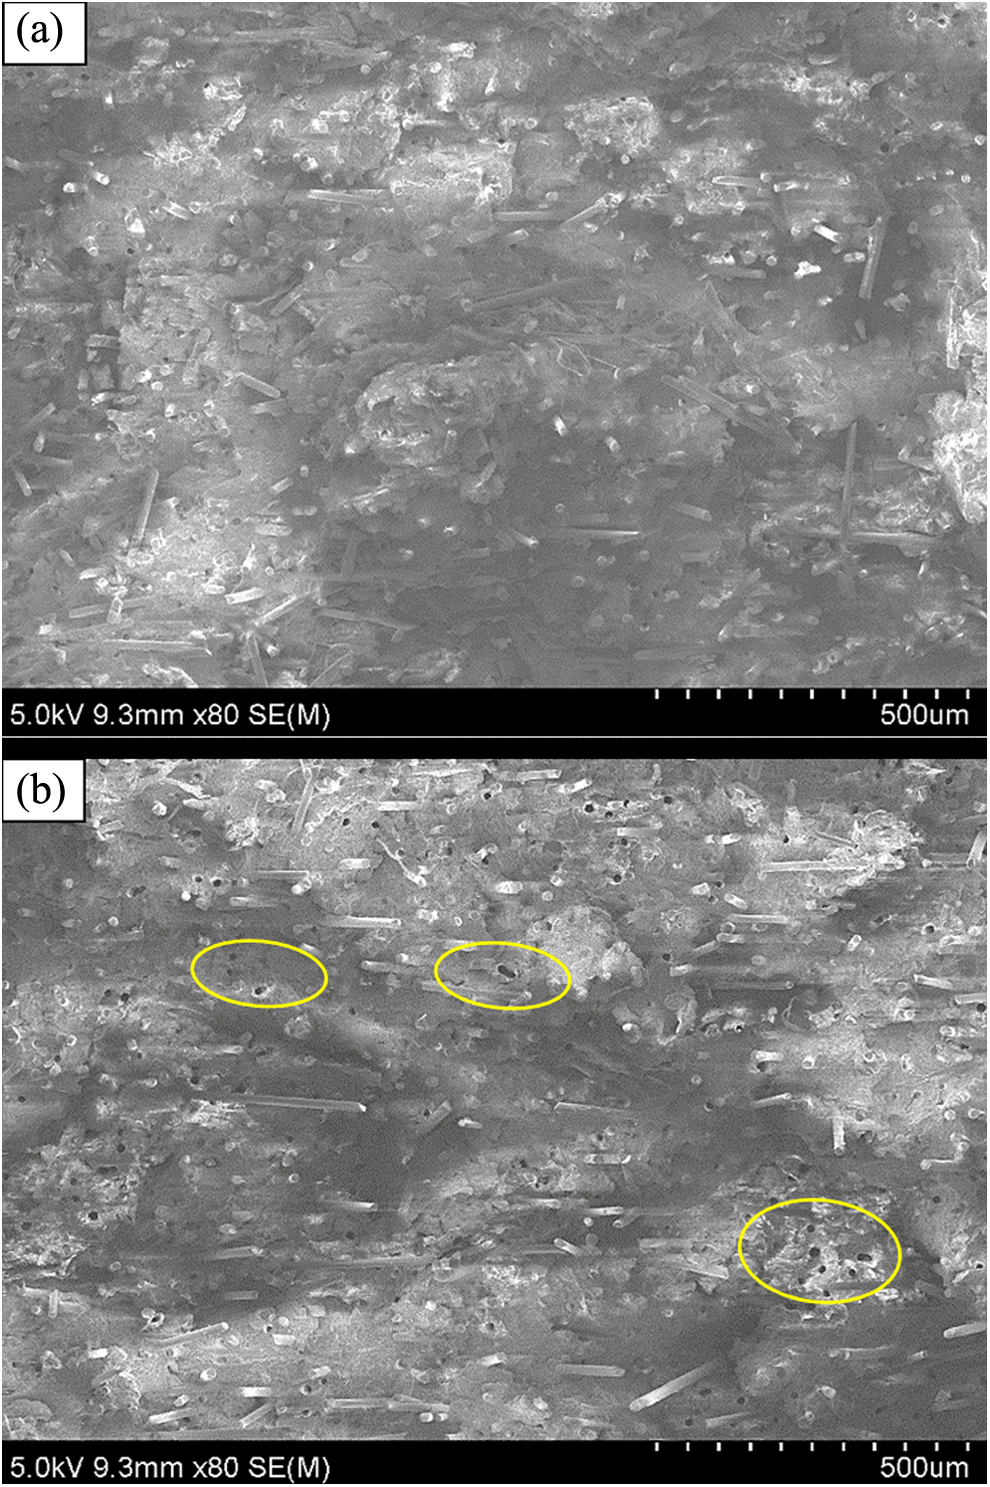
SEM fractographs of PBT are shown in Figure 8 for samples machined in the mold flow direction and tested at 1 mm min−1 displacement rate, comparing mechanisms of failure at −40°C and 125°C. In the core area of 125°C samples where fibers are mostly transverse to the loading direction, some degree of fiber debonding is observed due to matrix ductile rupture, as seen in Figure 8(a). In the core area of −40°C tests, fiber peeling for transversely oriented fibers due to matrix brittle fracture and fiber pull-out for fibers oriented in loading direction are observed, as can be seen in Figure 8(c).
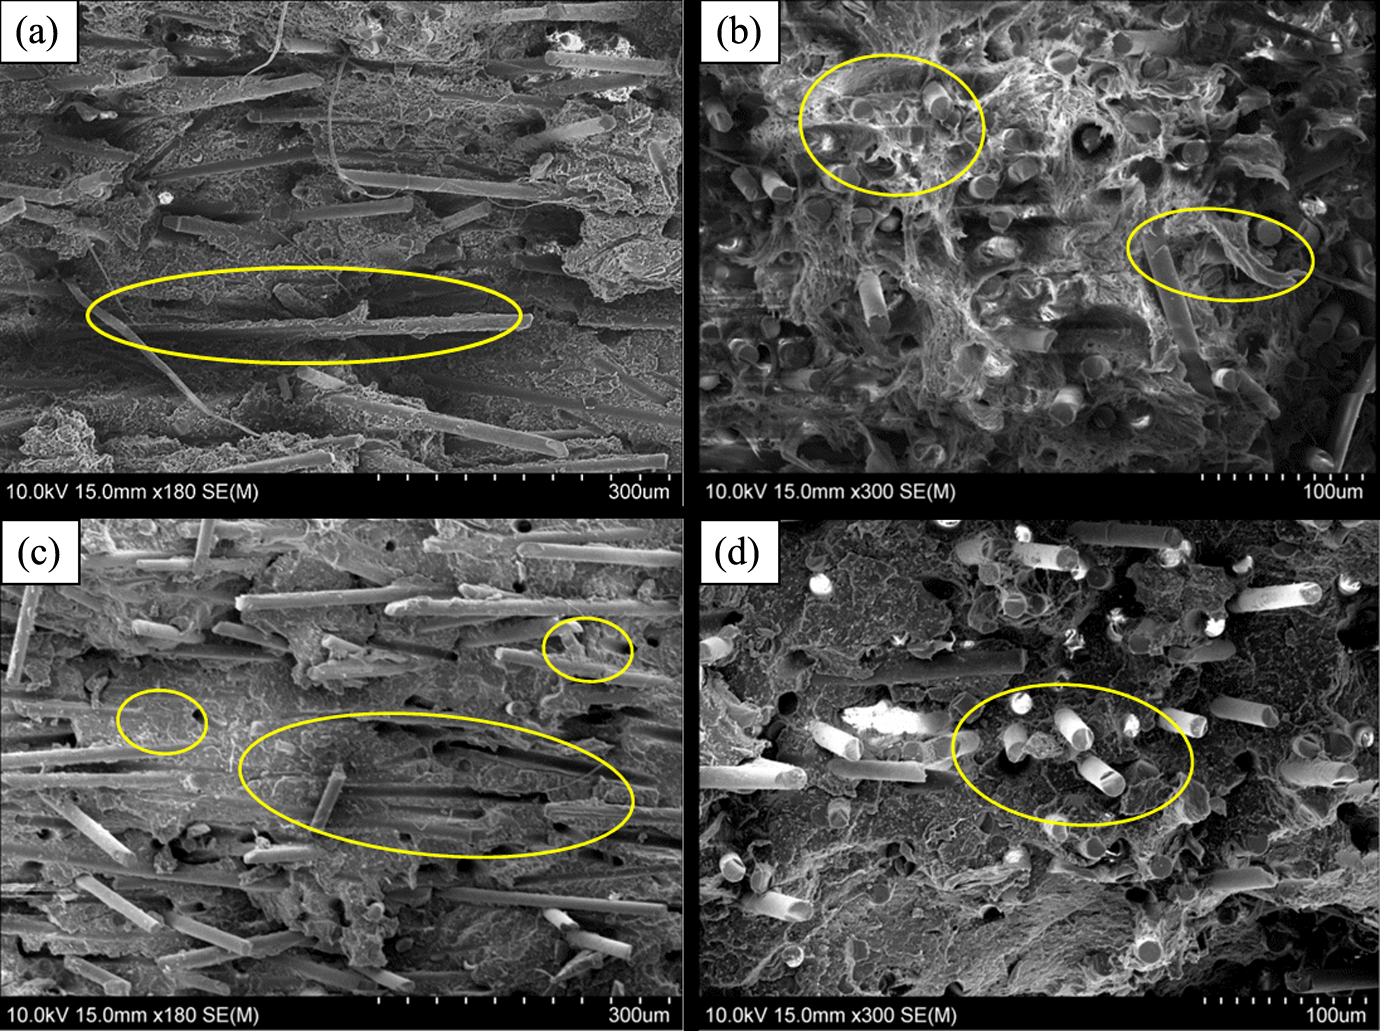
SEM of the fractured surface of tensile specimens tested in the mold flow direction at displacement rate of 1 mm min−1 of PBT at 125°C in (a) core and (b) shell layers, and at −40°C in (c) core and (d) shell layers. SEM: scanning electron microscopy; PBT: polybutylene terephthalate.
In shell layers, where fibers are highly aligned in the mold flow direction, different mechanisms were distinguished between the two temperatures. At 125°C, matrix crazing with fibrils structure and high plastic deformation due to stress concentrations at fiber ends is visible. This mechanism is more pronounced in the corner of sample, as shown in Figure 8(b). At −40°C, matrix supports aligned fibers in the shell layer and fiber pull out is the dominant fracture mechanism, as seen in Figure 8(d). The deformation of matrix in PA6 can be significantly higher than PBT at 125°C due to higher ductility of PA6, while nearly similar failure mechanisms as PBT is expected at −40°C.
Stress–strain relations and mathematical representations
A nonlinear relationship was fitted to the test data of both materials to represent stress–strain behavior. This relationship, known as Ramberg-Osgood relation, is expressed as:
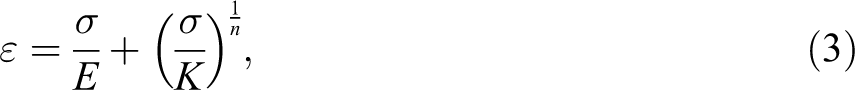
where K is strength coefficient and n is strain hardening exponent, with their values summarized in Tables 1 and 2. These properties were obtained from a fit of true stress (σ) versus true plastic strain (εp ) data in log-log scale, based on the ASTM E646 standard for metallic sheet materials. 26 The equation of the fit line can be expressed as:

The stress–strain curves at different temperatures in the longitudinal direction and at displacement rate of 1 mm min−1 of both PBT and PA6 are represented with equation (3) in Figure 9. As can be seen, this equation accurately captures the relationship between stress and strain in both elastic and plastic regions. This equation was also able to accurately represent the stress–strain curves for other mold flow directions, temperatures, and strain rates of both materials.
Stress–strain curves (solid lines) and Ramberg-Osgood equation representation (dashed lines) for (a) PBT and (b) PA6 in the longitudinal direction at displacement rate of 1 mm min−1. PBT: polybutylene terephthalate; PA6: polyamide-6.
Another nonlinear equation was fitted to stress–strain data, expressed as 7 :
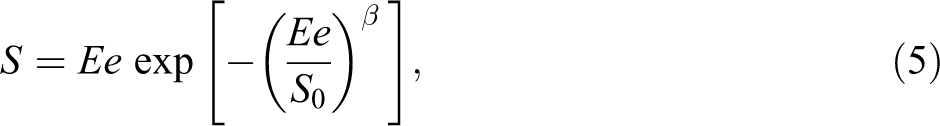
where β and S 0 are parameters obtained from the fit of data. This parameter, however, was not able to capture the stress–strain relationship as good as the Ramberg-Osgood equation in the longitudinal or transverse direction.
As discussed earlier, tensile strength and modulus increased with log strain rate and decreased with temperature. Assuming a linear relation between tensile properties (Su and E) and temperature, a three dimensional equation can be fitted to the data, expressed as:

By obtaining constants A′, B′, and C′, the combined effect of temperature and strain rate on tensile properties can be estimated.
The 0.2% S y is an important tensile property used in many design applications. A unique linear correlation between the yield strength and tensile strength for each material was observed, independent of mold flow direction, temperature, and strain rate, as shown in Figure 10. This figure includes data at all mold flow directions, temperatures, and strain rates. These linear relations for PBT and PA6 are expressed as:
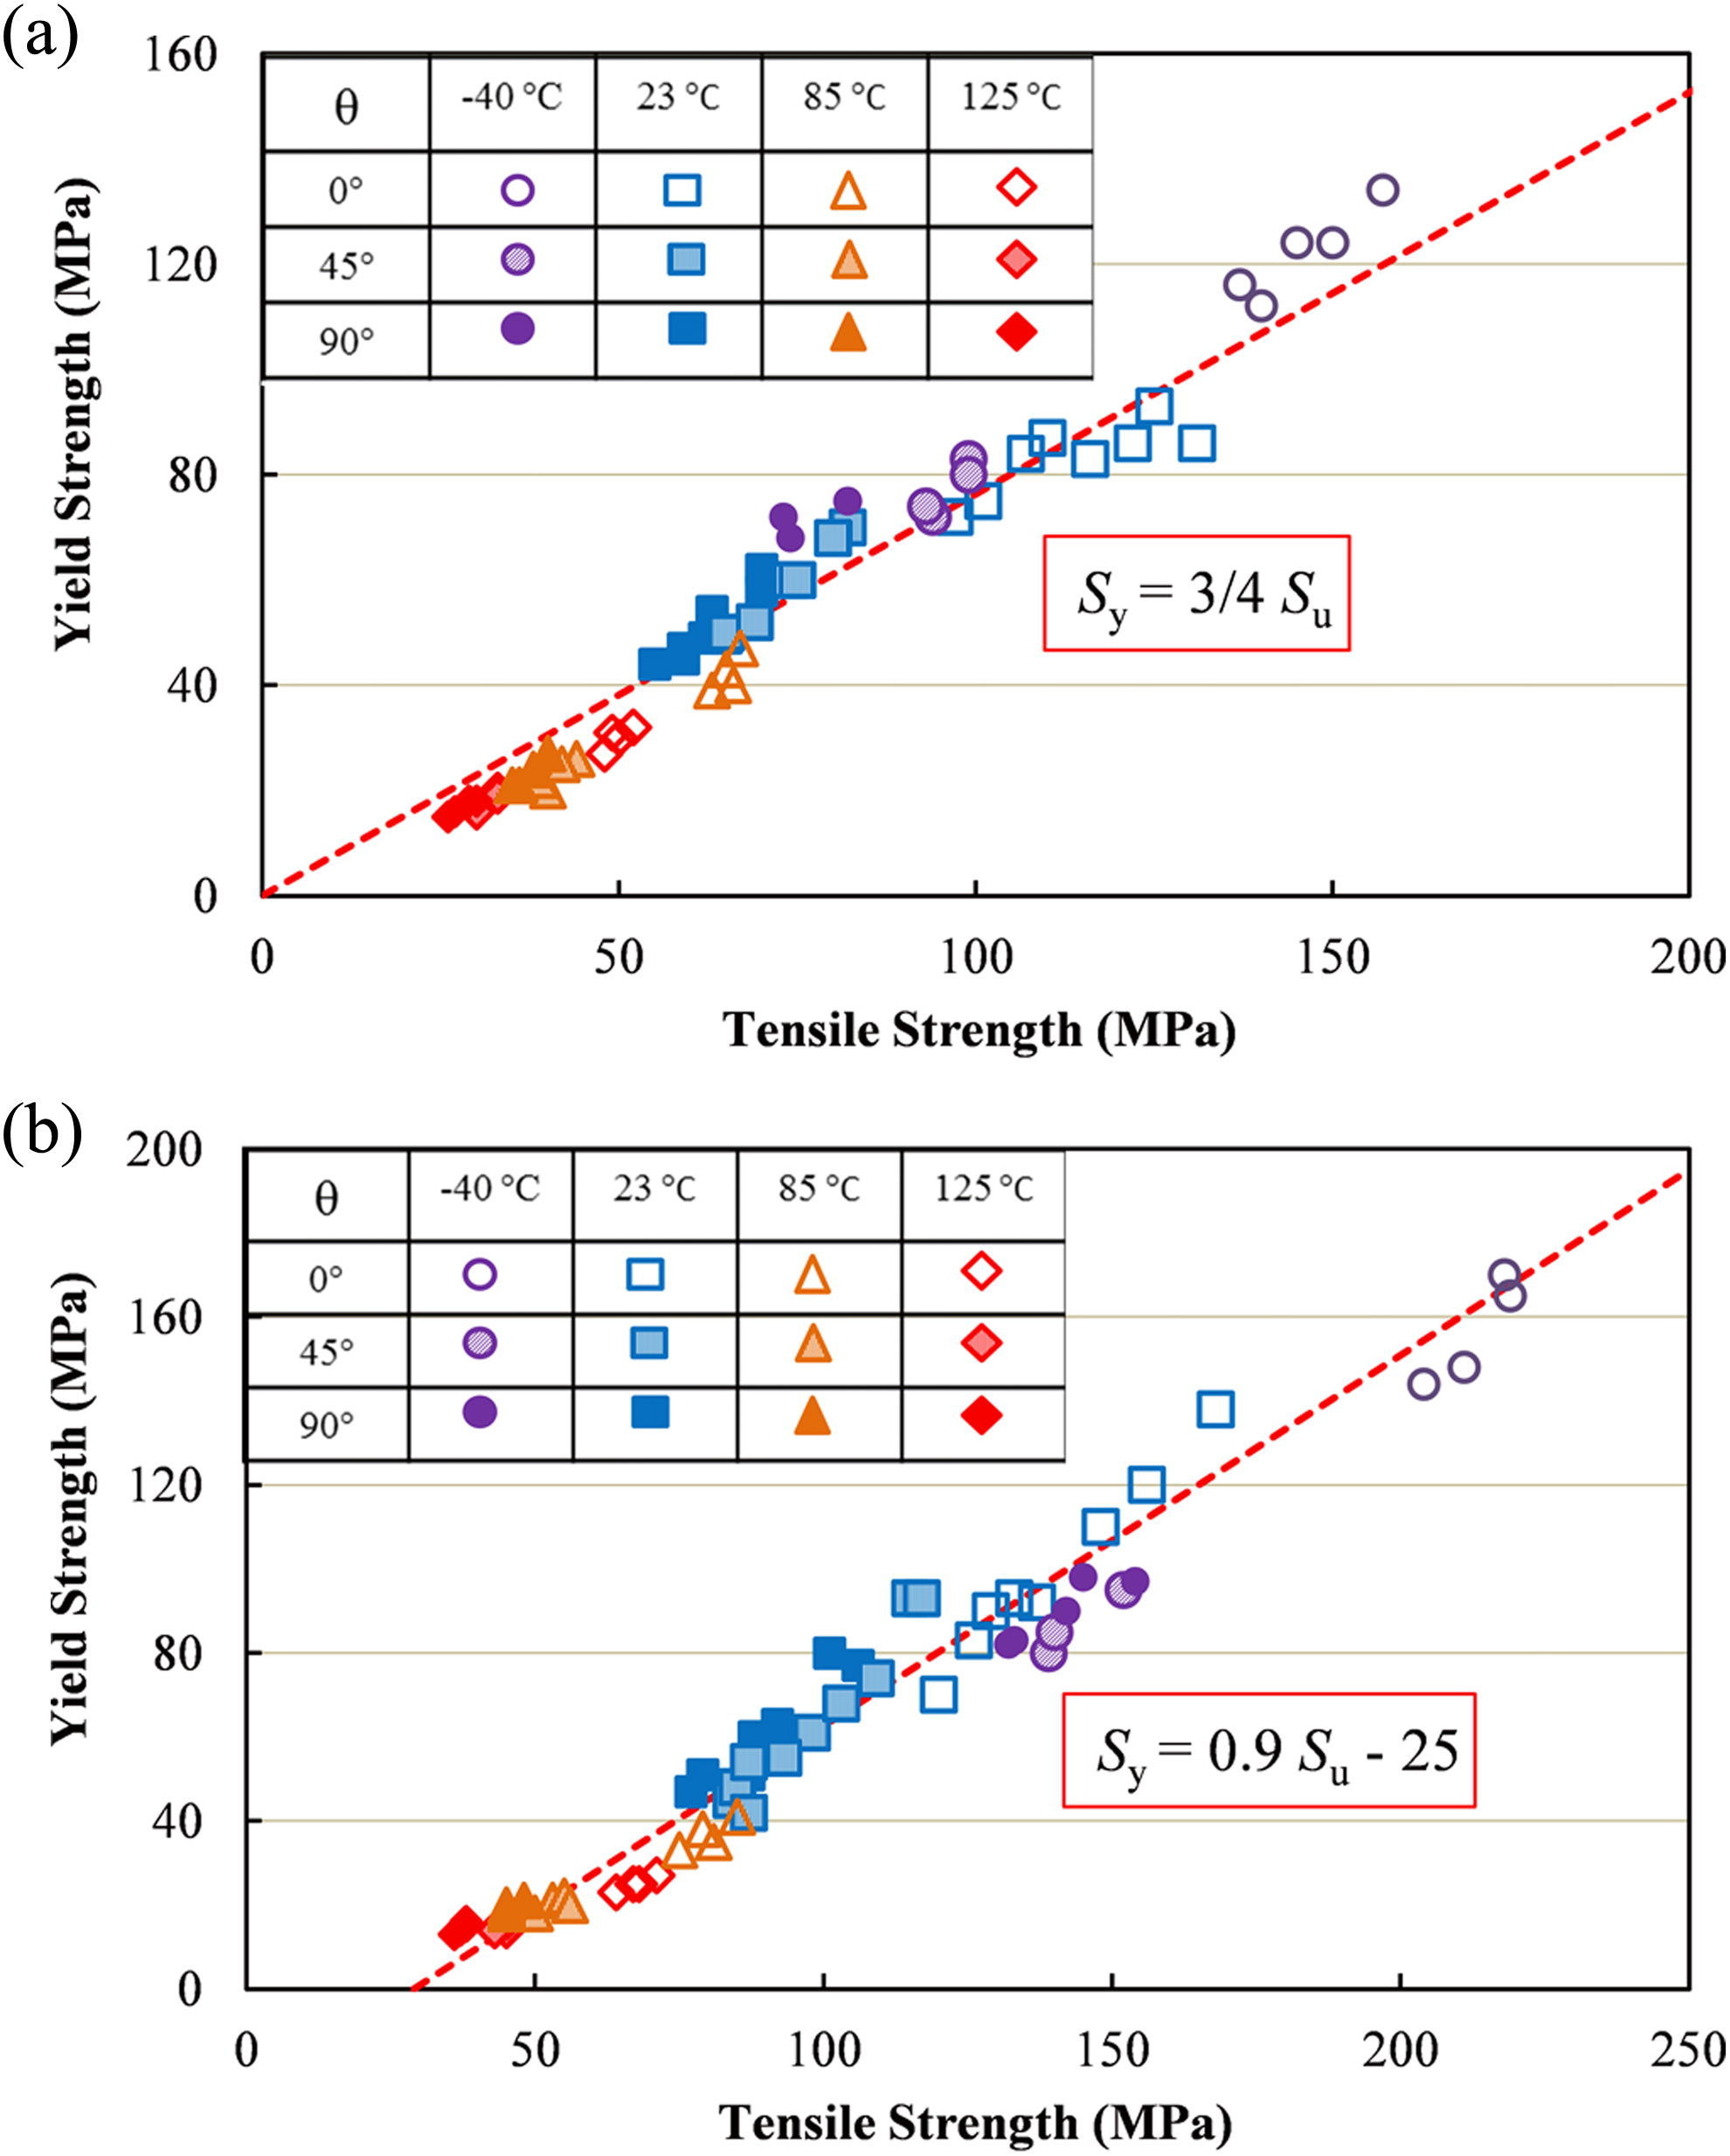
Relationship between yield strength and tensile strength at various mold flow directions, temperatures, and strain rates for (a) PBT and (b) PA6. PBT: polybutylene terephthalate; PA6: polyamide-6.


Time–temperature superposition for tensile strength
Time–temperature superposition method was applied to the test data conducted at various temperatures and strain rates in order to obtain a relation for tensile strength as a function of both temperature and strain rate. Tensile strength data at all temperatures and strain rates were plotted against the strain rate of the tensile tests. These plots in the longitudinal and transverse directions of PBT and PA6 are shown in the left side of Figure 11. As can be seen from this figure, tensile strength increases as temperature decreases and strain rate increases. Tensile strength data at various temperatures and strain rates for each material and direction can then be superimposed into a single curve, as shown in the right side of Figure 11.
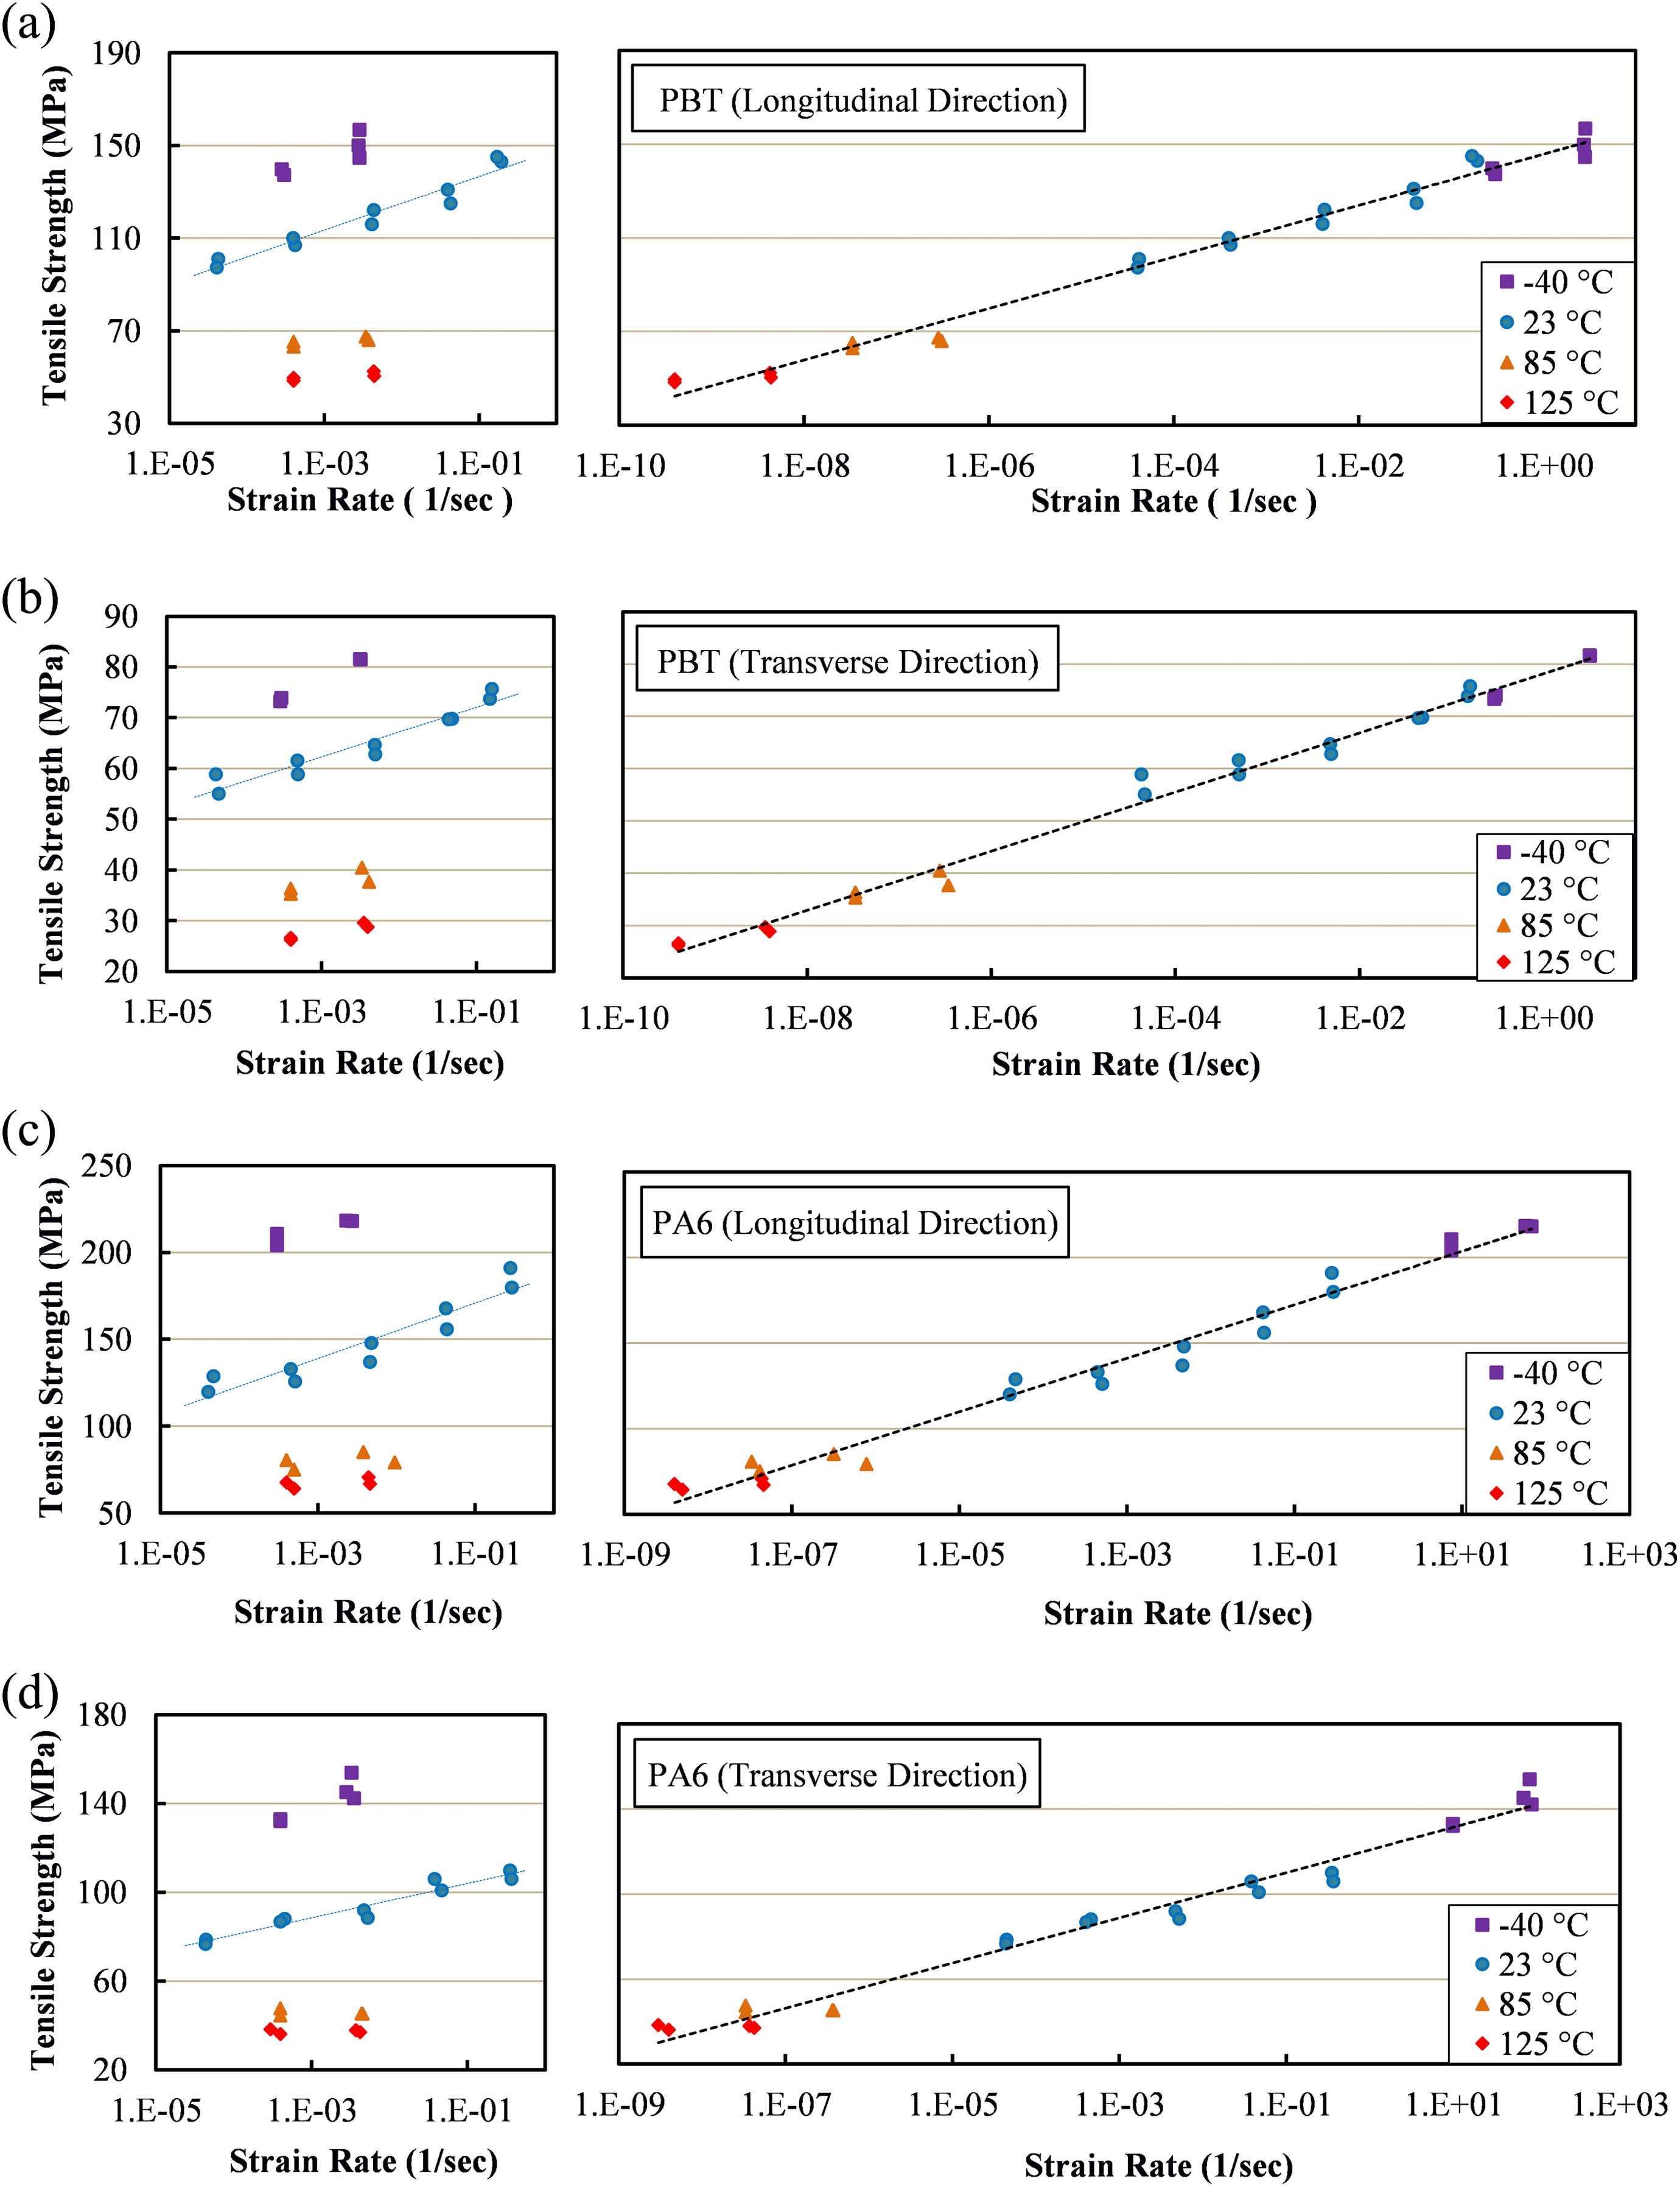
Master curves generated using time–temperature superposition principle for PBT in the (a) longitudinal and (b) transverse directions, and for PA6 in the (c) longitudinal and (d) transverse directions. PBT: polybutylene terephthalate; PA6: polyamide-6.
The 23°C temperature was defined as the reference temperature. The strain rates at −40°C experiments were shifted in the left direction and the strain rates of tests at 85°C and 125°C were shifted in the right direction, until a reasonable fit to all the tensile strength data at various temperatures and strain rates with sufficient R 2 was obtained. A linear master curve for tensile strength as a function of log shifted strain rate was obtained for each material and mold flow direction by shifting of the data at different temperatures from the reference temperature, as shown in the right side of Figure 11 for longitudinal and transverse directions, and expressed as:

A similar linear master curve was also obtained for the 45° direction.
Log of shift factor values are plotted against the reciprocal of temperature in Figure 12. Linear relationships exhibiting an intersection nearby T g are fitted to the data. The linearity of the relationship between log shift factor and the reciprocal of temperature agrees with Arrhenius equation, expressed as:
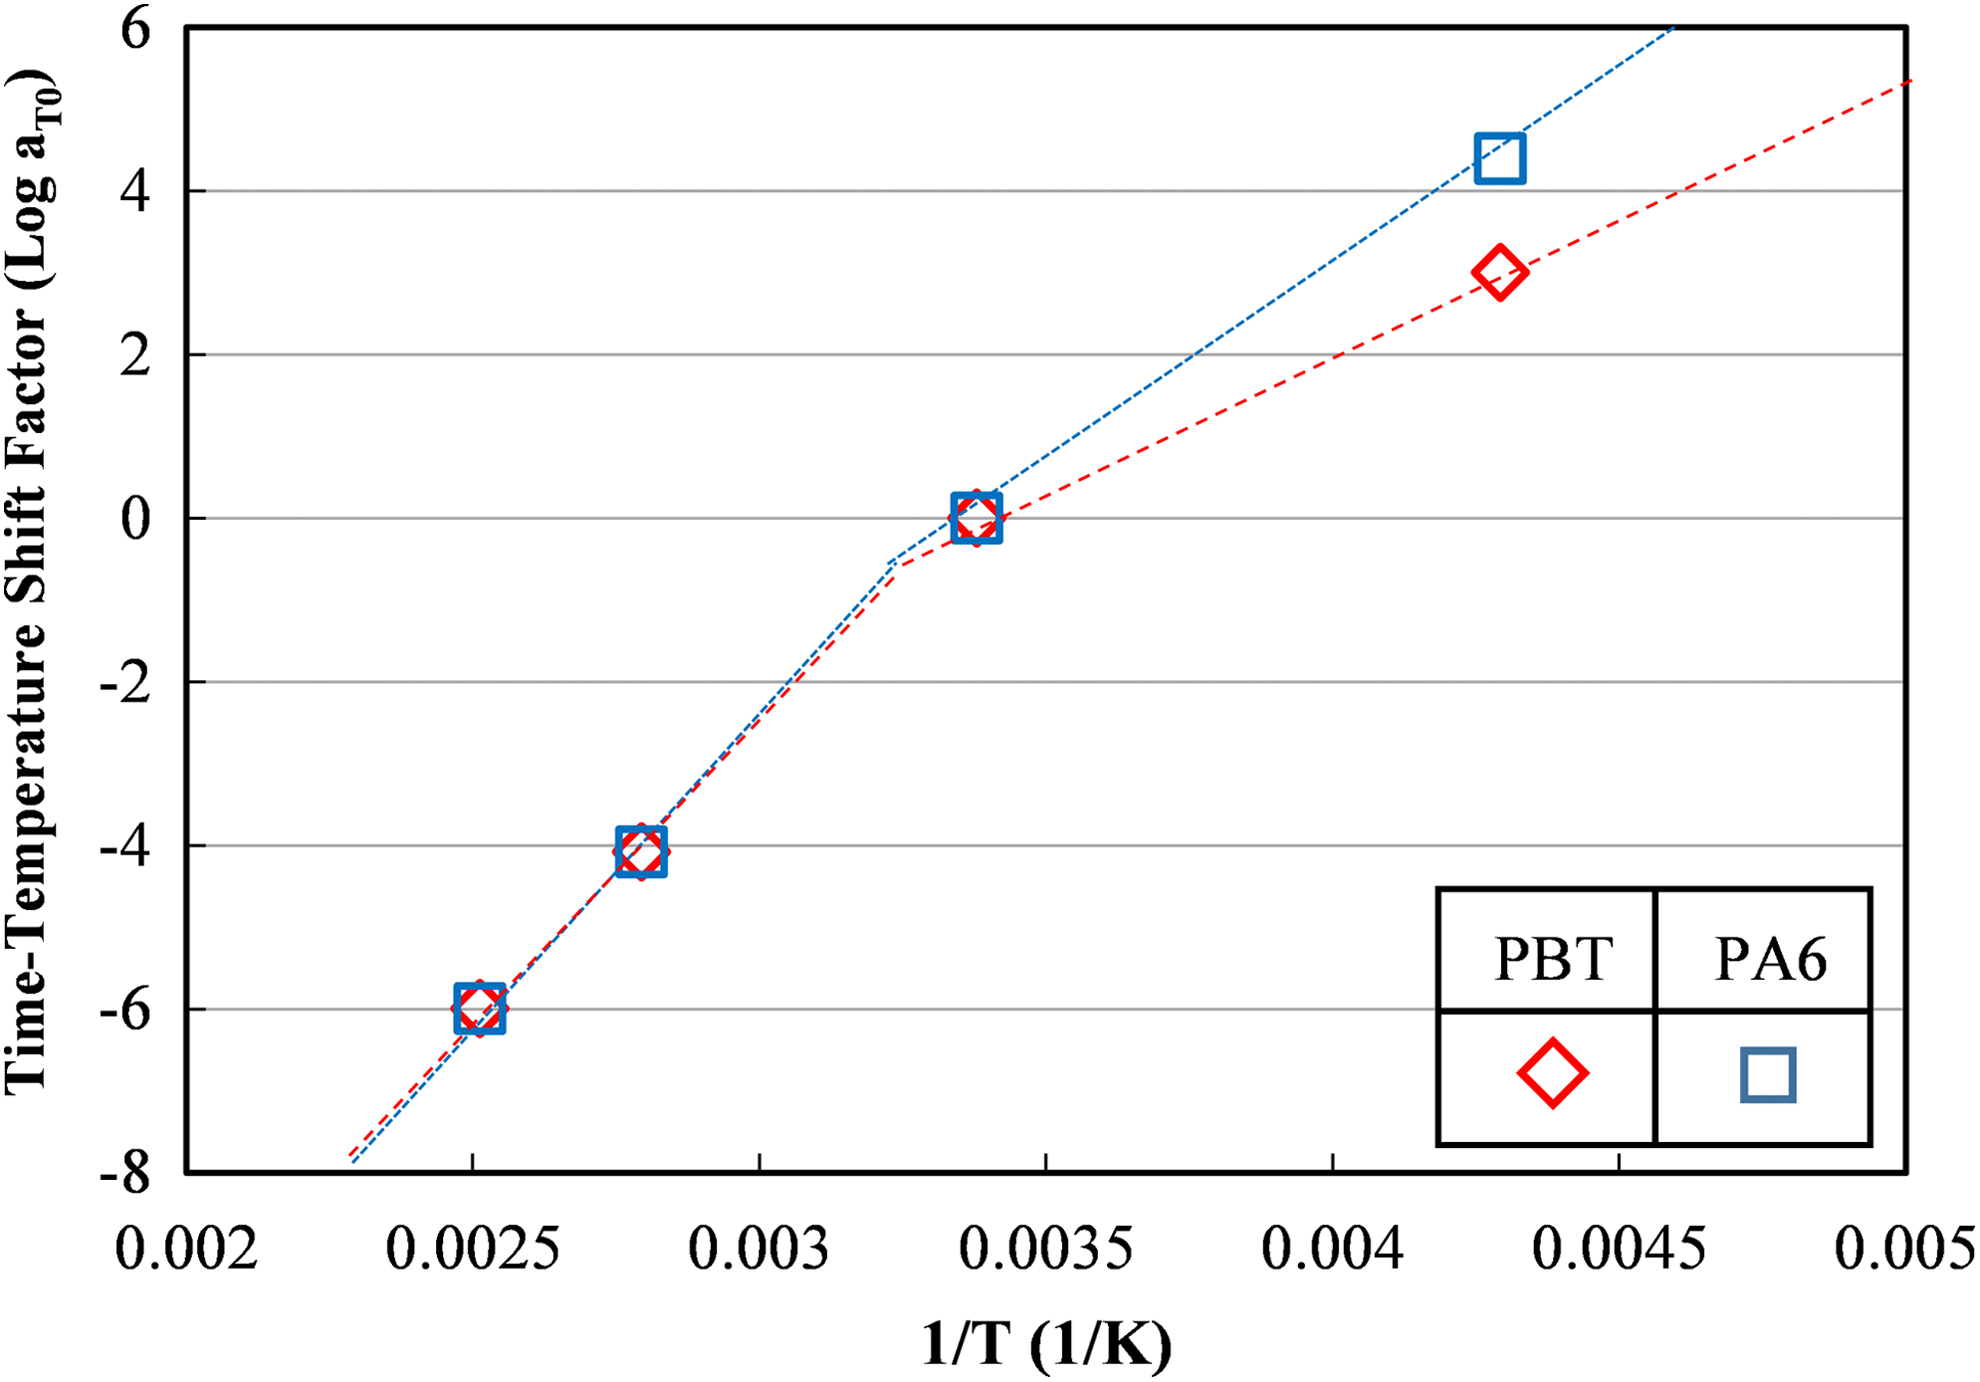
Variation of log shift factor with the reciprocal of temperature for PBT and PA6. Each data point includes longitudinal, 45°, and transverse directions. PBT: polybutylene terephthalate; PA6: polyamide-6.

where
The master curves shown in Figure 11 and the variation of log shift factor with reciprocal of temperature shown in Figure 12 can be used to predict tensile strength at temperatures between −40°C and 125°C and strain rates between 10−5 and 0.1 s−1. The procedure to obtain tensile strength is first to measure the shift factor at a particular temperature from Figure 12. The shift factor is then multiplied by the strain rate and the resulting strain rate is used to obtain tensile strength from master curves displayed in Figure 11.
Conclusions
The tensile behavior of two common short glass fiber-reinforced polymer composites was evaluated at a range of temperatures and strain rates. Based on the observed experimental behavior and the analysis performed, the following conclusions can be made: Both materials were found to be temperature and strain rate dependents. Tensile strength and elastic modulus increased linearly with log of strain rate and decreased nonlinearly with increasing temperature. Variations of tensile strength and elastic modulus with temperature indicated a higher slope near T
g. Tensile strength in the longitudinal direction indicated higher sensitivity to strain rate, as compared with the transverse and 45° directions. Elastic modulus indicated nearly similar sensitivity to strain rate in various mold flow directions. Strain at tensile strength significantly increased with increased temperature, but tensile toughness was found to be material and direction dependent. For PBT tensile toughness slightly increased with increasing strain rate, while for PA6 it was nearly constant at different strain rates. A Ramberg-Osgood-type relation often used for metallic materials represented the stress–strain relationship at all test conditions for both materials well. A linear relationship was also found between tensile strength and yield strength. Time–temperature superposition principle was applied to tensile strength data. A shift factor of Arrhenius type was obtained to fit tensile strength data at different temperatures and strain rates into a master curve, independent of the mold flow direction. Fracture surface of specimens indicated a higher degree of fiber pull-out at higher strain rates. At 125°C, interfacial debonding and matrix crazing in fibril form were dominant mechanisms. At −40°C, matrix brittle fracture and fiber peeling were observed in the core layer and fiber pull-out was dominant in shell layers.
Footnotes
Acknowledgements
This project was financially supported by General Motors. Technical assistance of Dr AK Khosrovaneh and Mr Charles Buehler at GM is appreciated.
Declaration of Conflicting Interests
The author(s) declared no potential conflicts of interest with respect to the research, authorship, and/or publication of this article.
Funding
The author(s) disclosed receipt of the following financial support for the research, authorship, and/or publication of this article: This project was financially supported by General Motors.