
Abstract
Void consolidation of high-performance thermoplastic composites strongly depends not only on average void content but also on the distributions of void size, shape, and location within the prepreg materials. High-resolution 3-D X-ray microcomputed tomography shows that voids in carbon/poly(ether ether ketone) (AS4/APC2) prepreg are rodlike with major axis along the fiber axial direction. In order to accurately characterize the void microstructure, a detailed study was conducted to quantify the statistical distribution of void content, void length, equivalent void diameter, and void aspect ratio. Resolution of 1.48 μm/pixel provided a balance of measurement accuracy and inspection time. Suitable statistical distribution functions were found to describe the void length, diameter, and aspect ratio. For each void property, a sub-statistical representative volume element (SRVE) was determined. The SRVE of the overall void microstructure is defined as the maximum dimensions of the sub-SRVEs. In case of AS4/APC2 tape, the SRVE was found to be 6.1 mm in length (fiber direction), 27 mm in width (transverse to fiber direction), and 0.18 mm of full prepreg thickness.
Keywords
Introduction
High-performance continuous fiber-reinforced thermoplastic composites have been increasingly used as engineering materials because of the enhanced impact resistance, recyclability, and new methods for processing (e.g. thermoforming and tape placement) and joining (e.g. resistance, ultrasonic, and induction welding). 1 –6 Thermoplastic prepreg materials for high-performance thermoplastic composite parts contain a relatively high level of initial void content (5–10%). A typical two-dimensional (2-D) cross section of an AS4 carbon fiber-reinforced poly(ether ether ketone) (PEEK) prepreg is shown in Figure 1. The prepreg cross section has an average void content of 7.8% (measured by area method) with individual voids varying in size. Spatial locations of the voids are nonuniformly distributed within the cross section. These voids are detrimental to the performance of thermoplastic composite parts and should be reduced during part processing to levels below 1% to satisfy aerospace quality. 7 –9 Modeling of void consolidation has shown that the initial void size and spatial location within prepreg are important factors governing the time to reduce void content during processing. 10,11 Therefore, determination of the size of the representative volume element (RVE) of the prepreg that contains the statistical distributions describing void attributes is an important information for modeling and simulation of thermoplastic composite manufacturing.
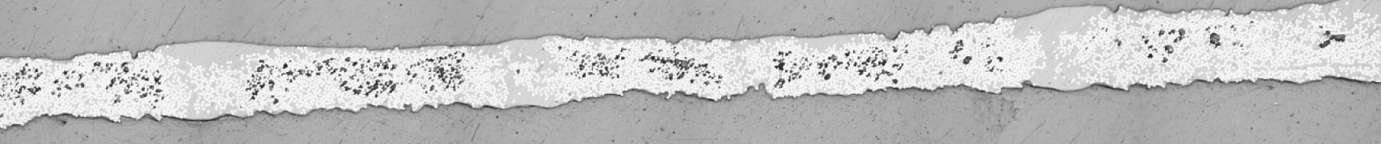
Voids (black area in the tape, Vv = 7.8%) in AS4/PEEK prepreg from Cytec, typical thermoplastic prepreg for high-performance applications; six consecutive images stitched large image of prepreg tape under ×200 magnification with sample width of 3.4 mm. PEEK: poly(ether ether ketone).
The mechanisms of void consolidation in thermoplastic composites were investigated through simulation studies considering microscopic void compression, 11 –18 coupled mechanism of stress equilibrium and gas molecule diffusion, 19,20 and resin redistribution within the prepreg to fill the voids. 10 Simplified void geometries were assumed with these models, and the inputs of void properties (content, size, and location) are required. The former two features spherical voids covered with a polymer shell where void content and void size are the major parameter input. The resin flow void filling model treats voids as a cavity in a rectangle unit cell with inputs of void content, void size, and void spacing. Parametric studies indicate that time for void reduction is sensitive to the initial void characteristics such as void sizes and location within an RVE typically defined by the average void content. These models illustrated important mechanisms for void reduction by assuming homogenous initial conditions but are not providing accurate predictions for the actual void microstructure. Due to the locally inhomogeneity of voids, a statistical-based definition of the dimensions of the statistical representative volume element (SRVE) is needed.
SRVEs of the microstructure of composite materials based on statistics of reinforcing fibers were investigated in the literature. Through quantitative characterization, microstructure modeling and finite element method (FEM)-based simulation, Shan and Gokhale determined the RVE of glass fiber ceramic composite materials, which contains fiber poor and rich region, and provide Young’s modulus and local stress distribution comparable to those in the real composites. 21 Using FEM, Grufman and Ellyin compared the transverse damage behavior with different microstructure sample size of fiber composites and determined the SRVE with Kolmogorov goodness of fit statistical test. 22 Based on the random distribution of fibers, the SRVEs of typical unidirectional carbon fiber-reinforced polymer were established by Trias et al. 23 and Zangenberg and Brøndsted, 24 and it is shown that the sizes of SRVE defined varies with different criteria and applications. Side length larger than 600 μm was found for square-shaped SRVEs, 24 and the ratio of SRVE side length and equivalent fiber radius was found to be 60 based on numerically generated SRVEs and mechanical performance of composites. 23 RVE was also investigated and applied to the study of mechanical properties and piezoelectric properties of nanocomposites. 25 –27 However, the study on SRVEs of void microstructure in composite materials and the related knowledge are lacking. Consolidation models using statistical input parameters are just now advancing to the level of detail that has been seen in mechanics.
To experimentally characterize the voids in composite materials, 2-D optical microscopy (OM) and scanning electron microscopy (SEM) are commonly used. 7,28 –32 However, the information about void shape and sizes in the third dimension (i.e. fiber axial direction) has not been thoroughly quantified. With high-resolution X-ray microcomputed tomography (μ-CT), rodlike voids were found in our previous study as seen in Figure 2, 33 indicating that a full 3-D study of voids is necessary. To examine large sample volume, thousands of cross-sectional images are needed to construct 3-D volume. With traditional OM or SEM, it is impractical to inspect the same volume of prepreg with the same precision as a single μ-CT scan. 34 Additionally, μ-CT does not involve any specimen preparation, avoiding the possible errors introduced during the polishing and sample preparation step in OM. Therefore, for statistical characterization of 3-D void microstructure in the thermoplastic prepreg, high-resolution X-ray μ-CT is the most accurate and practical inspection technique currently available.
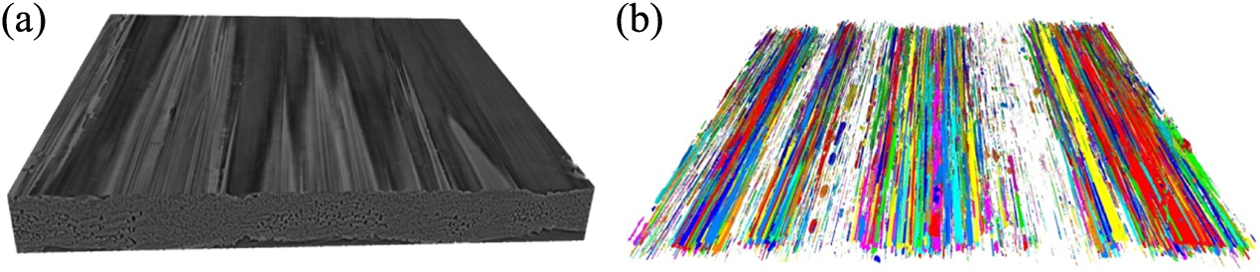
3-D Voids in an AS4/PEEK prepreg sample (2.1 × 1.8 × 0.18 mm3) from X-ray µ-CT. (a) 3-D view of prepreg sample and (b) extracted voids in the sample (colors are to separate individual voids).
In this article, the micro voids in continuous fiber AS4 carbon/PEEK thermoplastic prepreg will be thoroughly characterized through X-ray μ-CT in three dimensions. The detailed void properties such as 3-D void fraction, dimensions, number density, and aspect ratio are quantified to provide better understanding of the void microstructure in the thermoplastic prepreg material. Statistical error analysis and distribution functions are applied for void analysis, from which the sub-SRVE for each void property were determined. The overall SRVE of the void microstructure was constructed from the maximum dimensions of individual sub-SRVEs for each void property.
Experimental details
Materials
The thermoplastic prepreg material is unidirectional AS4/APC2 carbon/PEEK prepreg from Cytec with a width of 30 cm, areal weight 145 g/m2, resin weight fraction of 32%, nominal tape thickness of 0.1776 mm, nominal fiber diameter of 7 μm, and a nominal void volume content range from 5% to 10%. Samples from the central region of the prepreg tape were prepared and examined with X-ray μ-CT technique.
X-Ray μ-CT characterization
The X-Ray μ-CT system used in this study is Skyscan’s 1172 high-resolution μ-CT from Bruker (Billerica, Massachusetts, USA). The system operates at 20–100 kV/0–250 μA with a maximum power of 10 W. The maximum image size of 4000 × 2096 pixels was chosen. The detector’s field of view defines the maximum sample width (along the transverse direction) at different resolution. The resolution in the three dimensions is the same. After evaluating the effect of scanning resolution on the quantitative results of void characteristics and considering the practical scanning time, 1.48 μm/pixel was used to scan all the samples with a maximum single sample width of 4.5 mm. Detailed procedure for the determination of scanning resolution is given in the Appendix. Since the full prepreg thickness is smaller than the maximum width to be accommodated, all the prepreg samples were scanned with full thickness. From our previous study, 9.2 mm exceeds all length range of voids. 33 Therefore, a maximum sample size of 36 mm (width, across fiber direction) × 9.2 mm (length, along fiber direction) is constructed from 8 samples of 4.5 mm (width) × 9.2 mm (length) with full tape thickness. A systematic statistical treatment of this data set is used to quantify the void properties and associated sub-SRVEs having in-plane length scales smaller than the 36 × 9.2 mm2 sample. Other relevant scanning parameters are shown in Table 1. The noise of μ-CT was reduced by increasing frame averaging, maintaining good contrast by suitable voltage and current range, and reducing rotation steps. Voids area smaller than 1 pixel can be artifacts from noise and were neglected in this work. Skyscan NRecon software was used to reconstruct the X-ray raw images of a sample into a set of parallel 2-D micrographs, providing the 3-D information of the entire volume of the sample, which were processed and thresholded into binary images (illustrated in Figure 3), and then analyzed in Skyscan CTAn software for 3-D void content. The number, volume, and dimensions of voids were analyzed in Avizo Fire 7.0.
X-Ray μ-CT scanning parameters.
μ-CT: microcomputed tomography.
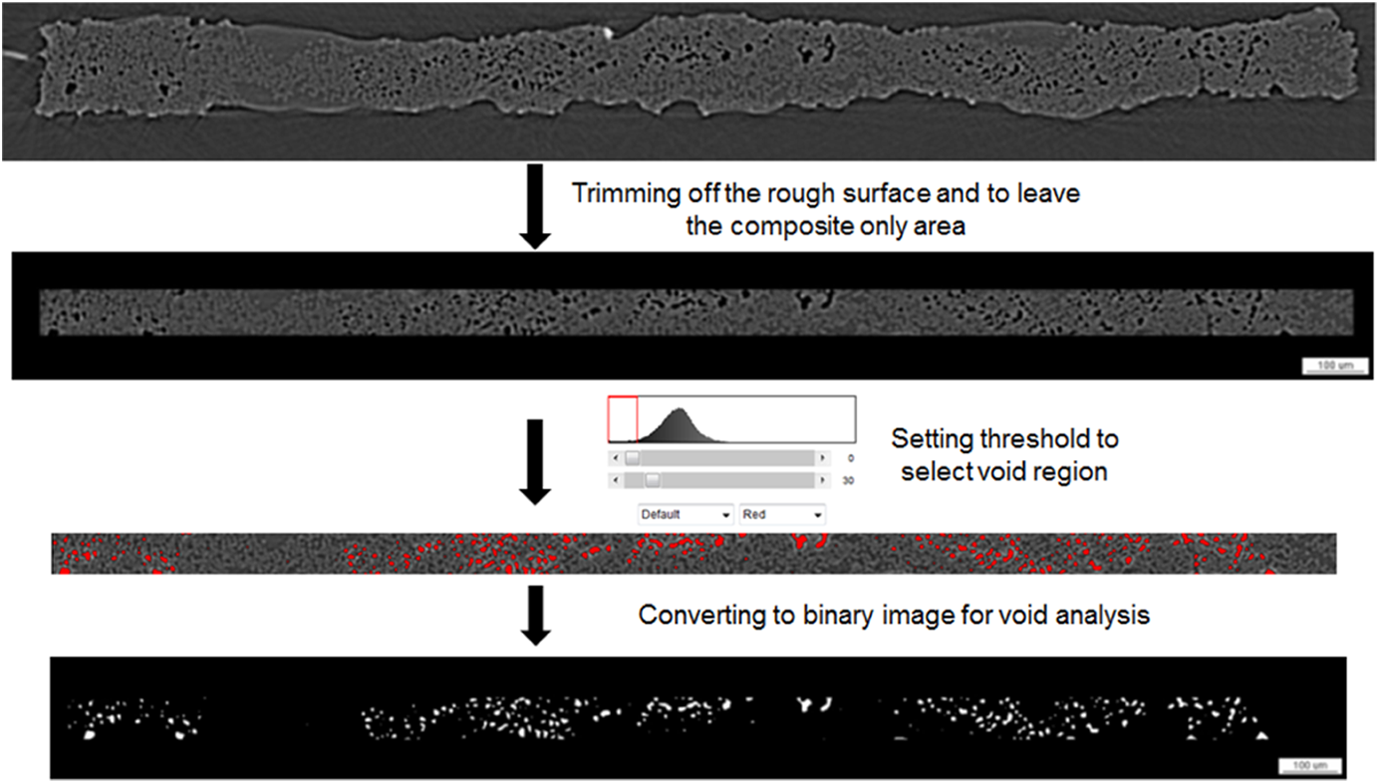
Processing of X-ray cross-sectional micrographs.
Void statistics and determination of SRVE for void microstructure
Individual voids representing local inhomogeneity are statistically distributed in a volume of thermoplastic prepreg. For each void property, that is, void content, length, diameter, and aspect ratio, there is a sub-SRVE that has the minimum volume (i.e. minimum in-plane dimensions width and length) that contain an equivalent statistical distribution of the void property as larger volume samples. Samples with smaller volumes would be statistically different and not include all of the microstructural features. The SRVE defines the length scales for modeling and simulation or experiments in which the region is considered statistically homogeneous and results would not be sensitive to sample size or location within the prepreg.
The sub-SRVE length scales for 3-D average void content is determined based on the deviation (5% is used in this study) from void content of the large samples. The sub-SRVEs of void length, diameter, and aspect ratios are based on the deviation of the normalized number distributions of voids compared to the distributions for the largest sample. Accurate statistical distribution functions (various considerations such as Weibull, lognormal, loglogistic, Gamma, normal, logistic, and exponential) are first identified to describe the distributions for each type of void attribute. The fitting parameters are obtained as a function of in-plane dimensions. The parameters exhibit significant variability at low length scales and asymptote to the parameters for the largest sample. The length scales for the sub-SVREs are defined at the onset of the plateau region.
Since the SRVE has two dimensions (all are full prepreg thickness), the minimum lengths for sub-SRVE were determined first. The minimum widths of sub-SRVEs are than determined using the SRVE lengths determined from the first step. This sequence was used for all void properties.
3-D Void Content
The errors of void content comparing to large samples are defined as:
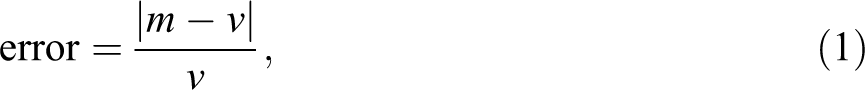
For the determination of sub-SRVE length, v is the void content of a prepreg sample with size of 4.5 × 9.2 mm2, and m is the void content of the same sample and same width and sample length ranging from 0 to 9.2 mm. For the determination of sub-SRVE width, v is the void content of the sample volume with 36 mm × sub-SRVE length, and m is the void content of sample volume of increasing width × sub-SRVE length.
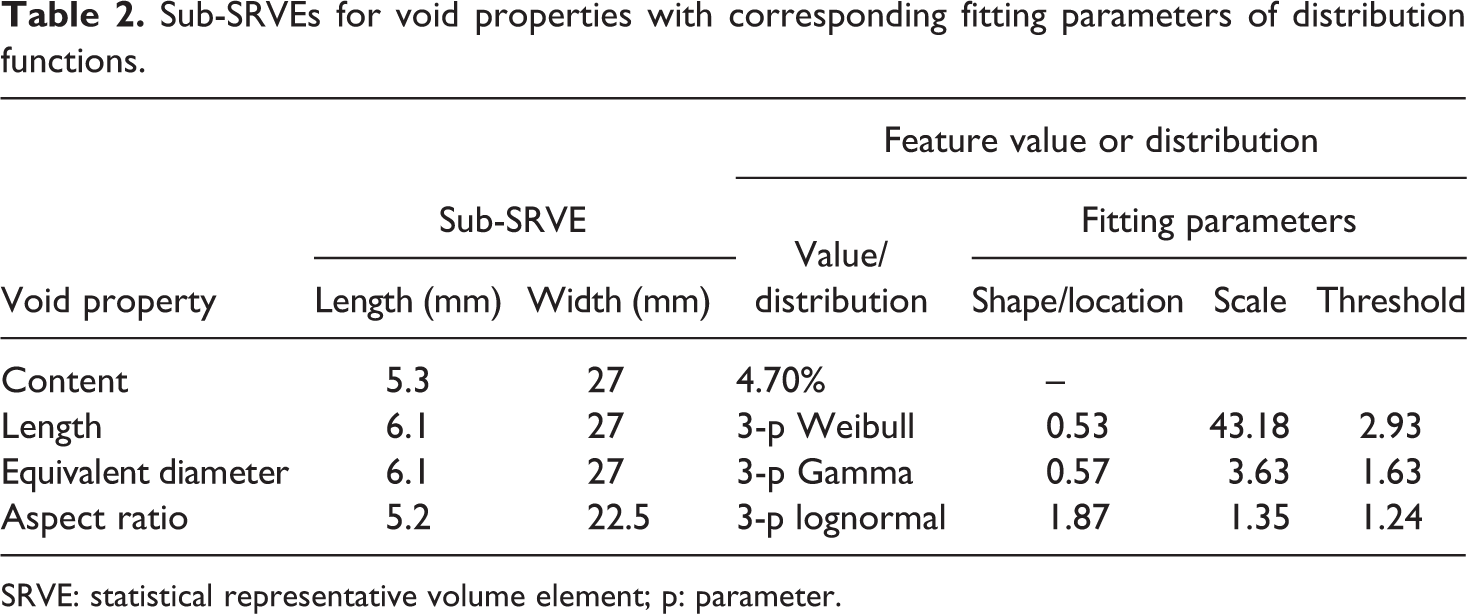
The errors along the length direction of eight samples are shown in Figure 4(a). To achieve errors smaller than 5%, all the sample need to be at least 5.3 mm which is defined as the sub-SRVE length for average of void content. It is also seen that the void content for individual samples presented in Figure 4(a) varies from 3.57% to 6.42%, indicating more inhomogeneity of voids distributed across the width direction. The error along the width direction shown in Figure 4(b) goes to 0 when tape width is 31.5 mm and is no longer sensitive to increasing tape width. The sub-SRVE width is determined to be 27 mm at the threshold level. The dimensions of this sub-SRVE are 27 × 5.3 × 0.18 mm3 with an average void content of 4.7%. The dimensions of this sub-SRVE are less than the maximum sample size inspected.
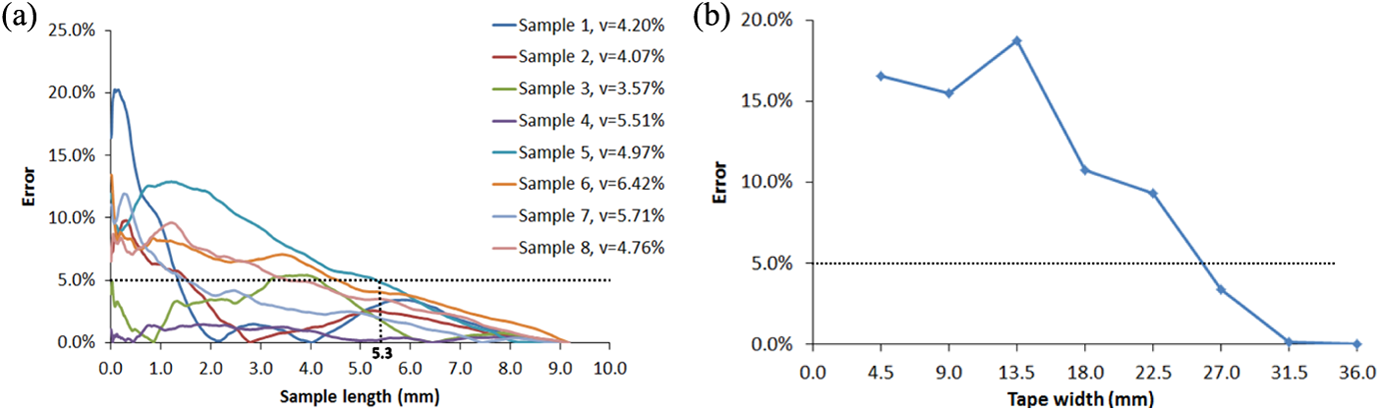
Error of void content: (a) along the tape length direction of eight samples of 4.5 × 9.2 × 0.18 mm3 and (b) along the tape width direction of sample volume of 36 × 5.3 × 0.18 mm3.
Void length in the thermoplastic prepreg tape
It is found that the best fit for normalized number distribution for voids in void length is the three-parameter Weibull distribution as seen in Figure 5 with its probability density function given as:
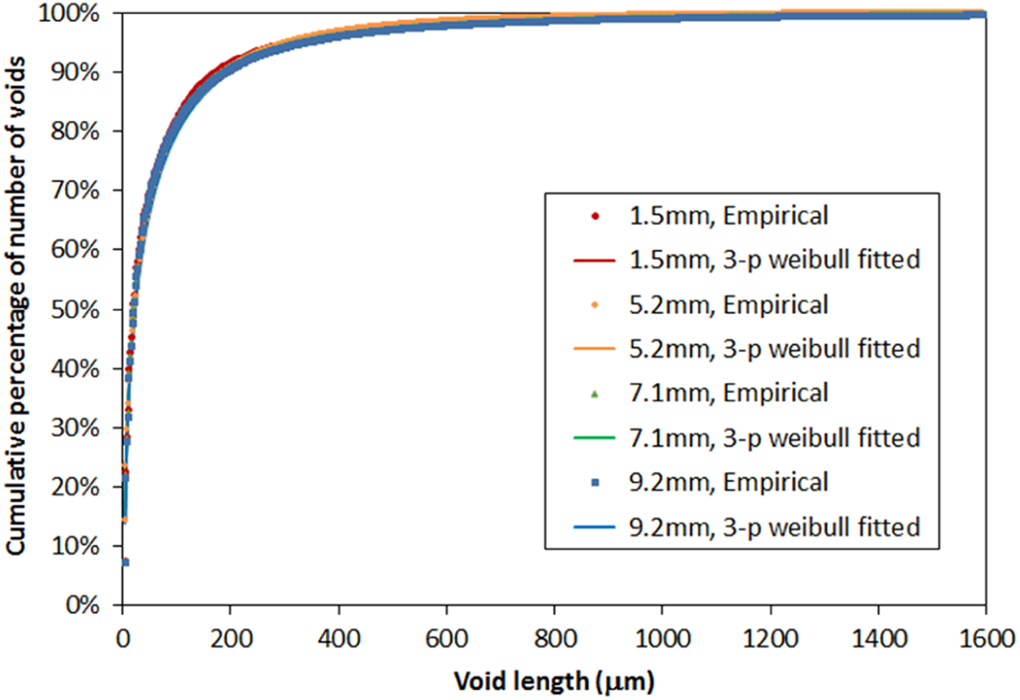
Empirical and fitted normalized cumulative distributions of voids in different void lengths in a tape sample of 4.5 mm wide with varying length.
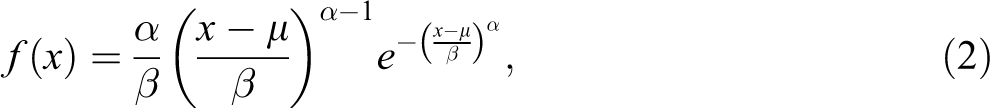
where x is void length in this case and α, β, and μ are the shape, scale, and threshold factors, respectively, the fitting parameters.
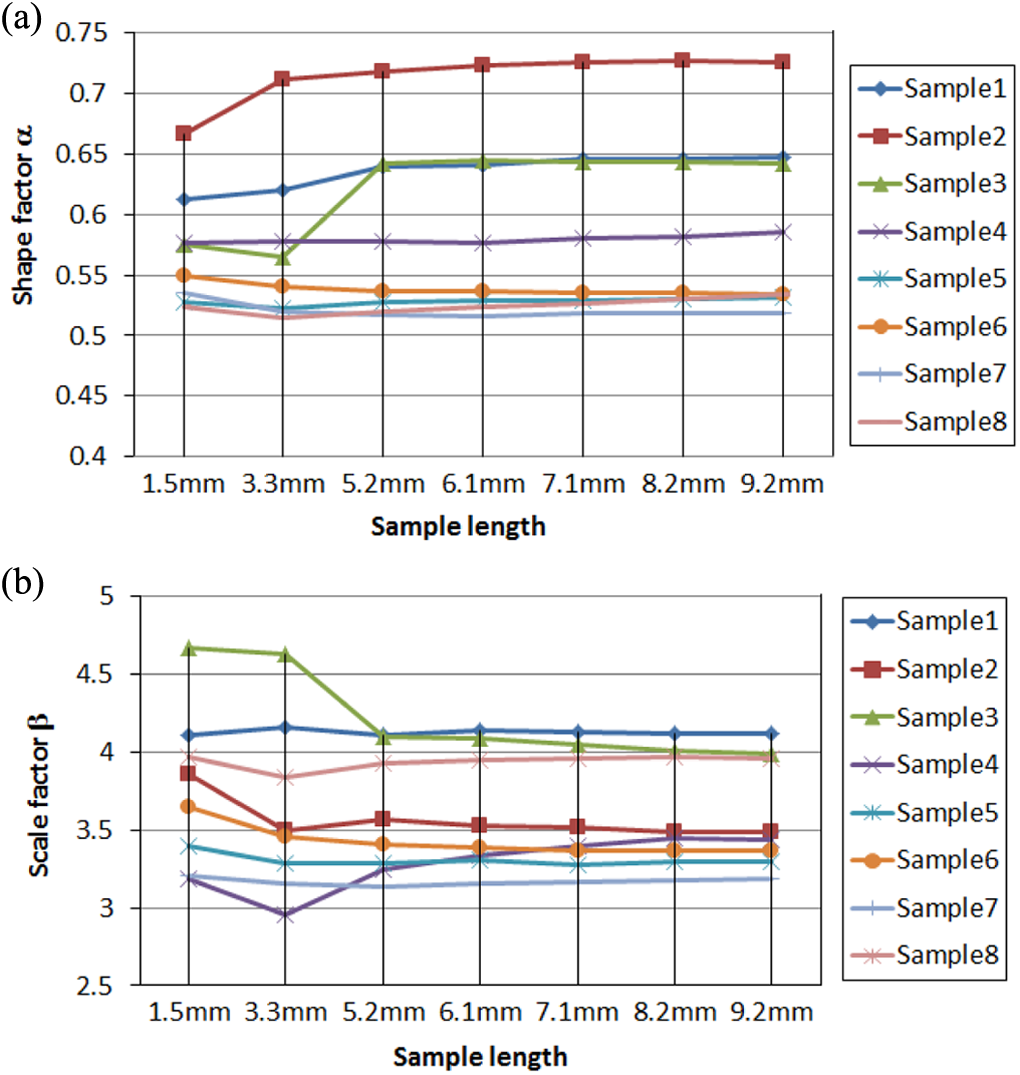
Each of the eight scanned samples was analyzed with subvolume of 4.5 mm in width and length of 1.5 mm, 3.3 mm, 5.2 mm, 6.1 mm, 7.1 mm, 8.2 mm, and 9.2 mm. The threshold factor μ for all the subvolumes is determined to be 2.93 μm. Both the shape and scale factors shown in Figure 6 are stationary when the sample length increases to 6.1 mm for all samples. With sample length of 6.1 mm, the scale and shape factor were plotted with increasing tape width in Figure 7, and plateaus as the tape width increases beyond 27 mm. Therefore, the sub-SRVE based on void length distribution was determined to be 27 mm in width and 6.1 mm in length. Figure 8 shows the normalized frequency of voids in length range from 0 mm to 9.2 mm in the sub-SRVE and total examined volume from experiment and fitted statistical distribution function. Ninety-nine percent of the voids has void length smaller than 1 mm. The sub-SRVE based on void length (27 × 6.1 × 0.18 mm3) is found to be slightly larger than that from void content (but still less than the maximum inspection volume).
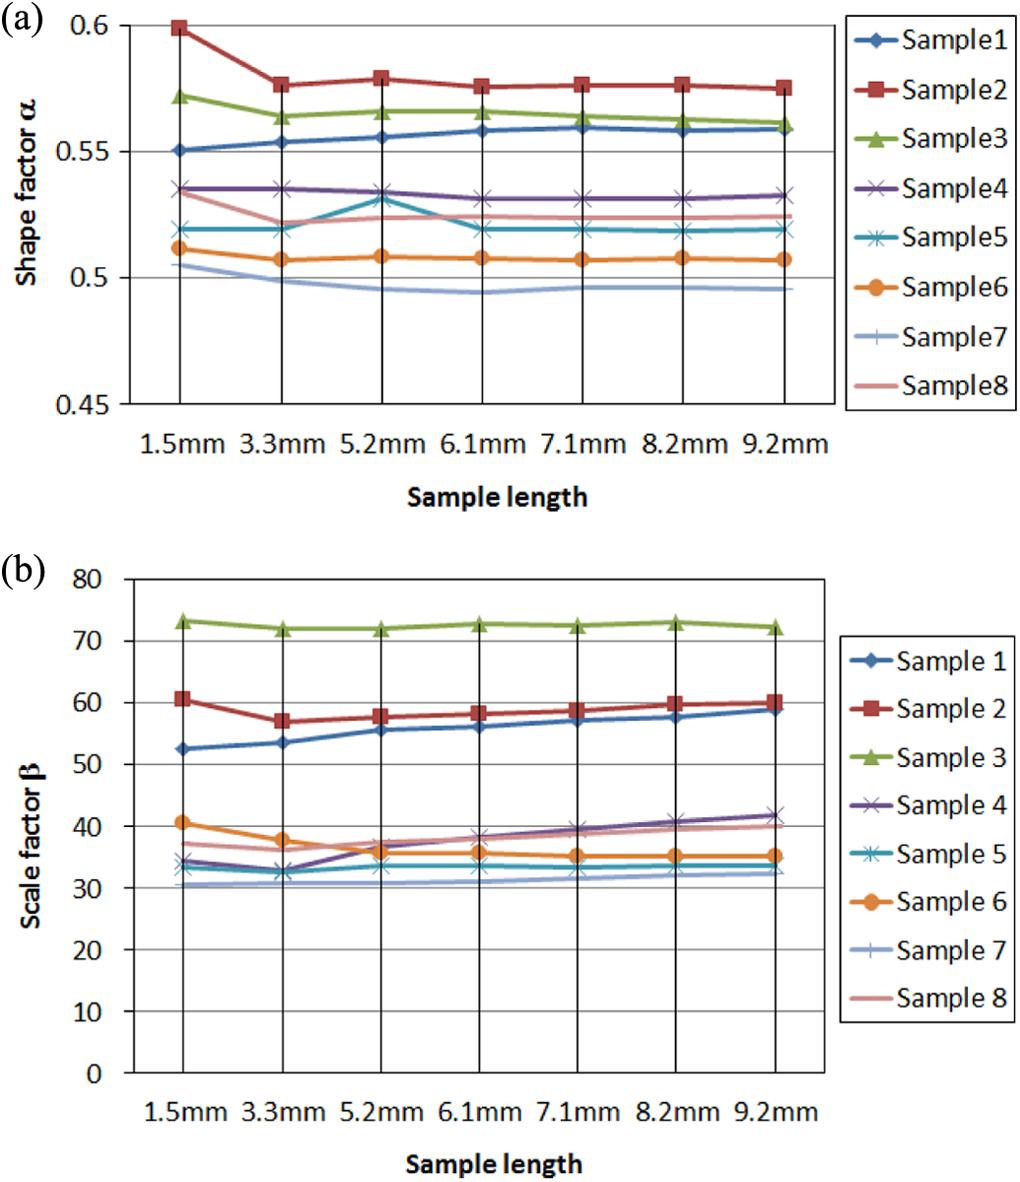
Fitting parameters of 3-parameter Weibull distribution for void length distribution along sample length direction: (a) shape factor and (b) scale factor.
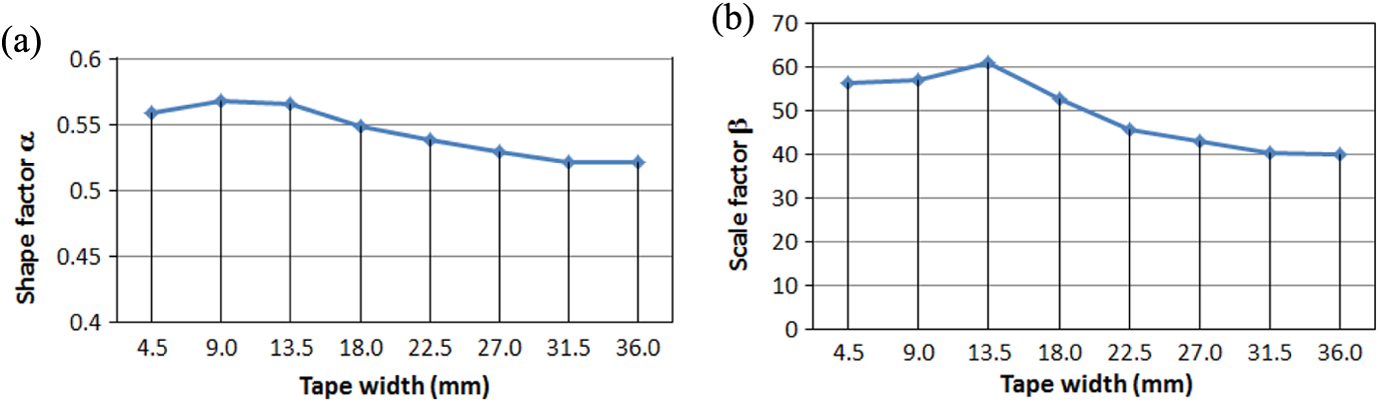
Fitting parameters of 3-parameter Weibull distribution for void length along sample width direction with sub-SRVE length of 6.1 mm: (a) shape factor and (b) scale factor.
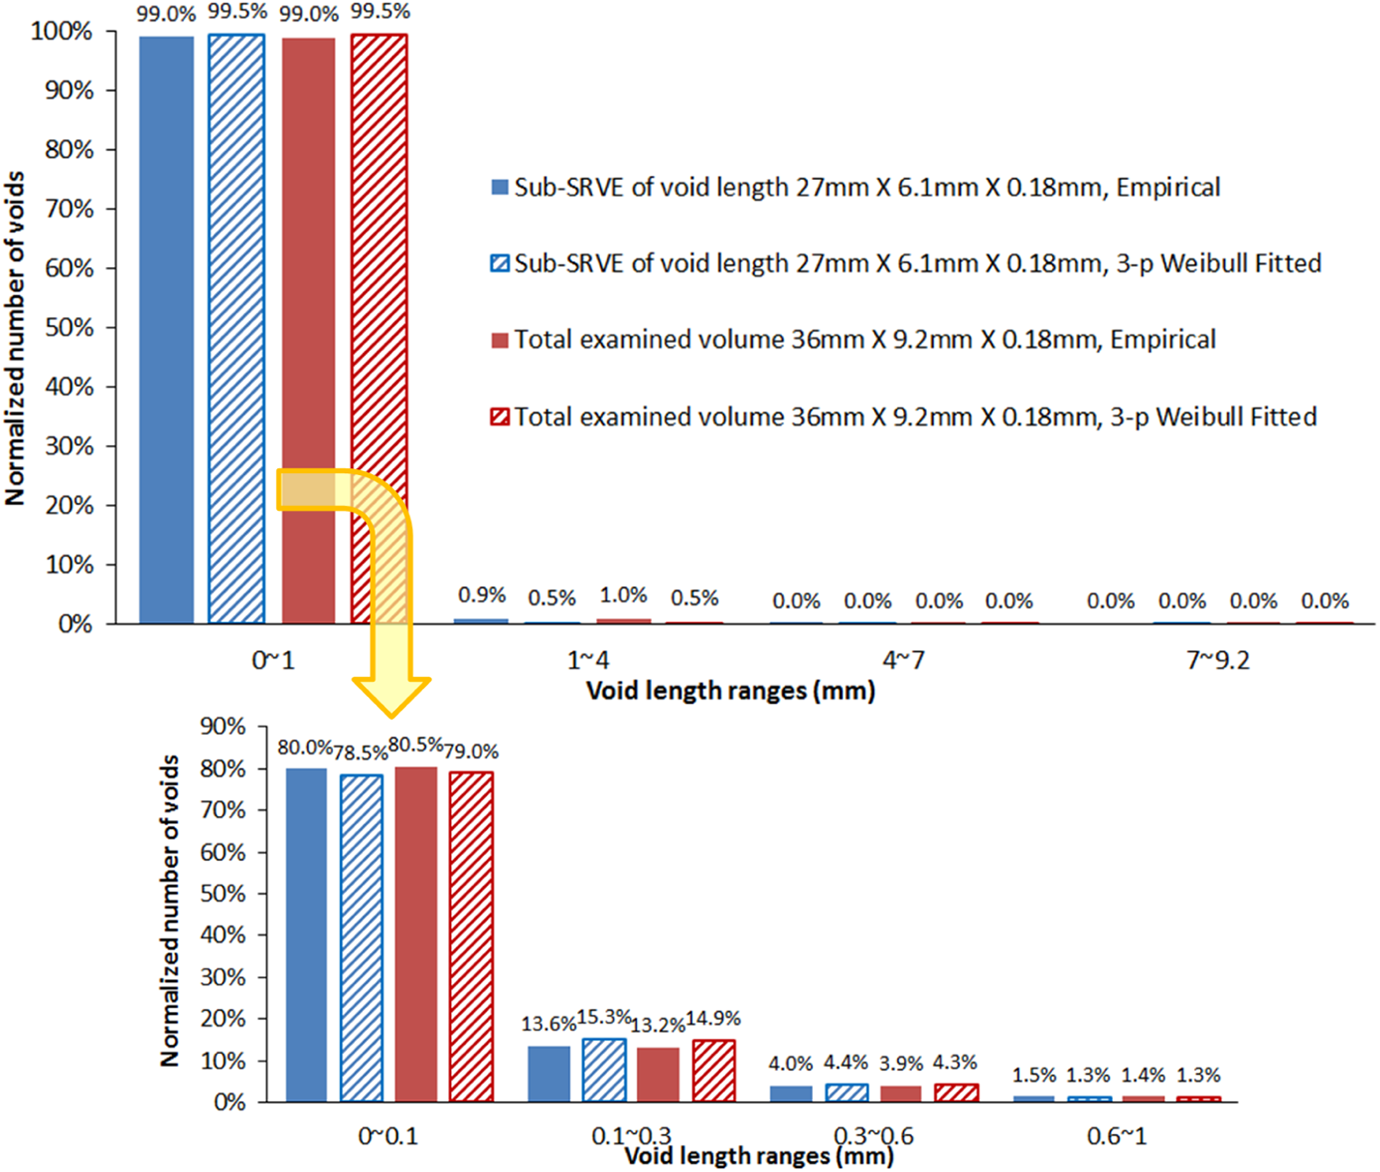
Normalized frequency distribution of void length in the sub-SRVE of void length and total examined volume. SRVE: statistical representative volume element.
Equivalent diameter of voids
3-Parameter Gamma function provides the best fit to the void equivalent diameter distribution as seen in Figure 9 with the probability density function:
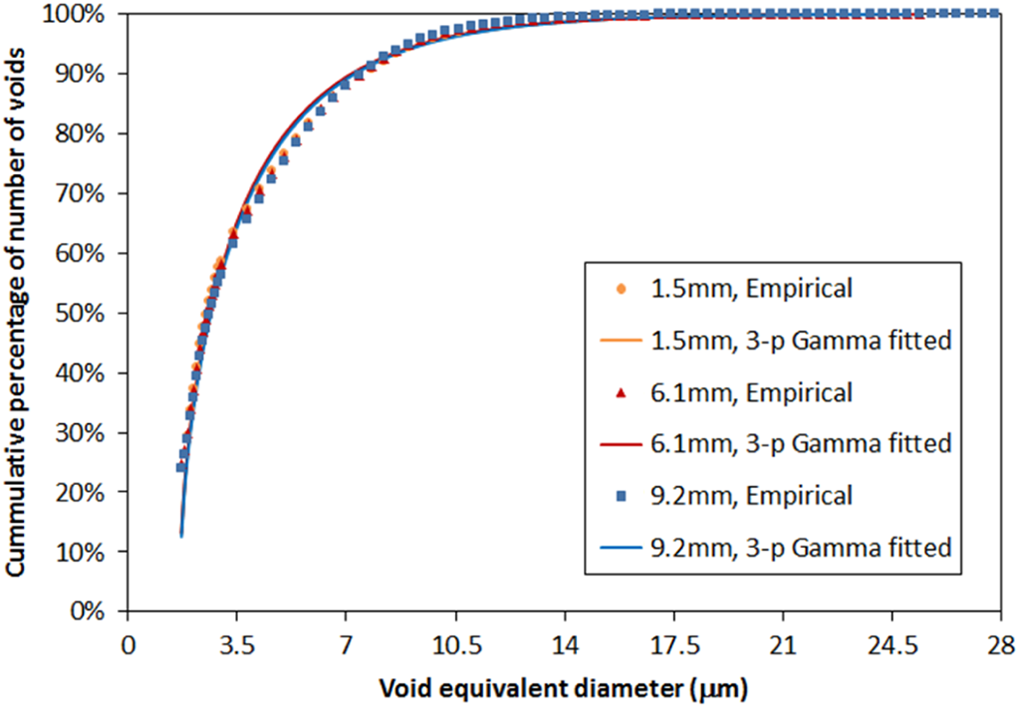
Empirical and fitted normalized cumulative distributions of voids in different void equivalent diameters in a tape sample of 4.5 mm wide with varying length.
where d is the equivalent diameter of voids and α, β, and μ are the shape, scale, threshold factors of 3-parameter Gamma distribution, respectively.
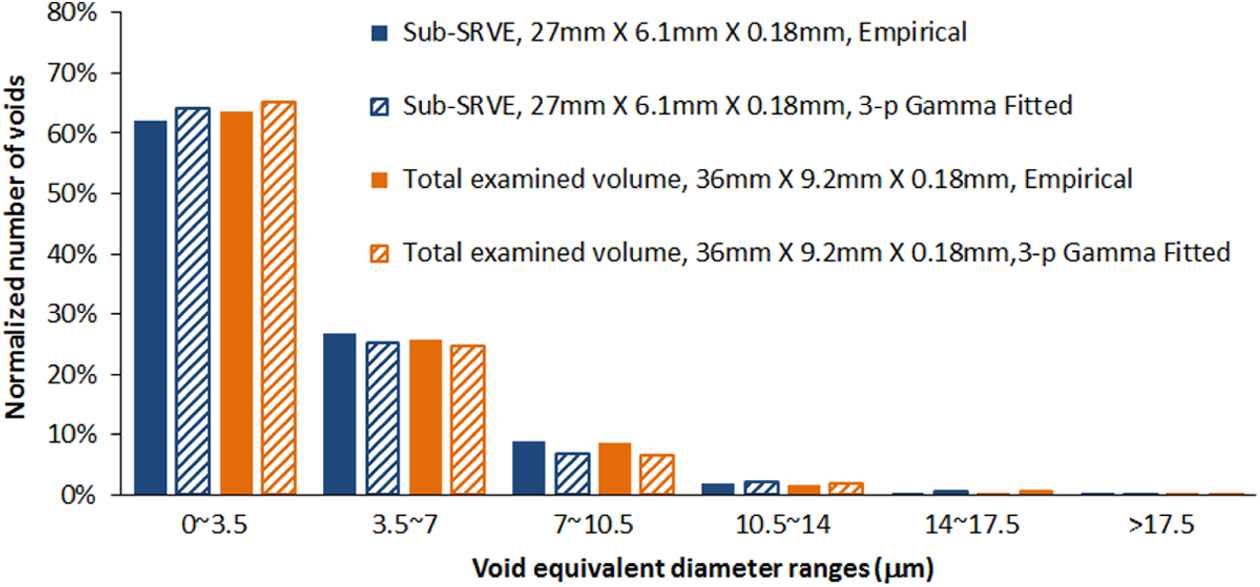
The threshold was found to be 1.63 μm for all distributions, and the other two parameters versus sample length are shown in Figure 10. The shape and scale factors are stationary when sample length is longer than 6.1 mm, which is defined as the sub-SRVE length for void diameter. The fitting parameters with increasing tape width are plotted in Figure 11 with sample length of 6.1 mm, and the SRVE width of 27 mm was determined. The normalized number of voids in different void equivalent diameter ranges of sub-SRVE in Figure 12 shows that about 90% of voids have equivalent diameter smaller than the fiber diameter (7 μm) and less than 1% are greater than 2 times of fiber diameters. The sub-SRVE based on void equivalent diameter is the same as that from void length (i.e. 27 × 6.1 × 0.18 mm3).
Fitting parameters of 3-parameter Gamma distribution for void equivalent diameter distribution along sample length direction: (a) shape factor and (b) scale factor.
Fitting parameters of 3-parameter Gamma distribution for void equivalent diameter along sample width direction with sub-SRVE length of 6.1 mm: (a) shape factor and (b) scale factor. SRVE: statistical representative volume element.
Normalized numbers of voids in equivalent diameters ranges in prepreg tape.
Void aspect ratio
After analyzing the number distribution of void aspect ratio (length divided by equivalent diameters of voids), 3-parameter lognormal distribution function was found to be the best fit with the probability density function given by:
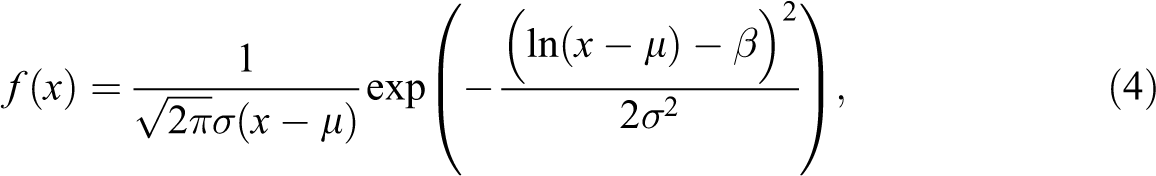
where x is the aspect ratio of voids and σ, β, and μ are the scale, location, threshold parameters, respectively.
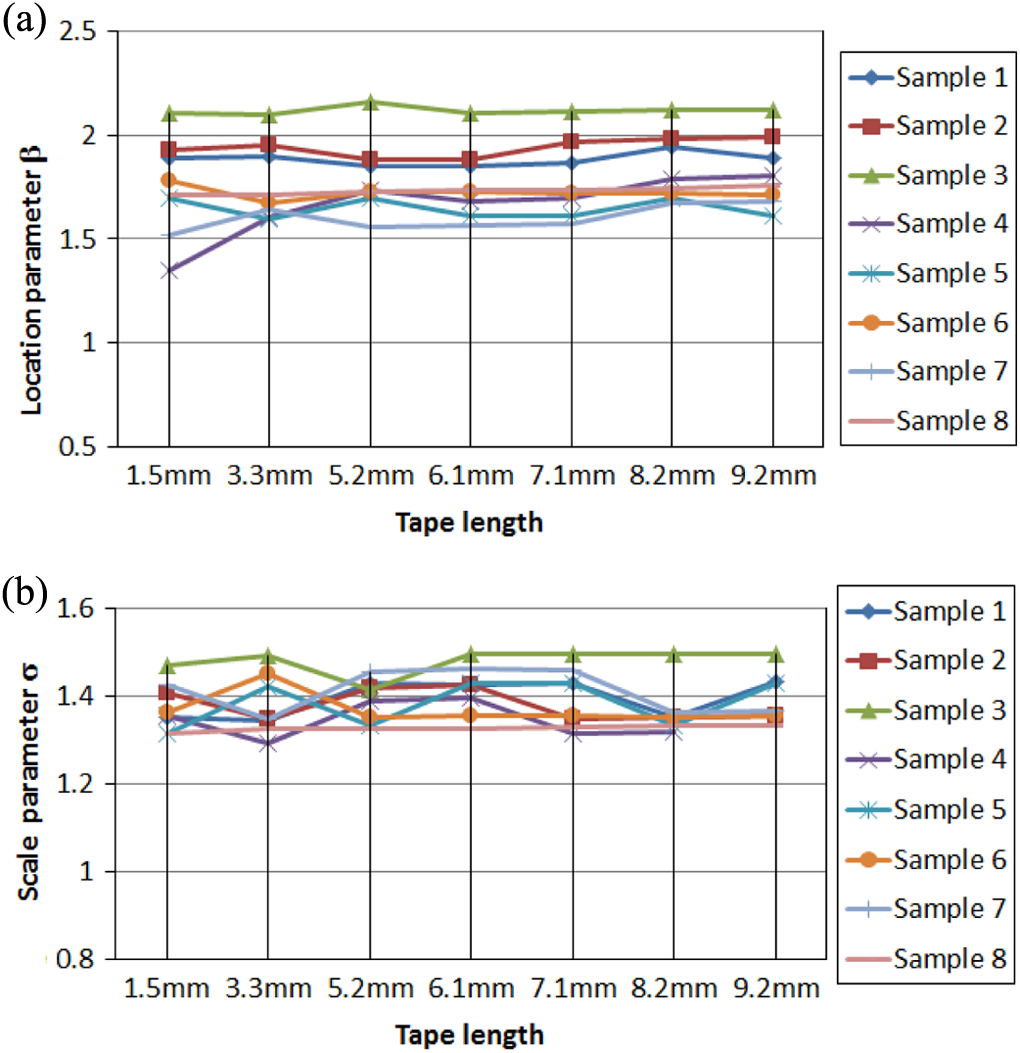
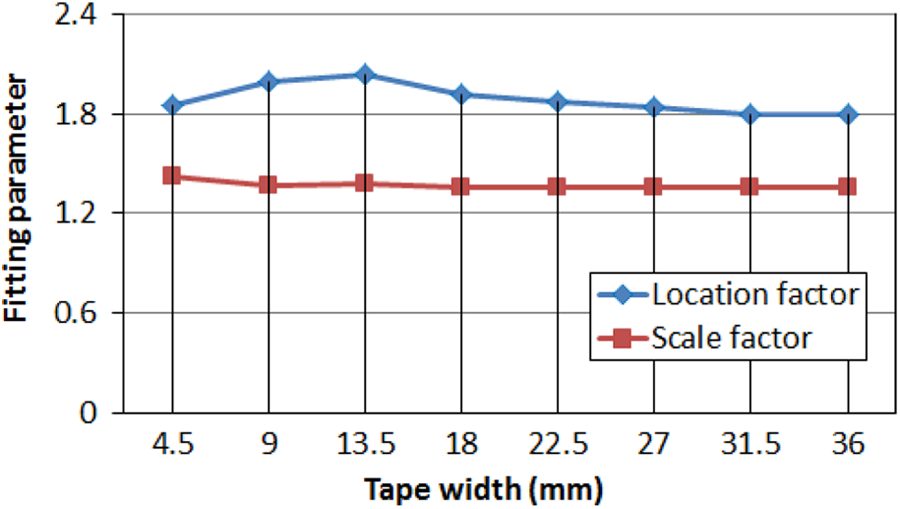
The threshold parameters were found to be 1.24; the scale and location parameters are presented in Figure 13. It is seen that the location parameter tends to be stable when sample length is larger than 5.2 mm for all samples, and the scale factors fluctuates within a very small range (< 0.1) for each sample. Therefore, the sub-SRVE length of void aspect ratio was determined to be 5.2 mm. With this sample length, the location factor and scale factor with increasing tape width are presented in Figure 14, where the sub-SRVE width of 22.5 mm was determined. The normalized frequency distribution of void aspect ratio of the sub-SRVE is shown in Figure 15. The results show that 80% of the voids have aspect ratios in the 2–50 range with approximately 4% having aspect ratios greater than 50. In addition, approximately 6.5% of the voids have an aspect ratio of 1–2, which is commonly assumed from optical 2-D images.
Fitting parameters of 3-parameter lognormal distribution for void aspect ratio distribution along sample length direction: (a) location factor and (b) scale factor.
Location and scale factors of 3-parameter lognormal distribution for void aspect ratio along sample width direction with sub-SRVE length of 5.2 mm.
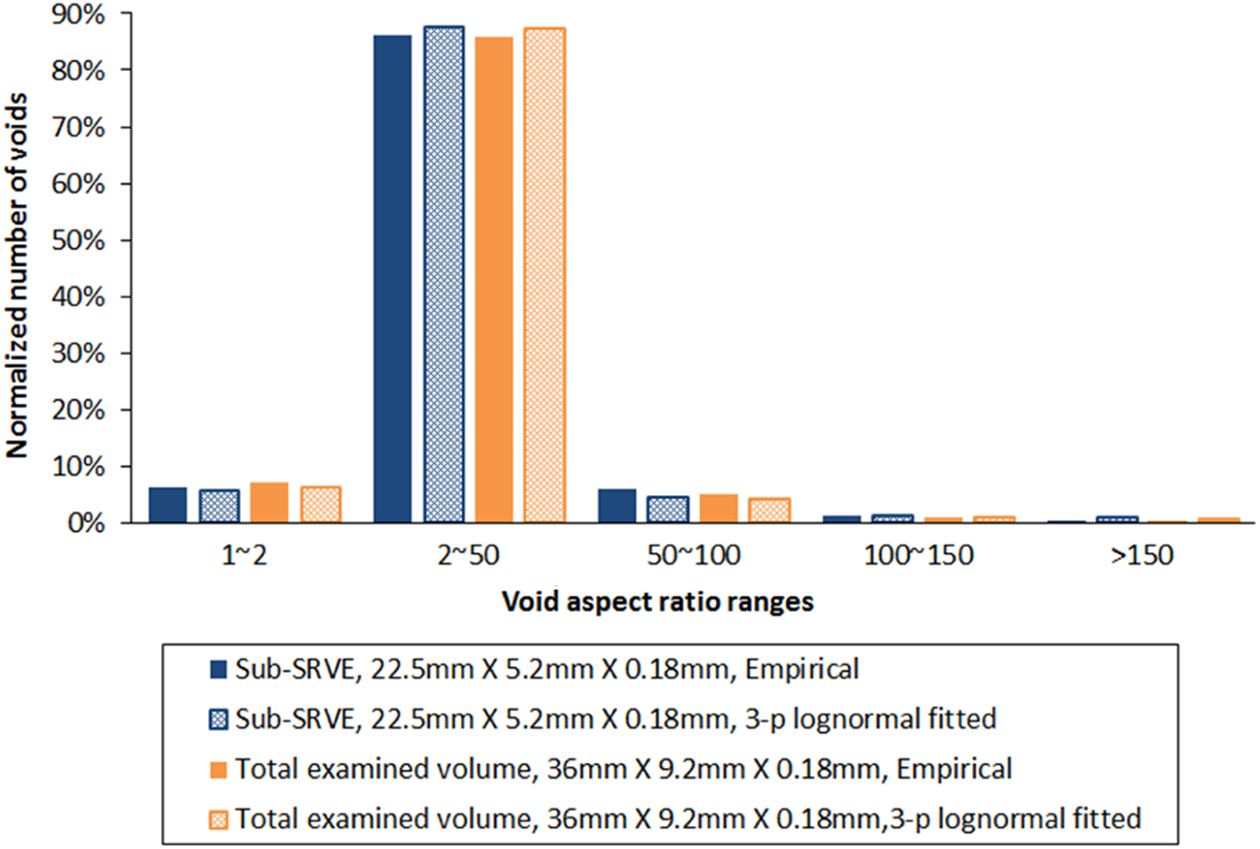
Normalized numbers of voids in aspect ratio ranges in prepreg tape.
Based on the above analysis, sub-SRVEs, and fitting parameters of distribution functions are summarized in Table 2. Taking the largest dimensions of the sub-SRVEs, the SRVE of the AS4/APC2 tape is 6.1 mm along the fiber direction and 27 mm along the transverse direction of the full thickness of the tape.
Sub-SRVEs for void properties with corresponding fitting parameters of distribution functions.
SRVE: statistical representative volume element; p: parameter.
From the statistical void study, not only the void properties but also the void features revealed provide important information for the investigation for void consolidation mechanisms. From the distribution of void aspect ratio, it is seen that only a small fraction of the voids are near spherical in shape (6.5% voids have aspect ratio smaller than 2). The majority of voids (90%) have aspect ratios between 2 and 150. In the case of large aspect ratio, gradients in the fiber direction can be ignored and 2-D simulation of void dynamics such as the resin infusion model by Simacek et al. 10 are more realistic. In this 2-D model, to obtain the 2-D void content, one should examine at least 27 mm across the fiber direction, which should be slightly higher than the 3-D void content 4.7% due to the limited length of voids along the fiber direction. Simacek et al conducted a parametric study for the void spacing and shows that larger void spacing requires longer time to reach low void content. As seen in Figure 1, voids are distributed in groups across the fiber direction. Based on the SRVE width of the AS4/APC2 prepreg tape, cross sections of more than 27 mm across the fiber direction can be examined and the average spacing between void groups can be obtained. In our study of oven vacuum bag processing (OVB) processing, the spacing of voids were determined to be 0.65 mm with which the prediction of void consolidation time compared well with experiments. 33
Conclusions
Statistical studies were conducted to obtain representative void properties including void content, geometry, and dimensions in AS4/APC2 thermoplastic prepreg material. High-resolution 3-D X-ray μ-CT was employed to inspect voids in a large volume of tape in practical time frame. Representative void properties were obtained with associated sub-SRVEs. Suitable statistical distribution functions were found to describe the void length, equivalent diameter, and aspect ratio distributions. The majority of voids are rodlike with aspect ratio from 2 to 150, and the use of spherical void model for void dynamics is not appropriate to the voids in this prepreg tape. The SRVE of AS4/APC2 tape is 6.1 mm in length, 27 mm in width, and 0.18 mm full prepreg thickness.
The 3-D study of the micro voids does not only provide those statistical void property data for future comparison and model work it also reveals important features of voids to guide the future investigation of void consolidation. The conclusions of the micro void properties may not be applied to other thermoplastic prepreg tape. However, the methodology for analyzing voids and relating the results to the void dynamics during the processing can be widely adopted.
Footnotes
Acknowledgments
The authors would like to thank European Aeronautic Defence and Space Company (EADS) Chief Technology Officer North America and especially Marc Fraser for funding this research. Our thanks also go to Patrice Lefebure, from EADS innovation works, France, who allowed this collaboration.
Declaration of Conflicting Interests
The author(s) declared no potential conflicts of interest with respect to the research, authorship, and/or publication of this article.
Funding
The author(s) received no financial support for the research, authorship, and/or publication of this article.