
Abstract
In this study, microstructural features and physical properties of thermoplastic polyurethane (TPU)/organoclay nanocomposites films prepared via melt blending (MB) and solution mixing (SM) methods were investigated in detail. Amount of organoclay into the composition varied in the range of 2 and 8 wt%. Microstructural properties of samples were characterized by X-ray diffraction, scanning electron microscopy (SEM), and transmission electron microscopy (TEM) methods. It was found that the organoclay layers exhibited better dispersion, exfoliated, and semi-exfoliated structure in the MB samples than the SM counterparts. Viscoelastic properties of samples were also studied by measuring the rheological behaviors of bulk samples in an oscillatory rheometer in the melt state and measuring of the time-dependent nonlinear creep behaviors of film samples in a dynamic mechanical analyzer in the solid state. Gas and water vapor permeability (WVP) values of nanocomposite films were measured. Based on the melt rheology measurements, it was found that the MB samples showed characteristic solid-like behavior and higher improvement in storage modulus at low-frequency region. Creep behaviors of samples were also quantified with the four-element Burger model. It was found that the introducing of organoclay into the composition via MB method yielded more improvement in the creep resistance, gas, and WVP values of films than the SM counterparts, possibly due to the better dispersion of organoclay layers into the TPU structure. Based on the improvement in permeability and mechanical properties of the samples and also SEM and TEM observations, the average aspect ratio value (A f) of organoclay stacks was estimated in the range of 15–20 for the MB samples.
Introduction
Reinforcing of polymers by introducing of organic or inorganic nanofillers has been attracted considerable attention in a last few decades since the relatively low amount of nanosize fillers can effectively enhance the thermal, mechanical, and barrier properties of composites by using of relatively lower nanofiller amounts compared to polymer composites including conventional macro-size fillers. Natural or organically modified clay (organoclay) is one of the most abundant and widely used nanofillers to prepare polymer nanocomposites showing superior physical properties. Physical properties of polymer/clay nanocomposites (PCNs) depend on several compositional parameters such as amount of filler, structural features of components, dispersion quality of clay layers into the polymer structure and orientation issues, interfacial interactions, and so on. 1 –6 It is generally accepted that the better dispersion of clay layers yields more enhancement in the physical properties of PCNs. 7
Clay or organoclay filled polymer nanocomposites can be prepared by in situ polymerization, melt processing (or blending, MB) and solution mixing (SM) methods. The MB is the most widely used and convenient method to prepare thermoplastic nanocomposites compared to other methods because it is simple, industrially favorable, low cost, and environmentally friendly. It is also known that the processing method strongly affects the distribution and dispersion of clay layers, interfacial interactions, and resulting structural and physical properties of PCNs. 8 –12 Müller et al. investigated the effects of preparation method on the structure and mechanical properties of thermoplastic starch/Na+-montmorillonite nanocomposite films prepared by SM and MB methods. 13 They reported that the introducing of relatively higher amounts of clay (above 10 wt%) yielded aggregated structure in the melt-processed samples. Berti et al. compared the dispersion of clay layers into poly(butylene terephtlate) structure prepared by in situ ring-opening polymerization and melt-processing methods. 14 They found that the in situ polymerization lead to higher degree of dispersion and resulted in better thermomechanical properties. In another study, Furlan et al. studied on the effects of melt-processing conditions on the mechanical, thermal, and morphological properties of polypropylene (PP)/montmorillonite nanocomposites at clay content of 5 wt% by using of different screw configurations consisting of low, medium, and high shear intensity. 15 They reported that the higher property enhancement was obtained by the medium shear intensity screw profile. Numerous attempts such as chemical modification of clay surfaces, using various types of additives and compatibilizers with different functional groups to improve the interfacial interactions between polymer matrix and fillers, applying different processing routes, reactive blending, or extrusion, using supercritical conditions, and so on, have also been extensively studied to obtain exfoliated PCN structures. 16 –21
Thermoplastic polyurethane (TPU) is one of the most versatile elastomers, consisting of alternatingly arranged hard and soft segments and exhibiting different physical properties depending on the its segmental structure. Some studies have been reported on the preparation and characterization of physical properties of TPU/organoclay nanocomposites. 22 –26 In recent years, many of TPU/clay nanocomposites works have focused on the subjects related to the formation of foam structures and surface coating films which exhibit enhanced thermal stability and flame retardant properties, and/or utilization of bio-based raw materials. 27 –34 Meng et al. prepared TPU/octadecyl ammonium chloride modified montmorillonite (OMMT-C18) nanocomposites by using maleic anhydride-grafted polypropylene (MAPP) as pre-intercalation agent. 35 In the first step, MAPP was blended with the OMMT-C18 at different ratios in in the melt state. Then, this mixture was melt mixed with the TPU. They suggested that the pre-intercalation of lower molecular weight MAPP into clay layers was an effective processing strategy for exfoliation of clay layers into the TPU matrix.
In this study, TPU/organoclay nanocomposite films including various amount of organoclay were prepared by MB and SM methods. Effects of preparing methods on the morphological and physical properties of nanocomposite films were quantified, in detail.
Experimental
Materials
TPU used in the study was a polyester-based polyurethane (Desmopan® 3380A, shore hardness: 80A, d: 1.16 g cm−3) kindly donated by Bayer (Turkey). The clay was a commercial organoclay (Cloisite® 30B) supplied from the Southern Clay (USA). The Cloisite 30B is a methyl, tallow, bis-2-hydroxyethyl, quaternary ammonium (MT2EtOH) salt modified montmorillonite. Organic content of the Cloisite 30B was declared as 30% by the manufacturer. The TPU and organoclay were dried at 80°C in a vacuum oven overnight before processing. An analytical grade tetrahydrofuran (THF; Sigma-Aldrich, St Louis, Missouri, USA) was also used as solvent.
Sample preparation
The TPU/organoclay nanocomposites were prepared by MB and solution casting methods. Sample compositions are given in Table 1. MB was carried out in a lab-scale corotating twin screw extruder (Rondol Micro Lab., UK; D: 10 mm, L/D: 20) with a screw speed of 50 r min−1. Extruder screws were configured with the segments including 3-D of 4 × 60° followed by 2-D of 4 × 90° kneading units. A temperature profile of 110–150–160–175–175°C was applied throughout the barrel from the feeding zone to die. A slit die and cast film haul-off unit were used to prepare film samples for the subsequent microstructural analysis and physical tests. The TPU was also processed under the same conditions.
Sample compositions and intergallery distances between organoclay layers.
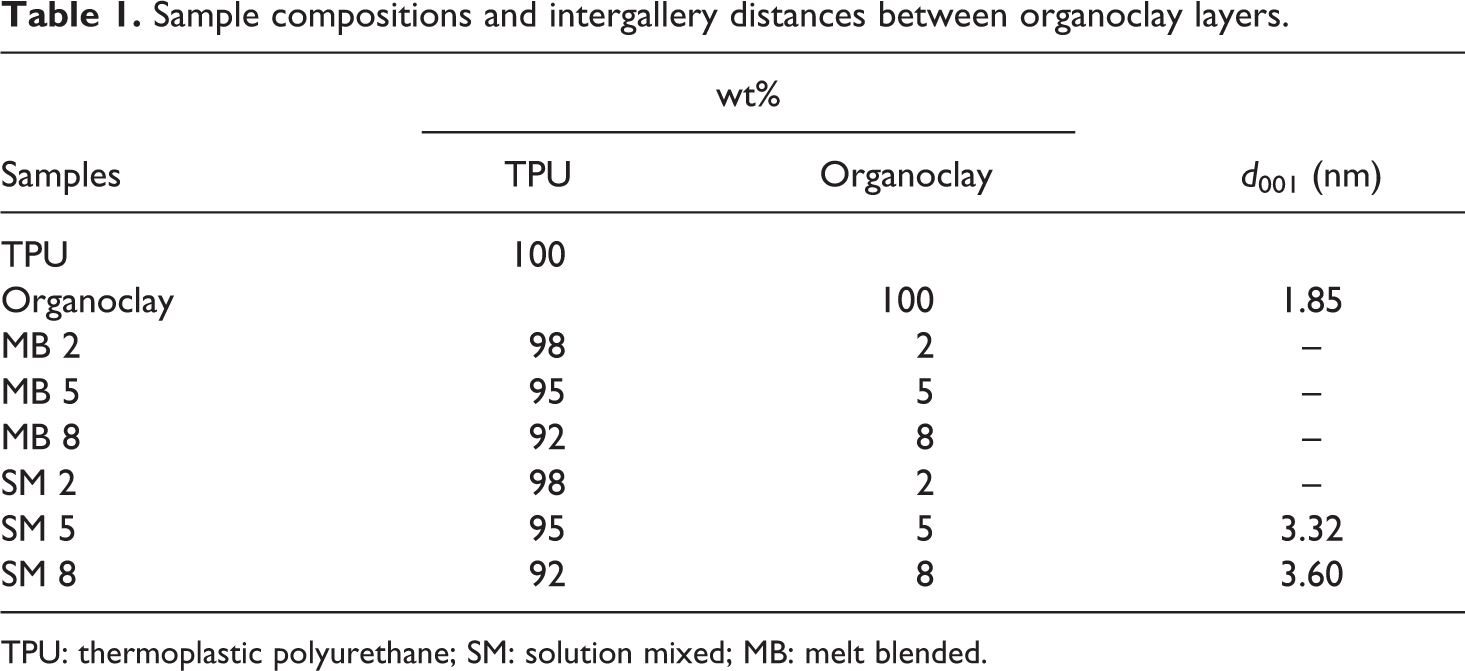
TPU: thermoplastic polyurethane; SM: solution mixed; MB: melt blended.
In SM process, a 10 wt% of TPU solution was first prepared in THF. Then the proper amount of organoclay, suspended in the same solvent under the sonication for 15 min, was added into the TPU solution and stirred with a magnetic stirrer for 30 min. This mixture was also sonicated for 30 min then casted onto Teflon® petri dishes. The TPU/organoclay mixture was dried to constant weight and subsequently under vacuum at 50°C for 24 h to ensure for removing of solvent.
Characterization of sample microstructure by XRD, SEM, and TEM analysis
X-ray diffraction (XRD) analysis of the film samples were performed with a Rigaku D/Max-2200/PC model (Japan) wide angle x-ray diffractometer with a copper K α, running at 40 kV and 40 mA, scanning from 2° to 35° with the step of 0.1° at room temperature. Intergallery distance between clay layers in nanocomposites was calculated by the Bragg’s equation:

where d is the intergallery distance between the layers of clay, λ is the wavelength of X-ray (0.154 nm), and θ is the diffraction angle.
Morphological features of nanocomposite films were investigated by a field emission scanning electron microscope (model Quanta 450 FEG, FEI Co., USA) operated at 20 kV. Cryofractured surfaces of the samples were directly imaged in the microscope after a proper sample preparation of sputter-coated with gold.
Microstructural properties of the samples were also studied with a transmission electron microscope (model Tecnai G2 Sphera, FEI Co., USA). Ultrathin test specimens (thickness about 150 nm) were prepared by cryoultramicrotomy method using liquid nitrogen and diamond knife. Test specimens were placed onto a TEM grid then dried and imaged in the instrument.
Rheological measurements
Viscoelastic behaviors of the TPU and nanocomposite samples were analyzed by a dynamic oscillatory rheometer in the melt state. A controlled stress rheometer (AR-G2; TA Instruments, New Castle, Delaware, USA) equipped with 25-mm diameter parallel plate geometry was employed for the rheology tests. Melt rheology tests were performed at 170°C with a gap distance of 1 mm under inert atmosphere by employing nitrogen gas. First, strain sweep test was carried out in the strain range of 0.1–50% with the angular frequency of 1 rad s−1 to detect the linear viscoelastic limits of samples. The storage (G′) and loss modulus (G″) values of samples were monitored as a function of shear strain (γ%). In frequency sweep test, a small amplitude oscillatory shear was applied to the samples and the G′ and G″ were measured as a function of angular frequency (ω) in the frequency range of 0.1–100 rad s−1 at a strain value in the linear viscoelastic region (strain magnitude of 1%).
Dynamic mechanical analysis
Short-term creep behaviors of samples were tested in a dynamic mechanical analyzer (DMA ExStar 6100, SII Nanotechnology, Japan). The dynamic mechanical analysis (DMA) tests were performed in uniaxial tension mode at 25°C with the frequency of 1.0 Hz. The creep and recoverable strains (∊) were recorded as a function of time. A constant stress (2 MPa) was applied to the samples for 60 min then the creep recovery was followed for 60 min after removing the stress. Nonlinear, time-dependent creep behaviors of samples were modeled with the four-element Burger model. Creep curves of the samples were converted to stress–strain (SS) curves and the elastic modulus (E) of test specimens which is analogous to the Young’s modulus in conventional tensile test was determined.
Permeability measurements
Gas permeability tests of samples were performed according to the ASTM D 1434-82 standard, 36 by using the manometric method with a permeability testing apparatus (model GDP-C, Brugger Feinmechanik GmbH, Germany) at 25°C. Oxygen (O2), nitrogen (N2), and carbon dioxide (CO2) gases used in gas permeation measurements. Film thicknesses, measured with a digital micrometer, was about 100–120 μm and the deviation was less than 5% in each test specimen. For each composition, three different films were tested and the average p values were reported.
The water vapor transmission rate of the samples was carried out in a water vapor transmission rate tester (Labthink Perme W3/30, China) under the conditions of 90% relative humidity and 38°C, according to the ASTM E96-95 standard. 37 Thickness deviation of the test specimens was within the range of 5%.
Results and discussion
Sample microstructure by XRD, SEM, and TEM analysis
The XRD patterns of MB and SM TPU/organoclay nanocomposite samples were given in Figure 1(a) and (b), respectively. Characteristic diffraction peak of d 001 plane of organoclay (Cloisite 30B) was found to be 2θ = 4.77° which corresponds to intergallery distance between the organoclay layers 1.85 nm as reported in the producer data sheet. In Figure 1(a), it is seen that the diffraction peak belongs to the d 001 plane of organoclay was almost disappeared or shifted to undetectable diffraction angles below the 2θ = 2° for the MB samples including various amount of organoclay into the composition. Similarly, no diffraction peak was observed for the SM-2 sample. On the other hand, the diffraction peak of d 001 plane of organoclay was clearly seen in the XRD patterns of SM-5 and SM-8 samples. But, it is seen that the peak position was significantly shifted to lower diffraction angles for the SM-5 and SM-8 samples which indicated the formation of intercalated nanocomposite structure. Basal spacing of organoclay layers were determined to be 3.32 (2θ = 2.66°) and 3.60 nm (2θ = 2.45°) for the SM-5 and SM-8 samples, respectively. Based on the XRD result, it could be suggested that the TPU chains can easily diffuse to intergallery spaces of organoclay layers by the MB method without a compatibilizer. This could be attributed to contributions of interactions between the hydroxyl (–OH) groups of intercalant molecule of Cloisite 30B and polar segments of polyurethane and the effect of intensive shear forces on the organoclay particles to provide peeling apart of clay stacks during melt processing. But, the SM method yielded less sufficient dispersion for the clay layers at specifically relatively higher organoclay contents possibly due to short mixing time and re-agglomeration of particles during solvent evaporation as previously reported. 38
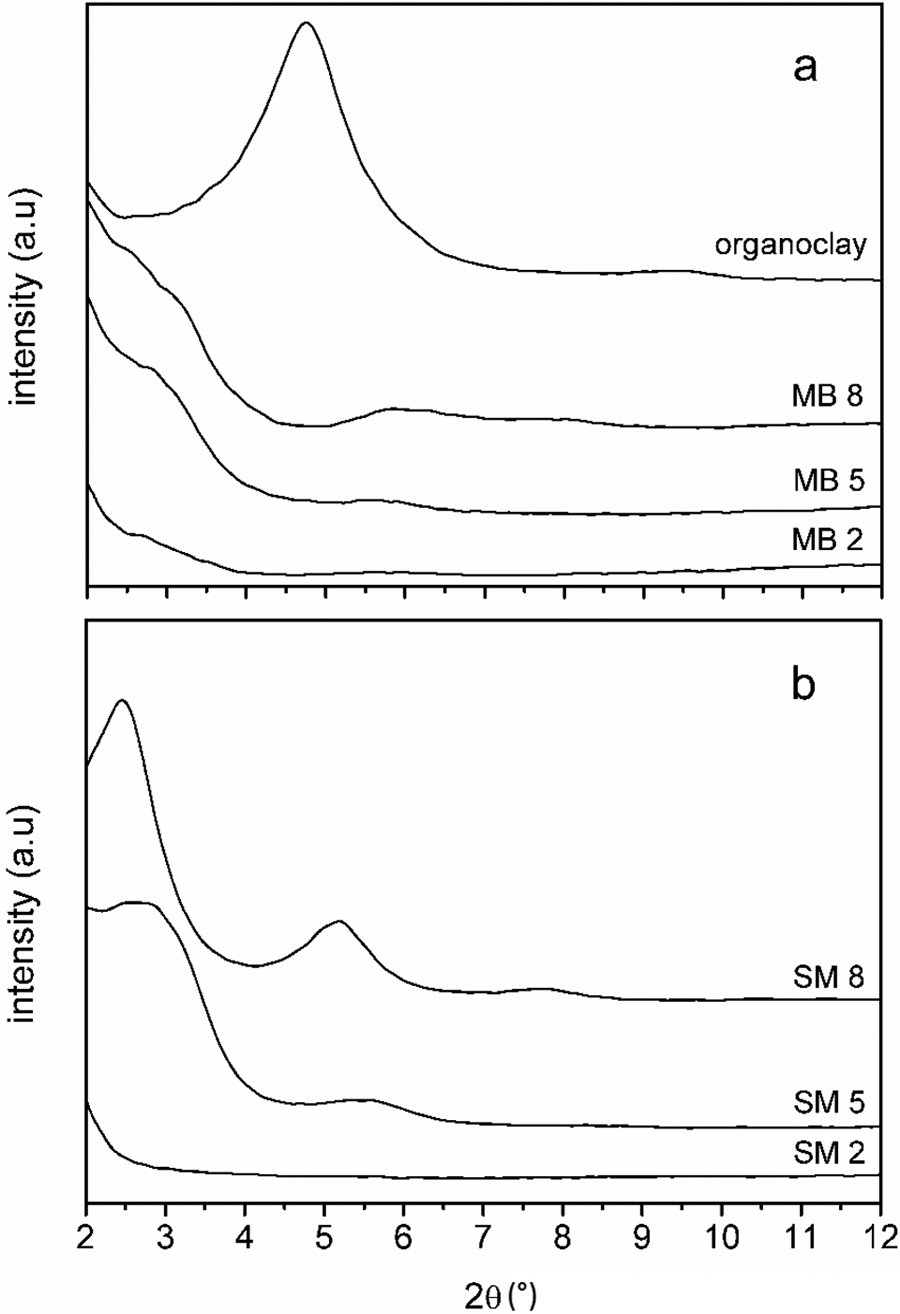
XRD patterns of the (a) MB and (b) SM samples.
Figure 2(a) and (b) shows the scanning electron microscopic (SEM) images of cryofractured cross sections of MB-8 and SM-8 films, respectively. Sharp edges of organoclay stacks, uniformly dispersed and embedded into the polymer matrix, are clearly seen in these figures. Lateral sizes of stacks were found to be less than 1 μm. Although no diffraction peak was observed for the MB-8 sample in XRD analysis, it could be suggested that the MB-8 might exhibit both intercalated and partially exfoliated structures by considering the SEM images of sample. Furthermore, no big holes or voids were observed in the fractured cross-section of samples which implied the presence of fairly strong interfacial interaction between the organoclay stacks and TPU.
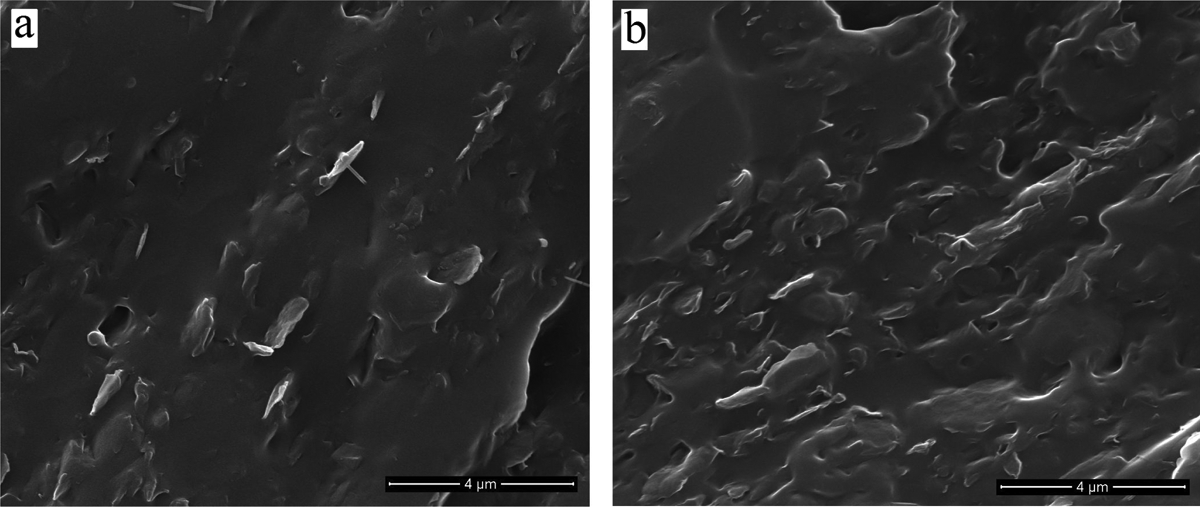
SEM images of the (a) MB-8 and (b) SM-8 samples.
Figure 3(a) and (b) shows the TEM images of MB-8 and SM-8 samples, respectively. As seen in Figure 3(a), the MB-8 sample consists of both well-dispersed and partially exfoliated clay layers and some few-layer stacks. On the other hand, the SM-8 sample exhibits some large and possibly intercalated tactoids. Microstructural observations based on the TEM images of samples are very consistent with the results obtained from the XRD analysis and SEM study.
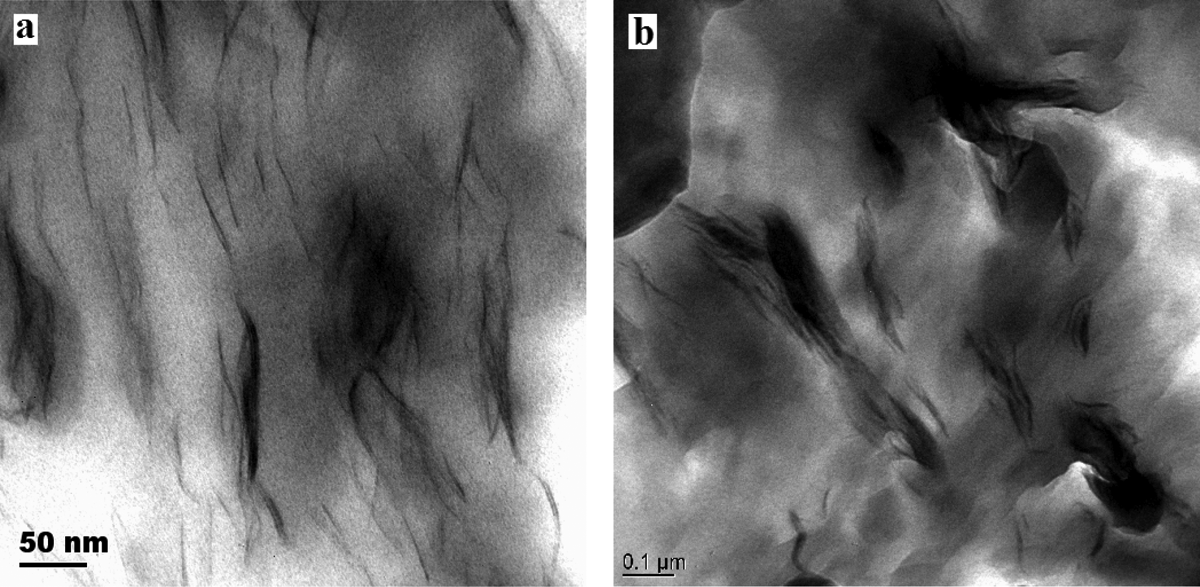
TEM images of the (a) MB-8 and (b) SM-8 samples.
Rheological behavior of samples
Characterization of rheological behavior and viscoelastic properties of polymer composites and blends in the melt state provides critical information to both understand the processability and structure–property relationships of such materials. Moreover, rheological measurements in the melt state can probe the behavior of relatively large amount of material that is also useful from the macroscopic point of view.
Figure 4(a) and (b) demonstrates the dependence of G′ of MB and SM series of samples on the shear strain, respectively. The storage modulus of samples exhibits a linear region, called Newtonian plateau or plateau modulus, at low strains and nonlinear region at high strain amplitudes. It is also clearly seen that the plateau modulus (G′ plt) of the composites increases with the increasing amount of organoclay for both the series of samples. This result typically implies the reinforcement effect of fillers on the storage modulus of TPU. It was found that the extruded TPU (E-TPU) showed quite lower storage modulus value (220 Pa) than the SM one (S-TPU) (1250 Pa) at Newtonian region. This might be attributed to the fact that the molecular weight of TPU decreased possibly due to the thermomechanical effects during melt processing. It can be clearly seen in the Figure 3 that the SM samples exhibit higher G′plt values than the MB counterparts at a particular amount of organoclay loading. For instance, the G′plt value of SM-8 sample was about 8000 Pa while the value was about 1750 Pa for the MB-8. But, as concluded in the previous part based on the XRD results, the MB-8 sample showed better organoclay dispersion than the SM-8. It can be concluded that the reinforcing effect of organoclay was suppressed by the random chains scissions and resulted loss in some physical properties of TPU during melt processing even though the MB method yielded better filler dispersion.
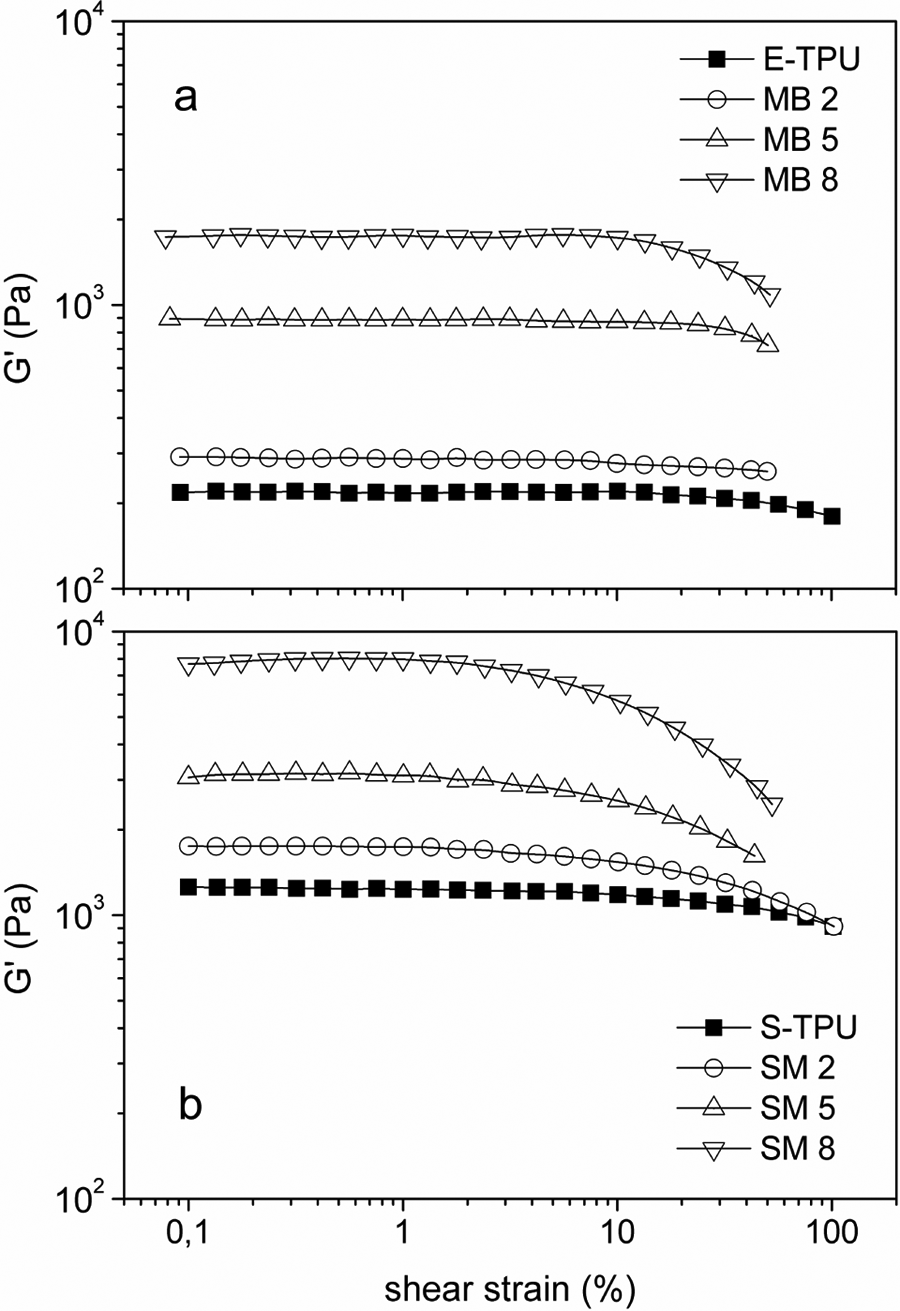
Dependence of storage modulus of (a) MB and (b) SM samples on the shear strain.
Dependence of G′ and G″ of samples on the angular frequency (ω) are given in Figure 5. Figure 5(a) and (b) shows the rheological behaviors of MB samples while the Figure 5(c) and (d) illustrates those of SM ones. It is clearly seen that introducing organoclay affects on both storage and loss modulus of samples and this effect is more evident at low-frequency region, especially in the storage modulus curves. The magnitude of the G′ increases and slope of the G′ decreases at low-frequency region with the increasing organoclay amount into the composition. It is well known that the evaluating of low-frequency behavior of polymer nanocomposites depending on the composition can be used to probe the microstructural features of such materials. Especially above a certain fraction of organoclay which can be defined as the “percolation threshold,” G′ becomes frequency independent (G″ α ω 0) at low-frequency region. This is also called solid-like (or pseudosolid-like) behavior which indicates the formation of physical network by the fillers and/or strong interactions between the filler and polymer phases. 39 The solid-like behavior and the quantification of microstructure and rheological behaviors of samples were also reported for other nanocomposite systems. 39 –42
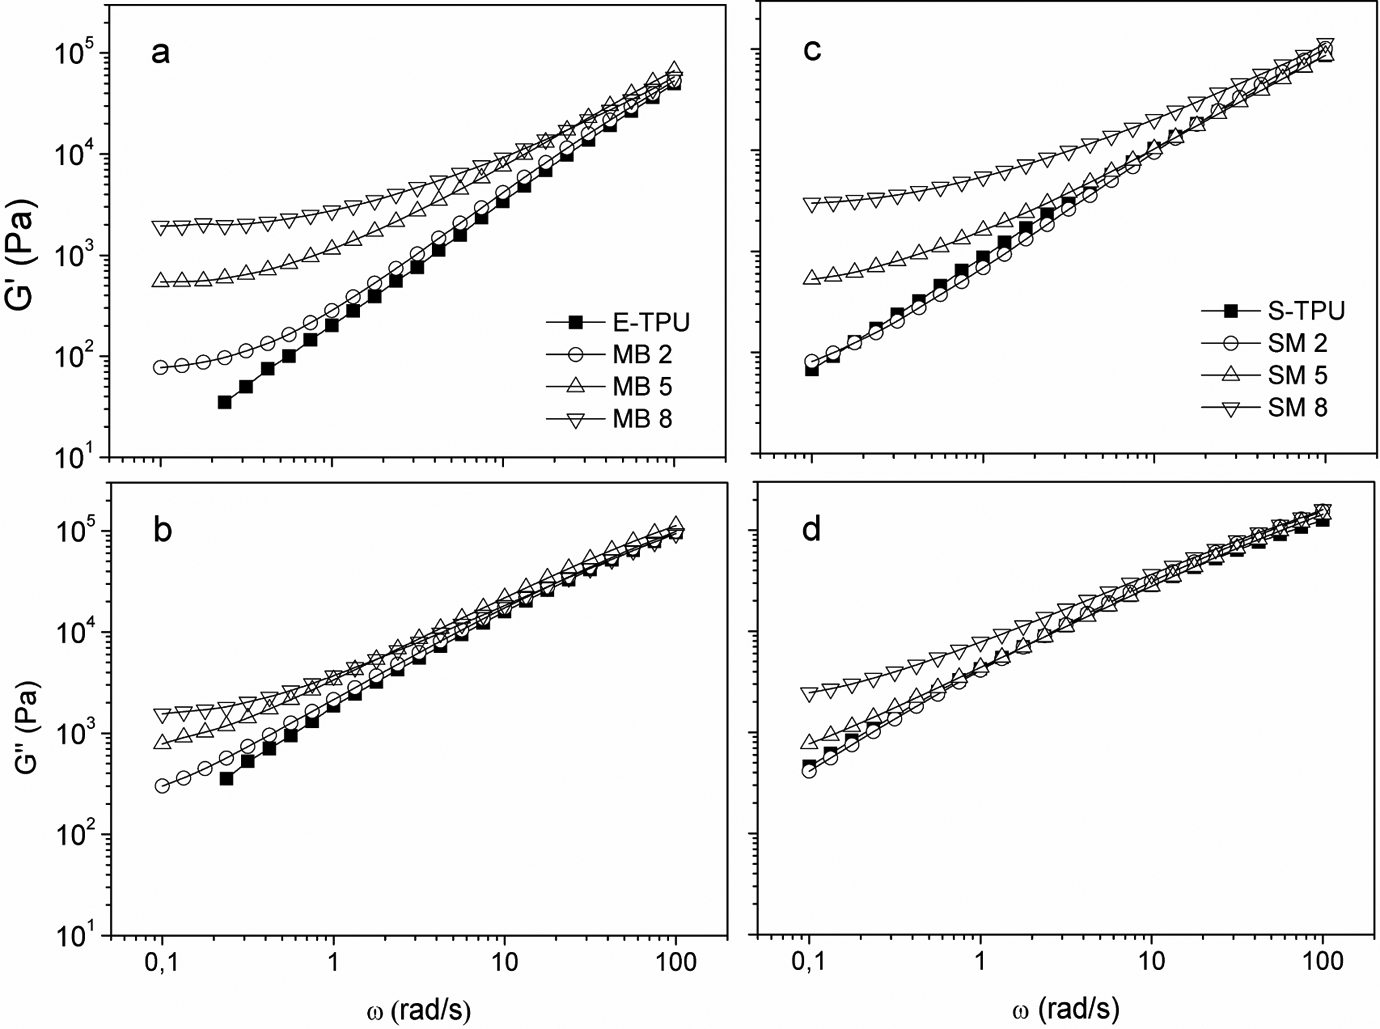
Dependence of storage and loss modulus of (a and b) MB and (c and d) SM samples on the angular frequency.
The values of reduced modulus (G′R) can be plotted as a function of volume fraction of organoclay (φ f) to compare the reinforcing effect of filler dispersion on the rheological behavior of composites and estimate the percolation threshold of filler. The reduced modulus can be defined as the ratio of low-frequency (ω = 0.1) modulus of composite to that of neat polymer (G′c/G′p). This relationship is illustrated in Figure 5 for the MB and SM series of samples. Two distinct regions where the rheological behavior of samples changes from the liquid like to solid like can be clearly noticed in the plots. It can also be distinguished that the storage modulus increases dramatically at a certain point of the organoclay loading. After a particular amount of organoclay, increase in the G′R follows a power-law dependence with the volume fraction of organoclay. This critical volume fraction is defined as the percolation threshold (φ p). Based on the melt rheology data, determination of percolation threshold has not been speculated in this study, because only three compositions were tested for each preparation method. But it can be roughly concluded that the MB series of samples showed slightly lower percolation threshold than the series of SM samples. The result given in Figure 6 provides an important quantification to compare the effect of preparation method on the dispersion of organoclay layers into TPU matrix. The melt rheology data of samples also implied that the MB method probably yielded better dispersion therefore higher improvement in the low-frequency modulus. This conclusion obtained from the analysis of rheological behaviors of samples is very consistent with the XRD results.
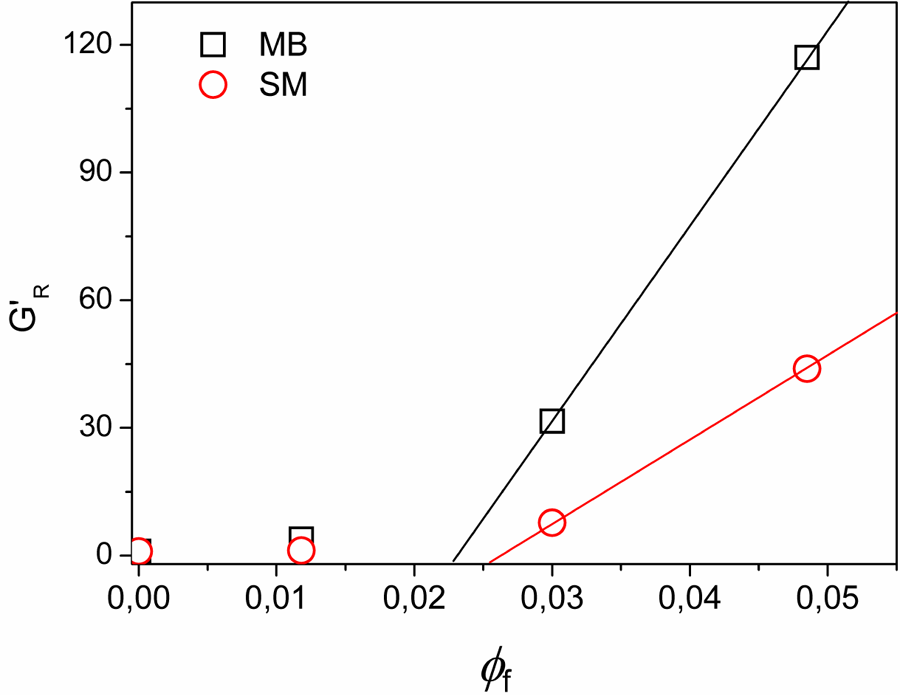
Plot of the reduced modulus (G′R) versus volume fraction of organoclay (φ f) for the samples prepared with different methods.
Dependence of dynamic viscosity (η*) of samples on the angular frequency (ω) is given in Figure 7(a) and (b) for the series of samples prepared with MB and SM methods, respectively. The effects of amount and/or dispersion quality of fillers on the viscosity of nanocomposite samples can be observed at low shear rate (or low frequency) region. It was found that the η* value of SM TPU (S-TPU) was higher than the extruded TPU (E-TPU). This was possibly due to the thermomechanical effects of melt-processing operation on the molecular weight of TPU, as discussed before.
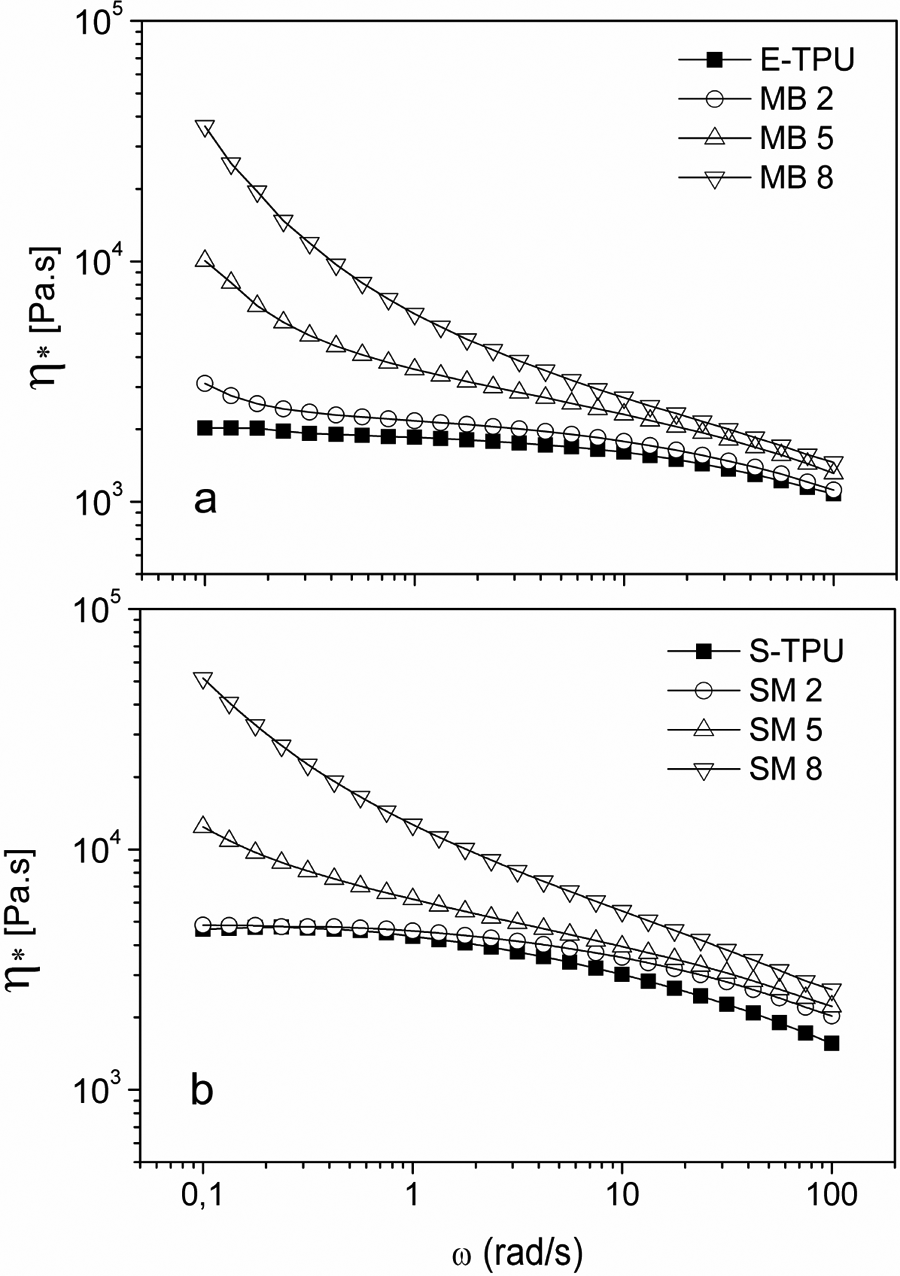
Dependence of complex viscosity of (a) MB and (b) SM samples on the angular frequency.
As seen in Figure 7(a) and (b), it was found that the dynamic viscosity of nanocomposite samples including of 5 and 8 wt% of organoclay, dramatically increased at low-frequency region, which indicated the characteristic shear-thinning behavior while E-TPU and S-TPU samples exhibited a Newtonian plateau (frequency-independent behavior) at this region. The shear-thinning behavior can be accepted as another indicator for comparing the level of filler dispersion and network formation for PCNs.
Uniaxial tensile creep behaviors of film samples
Figure 8(a) and (b) demonstrates the uniaxial tensile creep behaviors of MB and SM TPU/organoclay nanocomposite films including various amounts of organoclay, respectively. All the samples exhibited a permanent, irrecoverable strain even though the applied load was well within the linear region. It is also clearly shown that the introducing of organoclay into the TPU structure resulted in a considerable reduction in the creep strain. This effect is more pronounced for the series of samples prepared with MB in a twin screw extruder. The total creep strain of extruded TPU (E-TPU) was about 43% while the SM TPU (S-TPU) exhibited the strain value about 25% for an hour. It is seen that the nanocomposite samples prepared with the SM method yielded the creep strain value about 13–18% depending on the amount of organoclay.
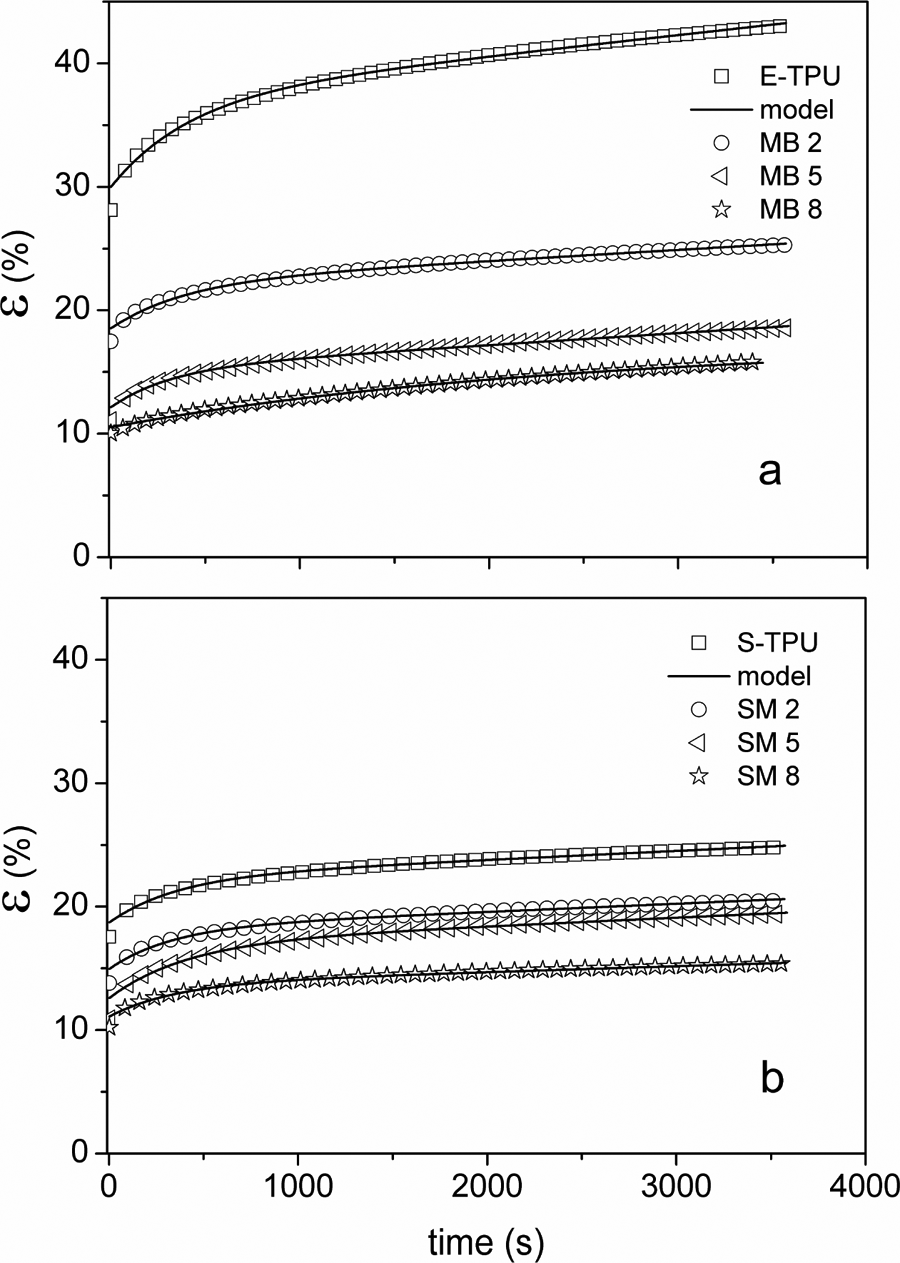
Creep curves of (a) MB and (b) SM films. SM: solution mixed; MB: melt blended.
Creep deformation is defined as the time-dependent strain under a constant stress or force. It is well known that perfectly elastic material responses instantaneously against an applied stress but a viscoelastic material exhibits a time-dependent strain behavior. Several mathematical approaches have been devoted to explain the viscoelastic creep behavior of polymers. Each model uses the typical spring and dashpot elements connected with various configurations to simplify elastic and viscous behaviors of a viscoelastic material. Findley 43 offered the simple equation for the relationship of creep strain and time:

where ∊0 is the instantaneous strain, m is the amplitude of transient creep strain, and n is the time exponent. The empirical approach does not provide a physical representation for the creep deformation and recovery behavior under different loading conditions. Some mechanical and molecular models have also been applied to analyze the creep responses of viscoelastic materials. Findley parameters are listed in Table 2. It was found that the MB samples showed lower instantaneous deformation values than the SM samples which referred to better dispersion of clay platelet.
The viscoelastic parameters predicted by the modeling of creep behaviors of samples.
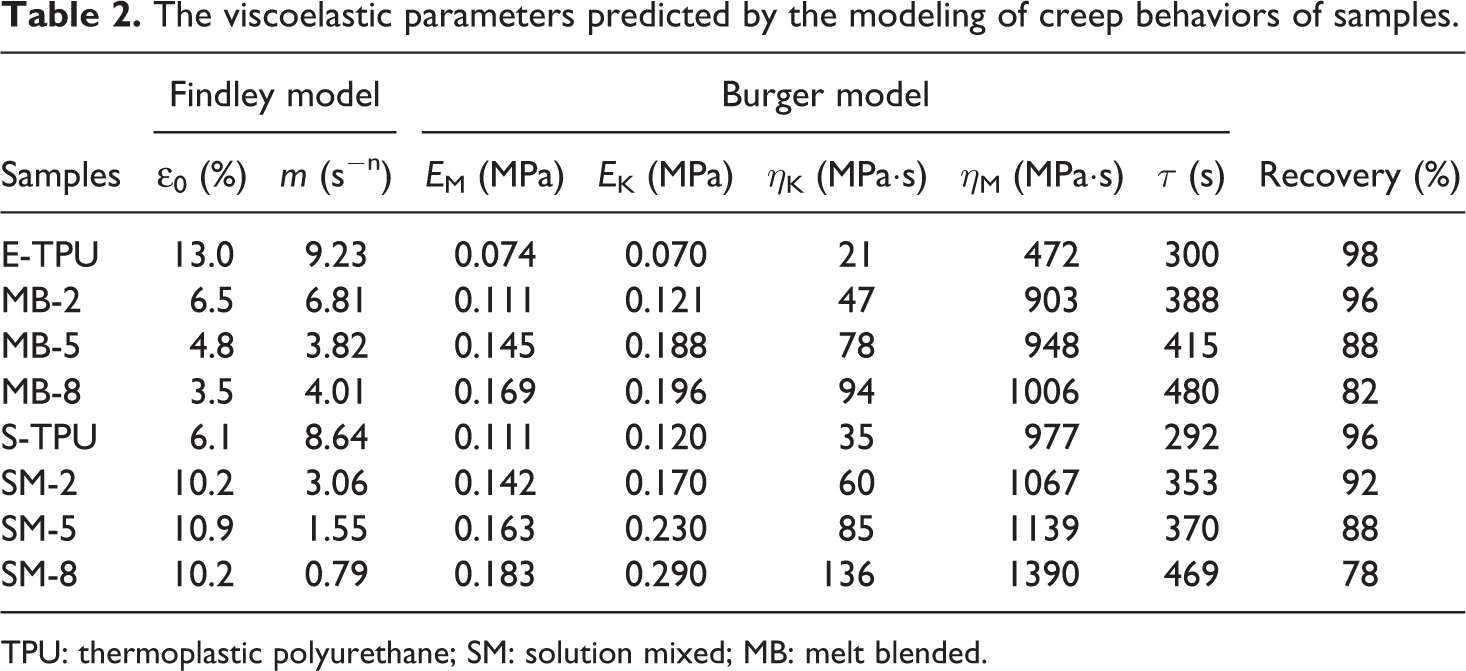
TPU: thermoplastic polyurethane; SM: solution mixed; MB: melt blended.
The Burger’s (or four-element) model, a combination of Maxwell and Kelvin–Voigt elements, is one of the most used viscoelastic models to explain the creep behavior of thermoplastic polymers and the microstructure–property relationships of the polymers and composites. 44 When a constant force is applied to a viscoelastic material, the Maxwell spring, S M, instantaneously deforms. Then, the Kelvin spring, S K, and dashpot, D K, deform by showing a delayed response followed by a continuous deformation of Maxwell dashpot, D M. Total strain could be defined as the sum of the strains of Maxwell and Kelvin elements:

where σ is the applied stress, E M and E M are the elastic and viscous components of Maxwell element, spring, and E K and E K are the elastic and viscous components of Kelvin element, dashpot. When the applied force is removed, the Maxwell spring, S M, recovers completely. The Kelvin spring, S K, and dashpot, D K, show a delayed recovery. But the Maxell dashpot, D M, exhibits a permanent deformation. Typical creep curve of a viscoelastic solid shows such behaviors defined in three distinct regions on the curve which are the immediate elastic deformation in spring, delayed viscoelastic deformation in spring and dashpot and viscous deformation in dashpot.
In PCNs, better and/or uniform dispersion of clay layers or stacks and strong interaction between polymer and filler plays an important role on the improvement of elastic behavior of polymers. The Burger’s parameters for the samples are also listed in Table 2. The results showed that the organoclay improved the elasticity (E M) of TPU for the both series of samples. Introducing of nanofillers into the polymer matrix increased the elastic modulus of samples due to the physical interactions between the organoclay layers and urethane (hard) and polyester (soft) segments of TPU. Similar behavior was reported by Luduena et al. for polycaprolactone (PCL)/clay nanocomposites. 45,46 The E M values of SM series of samples were found to be slightly higher than those of MB series of samples at a given organoclay amount while organoclay dispersion in MB samples was found to be better than the SM ones for the organoclay amount of 5 and 8 wt%. Yang et al. studied on the creep behaviors of polyamide 66 nanocomposites including various types of nanofillers at three different temperatures and stress levels. 47 They reported that the E M values of nanocomposite samples were not altered much by the type of nanofiller at 20°C but the increasing of test temperature and applied load decreased the E M values of samples. The retardant elasticity (E K) and viscosity (η K) are related to the stiffness of amorphous polymer chains in the short time and dependent on the applied load and test temperature. It was found that the viscoelastic parameters of Kelvin–Voigth unit, E K and η K, readily increased with the increasing amount of organoclay for the both series of samples prepared with MB and SM methods. The MB samples showed lower E K and η K values than the SM samples. The ratio of η K to E K is defined as the characteristic relaxation time (τ). As seen in Table 2, the τ values increased with the increasing amount of organoclay. It was obtained that the relaxation time values of MB samples were slightly higher than those of SM counterparts. This result could be attributed to the fact that the better dispersion of clay layers into the TPU phase in the MB samples leads to higher stiffness and thus restricted the mobility of polymer chains against to the applied forces.
The irrecoverable creep strain parameter (η M) is not dependent on temperature and related to irreversible deformation of amorphous regions in polymer. The η M values of samples listed in Table 2 represents that the organoclay addition into the TPU matrix increased the irrecoverable strain of matrix polymer.
Improvement in the elastic properties of composite sample depending on the amount and physical features of fillers can be quantified by the empirical Halpin–Tsai (H-T) model. The H-T equation is based on a well-known theory to predict the stiffness of a composite material as a function of filler loading and aspect ratio by regarding the micromechanical point of view. 48,49 H-T equation is defined as:
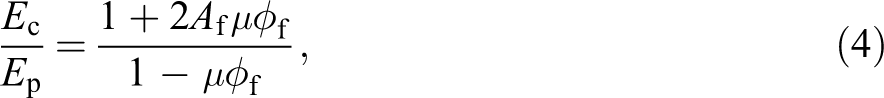
where E c and E p are the elastic modulus of composite and polymer, respectively. A f refers to the aspect ratio of the filler. φ f is the volume fraction of the filler and μ is the geometric factor which can be written as:
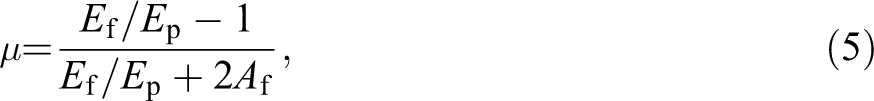
where E f is the elastic modulus of the filler. Modulus ratio of the filler and polymer (E f/E p) is also defined as relative modulus (E R). As explained in the experimental part (see section Dynamic mechanical analysis), the creep curves of the samples were converted to SS curves and the E values of samples which can be taken as the analogous values to the Young’s modulus in conventional tensile test were determined and used in the H-T modeling study. The elastic modulus values of a clay platelet and TPU were taken as 200 and 2.6 GPa, respectively. 50
As shown in Figure 9, the H-T model predicts that the E c increases almost linearly with the increasing volume fraction of organoclay. It was found that the H-T model successfully fits the experimental data obtained from the DMA analysis and the estimated A f values were in the range of 15–30 for the series of samples. It is also clearly seen that the A f values of samples decreases slightly with the increasing of organoclay amount. This is possibly due to the increasing of filler–filler interactions and thus formation of agglomerated structure.
Application of Halpin–Tsai micromechanical model to estimate the average aspect ratio of organoclay layers.
Gas and water vapor permeability
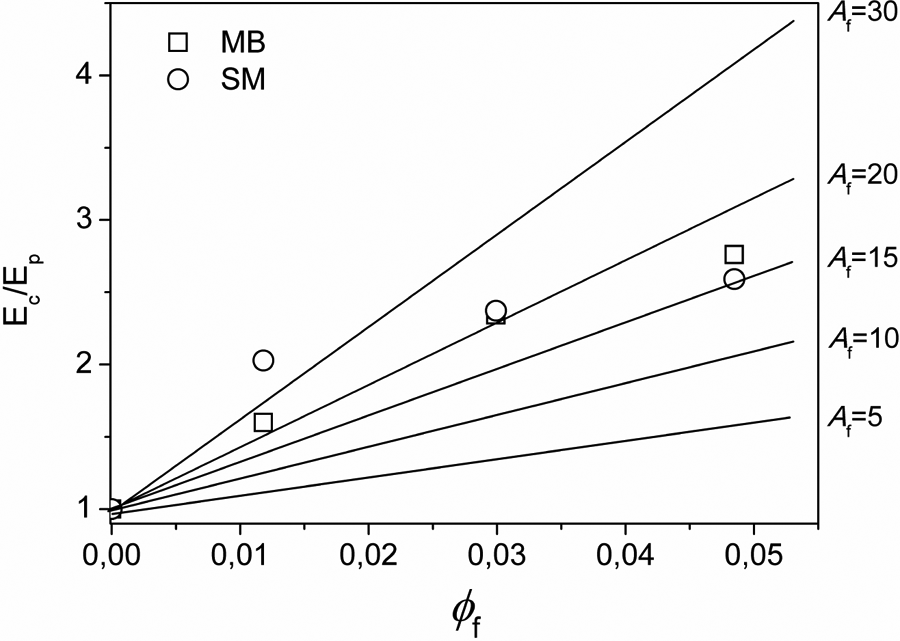
It is known that the barrier properties of nanocomposites films depend on many parameters such as particle size, geometry, level of dispersion and orientation of nanofillers, interfacial interactions between polymer and fillers, and structural properties of matrix. It can be accepted that the permeation properties of thermoplastic nanocomposites with the amorphous polymer matrix such as polyurethane, polystyrene, polycarbonate, and so on, completely depend on the properties and dispersion of nanofillers into polymer phase. The theory suggested by Nielsen defines a relationship between the relative gas permeability and the aspect ratio (A f) and amount of non-spherical fillers. 51 According to the Nielsen approach, the impermeable and vertically aligned clay platelets against the gas diffusion direction form a tortuous structure so that the gas molecules travel a longer path to diffuse through the film. The Nielsen equation can be defined as:
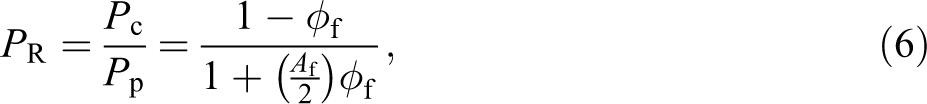
where P R is the relative permeability, P C and P P are the permeability values of nanocomposite and polymer films, and φ f represents the volume fraction which is calculated according to the following equation:
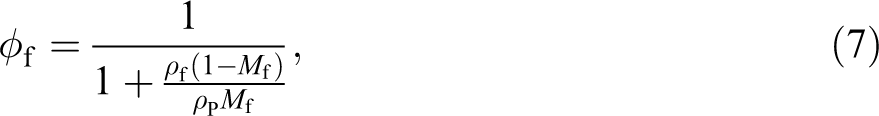
where ρ f and ρ p are the densities of filler and polymer, respectively and M f is the mass fraction of filler.
Gas permeability values of film samples are given in Table 3. It is seen that the oxygen, nitrogen, and carbon dioxide permeability values of both MB and SM series of samples steadily decreased with the introducing of organoclay. The MB samples exhibited noticeably smaller relative permeability values than the SM samples when comparing samples with similar clay content. For example, introducing of 5 wt% organoclay yielded to reduce 19%, 21%, and 9% in the O2, N2, and CO2 permeability, respectively, for the MB films. On the other hand, it was found that such amount of filler leads to decrease 11%, 18%, and 5% in the permeability values of gases for the SM samples.
Gas and water vapor permeability values of samples.
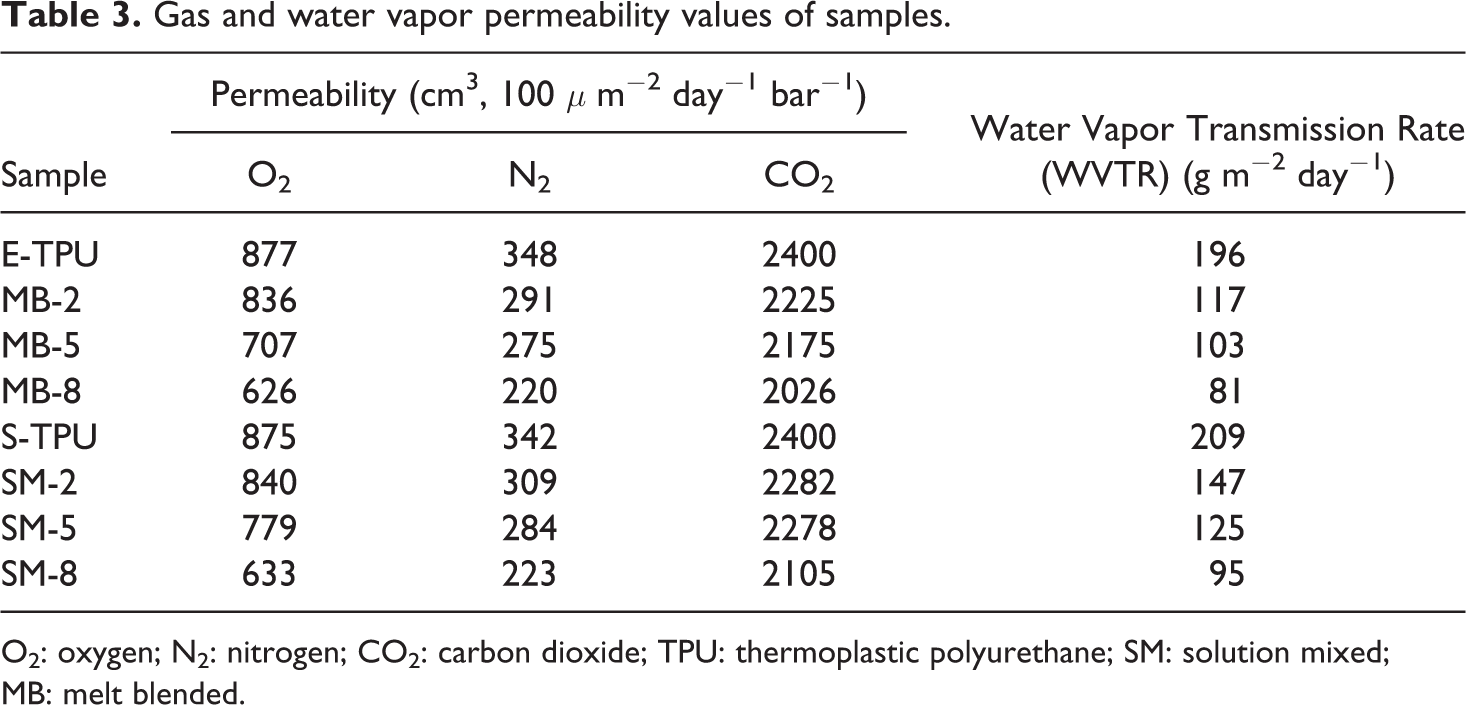
O2: oxygen; N2: nitrogen; CO2: carbon dioxide; TPU: thermoplastic polyurethane; SM: solution mixed; MB: melt blended.
Figure 10 illustrates the estimation of aspect ratio values of samples according to the Nielsen’s model. It is seen that the average aspect ratio for the MB samples was higher than the SM samples. This result suggests that dispersion of organoclay is better in the MB samples than the SM ones.
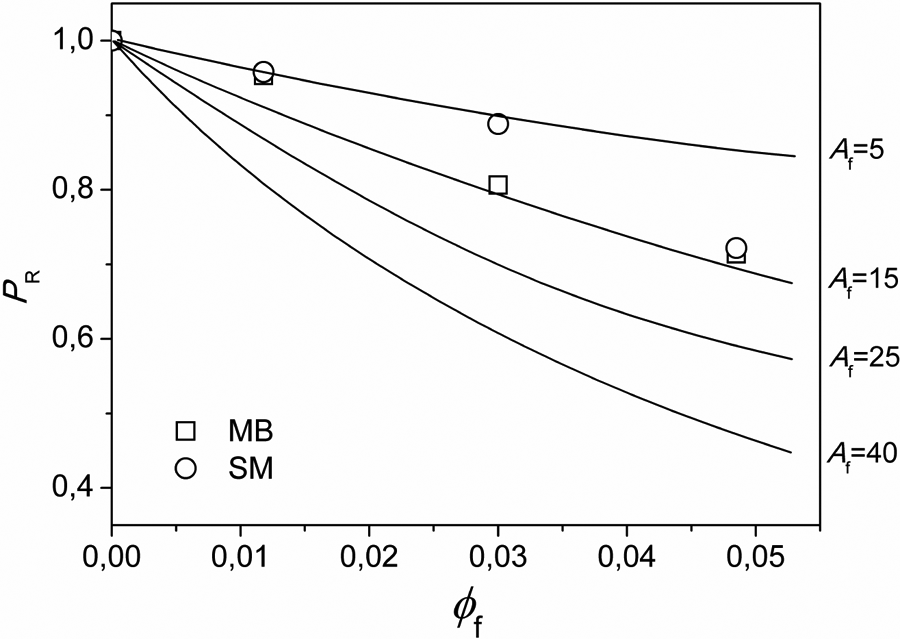
Nielsen model applied to O2 permeability data of samples for estimating the average aspect ratio of organoclay layers.
The water vapor permeability (WVP) values of samples are also listed in Table 3. As expected, WVP values decreased with the increasing of organoclay amount. It was found that the MB samples displayed lower WVP values than the SM counterparts. This result might be due to the better dispersion of organoclay layers into the polymer matrix and the higher aspect ratio of clay stacks.
The estimated average aspect ratio value of a sample was confirmed by the analysis of SEM image. Figure 11 shows an image of organoclay stack embedded into the TPU phase and taken with the magnification of 100.000. It should be remarked that the SM-8 sample exhibited an intercalated structure, based on the XRD analysis. As seen in the image, the lateral size and thickness of the stack were found to be about 700 nm and 45 nm, respectively. These values yielded the average aspect ratio of 15–16. The XRD analysis pointed out that the intergallery distance between organoclay layers was determined as 3.60 nm for the sample. Considering the thickness of 2:1 layer of montmorillonite is about 1 nm, it can be predicted that this stack consists of approximately 10 layers.
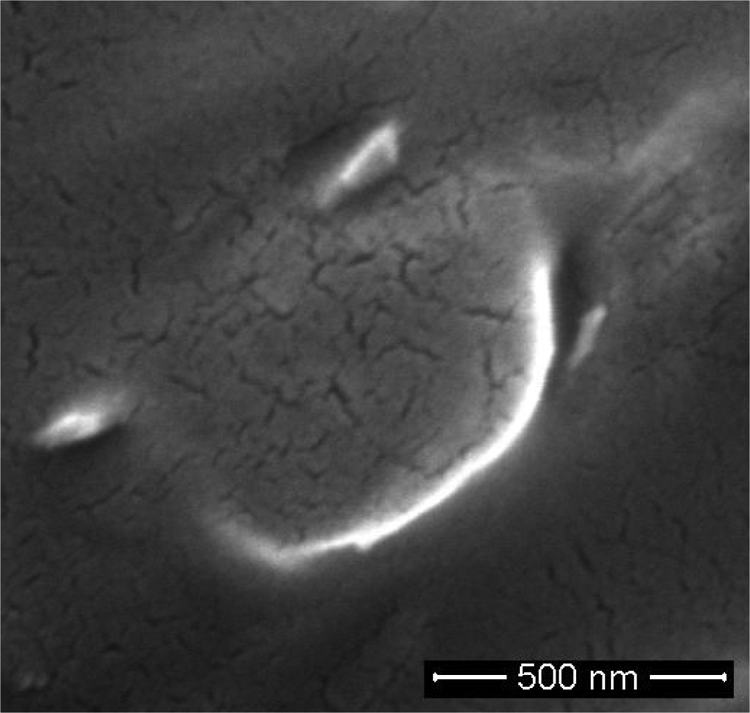
High-resolution SEM images of a clay stack embedded into the SM 8 sample.
Conclusion
In this study, microstructural and physical properties of TPU/organoclay nanocomposites prepared with MB and SM methods were quantified and compared. Based on the XRD and SEM analysis, it was obtained that the film samples prepared with the MB method formed exfoliated nanocomposite structure while those prepared with the SM method exhibited intercalated structure. The uniaxial creep behaviors of the samples indicated that the exfoliated samples showed higher creep resistance than the intercalated ones, related to the amount of organoclay and dispersion quality of organoclay layers. It was also found that the MB films showed higher gas barrier performances compared to the SM counterparts for a given amount of organoclay. Consequently, it can be concluded that the TPU-based organoclay filled nanocomposite films showing exfoliated structure and superior physical performances can be prepared with the MB method as an easy and environmentally friendly technique.
Footnotes
Declaration of Conflicting Interests
The author(s) declared no potential conflicts of interest with respect to the research, authorship, and/or publication of this article.
Funding
The author(s) received no financial support for the research, authorship, and/or publication of this article.