
Abstract
Polymeric nanocomposites based on poly(propylene-co-ethylene-co-1-butene) (PEBC) were elaborated by melt mixing using an organophilic montmorillonite (o-MMT) and maleated PEBC (PEBCg) as compatibilizer. The effect of clay concentration, PEBCg:o-MMT ratio, and grafting degree of the compatibilizer were studied. X-ray diffraction and scanning electron microscopy show formation of partially intercalated structures in all compatibilized composites with well-distributed small tactoids. According to the differential scanning calorimetry results, the anhydride groups of the compatibilizer have a marginal nucleating effect, while the o-MMT causes a slight decrease in the crystallization temperature of the polymer. PEBC presents the largest activation energy of crystallization (Eα), while the composites show lower Eα than their matrices. It is also observed that the rate of degradation of PEBC is not affected by the presence of PEBCg. The nanoclay, on the other hand, retards the decomposition process of the polymeric matrix in about 40°C and augments its rate of degradation approximately four times.
Introduction
Polymer nanocomposites (PNCs) containing layered silicates are a new generation of composite materials. 1,2 The incorporation of delaminated clay, with its high aspect ratio, to a polymeric matrix is expected to enhance the mechanical strength, gas barrier, thermal stability, and flame retardation of the neat polymer. This improvement of properties is generally achieved with a small amount of filler, which helps the composite materials to retain the transparency and low density of the polymer.
In particular, montmorillonite (MMT) is one of the fillers most used on the elaboration of PNCs. MMT is a silicate with large surface-to-volume ratio (80–300 m2 g−1) that exists in nature in a tactoid structure comprised of several tens of stacked layers. These layers have a typical lateral dimension of 0.1–0.5 mm and layer thickness of about 1 nm. The layer and interlayer conform the repeat unit of the stacked material, which is called d-spacing or basal spacing (d001). Unfortunately, the high energetic hydrophilic surface of MMT makes it incompatible with many polymers, mainly those that are hydrophobic. This incompatibility may be reduced by exchanging the inorganic cations present in the surface of the clay layers with organic ions (e.g. alkyl ammonium) to give organically modified MMT (o-MMT). 1,3 This exchange not only provides an organophilic character to the clay but also lowers the surface energy of the silicate surface and increases the basal spacing, improving the wetting, swelling, and exfoliation of the aluminosilicate layers and platelets in the polymer matrix.
Polypropylene (PP) is a semicrystalline polymer widely used in packaging, textile, and automobile industries because of its good processability and final properties. Nevertheless, the low toughness of PP limits its applications, especially at room and low temperatures. 4,5 This disadvantage of PP can be overcome by mixing with polyethylene or adding a small fraction of ethylene or another α-olefin by copolymerization. In particular, random propylene copolymers (RPCs), which are produced by adding ethylene or, less frequently, 1-butene or 1-hexene, to the reactor during the polymerization reaction, embrace approximately 8% of the market of PP. 6 RPCs generally contain up to 7 wt% ethylene, with at least 75% single insertions. The presence of the comonomer units in the otherwise regular, repeating arrangement of atoms in the PP molecules reduces the PP crystallinity. This reduction in crystallinity, translates in lower melting point (approximately 120°C using 7 wt% of ethylene) and specific gravity (approximately 0.9), lower heat distortion and softening temperatures, higher impact strength, flexibility and transparency, and lower stiffness and hardness. For example, the presence of just 3 wt% of ethylene may increase the impact strength of PP from 11 to about 28 J and reduce the ultimate tensile strength from approximately 34 to about 14 MPa. RPCs are primarily used in film, blow molding, and injection molding applications that require high clarity, good impact strength at low temperatures, some stiffness, and moisture barrier properties.
Another way that has been explored to increase the range of applications of PP is in nanocomposites. In particular, a large number of publications may be found in the literature that analyze nanocomposites based on PP and o-MMT 2,7 and referenced works within. However, there are very few works that consider PNCs based on RPCs and o-MMT. 8 –14 The preparation of the majority of the polyolefin-based PNCs is done by melt intercalation. The mixing in the molten state technique has great advantages over other methods such as in situ polymerization or polymer–solution intercalation since it is environmentally friendly and compatible with current industrial processes. Additionally, most of these studies use a compatibilizer to enhance the interaction between the organophilic polymer and the clay and to favor the exfoliation of the clay platelets during the melt mixing process. Achieving exfoliation is practically a requisite for PNCs in order to enhance the polymer properties with low concentrations of clay. 1 However, in most PNCs both intercalated and exfoliated structures coexist. In the totally exfoliated microstructure, the filler platelets are delaminated into their primary nanometer scale size so that the periodicity of the original platelet arrangement is lost, while in the intercalated one the periodicity is kept with an enlargement of the basal spacing.
Among the few cited works that study PNCs based on RPCs, only three analyze copolymers with relatively low comonomer content (<15 wt%). 11,12,14 Preschilla and coworkers 11 compared the morphology of nanocomposites prepared with three polypropylenes: an homopolymer (HPP), an RPC with ethylene content of 3 wt%, and a reactor-copolymerized ethylene–propylene rubber (EPR) dispersed in PP matrix. They considered an organoclay loading of 6 wt% and a maleated PP (PPg) as compatibilizer in a PPg/o-MMT ratio of 1:1. The nanocomposites based in HPP and RPC display a consistent expansion of the basal layers of the o-MMT as well as a population with intercalated clay platelets. The intercalated basal spacing was slightly larger in the composite based in RPC, while the level of dispersion was the highest when using EPR. Similarly, Liu and coworkers 14 studied PNCs based on an RPC with 3.0 wt% of ethylene prepared by a two-stage extrusion process. They used an o-MMT from Nanocor and four maleated compatibilizers: an ethylene–octene copolymer, two PPgs, and a block propylene copolymer. All of them have 0.9 wt% of maleic anhydride, except one of the PPgs, which has 0.5 wt%. All of the composites, which were prepared using a 1.5:1 ratio of compatibilizer/o-MMT and up to 4 wt% of o-MMT, display mainly intercalated microstructure. The results in this publication do not show clear trends in the thermal and tensile mechanical properties with the type of compatibilizer and/or clay concentration. Palza 12 synthesized a series of RPCs that have up to 8 wt% of 1-hexene or 1-octadecene. He used 5 wt% of Cloisite 15A and a commercial PPg with 0.6 wt% of maleic anhydride in a 3:1 ratio of compatibilizer/clay. According to the author, the nanocomposites present higher crystallization temperature and larger elastic modulus than the pristine polymers.
Clearly, the extremely few results that can be found in the literature based on RPC nanocomposites justify a deep and systematic study. In the present work, a commercial RPC with 3 wt% of ethylene and 8 wt% of 1-butene (poly(propylene-co-ethylene-co-1-butene) (PEBC)) was melt mixed with different concentrations of o-MMT using the PEBC-functionalized with maleic anhydride (PEBCg) as compatibilizer. The effect of clay concentration, PEBCg/o-MMT ratio, and grafting degree of maleic anhydride of the PEBCg are analyzed on the crystallization behavior and thermal stability of the composites. Clay concentrations up to 8 wt% and compatibilizer/clay ratios up to 3:1 were considered. The increase in compatibilizer concentration generally produces an increase in clay exfoliation in polyolefin-based composites, being the compatibilizer/clay ratio of 3:1 the most frequently used. 1,7 In a following paper, the linear viscoelastic behavior and the oxygen permeability of these composites will be presented.
Experimental
Materials
The polymer used in this study is a commercial random propylene terpolymer (SP406) from Petroquímica Cuyo S.A.I.C. (Mendoza, Argentina). PEBC contains 3 wt% of ethylene and 8 wt% of 1-butene. The clay is a commercial organophilic montmorillonite (Nanomer I.44P, N44, Nanocor, Aberdeen, Mississippi, USA) modified with dimethyl-dihydrogenated-tallow ammonium chloride. This clay has particle size in the range of 15–25 µm, a modifier concentration of 1.04 meq g−1 of inorganic clay with surface coverage of about 70%, a decomposition temperature (Td) of 200°C, and 2.6 nm of interlayer spacing. 15
The compatibilizer (PEBCg) was synthesized by grafting maleic anhydride onto the PEBC via reactive mixing, employing 2,5-dimethyl-2,5-di(tert-butyl peroxy)-hexane as initiator. For this purpose, the polymer pellets were impregnated with the anhydride previously dissolved in methyl ethyl ketone and kept under nitrogen flow during 24 h to allow the evaporation of the solvent. After that time, the impregnated pellets were mixed with the initiator and introduced into the mixing head of the Brabender® Plastograph. The grafting reaction was carried out at 180°C for 20 min under nitrogen flow. The material was then removed from the mixer and compressed between aluminum plates to obtain approximately 3 mm thick specimens. PEBCg1 has a grafting degree of at least 0.4 wt% of anhydride groups (AG) determined by infrared spectroscopy (described below) and a zero-shear rate viscosity (η0) of 750 Pa·s at 180°C, while PEBCg2 has at least 0.6 wt% of AG and η0 = 300 Pa·s at the same temperature. These values of zero-shear rate viscosity indicate a difference in molecular weight of approximately 30% if the correlation η0 ≈ M3.4 is used.
Composites preparation
A set of composites of PEBC/PEBCg1/o-MMT were prepared using three clay concentrations (2, 5, and 8 wt%) and keeping the PEBCg1/clay ratio in 3:1. Another set of PNCs were generated using 5 wt% of o-MMT and PEBCg2/o-MMT ratios of 1:1, 2:1, and 3:1. In this way, the effect of grafting degree of maleic anhydride of PEBCg can be analyzed through the two composites with 80:15:5 composition of PEBC/PEBCg/o-MMT. A PEBC/o-MMT composite with 5 wt% clay content (without compatibilizer) was also prepared as well as some blends of PEBC/PEBCg with composition matching those of corresponding composites. Table 1 lists all the materials analyzed in this work including the code used to identify them. The prefix “N” identifies the nanocomposites and “C” and “m” the PEBC/clay composite and the blends PEBC/PEBCg, respectively.
Composition of blends and composites.
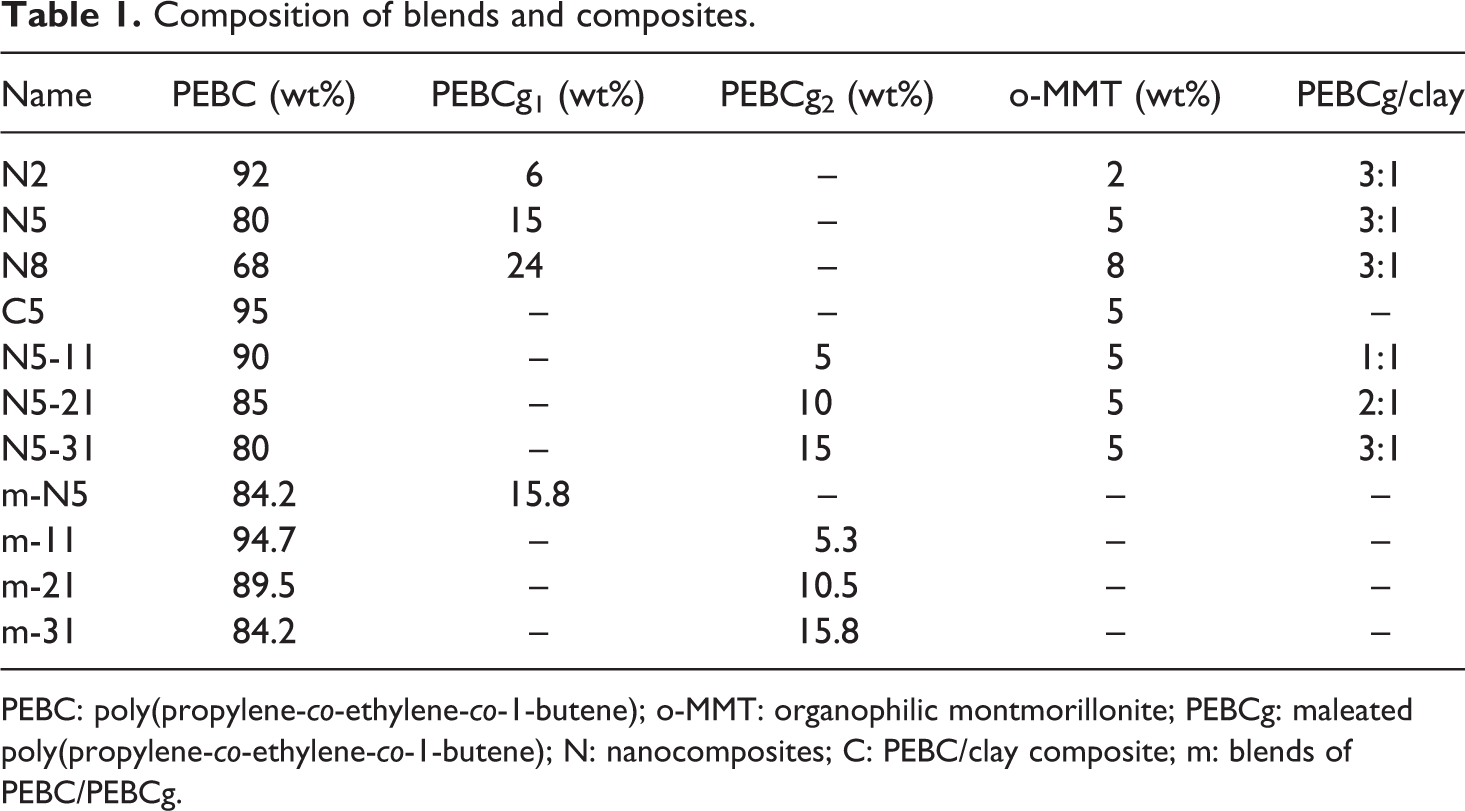
PEBC: poly(propylene-co-ethylene-co-1-butene); o-MMT: organophilic montmorillonite; PEBCg: maleated poly(propylene-co-ethylene-co-1-butene); N: nanocomposites; C: PEBC/clay composite; m: blends of PEBC/PEBCg.
The composites were obtained by melt mixing the polymers with the clay for 20 min in a Brabender Plastograph at 180°C under nitrogen atmosphere. Forty-five grams of mixture was prepared per batch using cam-blades rotating at 30 r min−1. In all cases, 0.01 wt% of Irganox1010 was added. The clay was dried under vacuum at 130°C for 24 h before mixing. The materials were removed from the mixer chamber with a spatula and rapidly compressed between aluminum plates to obtain approximately 3 mm thick specimens.
Characterization
X-Ray diffraction (XRD) was applied to analyze the structure of the materials determining the interlayer spacing between stacked clay platelets. The study was done using a Philips PW1710 diffractometer (Andover, Massachusetts, USA), equipped with a copper Kα radiation source of wavelength 1.54 Å operated at 45 kV and 30 mA. The diffraction spectra were recorded in the reflection mode over a 2θ range of 2°–40° in steps of 0.02° using a rate of 0.6° min−1. To complete the structural characterization of the materials, the morphology of the composites was observed by scanning electronic microscopy (SEM) using a LEO EVO-40 XVP equipment.
Fourier transform infrared (FTIR) spectroscopy was used to quantify the amount of AGs grafted in the PEBC molecules after functionalization and to follow possible changes in the chemical structure of the PEBCgs. A Nexus spectrophotometer from Nicolet (Madison, Wisconsin, USA) was used to record the spectra on approximately 100 μm thick films with a resolution of 4 cm−1.
The crystallization behavior of the materials was studied using differential scanning calorimetry (DSC). The equipment used is a Perkin-Elmer (Waltham, Massachusetts, USA) Pyris I system. The analyzed 100–200 μm thick samples were obtained by melt compression molding. The specimens were initially heated to 170°C and held at this temperature for 3 min to remove its thermal history. Then, they were cooled up to 30°C at different cooling rates (5, 10 and 20°C min−1) and finally heated up to 170°C at 10°C min−1. All runs were performed under nitrogen atmosphere. Both the exotherm and endotherm curves were registered as a function of temperature. From these curves, the melting temperature (Tm) and crystallization temperature (Tc), the enthalpies of fusion (ΔHm) and crystallization (ΔHc), and the crystallization enthalpy ratio and activation energy were calculated.
Thermogravimetric analysis (TGA) was applied to study the thermal stability of the polymeric materials and the clay. This study was performed using a Discovery system from TA Instruments (New Castle, Delaware, USA). The samples were heated from room temperature to 600°C at 10°C min−1 under nitrogen flow of 25 mL min−1, and the residual weight was recorded as a function of temperature.
Results and discussion
Microstructure characterization
The basal spacing of the d001 plane of o-MMT and the filler of composites may be calculated by applying Bragg’s Law to XRD patterns. The values of d001 of clay and composites are listed in Table 2, while Figure 1 displays some selected diffractograms. According to the results, the (001) plane peak of pure o-MMT, which appears at 2θ approximately 3.3° (2.6 nm), shifts to lower values when it is mixed with the polymers. An increase of 0.5–0.7 nm in the separation between the layers of clay particles and tactoids is observed, regardless the concentration of clay and concentration and degree of functionalization of compatibilizer. This means that the clay structure is similarly intercalated in all composites, even in the one that has no compatibilizer. Comparing the patterns of the three materials with 5 wt% of clay (C5, N5, and N5-31), it can be observed that the compatibilized materials present broader peaks of smaller intensity (relative to a baseline) than C5. This indicates that the compatibilized composites have a fraction of clay that has been exfoliated or has a very large basal spacing (2θ smaller than 2°) and that the stacking of the clay layers is less perfect in these materials. Moreover, as expected, the intensity of the peak reduces noticeably as the concentration of clay decreases, together with a slight shift of the peak toward smaller angles. All the above observations are practically standard in polyolefin nanocomposites prepared with o-MMTs similar to N44, 1,2,15,16 although there has been some cases of nanocomposites with d-spacing similar to that of the pristine clay. 17 –19
Basal spacing of pure clay and composites, calculated from XRD diffractograms.
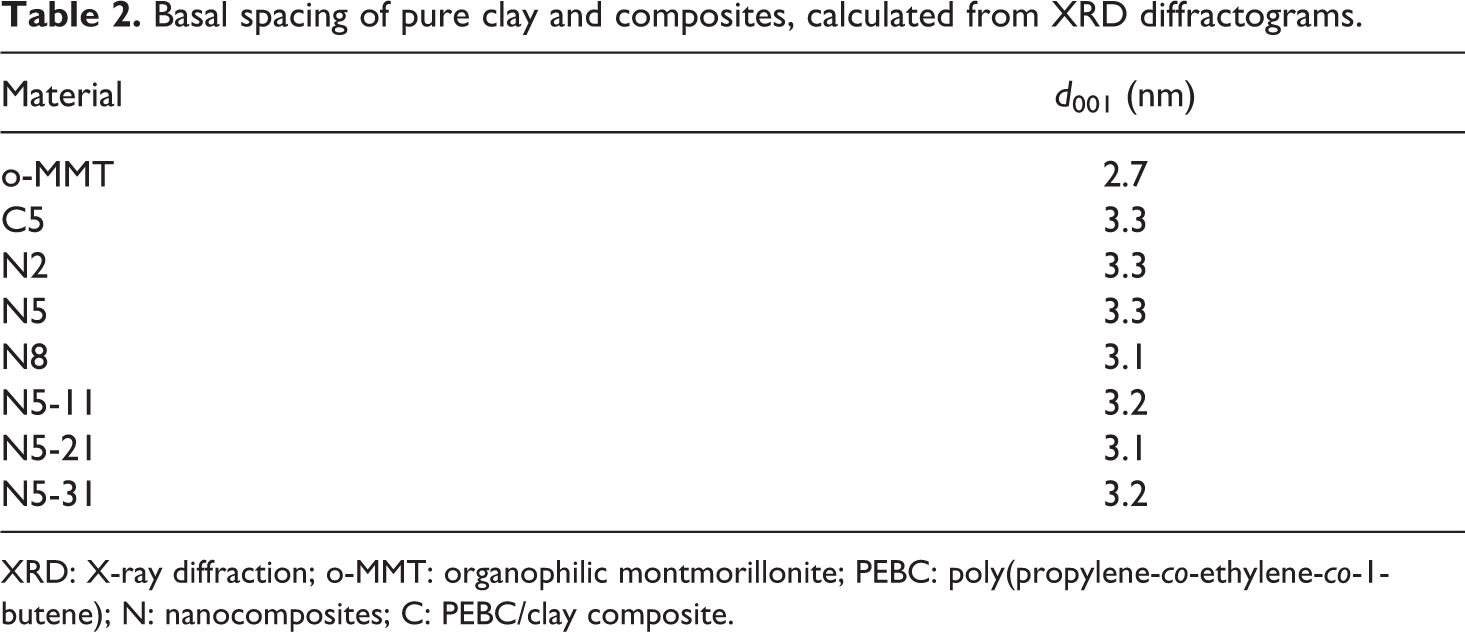
XRD: X-ray diffraction; o-MMT: organophilic montmorillonite; PEBC: poly(propylene-co-ethylene-co-1-butene); N: nanocomposites; C: PEBC/clay composite.
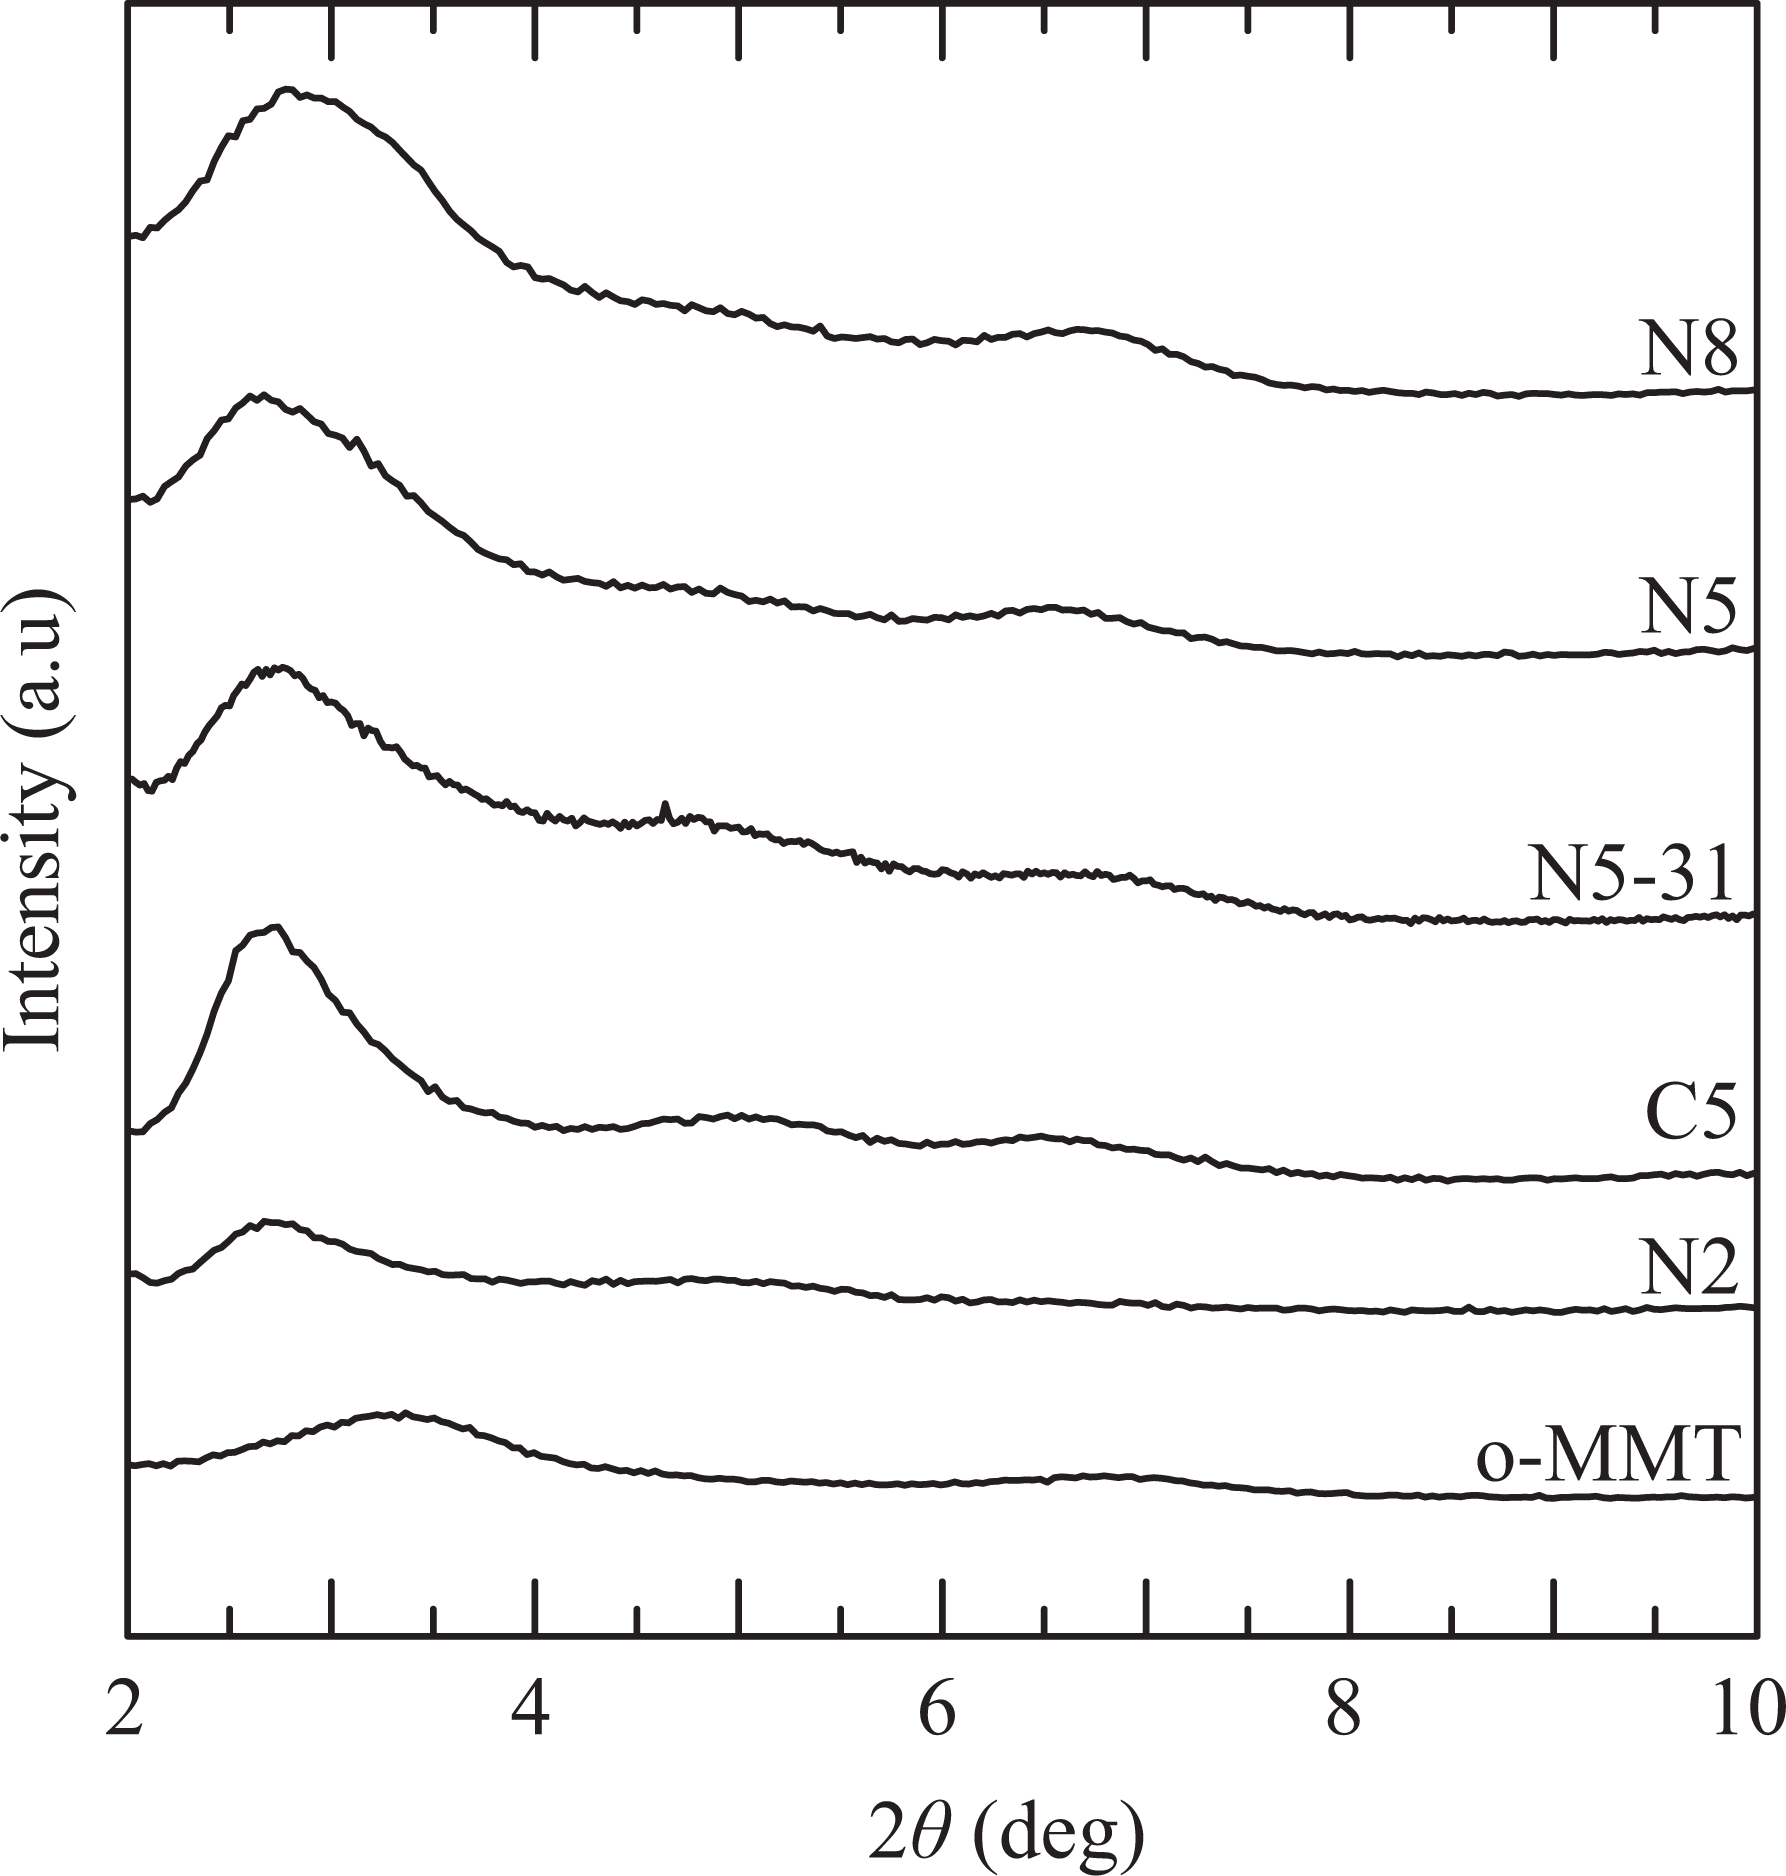
X-ray diffractograms of the clay and composites prepared with different clay concentrations.
The XRD results were complemented by structure analysis using SEM. Practically no aggregates were observed in any of the compatibilized composites, and homogeneous distribution of small tactoids were appreciated in all cases. Figure 2 shows, as an example, micrographs corresponding to C5 and N5, which were obtained with a magnification of 10,000×. The chosen image of N5 is representative of the structure observed in all PEBC/PEBCg/o-MMT materials. The displayed surfaces, which were obtained by ultramicrotome cut, were chemically treated to enhance contrast between the clay and the polymer. The treatment, which has been adapted from Olley and Bassett, 20 comprises submerging a sample for 10 min in a solution of 0.2%v/v potassium permanganate in sulfuric acid (to slightly degrade the polymer), followed by washing in distilled water with dilute sulfuric acid. Finally, the sample is repeatedly washed with 20%v/v oxygenated water alternating with distilled water. C5 presents a homogeneous distribution of small particles (characteristic length of about 1–3 µm) with some non-disrupted aggregates of 15–25 µm (not shown in the magnified image). In comparison, N5 presents a fine distribution of smaller particles and tactoids and no aggregates. Platelets and small tactoids are immersed in the polymer matrix. The results from XRD and SEM characterization confirm that the mixing technique used to prepare the composites produces the exfoliation of clay particles in platelets and small tactoids that are homogeneously distributed in the polymeric matrix and that the presence of the compatibilizer is important to achieve that exfoliation. The difference in grafting degree of AG in the compatibilizer (0.2 wt% larger in PEBCg2 than in PEBCg1), which goes together with approximately 30% difference in molecular weight (smaller in PEBCg2 than in PEBCg1), seems not to affect the phase structure of the nanocomposites.
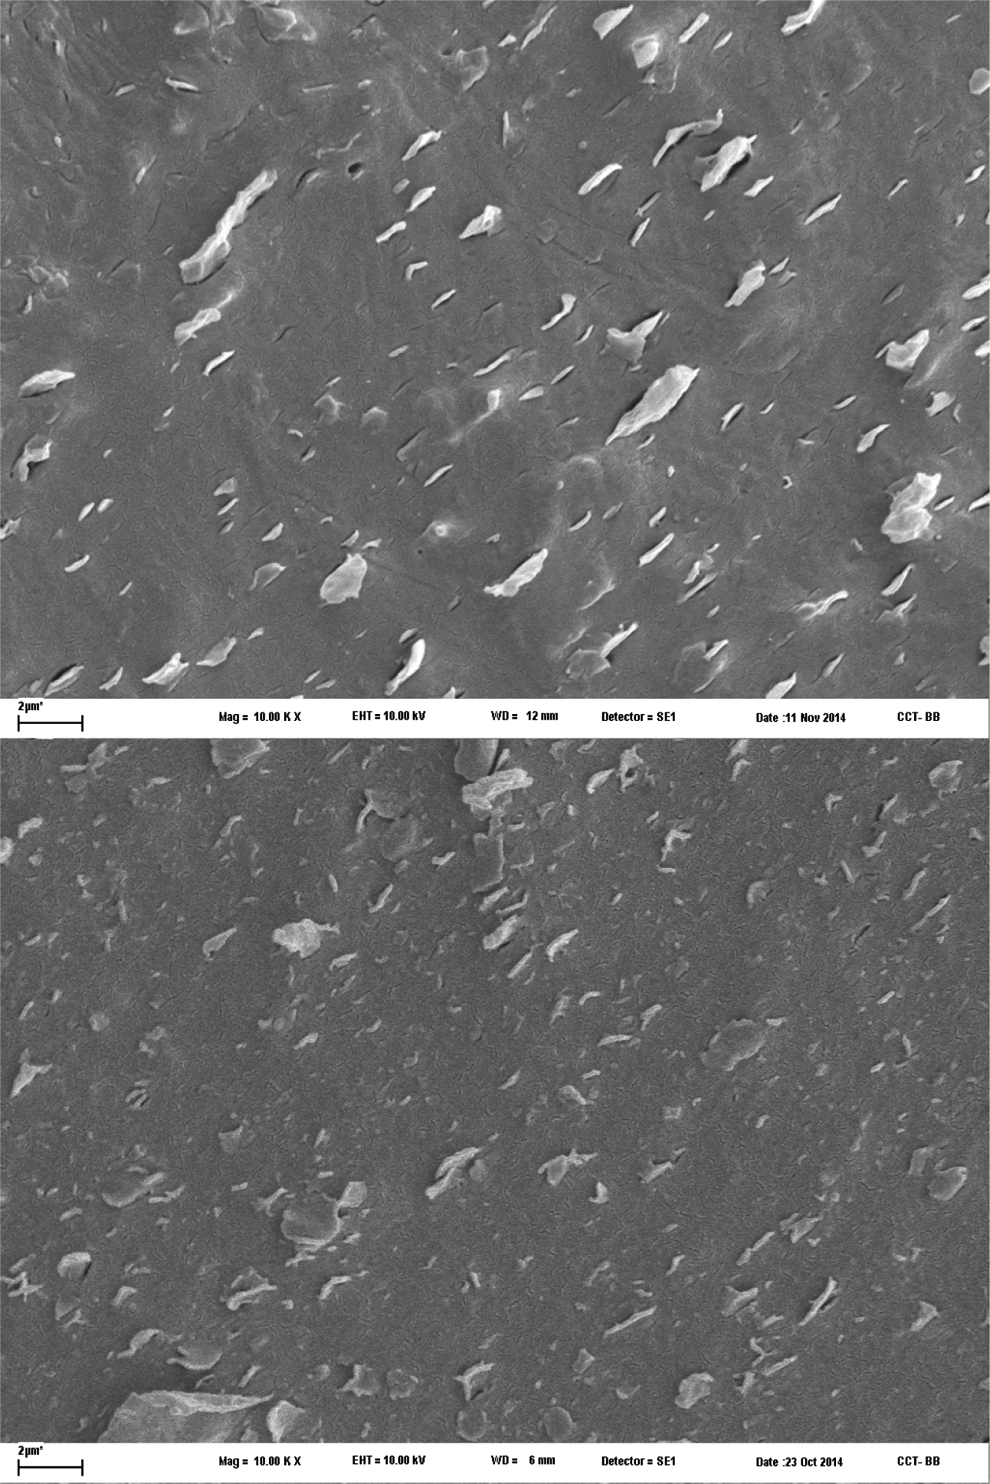
SEM micrographs of C5 (top) and N5 (bottom). Image size: 30.9 × 23.1 µm. SEM: scanning electron microscopic.
To complete the structural characterization of the materials, FTIR spectra of PEBC, the two compatibilizers, and one of the composites were obtained. The samples of the two compatibilizers were previously dissolved in hot xylene, precipitated by adding cold methyl ethyl ketone, and then dried under vacuum at 110°C for 24 h to eliminate possible unreacted maleic anhydride and by-products. Figure 3 displays the spectra region where the peaks associated with the absorbance of carbonyl and methine groups appear. 21 The absorbance at 2720 cm−1, ascribed to the methine groups of the copolymer, was used as a reference to normalize all the spectra.
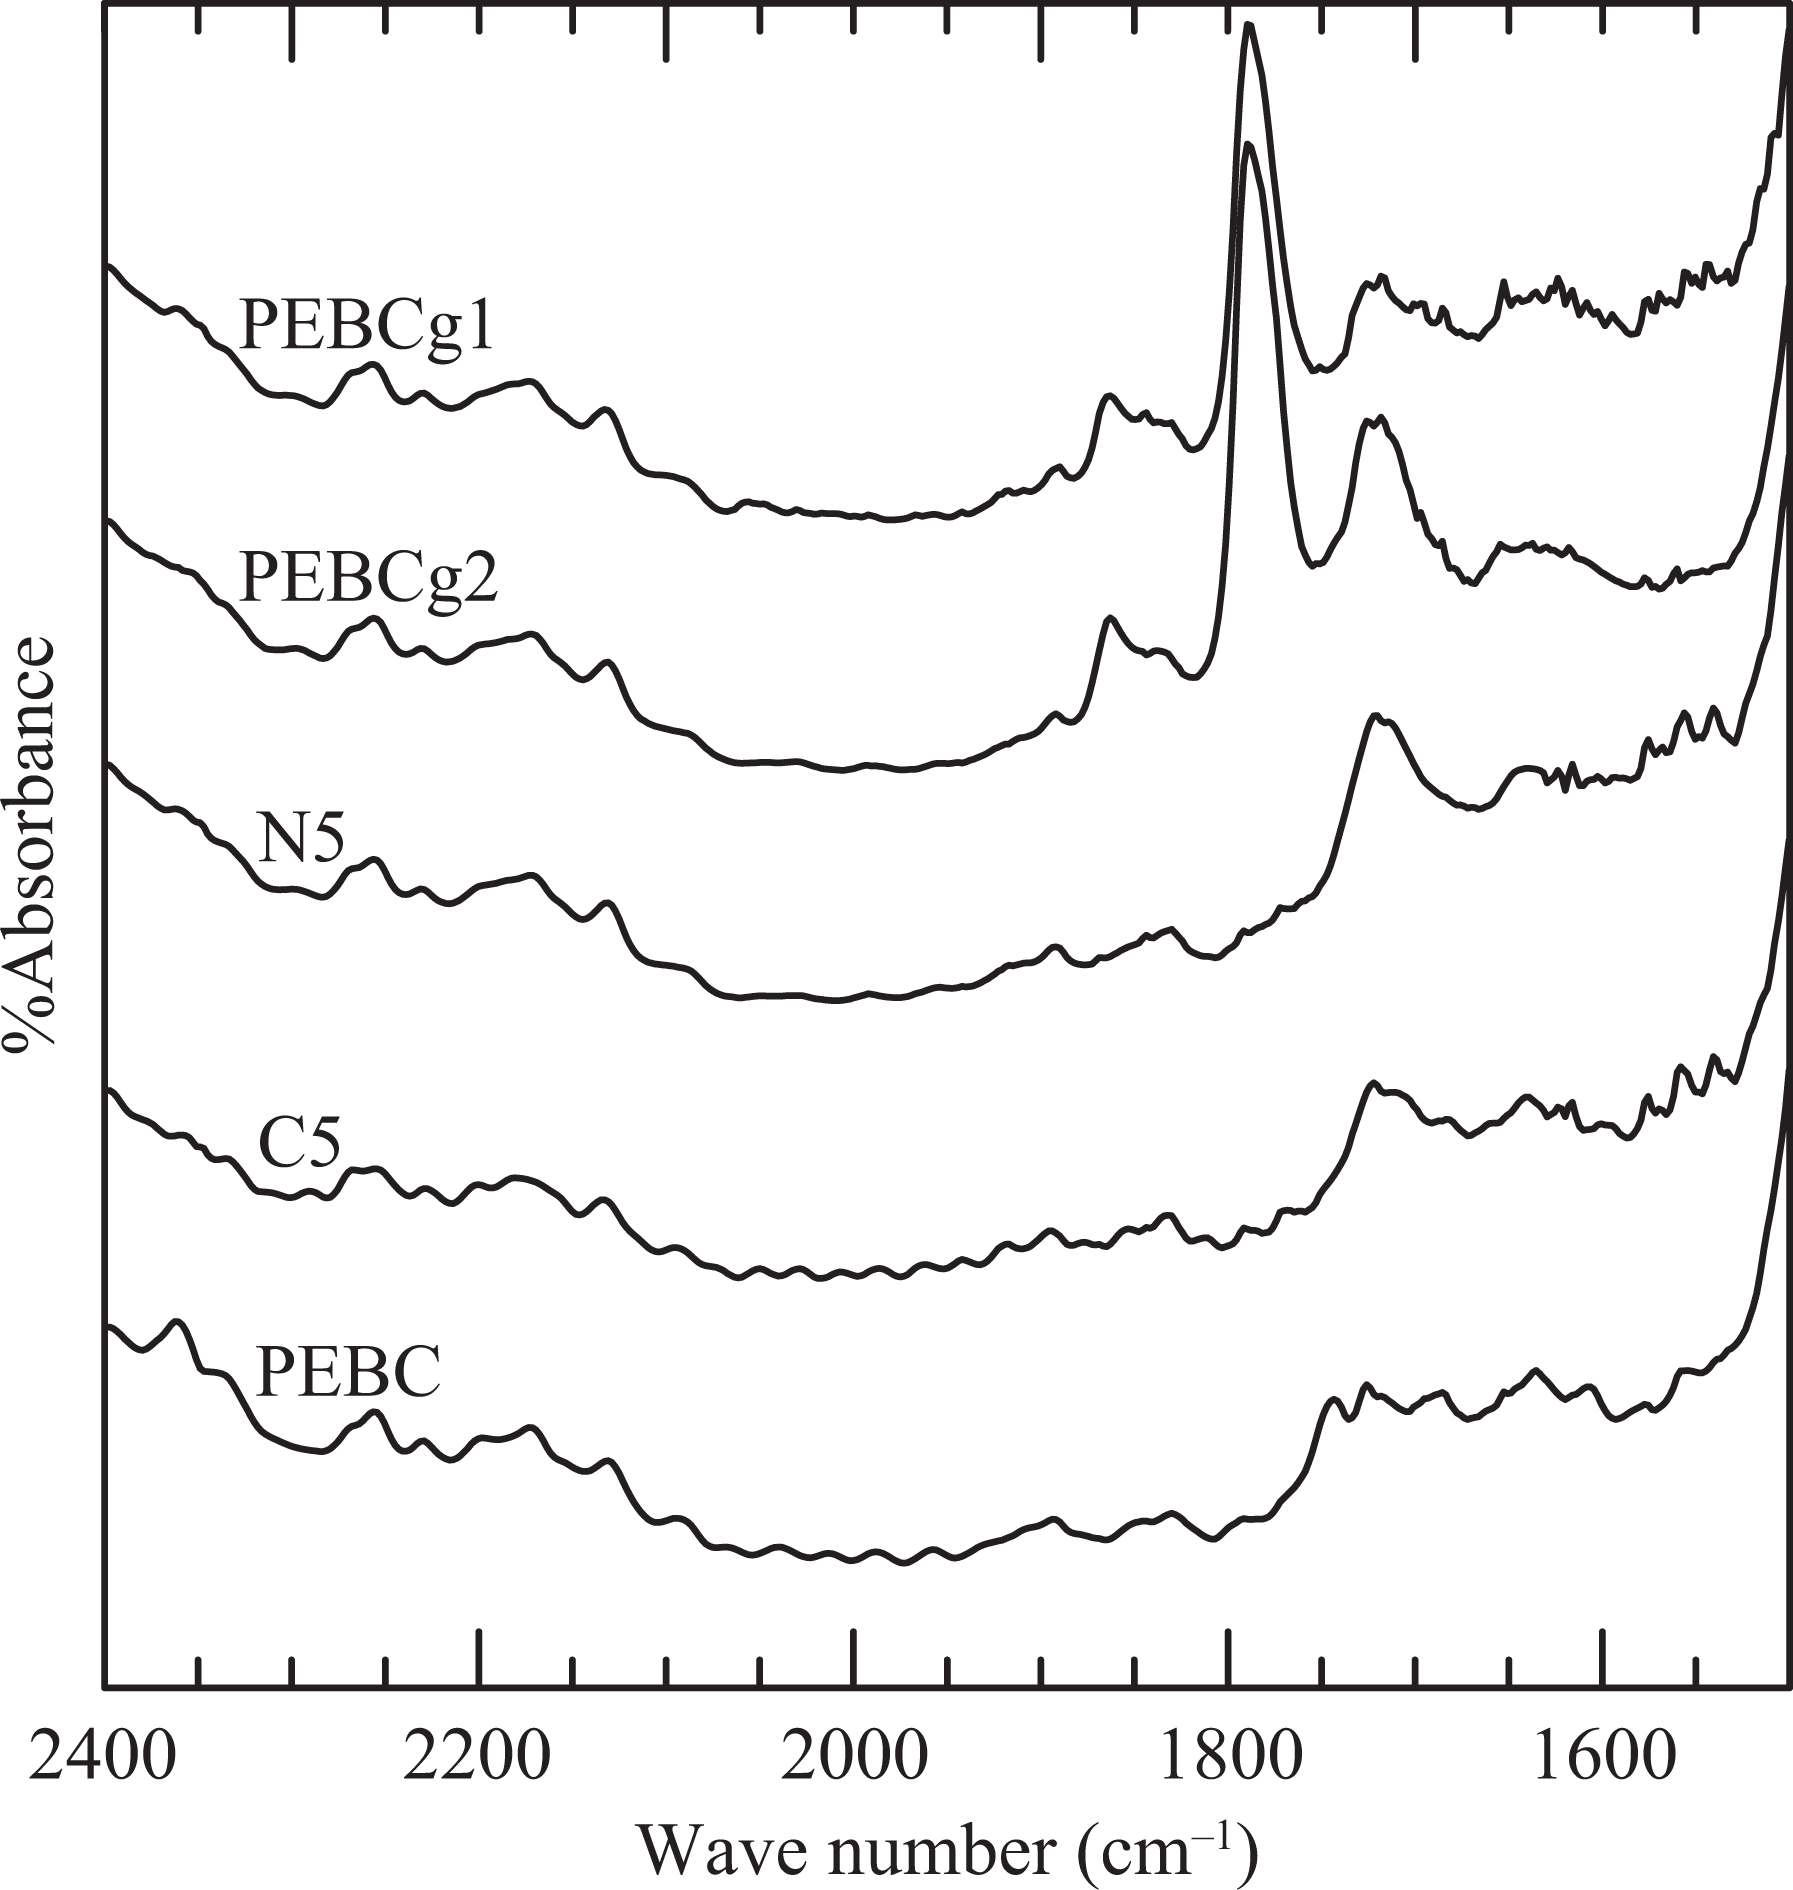
Region of the infrared spectra of selected materials. The curves have been shifted arbitrarily in the y direction.
The two PEBCgs display absorbance bands at 1720, 1792, and 1860 cm−1. The last two bands correspond to the symmetrical and asymmetrical stretching of C=O in the AGs, respectively. The smaller peak at about 1720 cm−1 is usually associated to carboxylic acid formed by the hydrolysis of the anhydride, 8,22,23 but it can also cause carbonyls arising from some degradation of the polymer. 24 PEBC, which was also processed in the Brabender mixer in the same conditions with that of the blends and composites, does not present an appreciable absorbance peak at 1720 cm−1, which is probably due to the absorbance band presented by the compatibilizers that comes from carboxylic acid formed by the partial hydrolysis of anhydride.
To estimate the amount of AGs in the PEBCgs, the absorbance of the peak at 1792 cm−1 (A1792) relative to that at 2720 cm−1 (A2720) is compared with the calibration curve: A1792/A2720 = 1.298 × [wt% anhydride]. This curve was obtained measuring the absorbance of physical mixtures of succinic anhydride with PP in concentrations ranging from 0.2 wt% to 2 wt%. In this way, grafting degrees of 0.4 and 0.6 wt% were estimated for PEBCg1 and PEBCg2, respectively. The fact that the fraction of hydrolyzed anhydrides that might be in both polymers has not been considered means that the calculated grafting degrees have been underestimated. Nonetheless, the grafting degree of PEBCg2 is larger than that of PEBCg1 since, according to the FTIR patterns commented above, the underestimation of AGs is larger in that compatibilizer.
The nanocomposite N5 also displays the absorbance peak at about 1720 cm−1 but not the ones at 1792 and 1860 cm−1 (see Figure 3). The absence of these bands indicates that the AGs of the compatibilizer have been practically consumed during the melt mixing processing, reacting with the ammonium surfactant in the clay or with the clay itself. 16,25,26 The reaction would produce new chemical groups with carbonyls, like carboxylic acids, amides, imides and esters, generating the observed peak at about 1720 cm−1. Moreover, the larger absorptivity of some of these groups in comparison with the anhydride justifies the intensity of this peak even though just 15 wt% of N5 corresponds to PEBCg1. One interesting consequence of the reaction between the compatibilizer and clay/surfactant is that it may contribute to improve the dispersion and delamination of the clay.
Non-isothermal crystallization behavior
The crystallization behavior of all materials was studied by DSC under the conditions already commented. Figure 4 shows the exotherms collected at 10°C min−1 of cooling rate. All polymeric systems display a single crystallization exotherm with similar behavior. The Tcs have values in a range of approximately 7°C (see Table 3) and ΔHc and the degrees of crystallinity (Xc) are practically constant. Values of ΔHc = 63.4 ± 0.4 J g−1 and Xc = 34 ± 0.3% were calculated at this cooling rate, respectively.
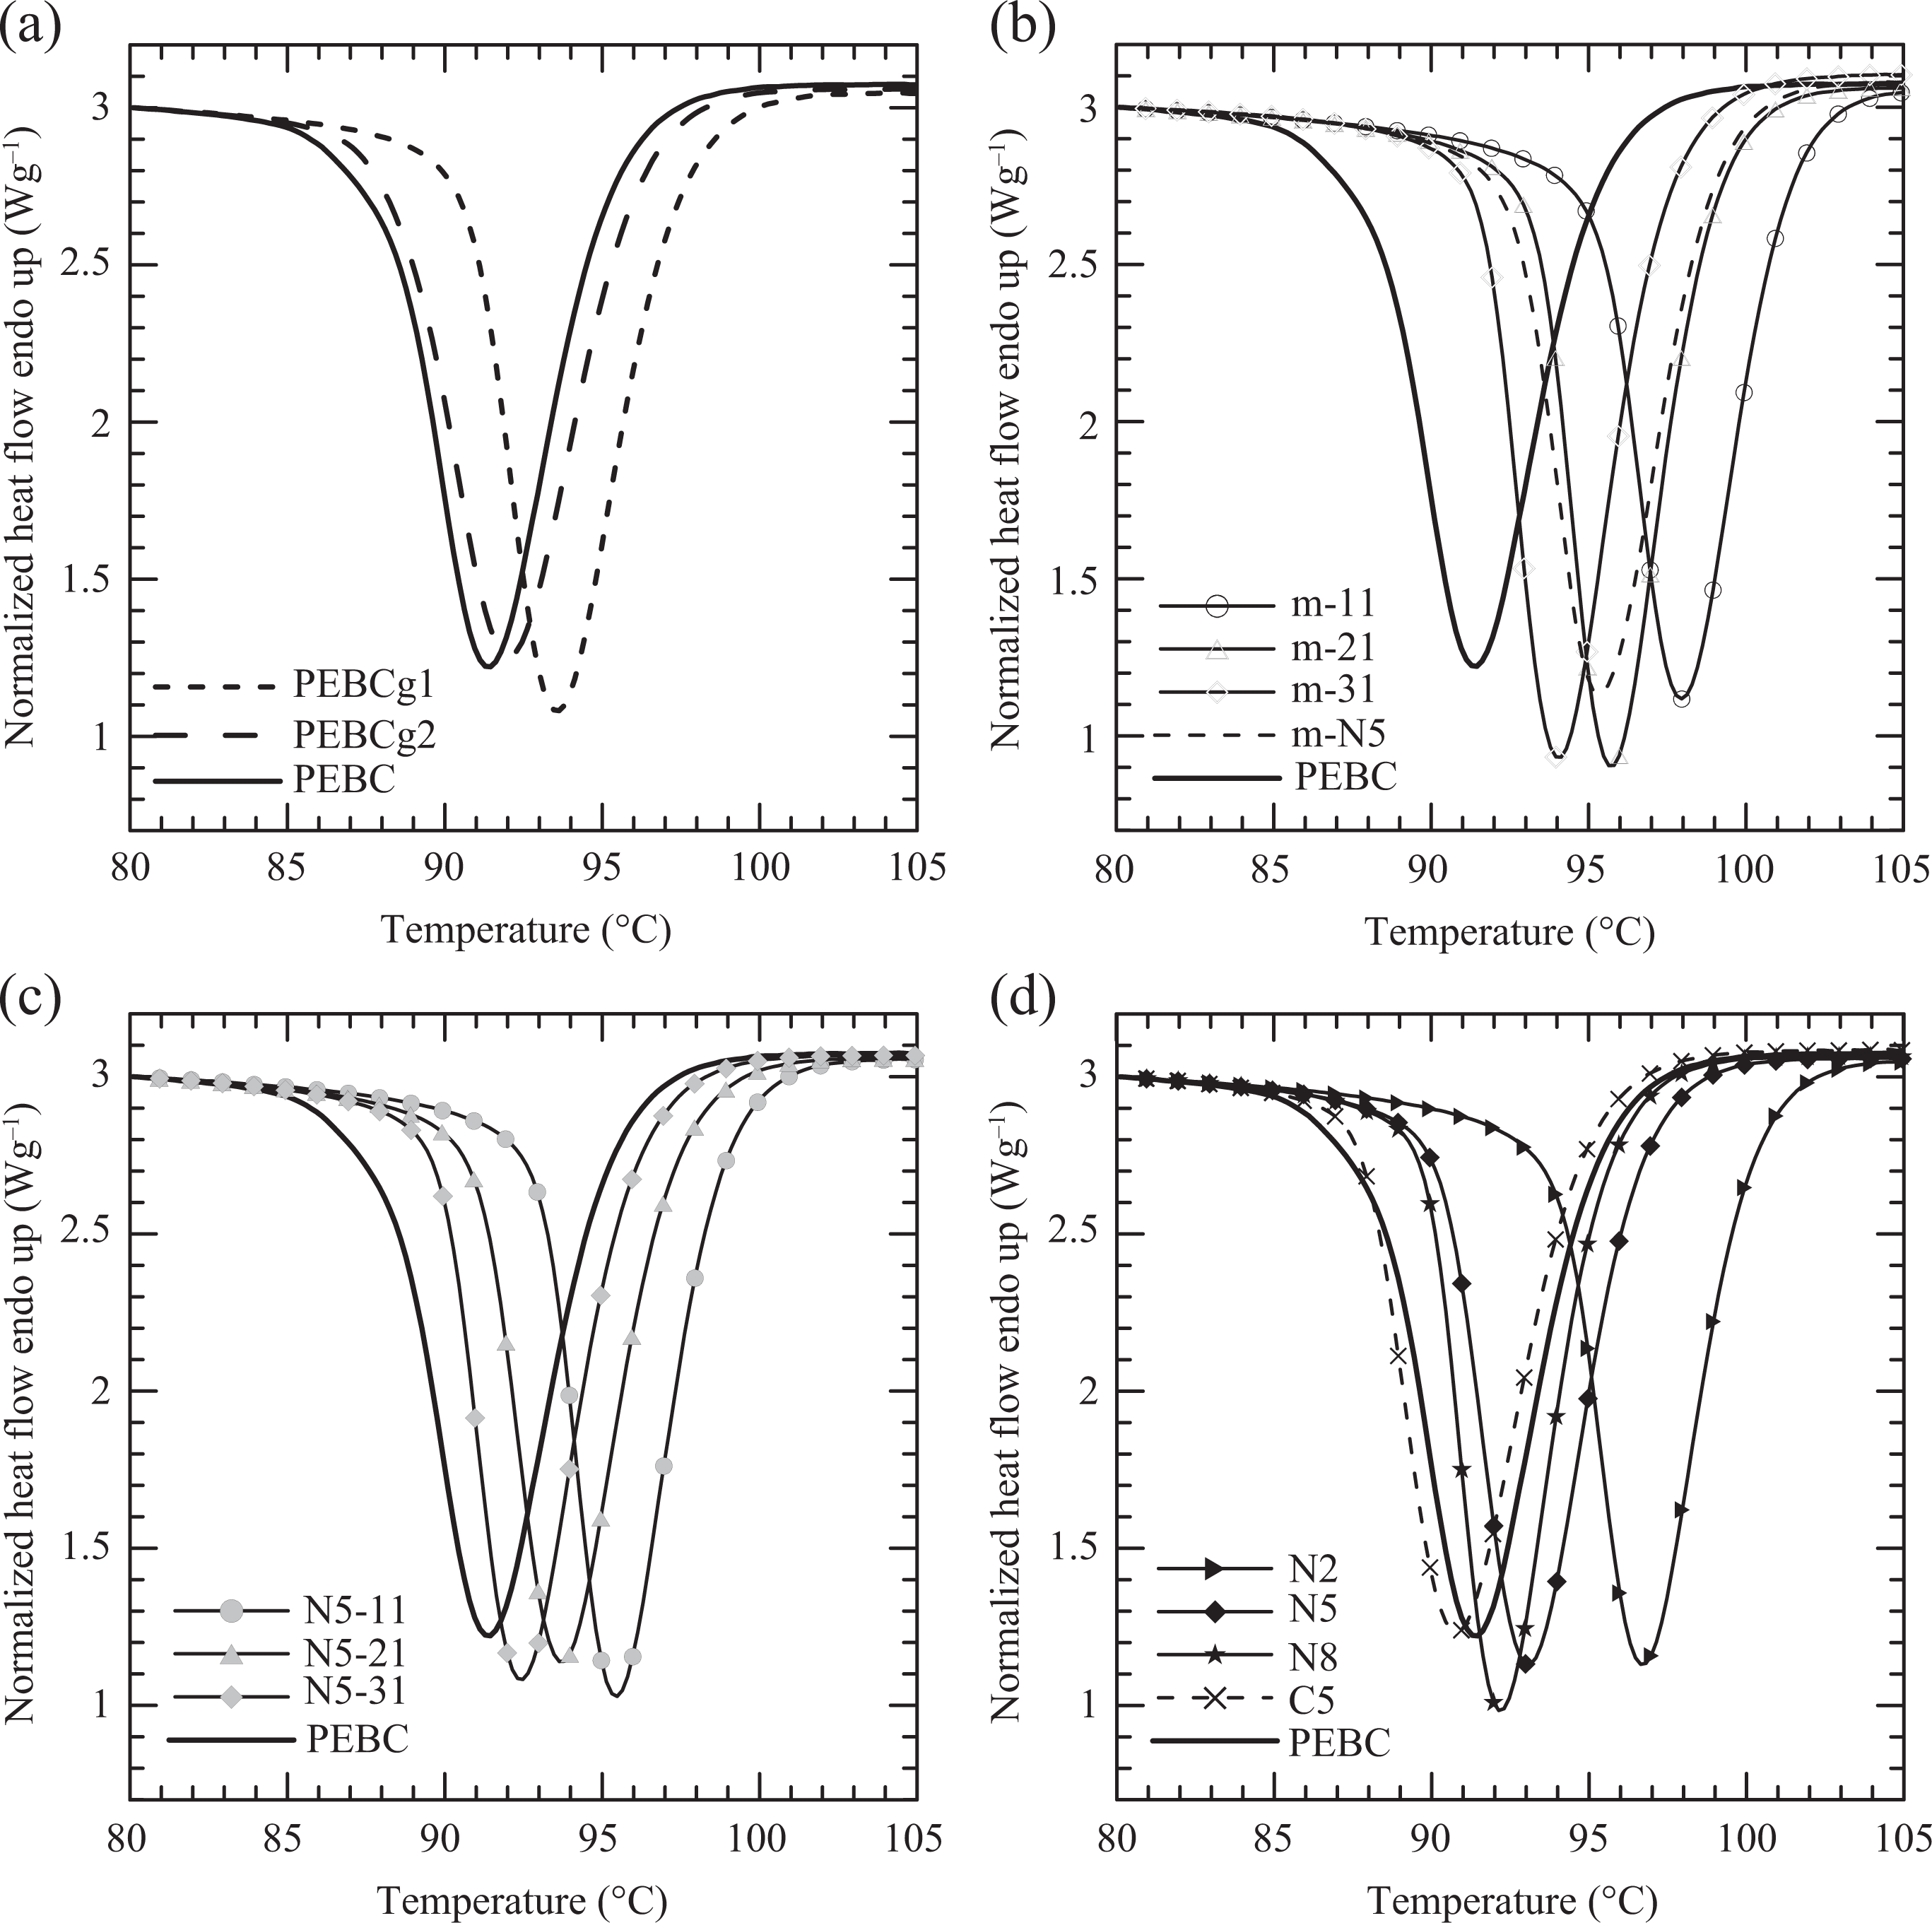
Exotherms of crystallization of all materials.
Data obtained and calculated from DSC tests.a
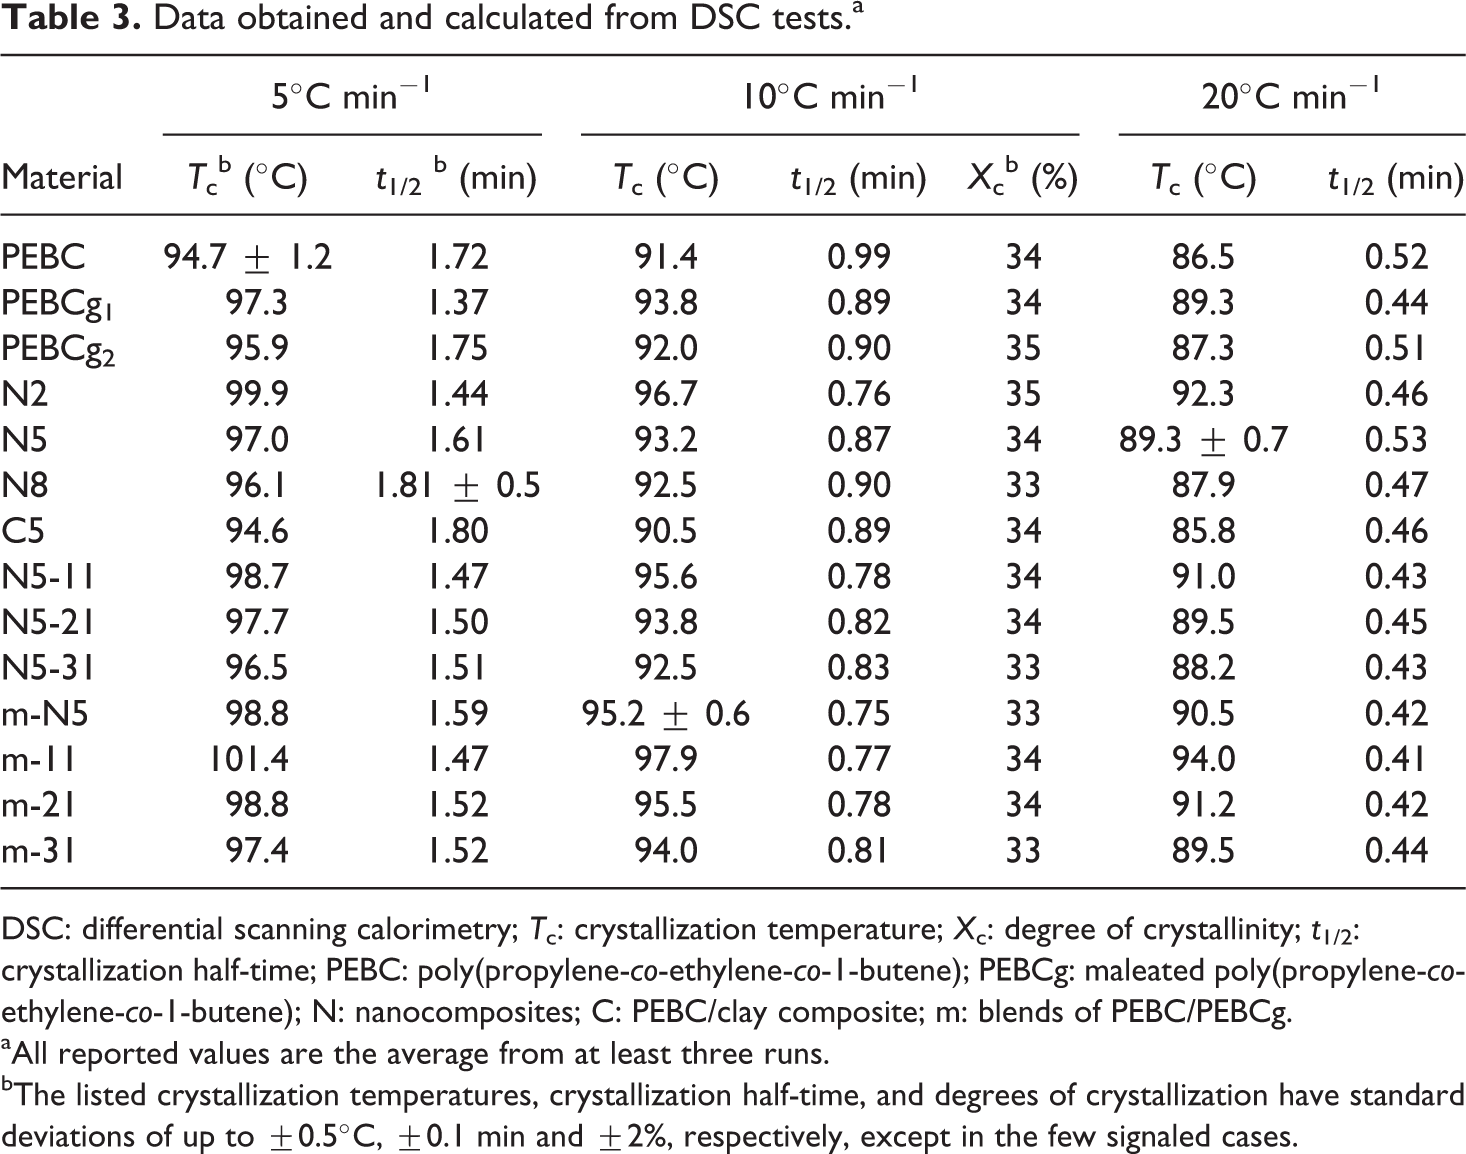
DSC: differential scanning calorimetry; Tc: crystallization temperature; Xc: degree of crystallinity; t1/2: crystallization half-time; PEBC: poly(propylene-co-ethylene-co-1-butene); PEBCg: maleated poly(propylene-co-ethylene-co-1-butene); N: nanocomposites; C: PEBC/clay composite; m: blends of PEBC/PEBCg.
aAll reported values are the average from at least three runs.
bThe listed crystallization temperatures, crystallization half-time, and degrees of crystallization have standard deviations of up to ±0.5°C, ±0.1 min and ±2%, respectively, except in the few signaled cases.
Figure 4(a) shows that the crystallization peaks of the PEBCgs are located at a slightly higher temperature than the pristine copolymer. The nucleating effect of the AGs might be the cause of this behavior. However, PEBCg1, which has the smaller content of AGs, has a slightly larger Tc than PEBCg2. This may be due to the fact that the functionalization of PEBC also produces the scission of macromolecules, as it usually happens with PP and propylene copolymers. 27,28 In the case of PEBCg2, although the AG content is larger than in PEBCg1, the molecular weight is smaller, as it is revealed by the zero-shear rate viscosity measurement (300 Pa·s with respect to 750 Pa·s of PEBCg1). The results in the literature based in PPg show that not only the AG content influence the crystallization process but also the molecular weight and molecular weight distribution of the PPg and the regularity of the chain structure. 24,28 –31 As stated by Berzin and coworkers, 28 it is difficult to derive clear conclusions regarding the crystallization behavior of maleic anhydride-grafted PP since the mentioned parameters may affect the crystallization in different manners.
Figure 4(b) displays the exotherms of the four blends PEBC/PEBCg. All of them have higher Tc than their components. Moreover, as the concentration of PEBCg2 increases, the value of Tc in the blends slightly decreases. These results suggest a positive deviation from the additivity rule, with a maximum deviation at a low concentration of compatibilizer, near 5 wt%. This type of behavior has also been observed in blends of PP/PPg and adjudicated to phase separation or co-crystallization. 32,33 It should be mentioned that, in the present case, the blends PEBC/PEBCg also present a rheological behavior that corresponds to immiscible blends (viscosity slightly larger than the components at small frequencies), as it will be commented in a following paper. Figure 4(b) also shows that the blends m-N5 and m-31, both with a 3:1 ratio of PEBC to compatibilizer, have Tcs that keep the relative position of those of the corresponding PEBCgs with respect to PEBC. That is, the Tc of m-N5 and m-31 are 2°C and 1.5°C larger than those of PEBCg1 and PEBCg2, which are 1.8°C and 1.1°C larger than that of PEBC. These increments in Tc are small, but they show the same trend.
The addition of clay reduces the Tc of the matrices in about 2°C (compare Figure 4(b) and (c). In fact, the clay itself produces a marginal shift in the crystallization of the copolymer toward smaller temperatures, as it may be observed in the exotherm of C5 in Figure 4(d). This last figure also displays the exotherms of the three nanocomposites with different clay concentrations. It can be observed that, as the clay concentration augments, keeping the 3:1 ratio of compatibilizer/clay, the peak shift toward smaller temperatures, in agreement with the behavior of the blends. In general, dispersed clay particles play two opposite roles during the crystallization of a polymer matrix: as a nucleation agent and as a physical hindrance, depending on the type, content, and dispersion state of the nanoclay. 34 –36 The interfering role of the clay is due to interactions with the polymer, which restrict the movement of the macromolecules, shifting the crystallization to lower temperatures and reducing the crystallization rate. In particular, as it was already commented, in the system under study, the synthesis of the composites produces the disappearance of the AGs as a consequence of a reaction that seems to take place between the o-MMT and PEBCg. This indicates a change in the matrix composition with respect to the equivalent blends (the matrixes are then more similar to pure PEBC) and a reduction of nucleation points that, altogether, gives place to the observed shift in the range of crystallization process.
There are some studies in the literature that consider the nonisothermal crystallization behavior of PP/PPg/o-MMT systems with clay and concentration range similar to the ones used in this article and that analyze also the behavior of the corresponding PP/PPg blends. 37 –40 In most of these cases, it is observed that the Tc of the blends is 2°C to 5°C higher than that of the PP and that the presence of nanoclay particles affects very little, or even slightly reduce, the Tc of the blend. 37,39,40 In particular, Wang and coworkers 38 observe that, although the addition of 0.5 wt% of N44 to a 90:10 PP/PPg blend increases Tc in 4°C, the further addition of clay up to 5 wt% gradually decreases Tc in 2°C. The most noticeable difference between the cited works and the behavior of the PEBC system is with respect to the effect of addition of clay to the pristine polymer. Normally, in the case of PP/clay composites an increase in Tc of 5 to 13°C has been observed, 34,37,39,41 –44 although cases of smaller increase or practically no change have also been reported. 36,40,45,46
Similarly, studies based on polyethylene (PE)/malleated polyethylene (PEg)/o-MMT, which consider a clay and the amount of components similar to the ones used in this article, observe small or practically no change in Tc with the addition of clay and/or PEg. 46 –50 Moreover, the highest Tc of the system frequently is that of pristine PE. During the study of nanocomposites based on a propylene copolymer with 3 wt% of ethylene, Liu and coworkers 14 found that the composition practically does not affect the value of the Tc or Xc of the materials. It is interesting to notice that the behavior of the PEBC system analyzed in this work falls in between those of the PP and PE nanocomposites.
The crystallization behavior was also studied at different cooling rates. Table 3 summarizes the values of crystallization peak temperatures calculated from exotherms recorded at 5, 10, and 20°C min−1. The Tcs corresponding to 5 and 20°C min−1 follow analogous trends than those obtained at 10°C min−1 and already commented. The crystallization behavior of all systems at each cooling rate is still very similar. The values of Tc, as expected, always decrease with increasing cooling rate 51 and are still in the range of 7°C or 8°C at each rate. Both ΔHc and ΔHm, not shown here, are practically not affected by the composition of the materials. Average values of ΔHc of 65.1, 63.4, and 61.4 J g−1 were obtained at 5, 10, and 20°C min−1, with standard deviation of 1.0, 0.4, and 0.6 J g−1, respectively. This behavior of the enthalpies, that is, practically no change with the type of material at a given cooling rate, implies that all polymers and composites present also similar Xc values that decrease with cooling rate.
In the literature, some changes are observed in the ΔHc and Xc of PP or PE with the addition of clay, but they are also rather small. Changes smaller than −4/+9 kJ mol−1 and +/−5% have been found with the addition of up to 8 wt% of o-MMT or using up to 20 wt% of compatibilizer with up to 5 wt% of o-MMT. 14,34,41,43 –45,48,50 Modesti and coworkers 39 also found practically no effect of clay and PPg concentration on the value of Xc among blends and composites, but they observed an increase of 20% in Xc with respect to the low Xc of their PP. Another disagreement with the results above is presented by Yuan and coworkers. 49 They observed a gradual decrease of up to 30 kJ mol−1 with the addition of up to 8 wt% of N44 to linear low-density PE.
To evaluate the effect of molecular structure on the kinetics of the crystallization process, the crystallization enthalpy ratio (α) was calculated as a function of time by the accumulative integration of crystallization curves divided by the total ΔHc. The time (t) is calculated from the measured temperature through the cooling rate. All curves of α(t) have the typical S-shape corresponding to a nucleation stage, followed by crystal growth. From these curves, the crystallization half-time (t1/2), can be calculated. The t1/2 is defined as the time when the material reaches 50% of its crystallization. The values of t1/2, which are listed in Table 3, display similar trends than the Tc. That is, the presence of the modifiers slightly decreases the value of t1/2 of PEBC (approximately 0.2 min at 10°C min−1), while the addition of clay marginally increases back the t1/2. Moreover, as the clay concentration increases, the t1/2 also slightly increases, signaling a reduction in crystallization rate. The observed slight reduction in t1/2 may be caused by restrictions in molecular diffusion caused by the presence of clay particles. Additionally, as expected, t1/2 decreases as the cooling rate increases, signaling a faster crystallization. The competing effects of compatibilizer and clay, and the changes in chemical structure produced during processing, affect the nucleating stage and give rise to the observed changes in the value of t1/2, even if small. In the literature, t1/2 of PP and PE usually decreases with the addition of o-MMT implying the nucleating role of nanoclay particles, 34,45,49,52 but it has been reported to increase when nanoparticles are added to PPg. 53
Following the approach suggested by Vyazovkin, 54 the activation energy of crystallization (Eα) can be estimated from the α(t) curves obtained at different cooling rates using the following equation:
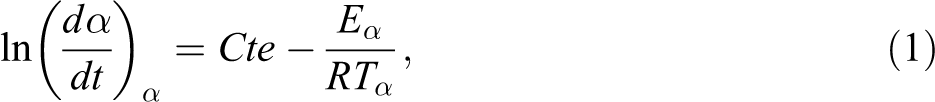
where (dα/dt) α and T α are the rate of crystallization and the temperature at a given level of crystallization α, respectively, and R is the universal gas constant. This iso-conversional method yields the value of Eα as a function of α conversion. Eα is calculated from the slope of the semilog plot of (dα/dt) α as a function of T α . This procedure assumes that the crystallization process is the same at all cooling rates at a given value of Xc and not over the overall temperature interval where the crystallization process occurs.
The calculated values of Eα of all polymers, blends, and composites are displayed in Figure 5 following the same organization than in Figure 4. The negative value of Eα indicates that nucleation is the controlling mechanism. PEBC presents the largest activation energy of crystallization in all range of crystallization enthalpy ratio, which means that PEBC presents the slowest rate of crystallization. Moreover, all materials have values of Eα that increase with α at low range of crystallization enthalpy ratio. The increasingly restricted mobility of the macromolecules as the level of crystallinity augments (lower temperatures) is the reason of this behavior. At crystallization enthalpy ratios above 40–50%, a change in trend can be appreciated, implying that a new mechanism (secondary crystallization) starts to affect the crystallization. The value of Eα of PEBC at a given crystallization enthalpy ratio, for example −145 kJ mol−1 at 20%, is larger than some reported in the literature for PP and HDPE (−200 and −220 kJ mol−1, respectively 34,55 –57 ).
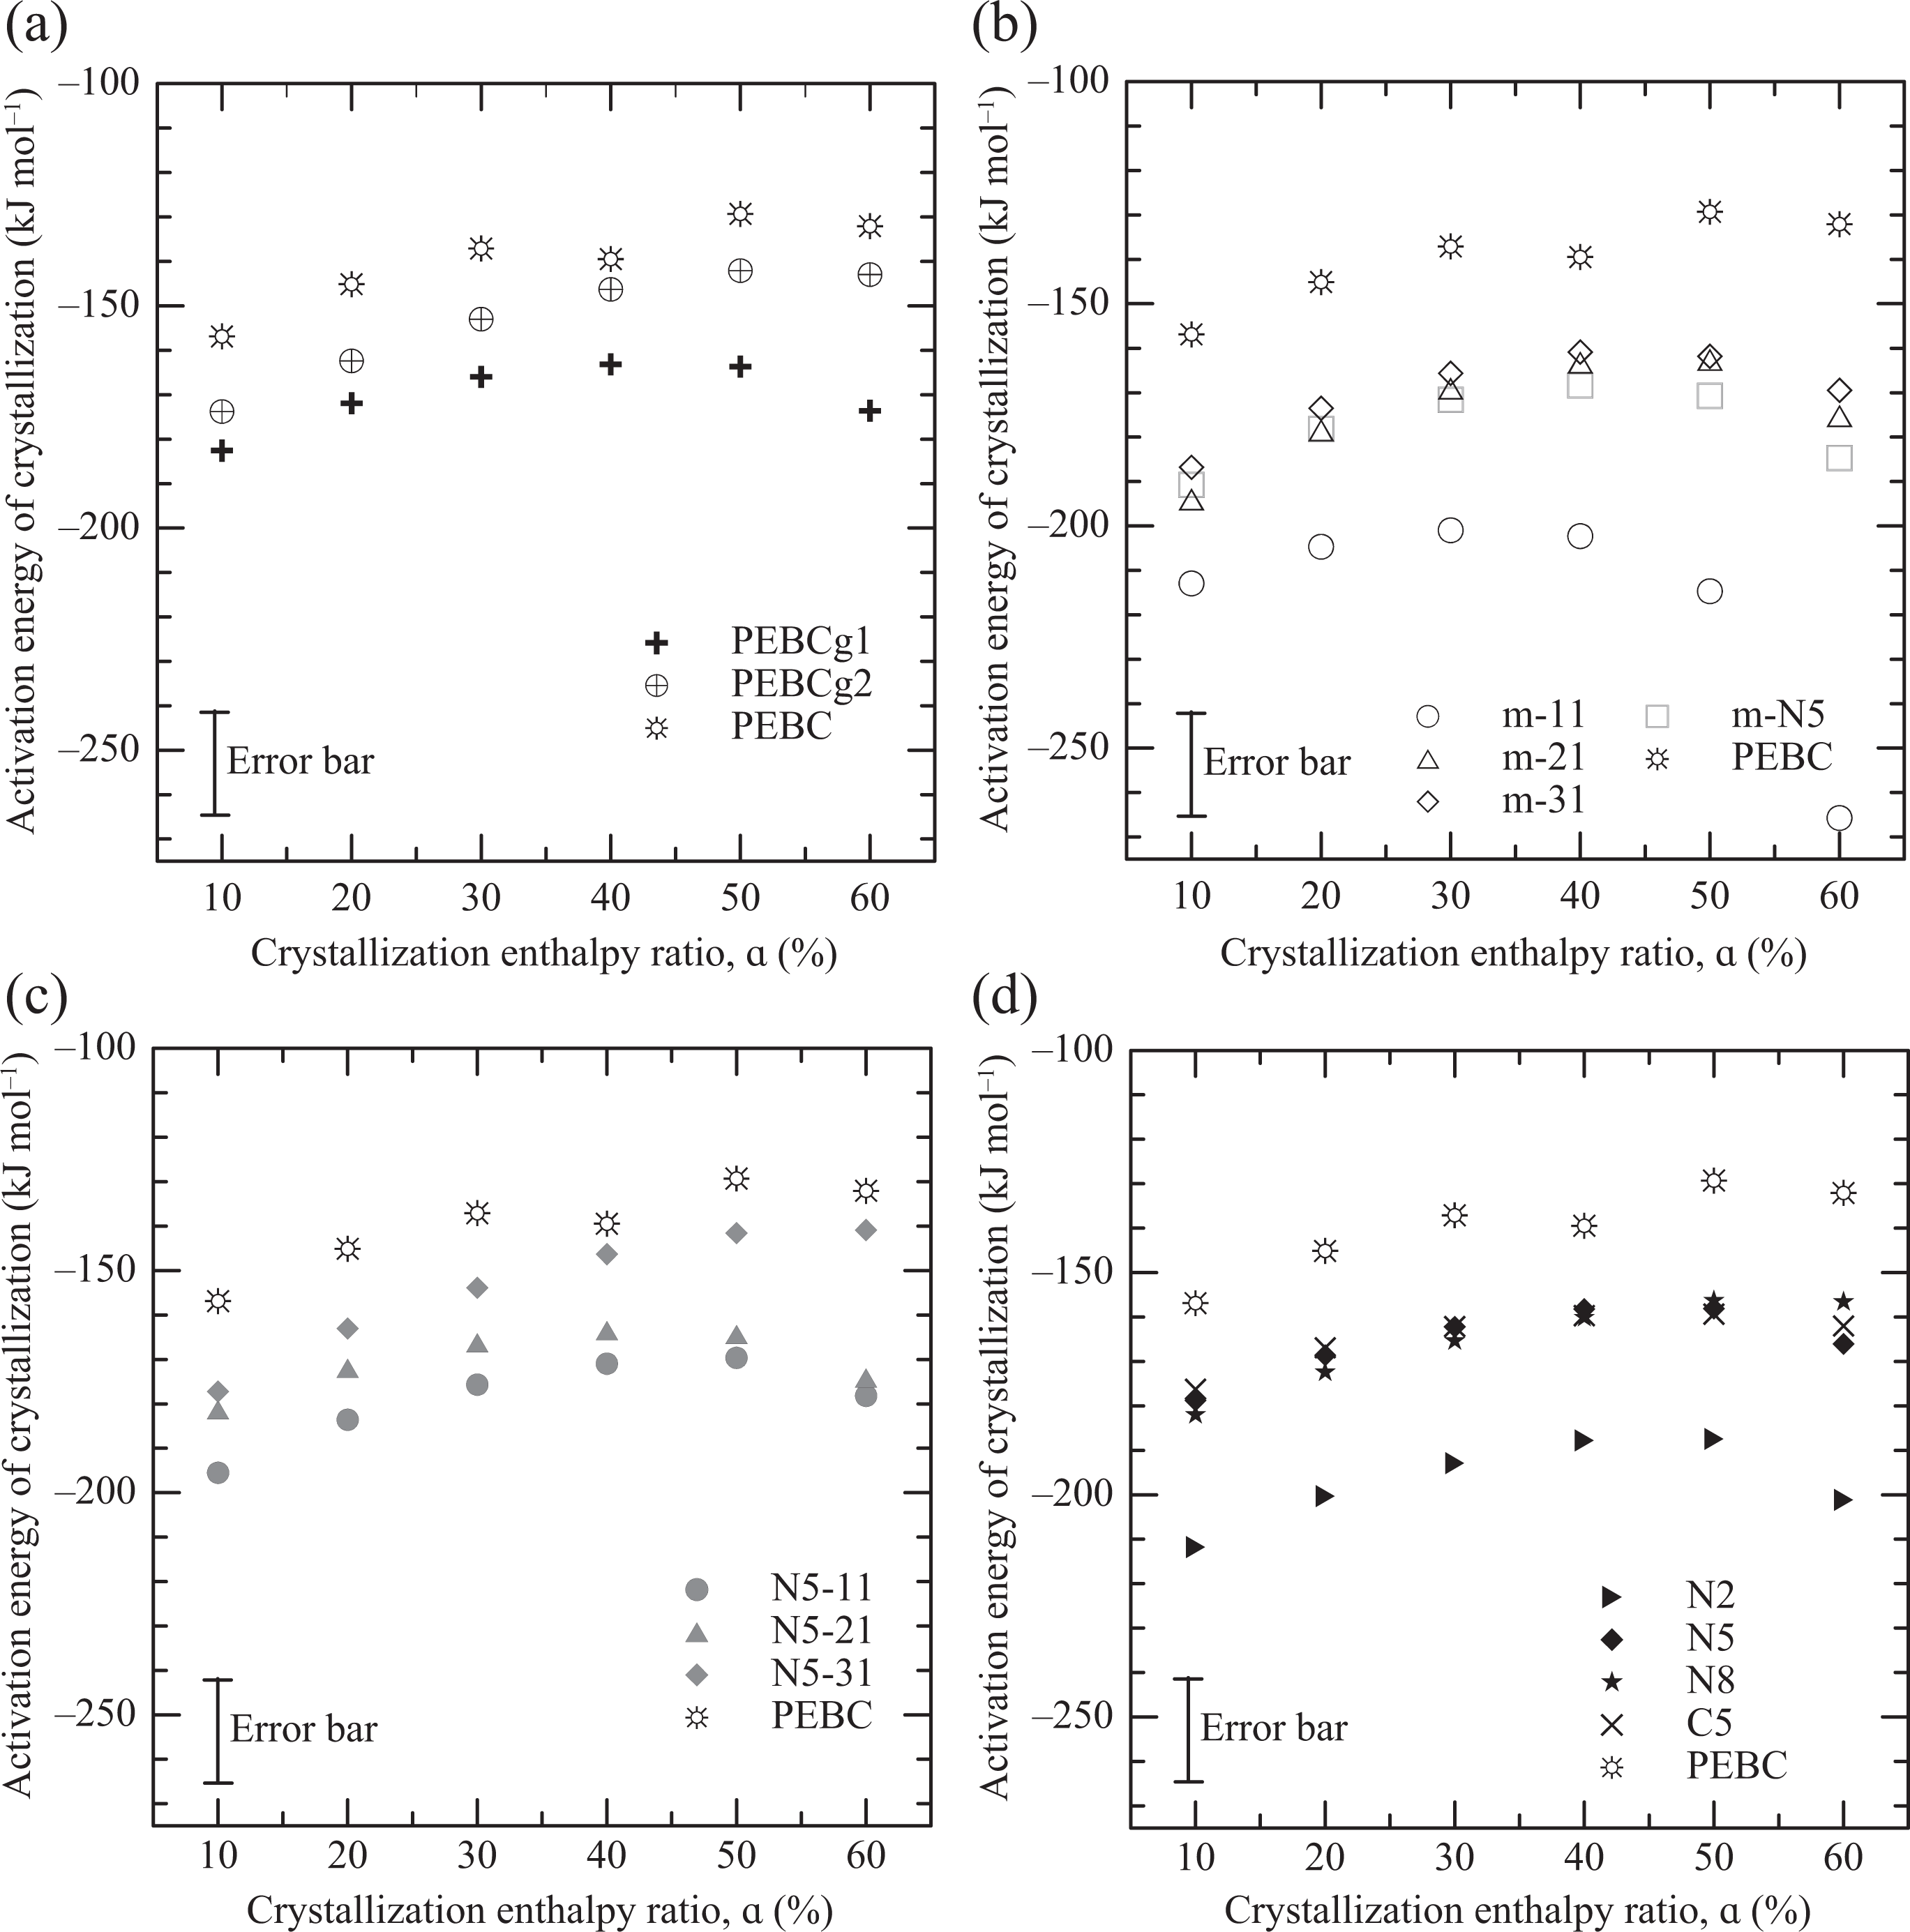
Activation energy of crystallization as a function of enthalpy ratio of crystallization of all materials.
The effect of composition on the activation energy of crystallization at all values of α is analogous to the one on the Tc described in association with Figure 4. That is, both compatibilizers have lower Eα than PEBC, being PEBCg1 the one that has the lowest one (Figure 5(a)); and the blends PEBC/PEBCg2, as well as the one prepared with PEBCg1 (m-N5), have values of Eα that are lower than their components; m-31 has an activation energy of crystallization that is slightly lower than the one of m-N5 (Figure 5.b); the Eα of the blends increases as the concentration of PEBCg2 augments; and the addition of clay further slightly increases the activation energy (Figures 5(b) and 5(c)). Nanocomposite N2 has the lowest activation energy of crystallization meaning that the material that crystallizes the fastest (Figure 5(d)). The nucleating effect of the AGs and the clay, and the differences in molecular weight and changes in chemical structure of the polymers, justify the relative values of the Eα of the PEBC system, as already commented in relation with Tc. Moreover, the addition of clay to the pristine copolymer (C5) also produces a small reduction of Eα due to the nucleating effect of the nanoparticles. The same behavior has been seen when adding o-MMT to PP or PE. 34,45,49,52 Moreover, Yuan and coworkers 34 obtained a decrease of 29 and 5 kJ mol−1 in the Eα of PP when using 4 and 8 wt% of o-MMT, respectively, which is comparable to our observations.
Thermal degradation behavior
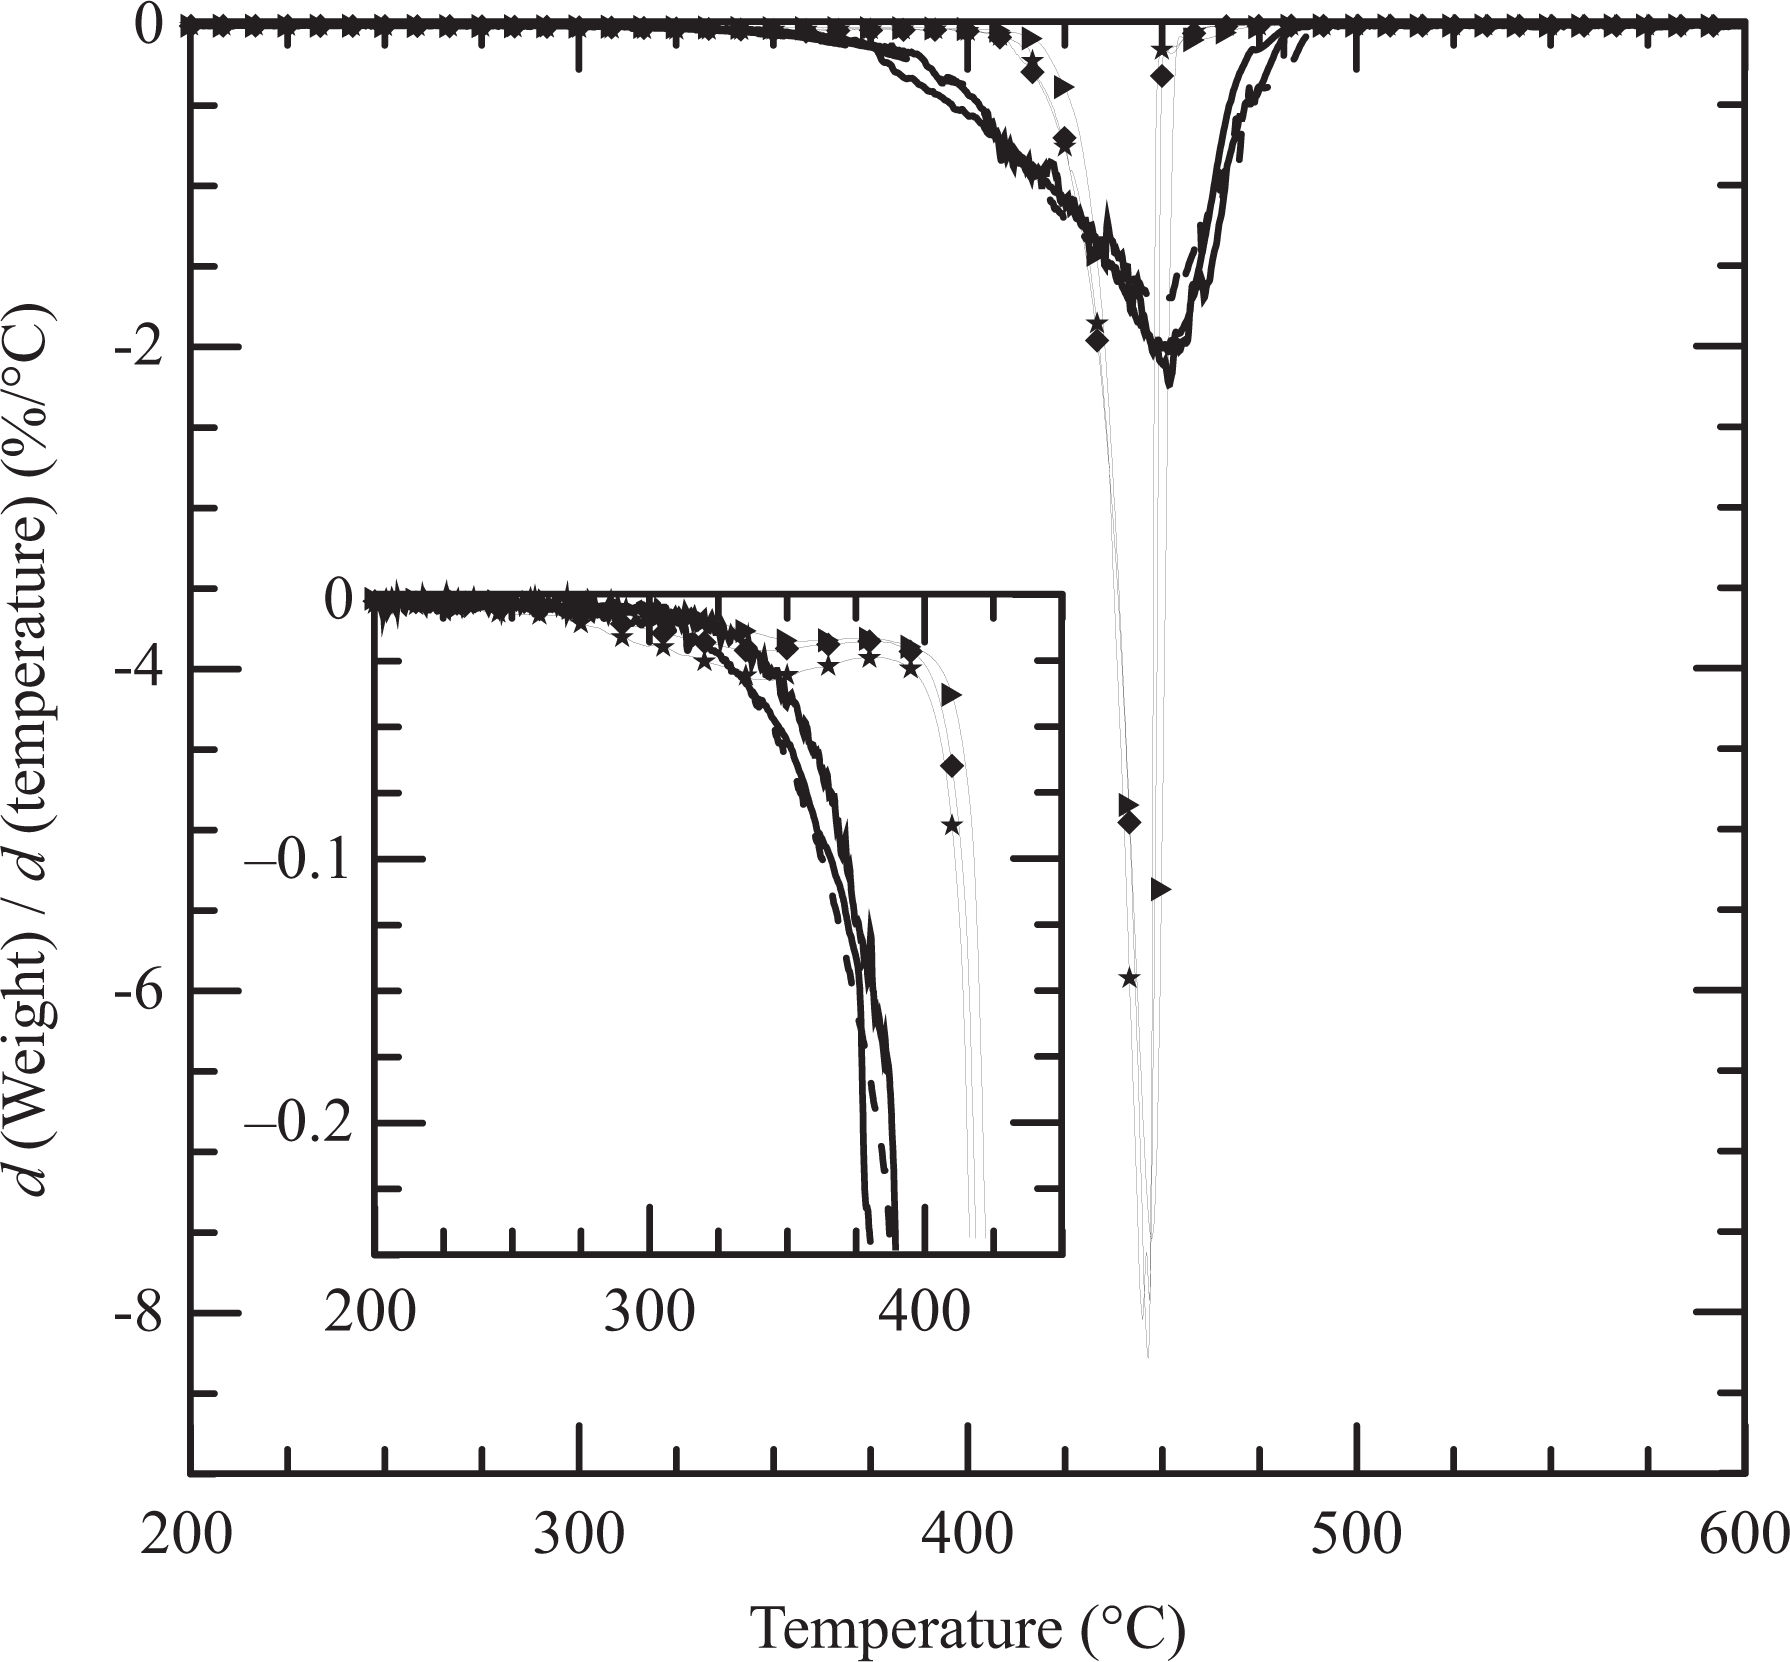
Another study that was carried out is the non-oxidative degradation of all materials using TGA performed under nitrogen flow. Figure 6 displays the degradation curves up to 600°C of the clay, PEBC, and all materials based on PEBCg1. The dried o-MMT displays two stages of weight loss, one starting at approximately 200°C associated with the degradation of the organic material and the other, not shown in the figure, above nearly 500°C produced by the dehydroxylation of the aluminosilicates. 15,39 The copolymer and PEBCg1, as well as the blend m-N5, have very similar decomposition processes that begin around 300°C and end at approximately 480°C. The degradation of the composites, on the other hand, begins approximately 40°C after the polymers (at about 340°C) and ends approximately 40°C before (around 440°C). That is, the presence of the clay retards the beginning of the degradation of the polymer and accelerates the process. These observations are highlighted in Figure 7, where the derivatives of the curves in Figure 6 are presented. As it can be observed, the rate of degradation is approximately four times larger in the composites. It also shows that the degradation of the three composites takes place in about 40°C while that of the polymer and the blend in about 120°C. Similar results have been obtained by other authors when considering RPC or PP composites based on clays similar to N44. 8,15,33,38,39,44,46,58 It is generally argued that the thermal stability enhancement, which is followed by increase in the rate of degradation with clay loading, is a consequence of the fine dispersion of layered clay and to the restriction imposed by the presence of the silicate layers to the diffusion of the degraded products. In particular, Wang and coworkers 38 found that the use of low concentrations of o-MMT (0.5 and 1 wt%) produces a decrease in the value of Td of the PP/PPg blend, while the use of larger clay contents gives place to a mesoscopic filler network that reinforces the thermal stability.
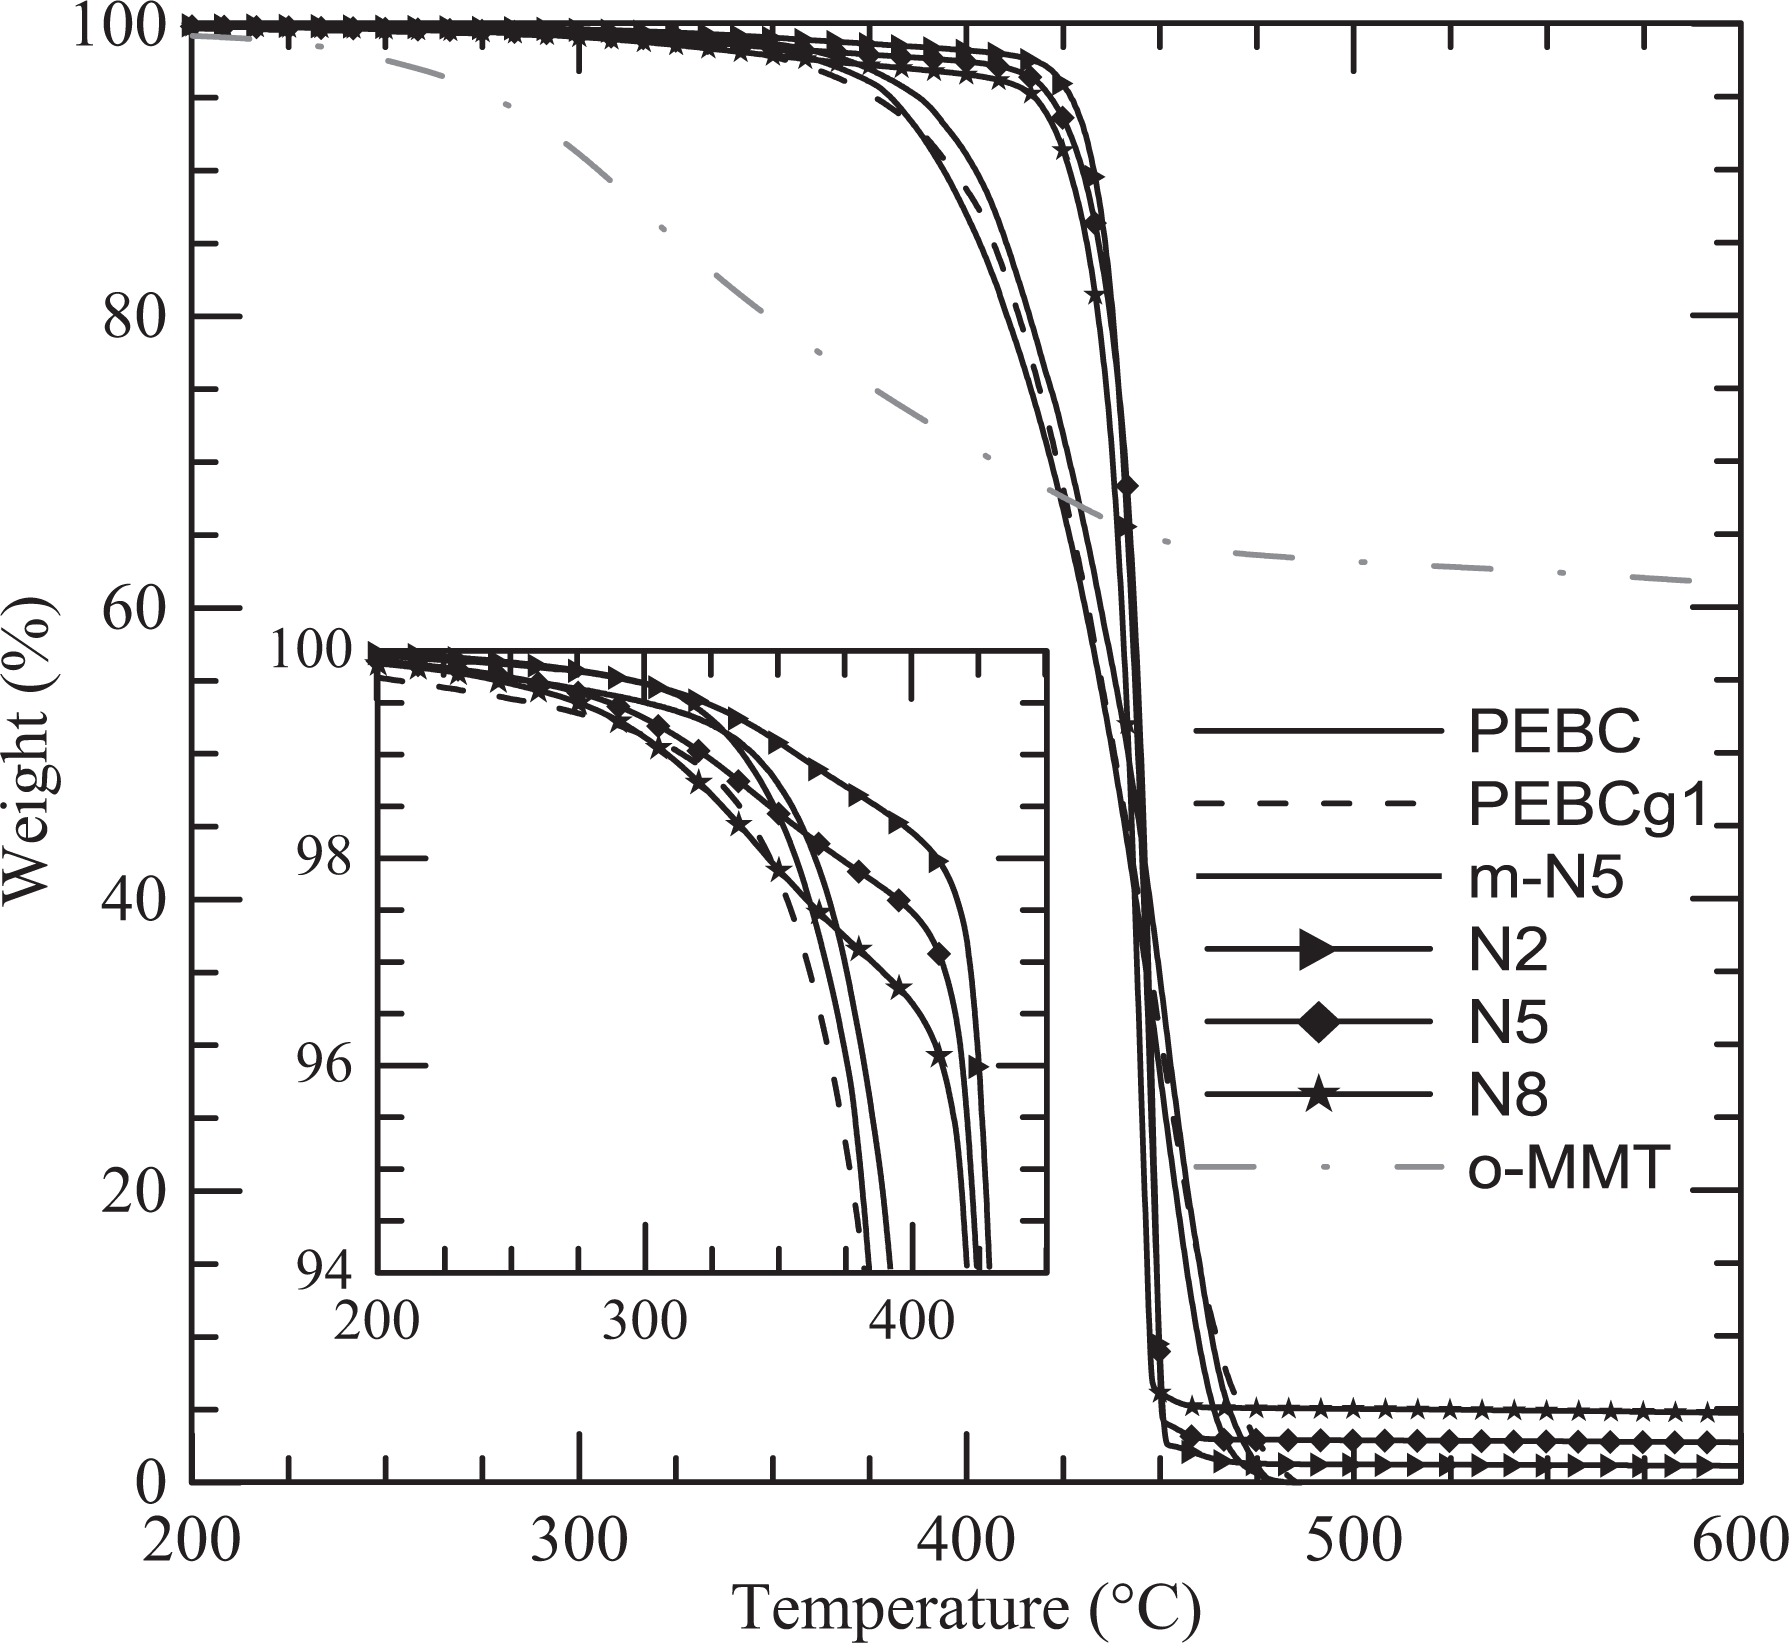
TGA curves of selected materials obtained at a heating rate of 10°C min−1. TGA: thermogravimetric analysis.
The curves in Figures 6 and 7 also show that the degradation of the composites involves two stages, the first associated to the surfactant present in the clay and the second to the polymers. Furthermore, it can be observed that the weight lost during the initial stage of degradation is similar to the theoretical amount of organic material in the clay (i.e. 0.7, 1.8, and 3 wt% of the composites for 2, 5, and 8 wt% of clay, respectively). This result and the coincidence of the curves after this initial stage of degradation (above 410°C) suggest that all the organic material in the clay degrades before most of the polymer. Finally, as it can be observed in Figure 6, the degradation of the clay leaves a residue that corresponds to its inorganic fraction (approximately 63 wt%). In accordance, the degradation of the nanocomposites gives place to a residue that augments with the clay content. As it can be observed, the residues of N2, N5, and N8 are close to the nominal inorganic fractions, that is, 1.3, 3.2, and 5.0 wt%, respectively.
Concluding remarks
The results presented in this work show that nanocomposites can be obtained from melt blending PEBC with o-MMT using PEBC functionalized with maleic anhydride (PEBCg) as compatibilizer. The mixing process produces the exfoliation of clay particles in platelets and small tactoids that are homogeneously distributed in the polymeric matrix, being the presence of the compatibilizer key to achieve that exfoliation. The phase structure of the nanocomposites seems not to be affected by the grafting degree of maleic anhydride (0.4–0.6 wt%) and molecular weight of the compatibilizer in the ranges considered in the work. This is very convenient from the manufacturing point of view since the final product would not depend on small fluctuations in the characteristics of the compatibilizer.
The copolymer, nanocomposites, and blends display practically the same degree of crystallinity, which slightly decreases with cooling rate. Regarding the crystallization temperature, as well as the rate of crystallization, they slightly increase in the composites, being the effect less noticeably as the clay concentration augments. This is due to competing effects of clay and compatibilizer on the nucleating stage as well as to the reduction in concentration of AGs produced during processing. The Eα displays an equivalent trend. Moreover, the dispersed clay particles retard the beginning of the degradation of the polymers in about 40°C, enhancing the thermal stability of the system, when tested under nitrogen atmosphere. The degradation of the composites takes place in a range of about 40°C while that of the polymer and the blends occurs in about 120°C. This is a consequence of the fine dispersion of layered clay and the restriction imposed by the presence of the silicate layers to the diffusion of the degraded products.
The above results show that nanocomposites can be obtained from PEBC, potentially extending its range of applications and that these composites display slightly improved processing conditions with respect to the pristine polymer, such as reduced solidification time and extended temperature range of processing.
Footnotes
Declaration of Conflicting Interests
The author(s) declared no potential conflicts of interest with respect to the research, authorship, and/or publication of this article.
Funding
The author(s) disclosed receipt of the following financial support for the research, authorship, and/or publication of this article: This work was supported by the National Research Council of Argentina (CONICET); the Universidad Nacional del Sur (UNS) [PGI 24/J058]; and the Agencia Nacional de Promoción Científica y Tecnológica (ANPCyT) [PICT 12-0806].