
Abstract
In this study, acoustic emission (AE) technique is used to investigate different time-to-failure mechanisms of delamination in glass/epoxy composite laminates. Woven and unidirectional layups were subjected to the double cantilever beam, end notch flexure, and mixed-mode bending tests and the generated AE signals were captured. Discrimination of the AE events, caused by different types of the damage mechanisms, was performed using wavelet packet transform (WPT) and fuzzy clustering method (FCM) associated with a principal component analysis (PCA). The FCM and WPT analyses identified three dominant damage mechanisms. Furthermore, different interface layups and different GII/GT modal ratio values (ratio of mode II strain energy release rate per total strain energy release rate) indicated different time-to-failure mechanisms incidence. Additionally, the damaged mechanisms were observed using scanning electron microscopic (SEM) analysis. The results showed that the dominant damage mechanisms in all the specimens are matrix cracking and fiber–matrix debonding. Besides, some fiber breakage appeared during the tests, and the percentage of this damage mechanism in the unidirectional specimens and mode I condition was higher than those in the woven specimens and mode II. SEM observations were also in good agreement with the obtained results. It was found that the presented methods can be utilized to improve the characterization and discrimination of damage mechanisms in the actual occurring modes of delamination in composite structures.
Keywords
Introduction
Composite structures are extensively used as engineering structures, which normally are subjected to complex loads. One of the main drawbacks of many advanced laminated composite structures is their susceptibility to delamination. Mode I, mode II, and the combination of these pure modes are usually present in many real conditions of the delamination damage which degrade the mechanical properties of laminated composites. Loading conditions and layup types are among the effective factors in the delamination behavior. Therefore, a better understanding of delamination-induced damage mechanisms in different loading conditions and layups is required and can help to increase reliability and safety of the composite structures against initiation and growth of the delamination. 1,2
Different nondestructive methods have been utilized to detect delamination damage in composite materials. Acoustic emission (AE) is known as an in situ and a promising nondestructive technique for the investigation of microscopic behavior of fiber–matrix interface during delamination. AE signal is a transient wave resulting from real-time and continuous monitoring of micro failures (e.g. matrix cracking, debonding of matrix from fiber, and fiber failure) during delamination phenomenon. 3 –6
Until now, some researchers discriminated the AE signatures of damage mechanisms in composite materials. 7 –12 Their results showed that AE technique is capable of characterizing different damage mechanisms in thermoplastic and thermoset-laminated composite materials. Most of these studies exploited AE parameters such as amplitude, count, and energy for characterizing the damage mechanisms. Their results showed that the AE signals are distributed into distinct clusters. Furthermore, three dominant damage mechanisms (matrix cracking, fiber–matrix debonding, and fiber breakage) take place during delamination, while these different damage mechanisms generate different AE parameters. Additionally, the achieved results specified that higher frequencies and amplitudes emerging in the tests were related to fiber breakage, while lower ranges contributed to matrix cracking and fiber–matrix debonding damages. 2,8,9,10
In order to obtain more reliable and accurate information for identification of damage mechanisms, pattern recognition algorithms and time–frequency analyses were utilized as multivariable classification procedures of AE data. 13 –16 These methods made it possible to study the delamination damage mechanisms by simultaneous consideration of various AE features. In other studies, 17,18 the combination of AE and mechanical information were used to recognize the behavior of damage mechanisms during delamination, and good results were achieved.
In this study, two powerful multivariable techniques of fuzzy clustering method (FCM) and wavelet packet transform (WPT) are utilized to investigate time-to-failure mechanisms generated during delamination damage. FCM is the combination of fuzzy concept and K-mean method. This technique was used to classify AE signals by different researchers. 19 –22 The results showed that this technique has good applicability for clustering the AE signals. Furthermore, this method can be applied to discriminate the AE events having high degree of overlapping in their parameters. WPT, 23 –26 one of the time–frequency distribution techniques, was employed in some studies to investigate the relationship between AE signals and damage sources. The results of this method clarified that this method and frequency analysis are efficient ways for processing the AE signals obtained from composite materials.
Several AE-based studies were conducted regarding failure modes during propagation of delamination. However, most of the studies were on mode I fracture analysis, and mode II and mixed-mode delamination have not been extensively studied.
In this work, evaluation of micro-cracking occurrence and identifying damage types are conducted when the laminate is subjected to mode I, mode II, and mixed-mode loadings. Two different types of glass/epoxy composite specimens including unidirectional and woven are chosen. The aim of this article is to improve the investigation efficiency in discriminating various AE sources obtained during actual occurring modes of delamination damage. From this point of view, WPT and FCM associated with principal component analysis (PCA) were applied to identify the acoustic signatures of the damage mechanisms in real occurring modes of delamination. Six AE parameters including amplitude, frequency, energy, count, rise time, and duration were used for the FCM-based classification, while the energy criterion was utilized to analyze decomposed levels in WPT. The damage mechanisms were also observed using the SEM images for the purpose of verification. The procedure for damage recognition can clearly be seen in Figure 1.
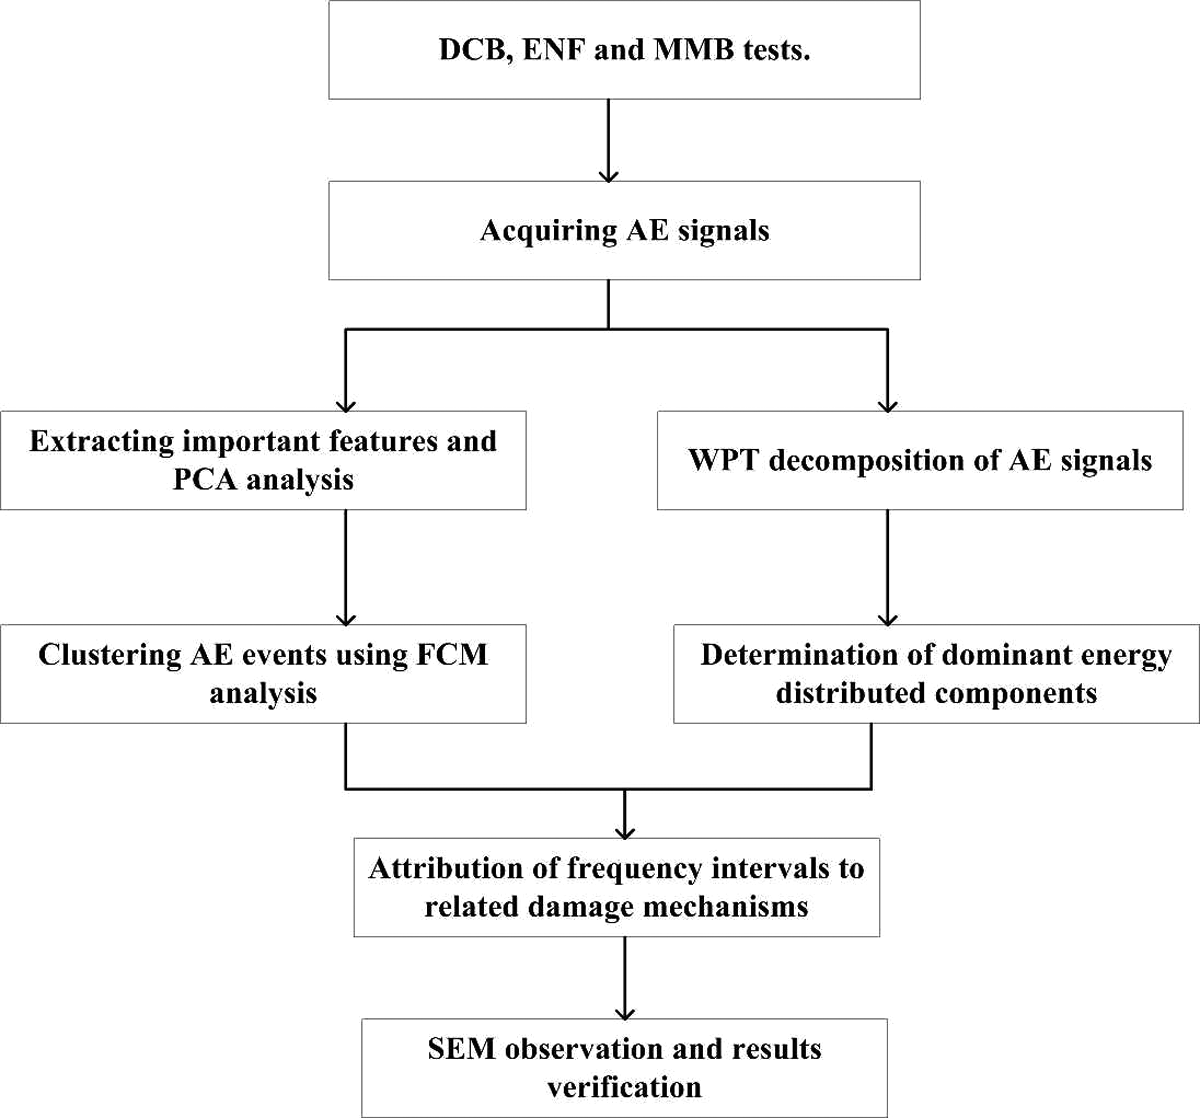
The procedure for damage recognition.
Experimental procedure
Material and specimen preparation
The experimental work was carried out on the epoxy resin reinforced by unidirectional and woven E-glass fibers with 500, and 303 g/m2, respectively. The density of the epoxy resin was 1.46 g/cm3. Two different interface types that were used for this study are specified in Table 1. The laminates were prepared by hand layup. The starter crack was formed by inserting a Teflon film with thickness of 20 μm at midplane during molding as an initial crack for delamination. As shown in Figure 2, the laminated composite test specimens consist of a rectangular shape and uniform thickness (the fabrication tolerance for all the dimensional is about ±0.1 mm).
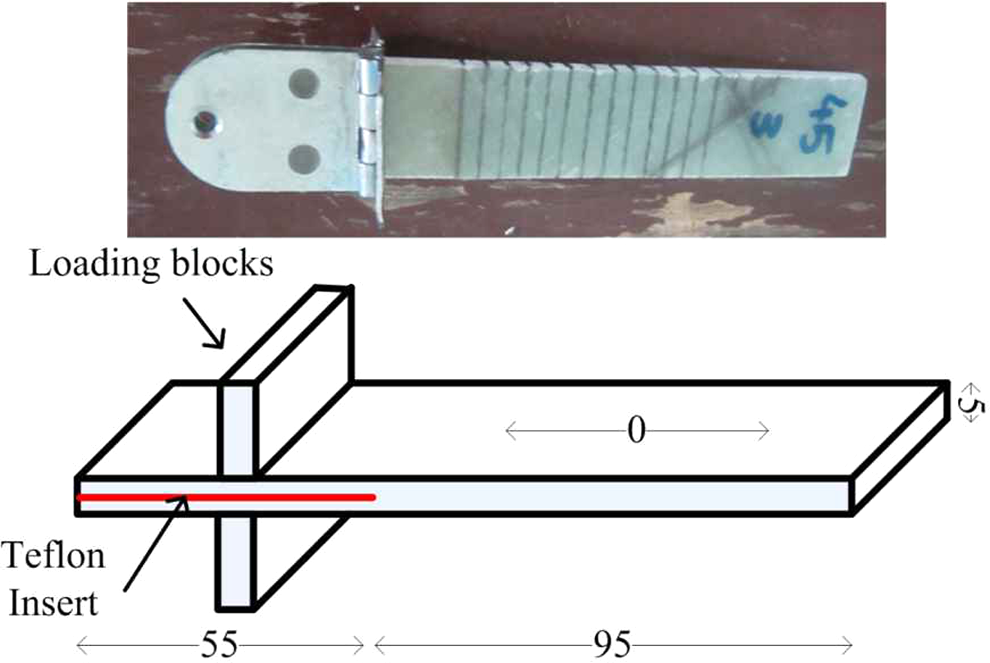
The specimen geometry and dimension.
Specification of the investigated layups for sample U1–U4 and W1–W4.
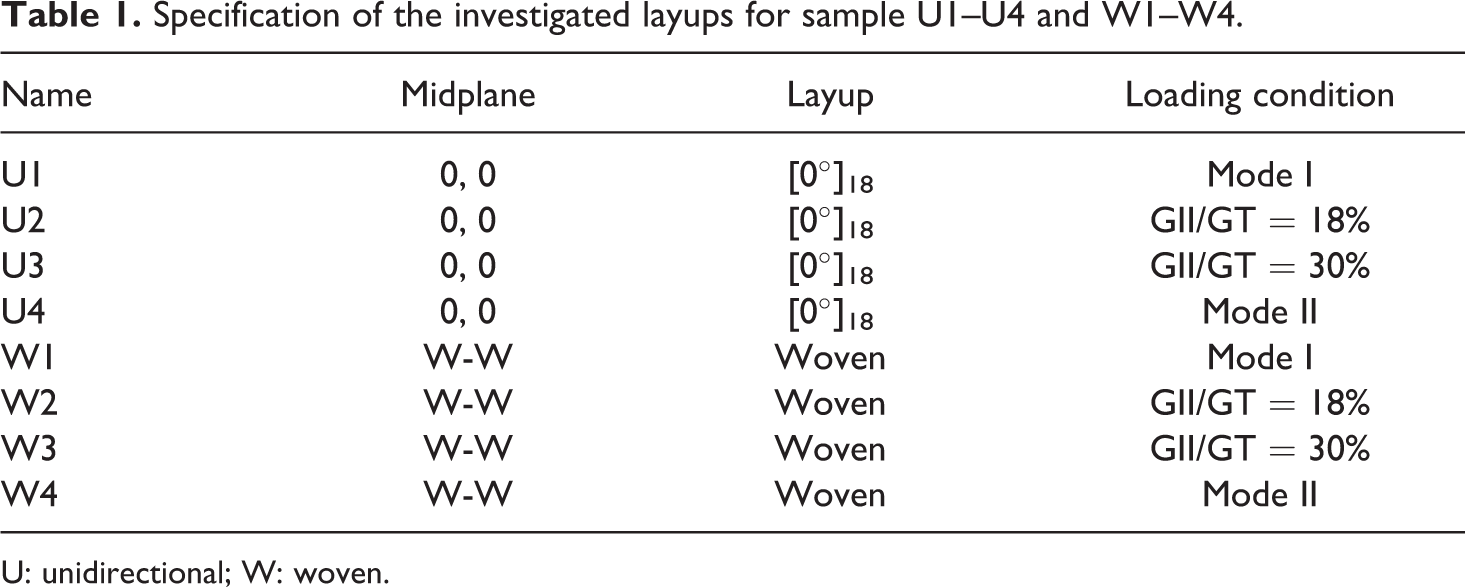
U: unidirectional; W: woven.
Test procedure
Double cantilever beam (DCB), end notch flexure (ENF), and mixed-mode bending (MMB) test apparatus, as shown in Figure 3, were used to split the laminated specimens. In DCB setup, the load was applied to the end of the specimen to split end of the laminate to create mode I, whereas in ENF setup, the load was applied to the center of specimen to create mode II. MMB is the combination of DCB and ENF in which the length of the lever arm can vary to change the GII/GT modal ratio values. In this article, two different GII/GT modal ratio values are studied (see Table 1). Delamination tests were carried out at a temperature of 24°C at a constant displacement rate of 2 mm/min. A calibrated universal tensile test machine was used with a 5-kN load cell capacity. The load and displacement were continuously measured, and the crack length was visually observed and recorded with camera.
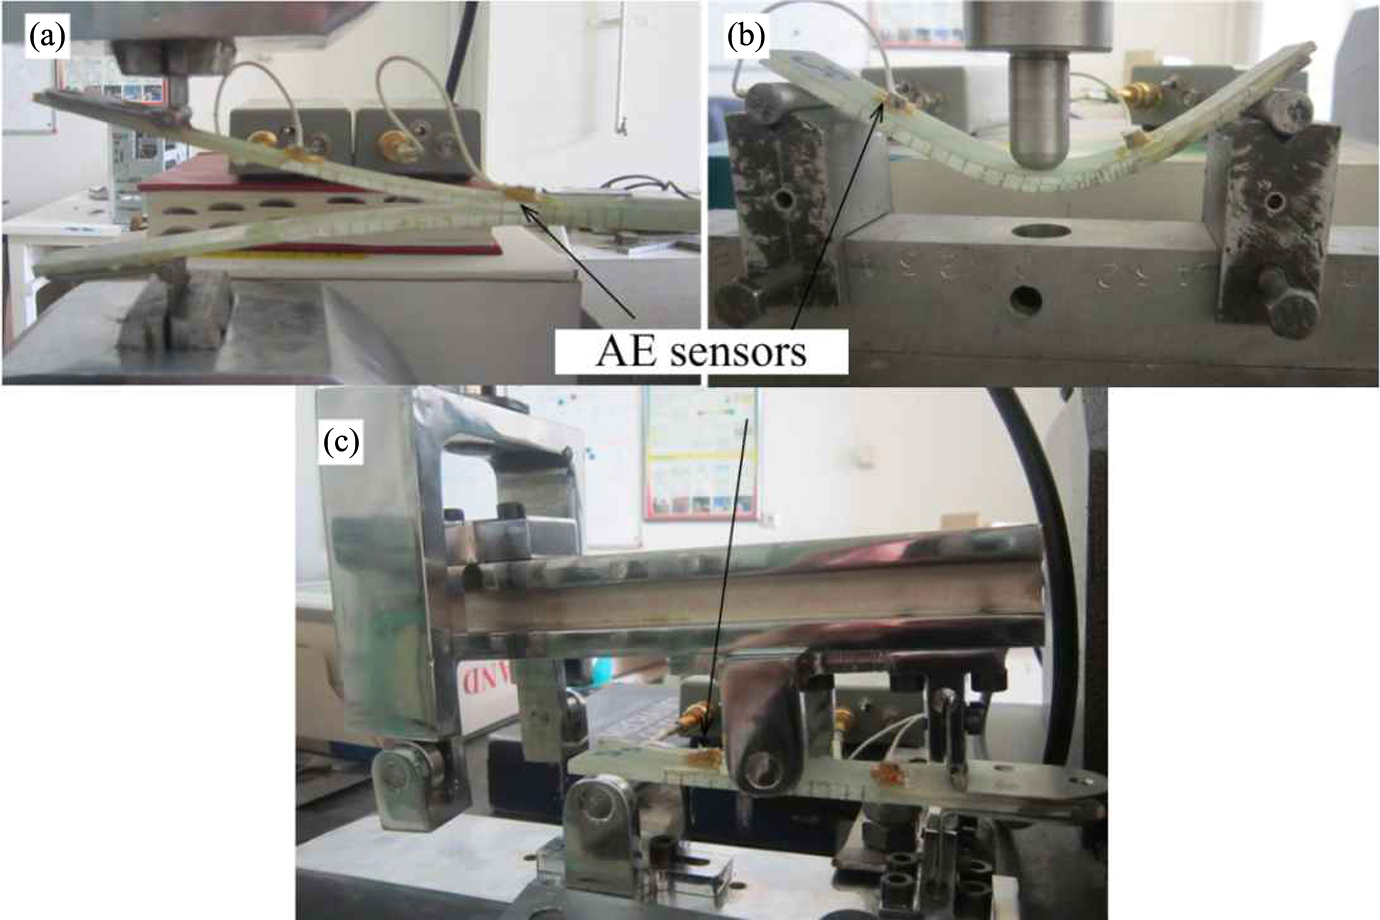
Experimental setups for loading and the AE sensors. (a: mode I, b: mode II, and c: mixed-mode). AE: acoustic emission.
AE device
AE events were recorded using AE software AEWin™ and a data acquisition system from Physical Acoustics Corporation (PAC) company PCI-2 with a maximum sampling rate of 40 MHz. PICO, a broadband, resonant-type, single-crystal piezoelectric transducer from PAC, was used as the AE sensor. The sensor has a resonance frequency of 453.12 kHz, and an optimum operating range of 100–750 kHz. To provide good acoustic coupling between the specimen and the sensor, the surface of the sensor was covered with grease. The signal was detected by the sensor and enhanced by a 2/4/6-auto sensor test preamplifier. The gain selector of the preamplifier was set to 40 dB. The test sampling rate was 1 MHz with 16 bits of resolution between 10 and 100 dB. Prior to the damage check, the data acquisition system was calibrated for each kind of the specimens, according to a pencil lead break procedure. This procedure enables the generation of the waves used for the device calibration at the specimen surface. At the same time, the velocity and attenuation of the AE waves were measured. The lead breakage operation was repeated several times at different locations between the sensors. After the calibration step, the AE signals were captured during mechanical testing. Signal descriptors, such as amplitude, duration, rise time, counts, and energy were calculated by the AE software (AEWin).
Wavelet-based methodology
The theory of wavelet is well documented in textbooks concerning multivariable data analysis, 23 –26 where the wavelet transform is represented as a suitable method for analyzing AE signals. In this study, WPT is employed 27,28 in which each signal is split into high-frequency and low-frequency components as shown in Figure 4. The number of components for level i is 2 i .
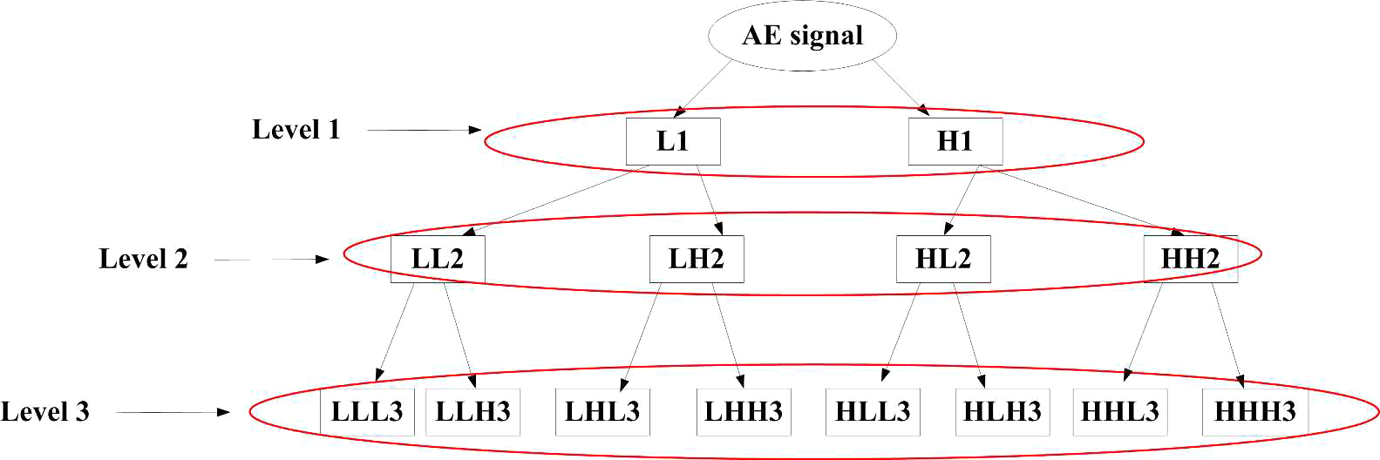
WPT tree. Letter L refers to low frequency and letter H refers to high frequency. WPT: wavelet packet transform.
The frequency ranges of the high and the low components are calculated using equations (1) and (2), respectively, where f s is the sampling rate and i is the number of decomposition level.


In this study, relative energy distribution at each level


where
Principal component analysis
The basics of PCA theory can be found in references on multivariable data analysis. 19,29 Briefly introducing, PCA is a multivariate analysis tool commonly used for reducing dimensionality of a large data set to enable better visualization and analysis of data. 21 Dimensional reduction is performed by transforming data to a new set of uncorrelated variables, that is, the principal components. In fact, PCA projects the data along the directions that describe maximum variance in the data set.
The fuzzy C-means clustering
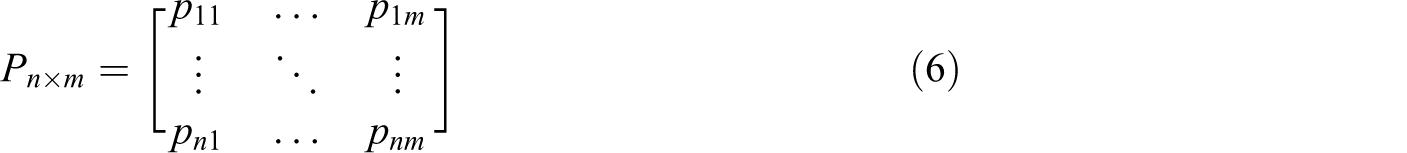
FCM is a clustering procedure in which each input data belongs to some clusters with a degree that is defined by a membership grade. 29 Input data with some multidimensional space could be classified as specific numbers of different clusters, using FCM method. According to equation (6), input data (P) is signified as n × m matrix.
Equation (7) is the mathematical expression of the objective function intended for FCM clustering. The basic concept of the objective function is to minimize the Euclidean distance between each data in its cluster and cluster center and to maximize the Euclidean distance between other cluster centers.


In the equations (7) to (12), J is a fuzzy partition matrix of input data (P), S is cluster centers vector, D is a squared inner product distance norm,
Simple Picard iteration, using the first-order conditions for stationary points of equation (7), is known as the FCM algorithm.
30
This iteration procedure is the most well-known technique for minimization of the c-means function. In fact, it could be observed that if
FCM procedures for classification of the AE data are stated bellow:
The input parameters, including data set (P), weighting exponent (α > 1), number of clusters (1 < c < m), termination tolerance (ε > 0), and norm-inducing matrix A, are selected.
30
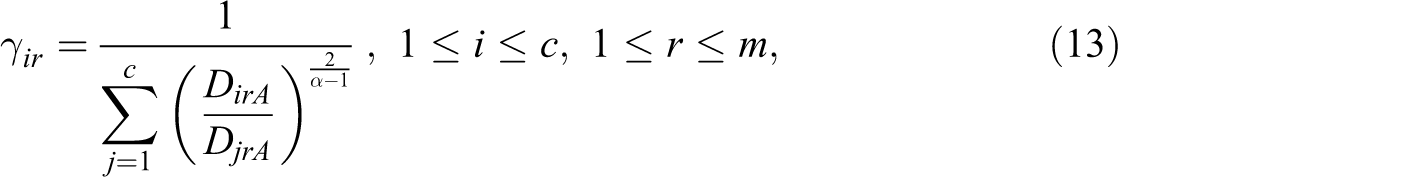
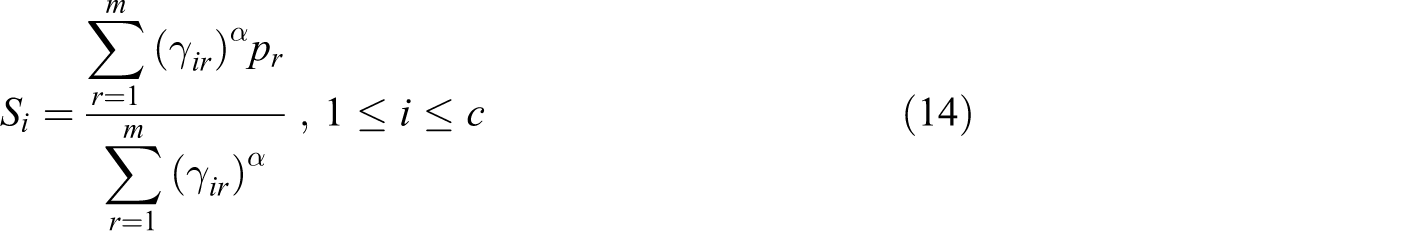
Initial value such as Step 1: Using equation (14), the cluster centers (S
i) are calculated. Step 2: Using equation (9), the distances Step 3: The partition matrix is updated for 1 ≤ r ≤ m.
If D irA > 0, for all i = 1, 2, 3 …:
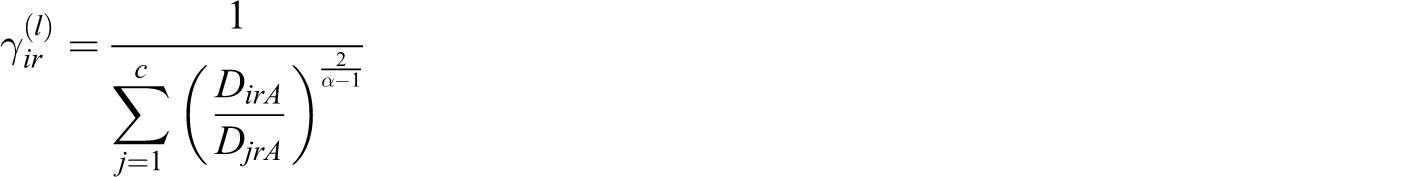
Otherwise

The FCM iterates until
Results and discussion
The load and energy of the AE signals versus displacement for the specimens are shown in Figures 5 and 6. The plots are classified as three regions. This classification is because of the different delamination behavior in these regions. Region 1 is related to the failure-free domain, while regions 2 and 3 are associated with the initiation and propagation of the delamination.
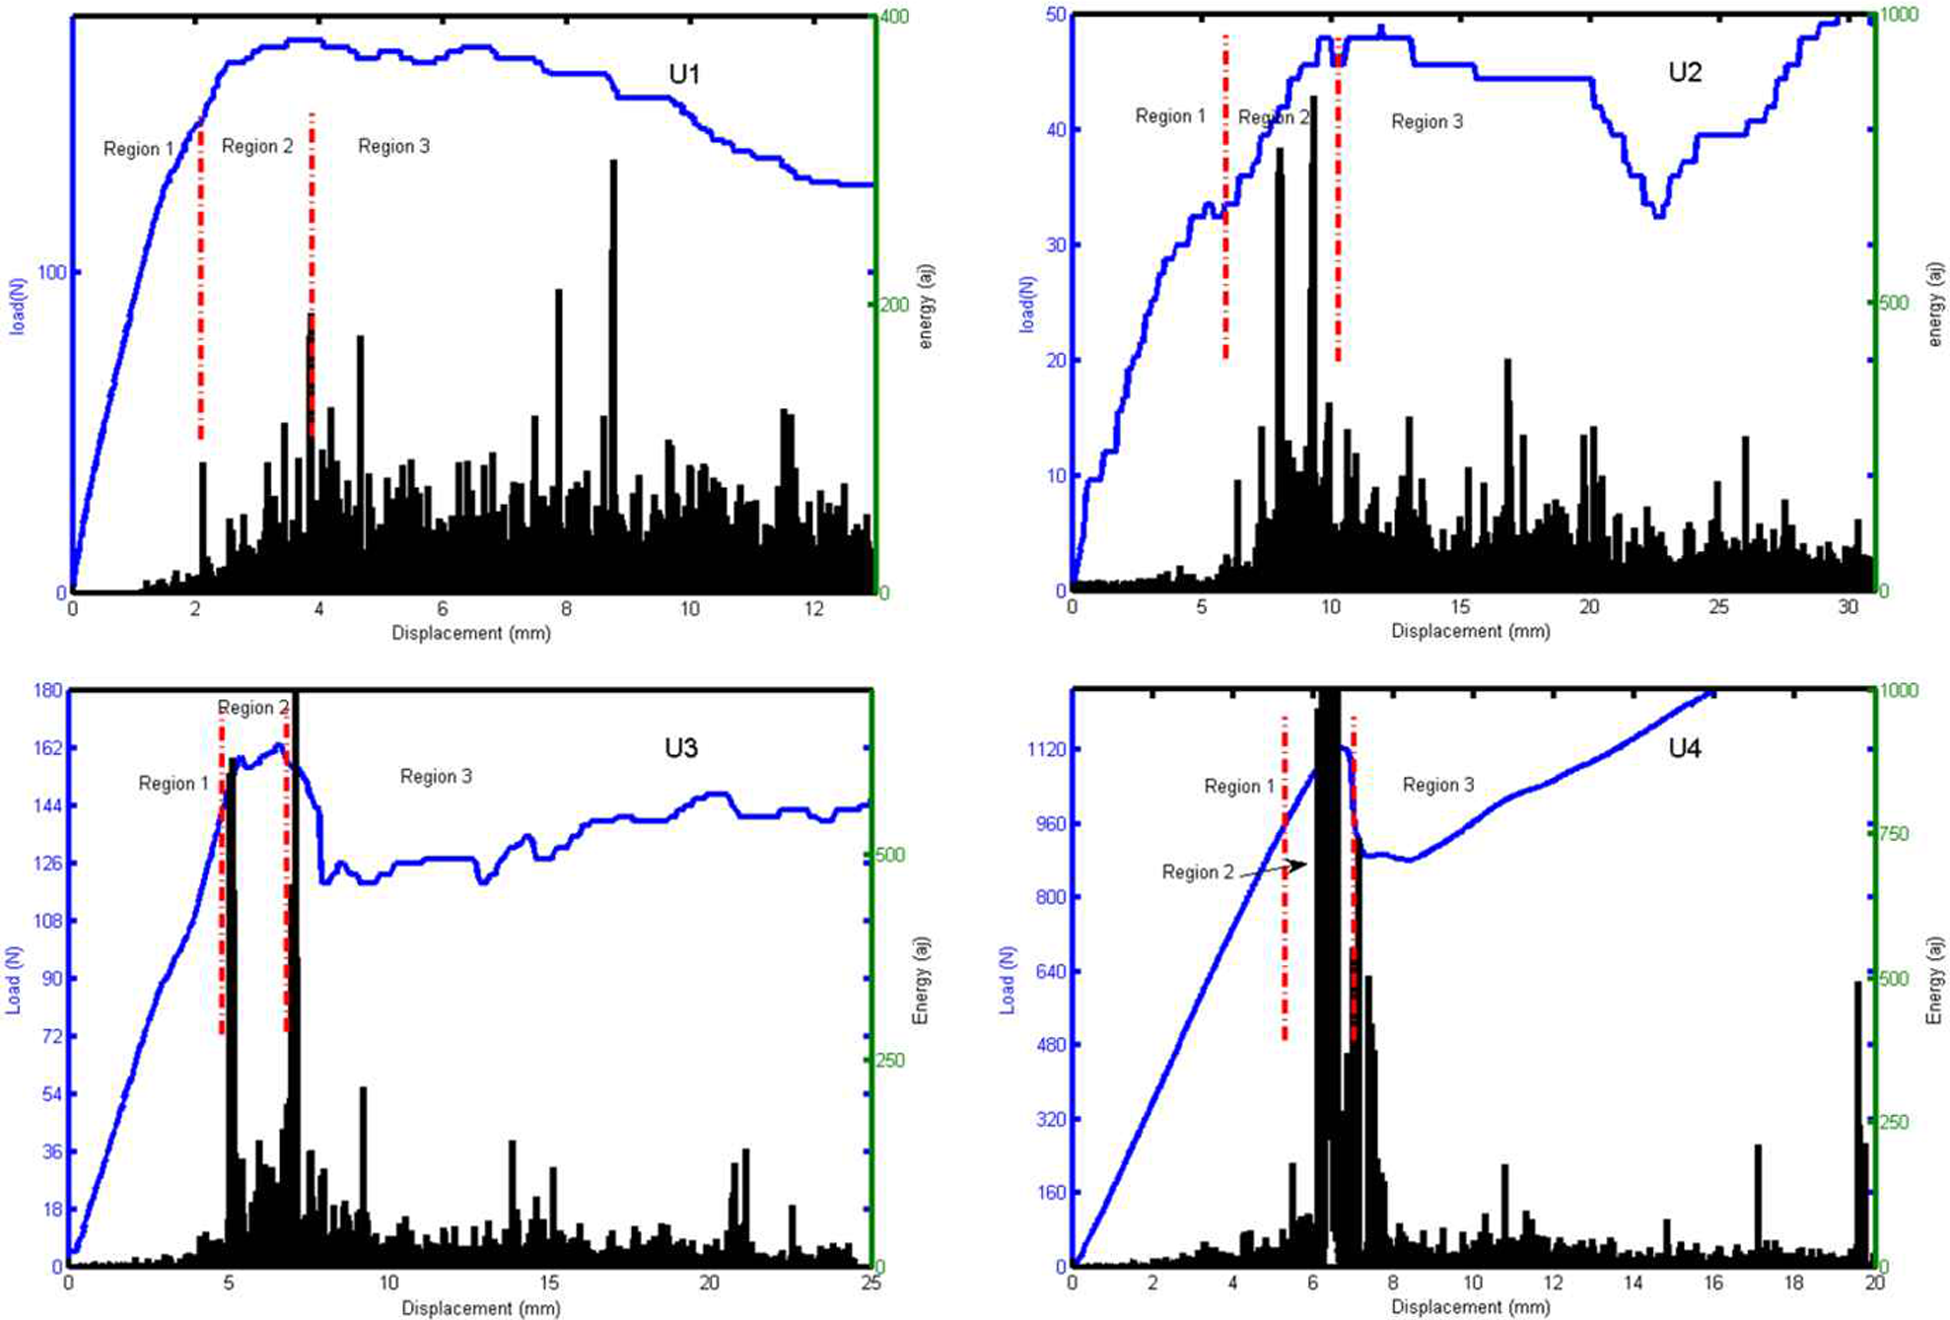
The load/time curves and AE energy distribution for the unidirectional specimens.
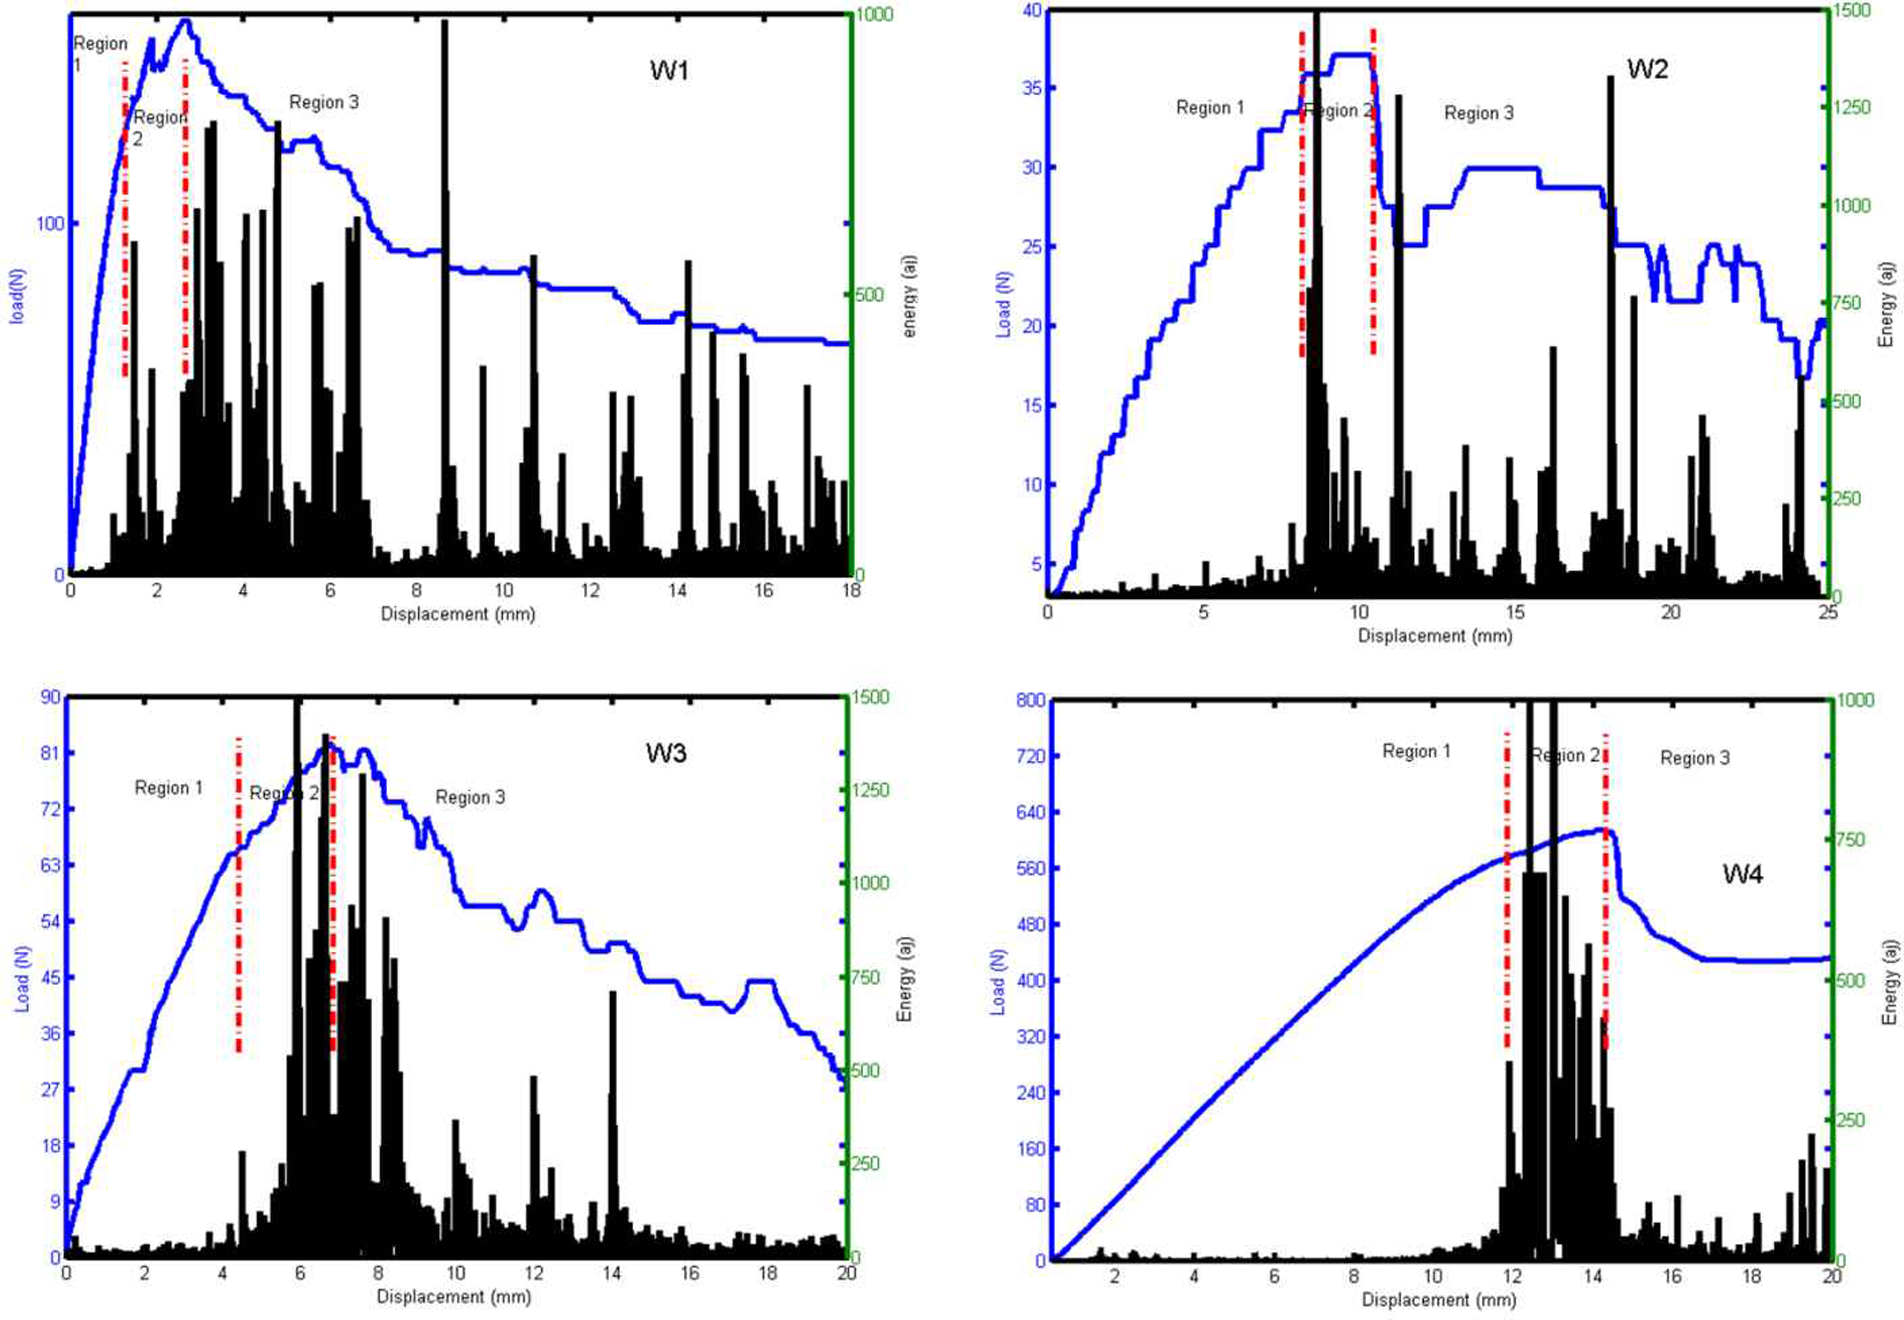
The load/time curves and AE energy distribution for the woven specimens.
There are some dissimilarities between the mechanical and AE behaviors in each region for the investigated specimens. As illustrated in Figures 5 and 6, the extent of region 1 varies by changing the layup type and GII/GT modal ratio value. It can be observed that in the mode I condition, the delamination onset appears sooner compared to the other loading conditions. The distribution of AE events is also different in the investigated specimens. There is almost uniform distribution of the AE energy after the initiation stage in mode I. In fact, for pure mode I and specimen U1, the load increases continuously until the maximum load. The load is then almost constant, but increasing of the GII/GT modal ratio value causes the distribution of the AE energies to become burst type. After the onset of delamination, the crack growth in mode I condition is stable, whereas the crack growth in mode II condition and the GII/GT values near mode II is unstable.
As previously discussed, there are different AE and mechanical behaviors in the investigated specimens. Variations in the AE events and mechanical behaviors reflect occurrence of different damage mechanisms. These differences are due to the different interface layups and different loading conditions leading to the different damage mechanisms. Figure 7 shows three waveform samples of specimen U1 obtained from different regions along with the wave characteristics.
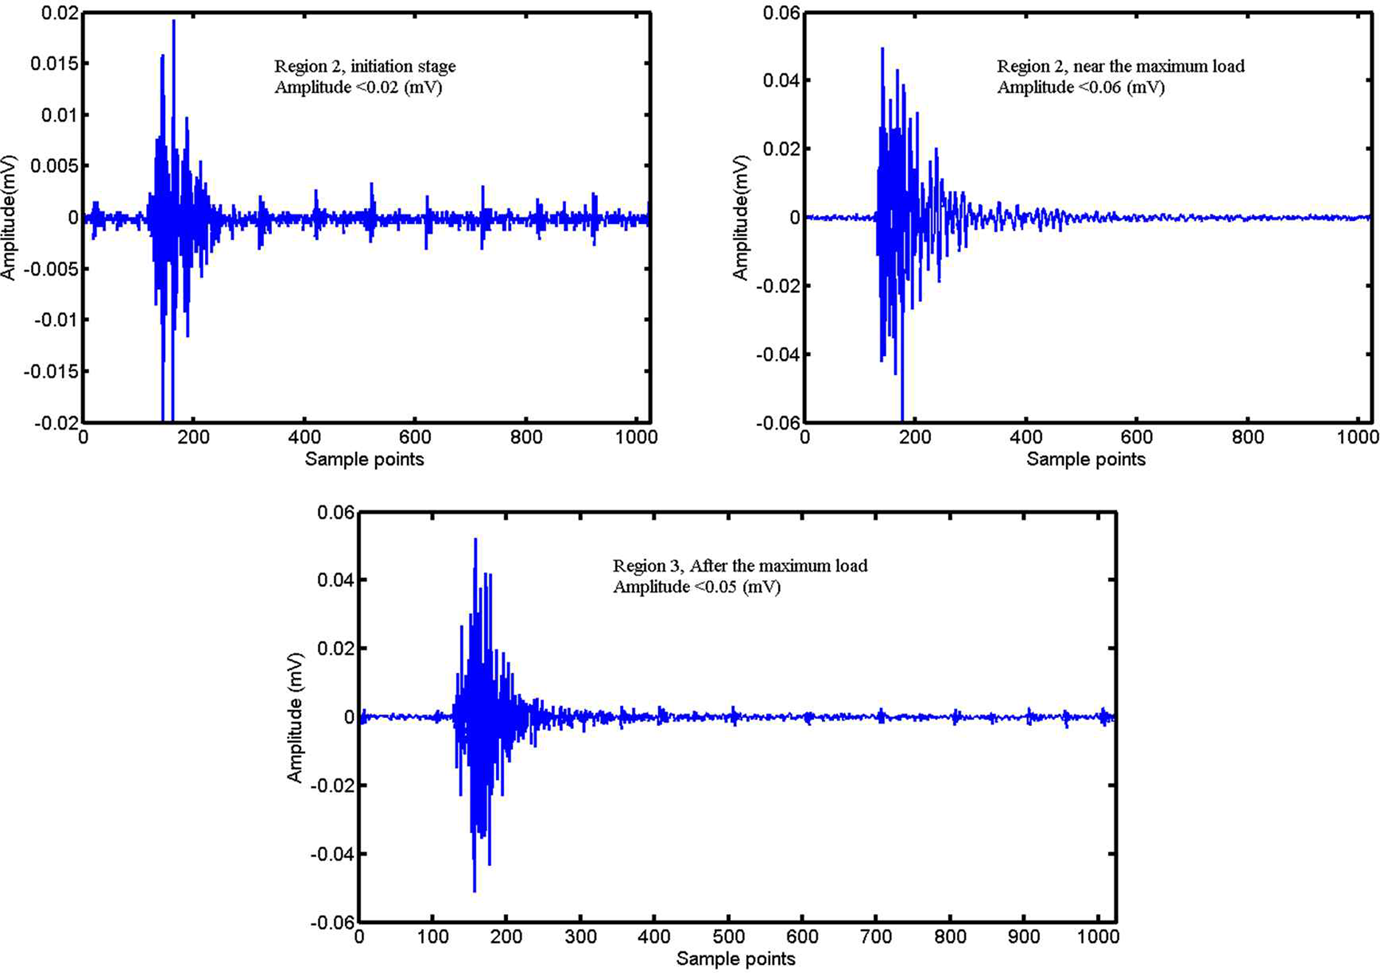
Waveforms of specimen U1 obtained from different regions.
Studying the recoded waveforms in time domain shows that the amplitude range of the detected waveforms varies as a result of different AE events in the introduced regions. The cause for generation of different types of waveforms is due to different failure modes during propagation of delamination. Finer extracted signatures can be obtained by applying WPT and FCM associated with PCA methods from the AE waveforms for identification of the damage mechanisms.
Multivariable analysis
Multivariable analysis techniques including WPT and FCM associated with PCA are applied to discriminate time-to-failure mechanisms according to their AE patterns.
WPT results
WPT and Daubechies’ wavelet family 24 were employed to analyze the AE signals. Each obtained AE signal is decomposed into three different levels. Entropy criteria 25 were also applied for deciding whether certain decomposition is adequate or more levels are needed. The relative energy distribution of the AE signals for all components of the third level is then calculated from equations (3) and (4). The summary of the WPT results are illustrated in Figure 8 and Table 2.
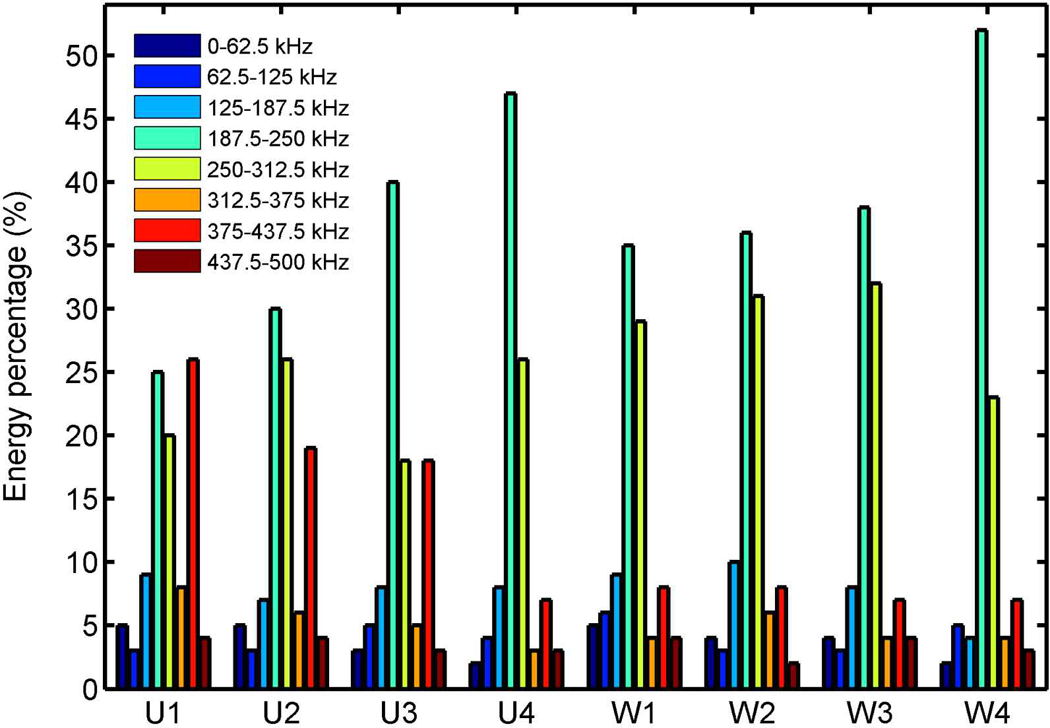
Energy percentage of each component of the third level in time domain calculated for different specimens.
Summary of wavelet packet analysis for dominant components.
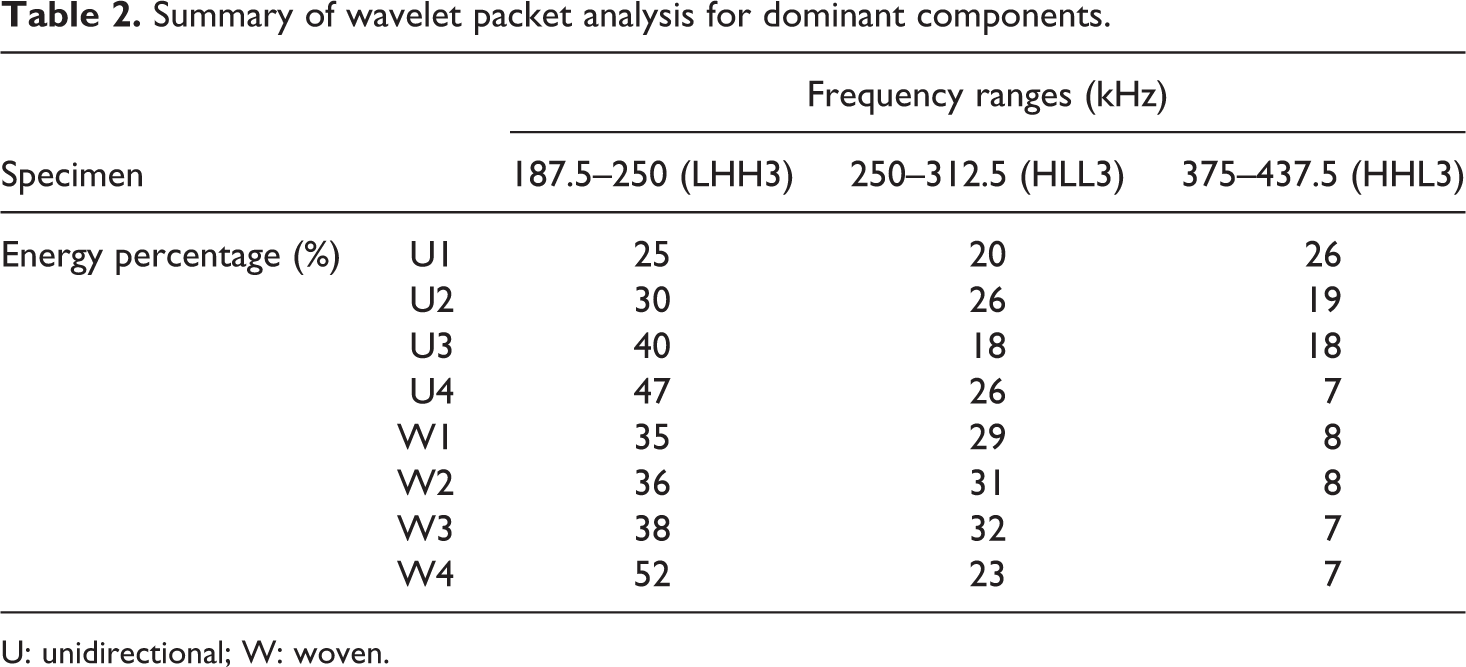
U: unidirectional; W: woven.
As can be observed, the major portion of the AE energy is distributed in three dominant components (LHH3, HLL3, and HHL3) for the specimens. Approximately, more than 70% of the AE events are related to these three components. However, the energy distribution percentage at each one of these dominant components varies from one experimental condition to another (see Figure 8). Furthermore, it can be seen from Table 2 that the frequency range of components LHH3, HLL3, and HHL3 are 187.5–250 kHz, 250–312.5 kHz, and 375–437.5 kHz, respectively.
FCM analysis
Six important features of the AE signals (amplitude, frequency, energy, count, rise time, and duration) were employed for PCA. The PCA results show that more than 80% of the total variance of the input data are related to the cumulative sum of the variances of the PCA (1) and PCA (2).
The PCA visualization of the FCM on the AE signals is shown in Figures 9 and 10 for all the specimens.
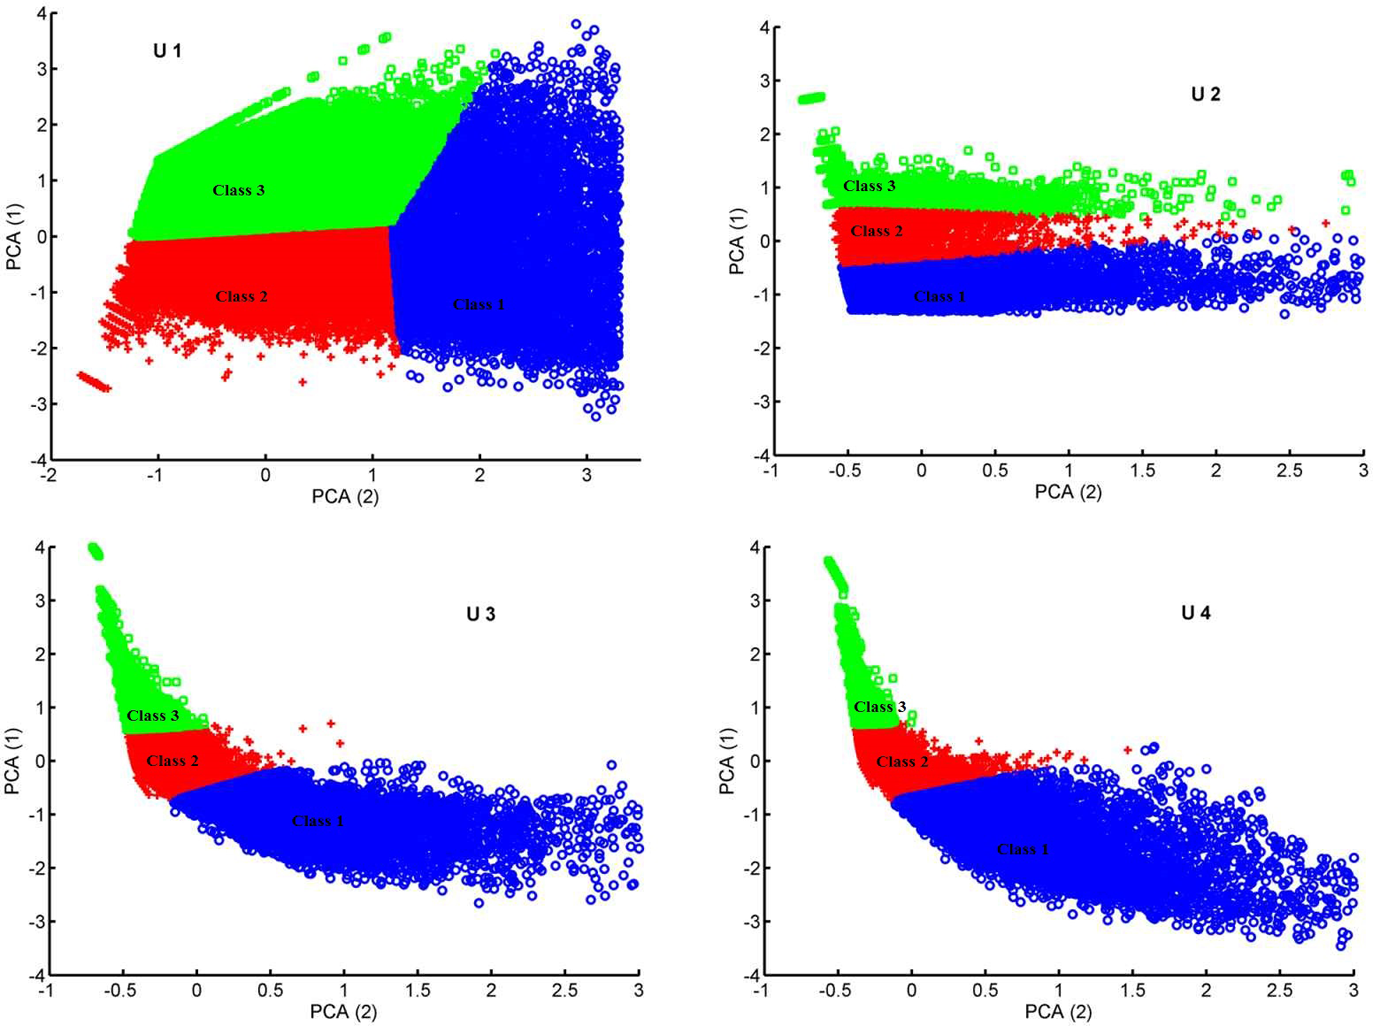
PCA visualization of the fuzzy c-means clustering for the unidirectional specimens. PCA: principal component analysis.
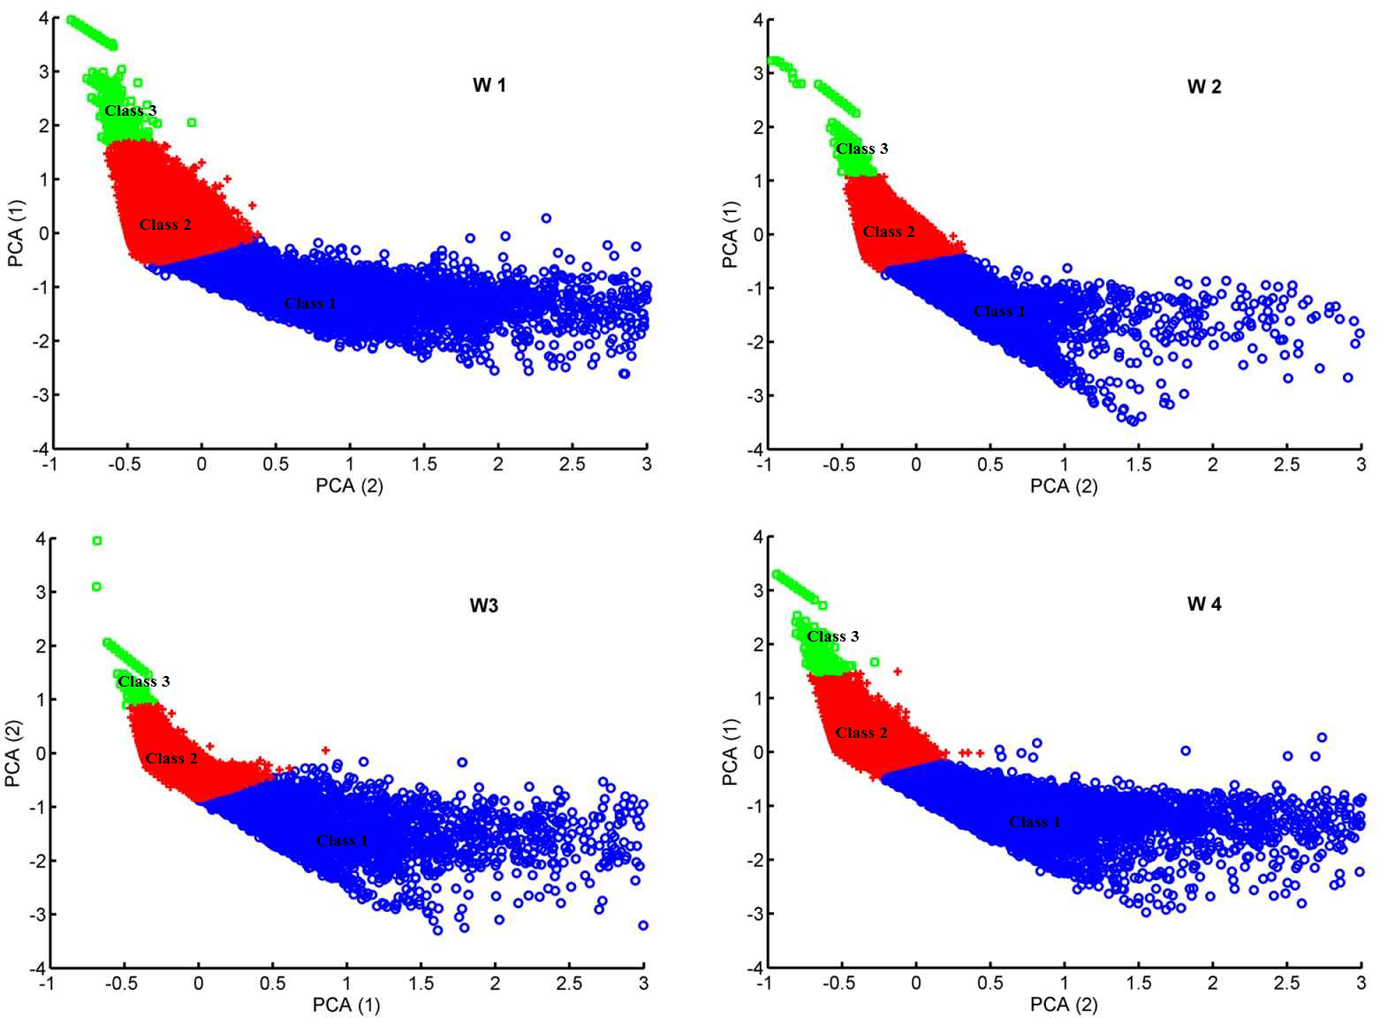
PCA visualization of the fuzzy c-means clustering for the woven specimens. PCA: principal component analysis.
The FCM results show that the AE signals are well separated along the first principal direction and are clustered in three different classes. The number of clusters was chosen based on SEM observation from the fractured surfaces and was also verified by Davis–Bouldin (DB) index validity criterion. 31 It is also noticeable that the distribution of the classes does not overlap (see Table 3).
Average dependency percentage of the signals for three classes.
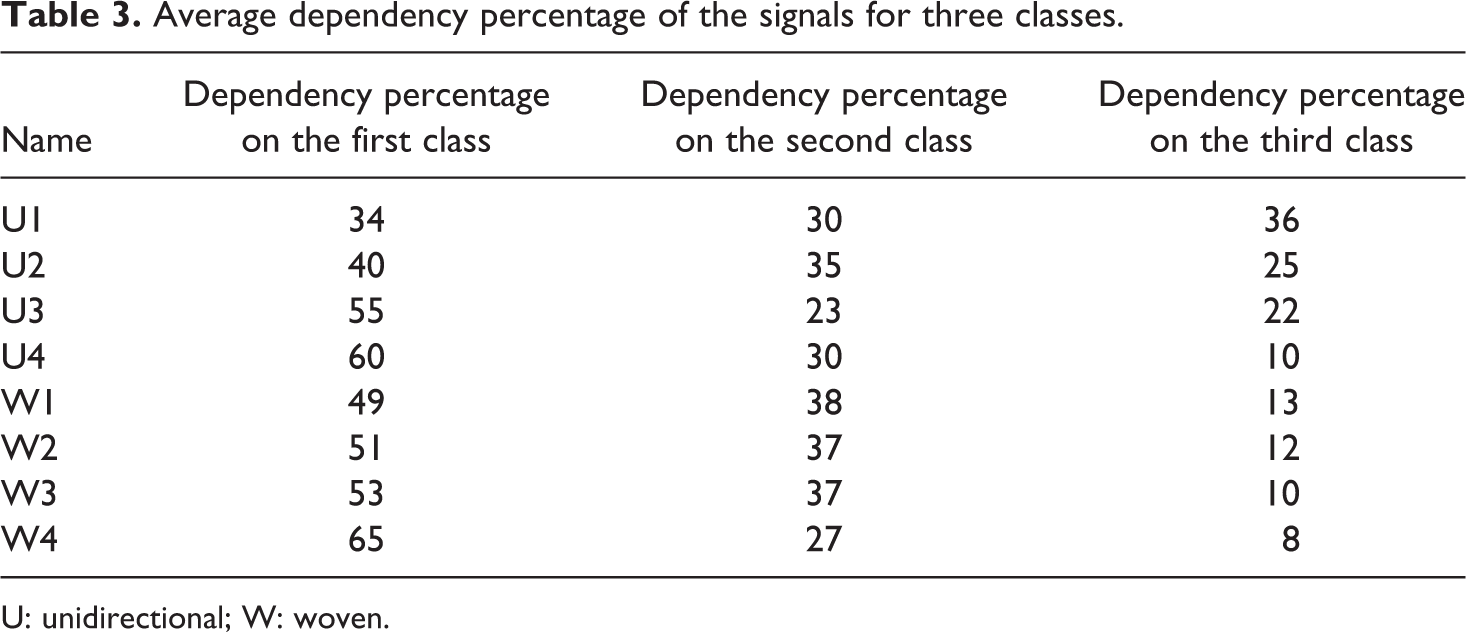
U: unidirectional; W: woven.
Moreover, it can be observed from Table 3 that the AE signals distribution percentage at each cluster varies from one experimental condition to another. By considering the AE parameters of the obtained classes, the frequency parameter was best distinguished. The obtained frequency range for each cluster confirms that the proposed method is useful for data clustering and damage mechanism detection. The distributions of the clustered AE events and the order of the AE events appearance are shown in Figures 11 and 12 for specimens U1 and W1, respectively. These figures highlight three separate frequency ranges for these specimens. The lower band frequency class (class1) is the earliest damage mode that appears in the tests.
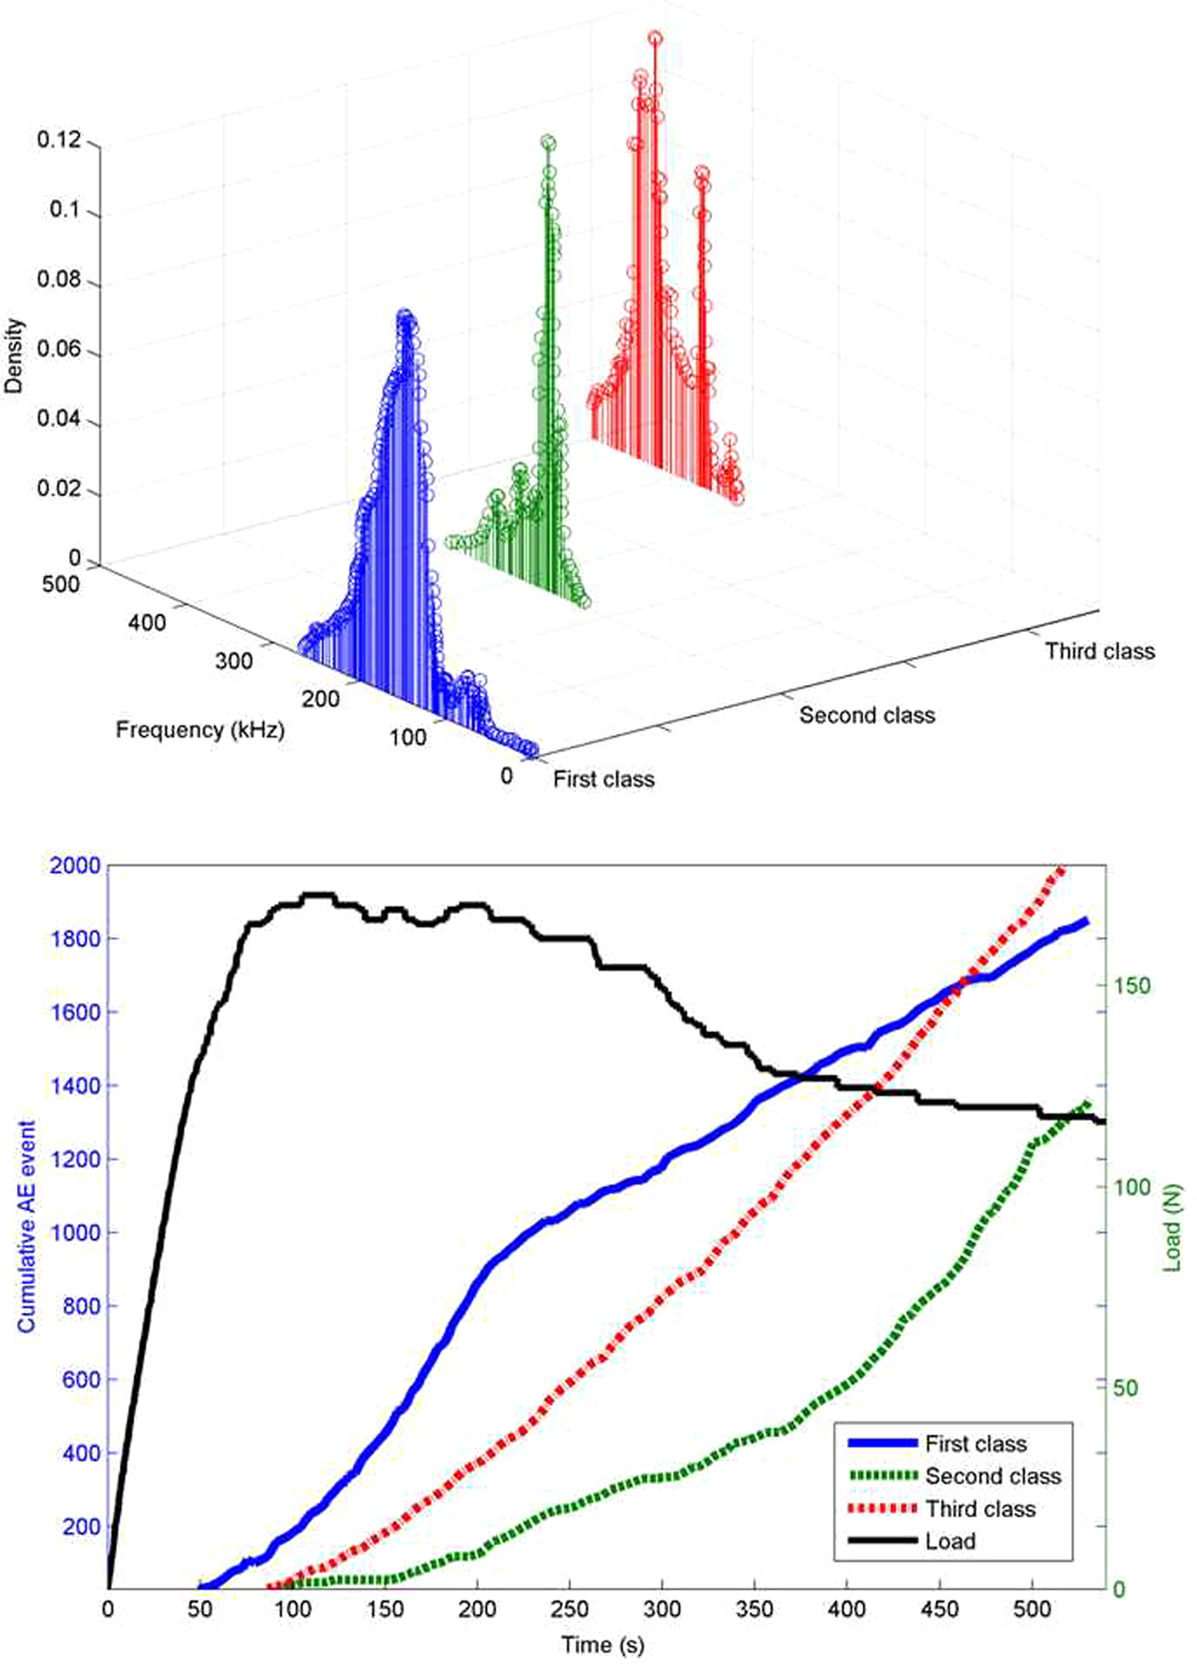
Frequency distribution and sequence of the classified signals versus load–displacement belonging to specimen U1.
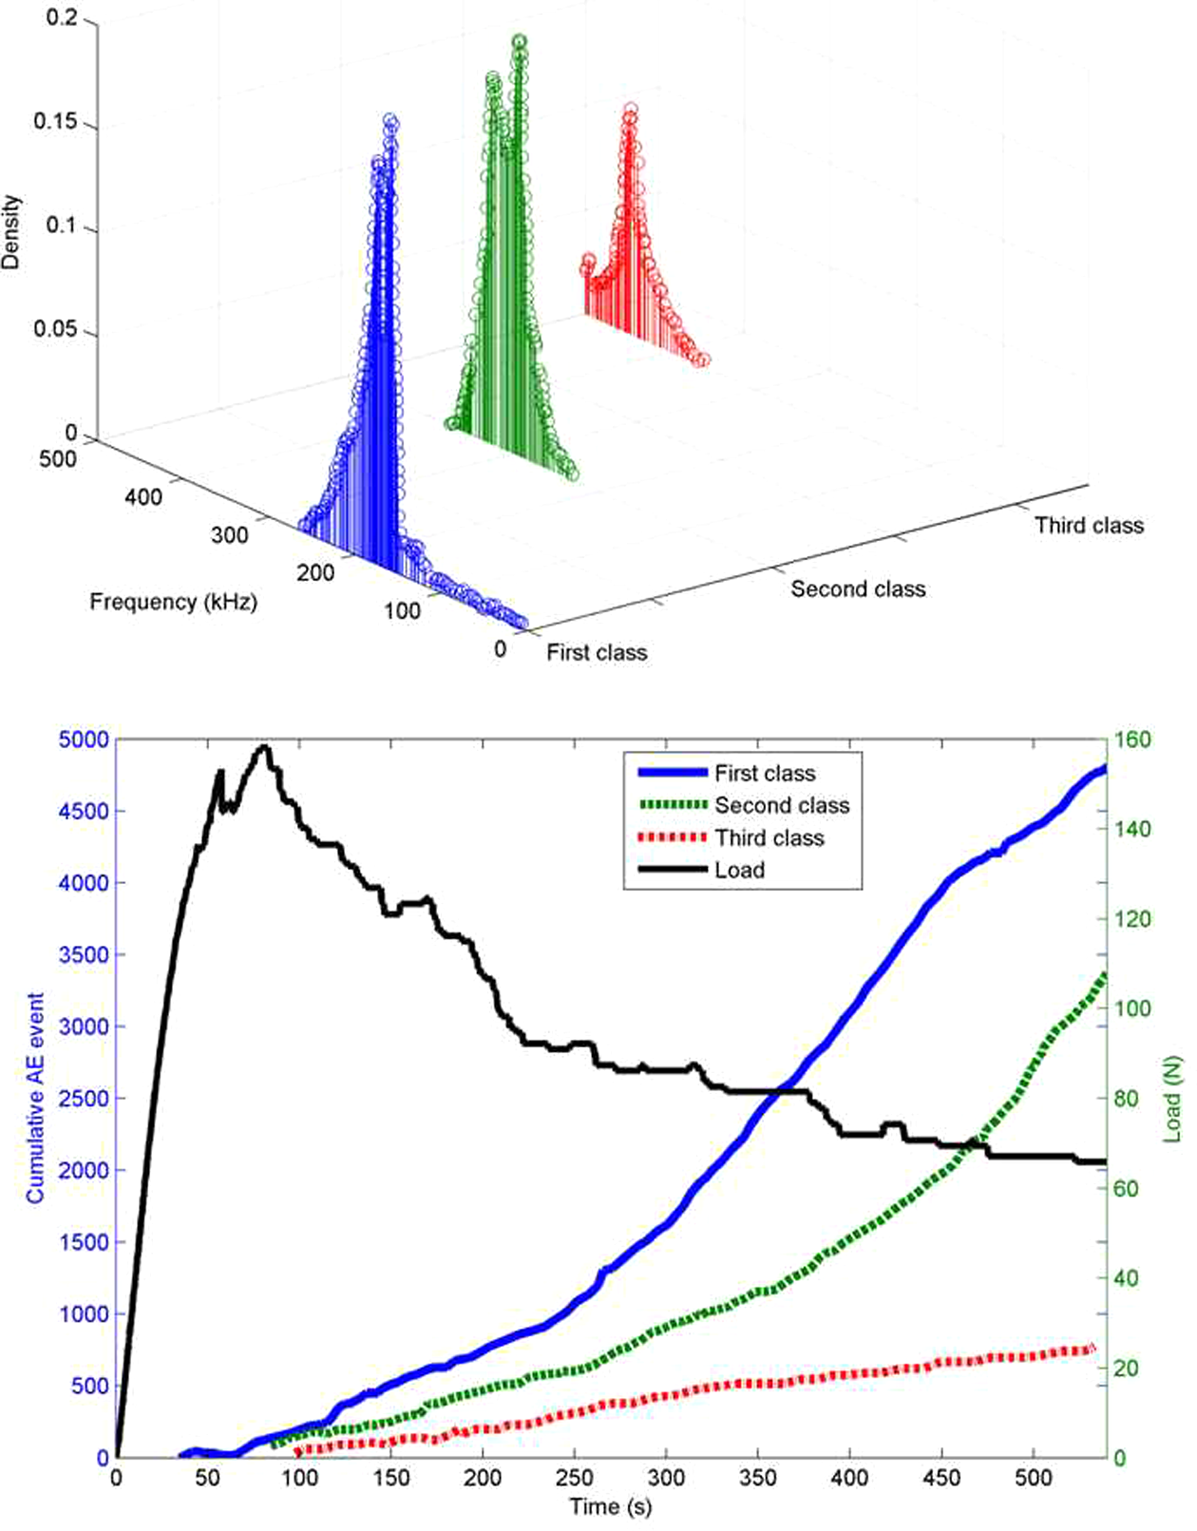
Frequency distribution and sequence of the classified signals versus load–displacement belonging to specimen W1.
Assigning AE features to the damage mechanisms
According to the previous referenced studies, matrix cracking, fiber–matrix debonding, and fiber breakage are three prevalent damage mechanisms in delamination of glass/epoxy composite laminates. These different failure mechanisms are related to the crack tip condition. Different loading conditions and layup variation are the main causes of diversity in the crack tip condition, resulting in different stress concentrations in each test condition. Consequently, dissimilar viscoelastic stress relaxation processes appear in the specimens. These dissimilar processes are the cause for diversity of frequency range in different fracture mechanisms. Bohse 32 expressed that intrinsic frequencies (f i) are related to elastic acoustic velocity (c i), relaxation time (τ i), elastic module (E i), and density (ρ i) according to equation (15):

The relaxation time in the matrix–fiber interface differs for various damage mechanisms. Some studies showed that matrix cracking generates lower wideband frequencies than fiber–matrix debonding and fiber breakage, while the frequency range of fiber breakage is the highest. Furthemore, the frequency ranges of pure epoxy resin and glass fiber bundle under tensile load were investigated, and the results indicated that the dominant frequency ranges of the matrix cracking, debonding, and fiber breakage are at 140–250 kHz, 250–350 kHz, and 350–450 kHz, respectively. 9,28,33,34 Therefore, the AE events and damage mechanisms could be related to each other using the results of FCM clustering and WPT decomposition. As a result, it can be concluded that the AE signals of the LHH3 component and the first FCM class are associated with matrix cracking damage, while the AE signals of the HLL3 component and second FCM class are representatives of fiber–matrix debonding damage. The AE signals of the HHL3 component and third FCM class are also related to the fiber breakage damage.
In the case of specimens U1, U2, and U3, fiber bridging event and resistance of the fibers against crack opening occurs after initiation of the delamination (see Figure 13). However, in specimen U4 and the woven specimens, fiber bridging event is not observed by visual inspection.
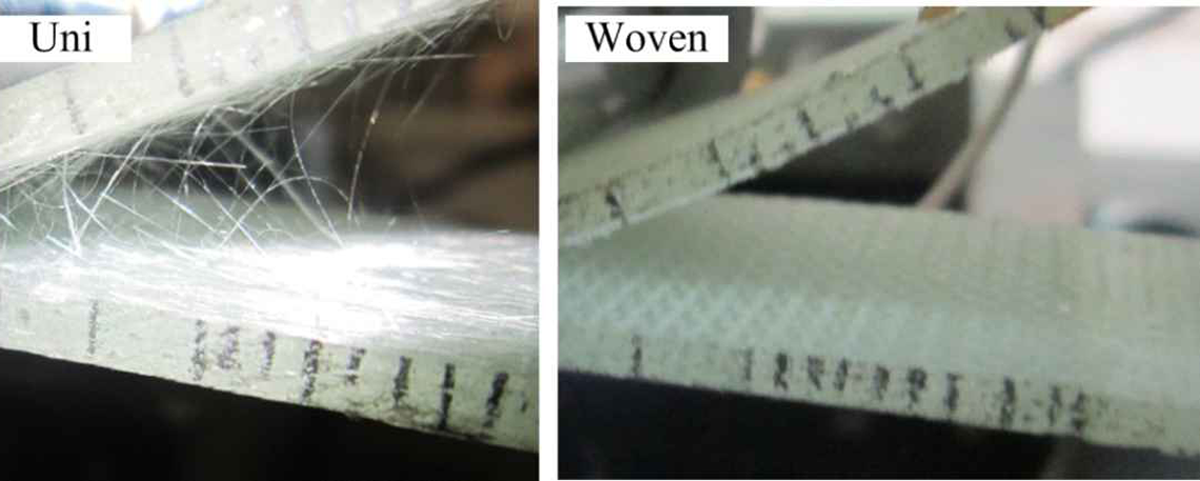
Fiber bridging event in the unidirectional specimen–the woven specimen without fiber bridging.
According to the FCM and WPT results, the percentage of the fiber breakage in the unidirectional specimens and mode I condition is higher than the woven specimens.
By increasing contribution of mode II, the percentage of fiber breakage diminishes in specimens U2, U3, W2, and W3 (see Tables 2 and 3). In these loading conditions, matrix cracking and fiber–matrix debonding are the most significant damage mechanisms in the specimens, whereas fiber breakage is not significant. It is also found that matrix cracking is the earliest damage mode that appears from the beginning of the tests, while debonding and fiber breakage take place later.
It should be mentioned that there are some AE events in the WPT and PCA results with frequency ranges unrelated to the frequency ranges of matrix cracking, debonding, and fiber breakage. These AE events should be associated with some other phenomena. The percentage of these AE events is small compared to the dominant damage mechanisms. In addition, other conditions like crack jumping from one layer to another one, and other factors such as imperfections in the specimens and Teflon insertion are the main factors affecting the obtained results. It is good to mention that AE is a sensitive method, and when this method is applied to characterize the failure mechanisms of composite materials, the difficulty is even more. This is due to the complexity of the failure modes and the fact that they are not well characterized yet.
Fractography
Figures 14 to 17 show delaminated surfaces of specimens U1, W1, U4, and W4. The SEM observations show that fracture mechanisms of the investigated specimens are a mixture of matrix cracking, fiber matrix debonding, and fiber breakage. The quantities of these damage mechanisms are different from one specimen to another. Different interface layups and different GII/GT modal ratio values are the main reason for this diversity. In the unidirectional specimens and mode I-dominated conditions, some of the fibers at the interface were pulled away, resist against crack opening, until they broke (fiber bridging event). Therefore, as can be clearly observed from Figure 14, the highest fraction of fiber breakage appears in the case of specimen U1.
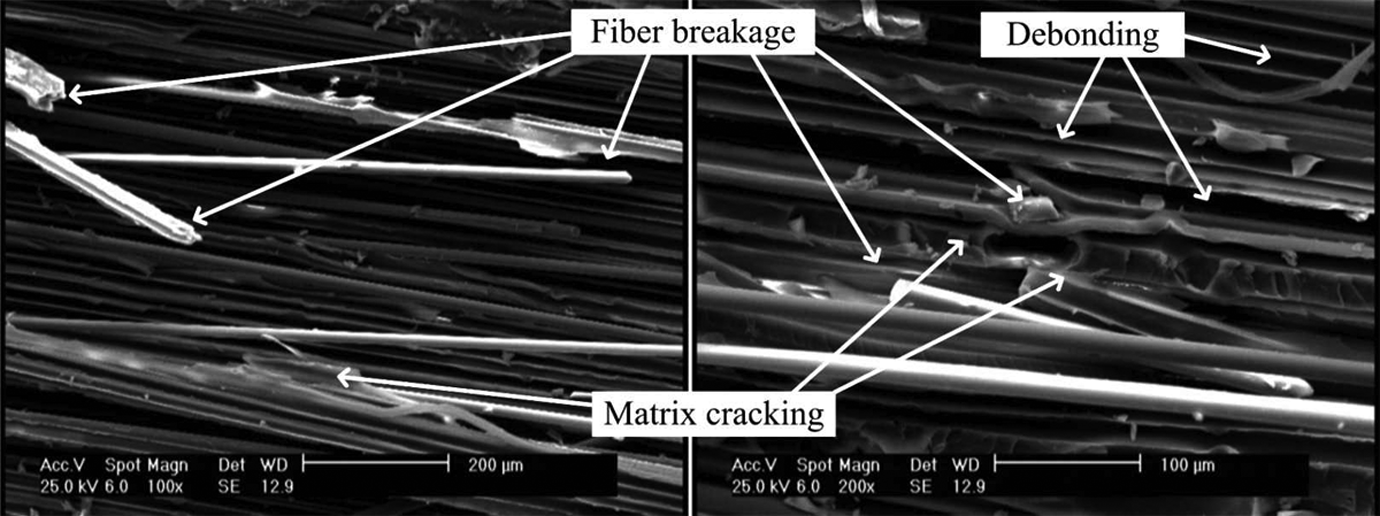
SEM observations for specimen U1. SEM: scanning electron microscopy.
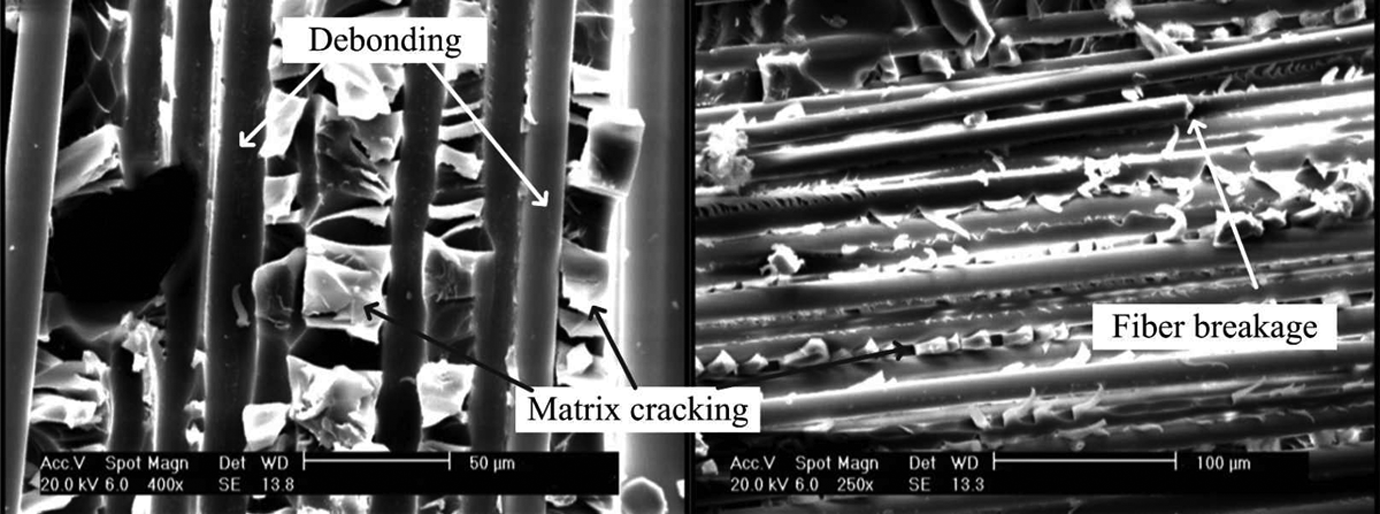
SEM observations for specimen U4. SEM: scanning electron microscopy.
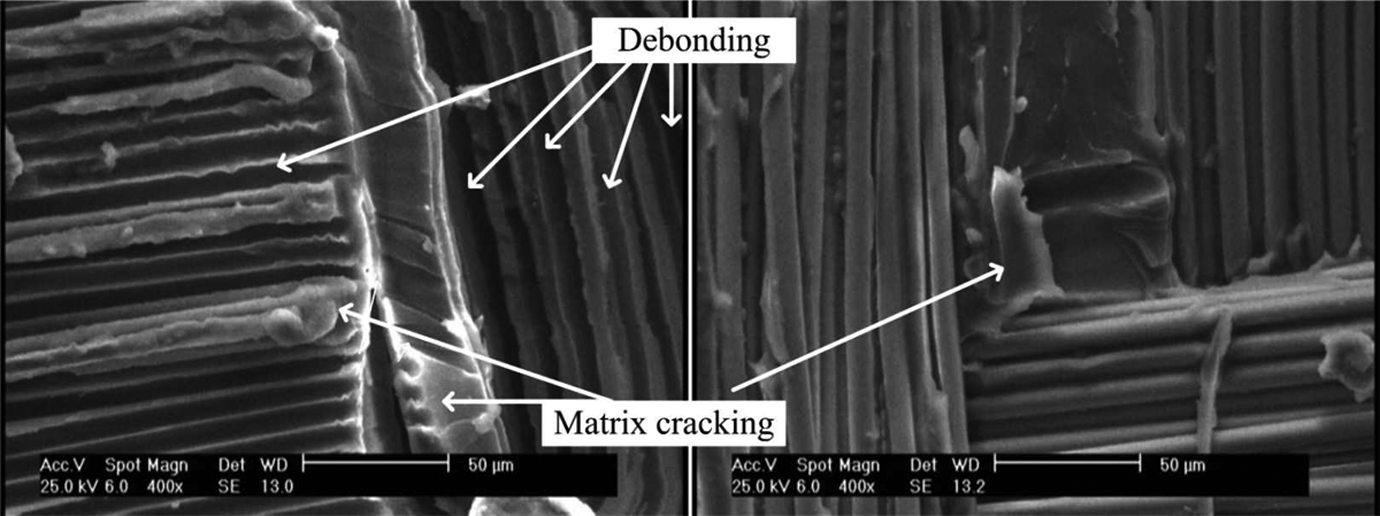
SEM observations for specimen W1. SEM: scanning electron microscopy.
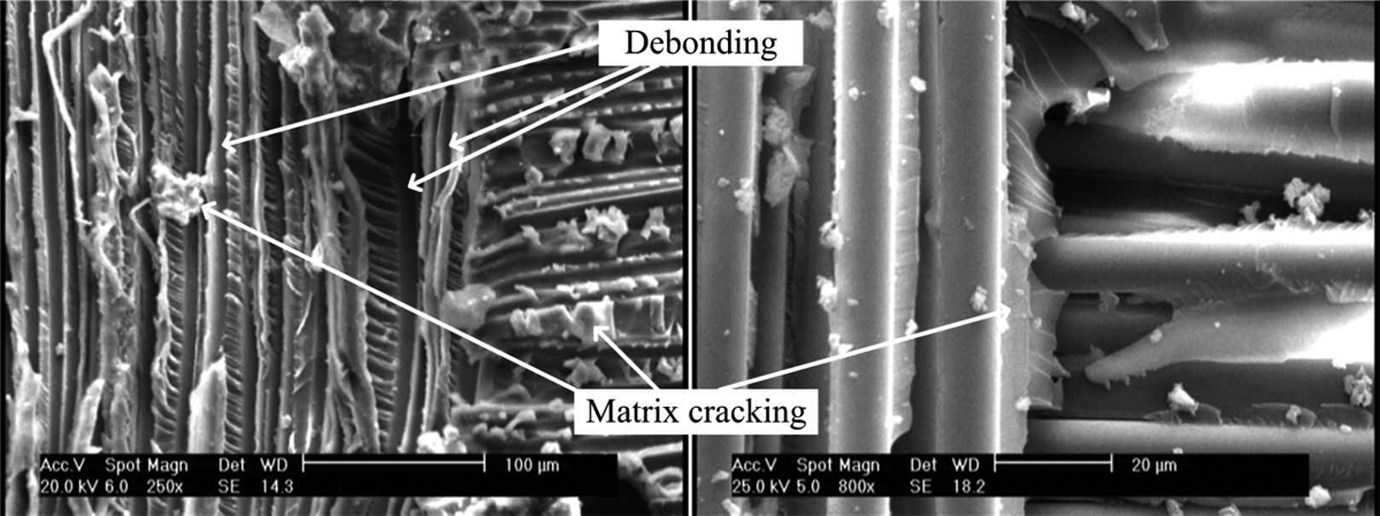
SEM observations for specimen W4. SEM: scanning electron microscopy.
By increasing modal ratio value in the unidirectional and woven specimens, few fiber breakages were detected, and the most damage mechanisms were observed in the resin and at the interface of the fiber and matrix. The highest fraction of matrix cracking and fiber–matrix debonding occurs in the woven specimens and mode II-dominated condition. In addition, in the woven layups, fiber breakage damage is rarely observed in all the loading conditions, which may be related to the lack of fiber bridging event.
Concluding remarks
In this work, multivariable analysis is applied to discriminate the damage mechanisms of glass/epoxy composites in actual occurring modes of delamination damage according to their AE patterns. Discrimination of the AE events was accomplished using WPT and FCM associated with a PCA. In WPT, the AE signals were decomposed into three levels, and the energy distribution criterion was then employed to find the dominant components from the energy criterion point of view. By performing PCA clustering analysis on the AE data, three clusters with separate frequency ranges were obtained. The frequency range of the resulting clusters and components were then correlated to the damage mechanisms. Based on the different viscoelastic relaxation processes and the obtained results, the dominant frequency range of the signals for matrix cracking is at a lower level than the dominant frequency range of fiber bundle breakage. The frequency range for debonding is also considered between the fiber and matrix interfaces. Therefore, it was found that the AE signals of the three clusters and the dominant components were representative of the matrix cracking, fiber–matrix debonding, and fiber breakage.
According to the distribution of the AE signals in different clusters, different AE signatures were noted between the different interface types and different GII/GT modal ratio values. The results showed that the percentage of the fiber breakage in the unidirectional specimens and mode I condition is higher than those in the woven specimens and mode II. Additionally, matrix cracking and fiber–matrix debonding are the dominant damage mechanisms in all the specimens. The SEM observations revealed that the damage mechanisms of matrix cracking, debonding, and fiber breakage were the sources of the AE signals. Therefore, it was concluded that the presented methods were successful in the classification process to improve the characterization of the damage mechanisms in actual occurring modes of delamination, that is, mode I, mode II, and the combination of these pure modes.
Footnotes
Acknowledgments
The authors wish to thank the Department of Mechanical Engineering at Amirkabir University of Technology, Tehran, Islamic Republic of Iran, for providing the facilities for this study.
Declaration of Conflicting Interests
The author(s) declared no potential conflicts of interest with respect to the research, authorship, and/or publication of this article.
Funding
The author(s) received no financial support for the research, authorship, and/or publication of this article.