
Abstract
Flame-retardant polyurethane elastomers (PUEs) have been prepared using trichloroethyl phosphate (TCEP) as flame retardant. The combustion performances and thermal decomposition properties of PUEs were studied using cone calorimetry test and thermogravimetric analysis, respectively. Kissinger method and Flynn–Wall–Ozawa (FWO) method were adopted to discuss the pyrolysis kinetics of PUEs. The experimental results showed that TCEP has good flame-retardant effect for PUE. With the increase of TCEP, the peak heat release rate and total heat release values decrease. A good diagram of linear regression can be obtained from both Kissinger and FWO methods. The activation energy values of flam- retardant PUE can be calculated from FWO method at different conversion rates.
Introduction
Polyurethane is one of the most important polymers. The worldwide demand for polyurethane has been estimated to be about 5% of the total world consumption of plastics. It has been widely used in dynamic applications, such as rollers and wheels, where a low heat buildup, high-loading resistance, and good cut-growth resistance are desired. The use of polyurethane elastomer (PUE) in wheels and rollers accounts for more than 50% of total high-performance cast elastomer market. 1 PUE is easily ignitable and highly flammable. The flammability of polyurethane has long been a factor that limits its wide use. 2 Therefore, it is required to be flame retardant for different applications.
There are a few approaches for enhancing the flame retardancy of polyurethane: (1) the incorporation of flame-retardant additives into the components by simple mechanical mixing at the compounding stage; (2) the addition of flame-retardant compounds containing functional groups, particularly hydroxyls, which become chemically bound in the polymer chain; and (3) coatings on the top surface of the flammable foam by means of fire-retardant materials. 2 Researchers adopted diverse methods to enhance the flame retardancy of polyurethane. For example, several authors 3 –7 showed that polyamides and polyurethanes can be modified at the amide nitrogen with alkylhalides after preliminary metalation of the polymer with sodium hydride under suitable conditions. Several patent literatures reported that expandable graphite (EG) is efficient in PU. 8 –11 Barbara C Levin 12 describes a small-scale laboratory two-step thermal decomposition process that simulates a real fire scenario in which an accidentally dropped cigarette causes an upholstered chair to smolder for a period of time before the chair bursts into flames. DH Napier 13 studied the toxic products from the combustion and pyrolysis of polyurethane. M Berta 14 investigated the effect of chemical structure on combustion and the thermal behavior of PUE-layered nanocomposites.
The understanding of degradation mechanism and kinetics is especially important since they would directly affect processing conditions, final properties, and application of these materials. Thermal decomposition kinetic studies could provide useful information on the thermal decomposition behavior and mechanisms involved through the expressions of various kinetic parameters. These kinetic parameters can be investigated by applying various kinetic models that define the thermal decomposition of materials under specific conditions. 15
This article describes the preparation and properties of PUEs that have been prepared using TCEP as a flame retardant. The influence of TCEP on thermal properties and fire retardancy was investigated. The combustion performances of PUE materials were studied using cone calorimetry test (CCT). The thermal decomposition properties of PUE materials were investigated by non-isothermal thermogravimetric analysis (TGA). The pyrolysis kinetics of materials was discussed by Kissinger method and Flynn–Wall–Ozawa (FWO) method. Based on the comprehensive analysis of PUE materials’ combustion performance and pyrolysis dynamic, the fire safety of the material got preliminary evaluation.
Experimental
Materials
Polyurethane prepolymer was provided by Sanmen Country Xincheng Polyurethane Products Factory (Zhejiang, China). 3,3′-Dichloro-4,4′-diaminodiphenylmethane (MOCA; density: 1.44g cm−3, 24°C; melting range: approximately 95–102°C; melting point: approximately 101–104°C) was supplied by Binghai Xingguang Chemical Co., Ltd (China). TCEP was purchased from Qingdao Lianmei Chemical Co., Ltd (China). The formulations are given in Table 1.
The composition of PUE.a
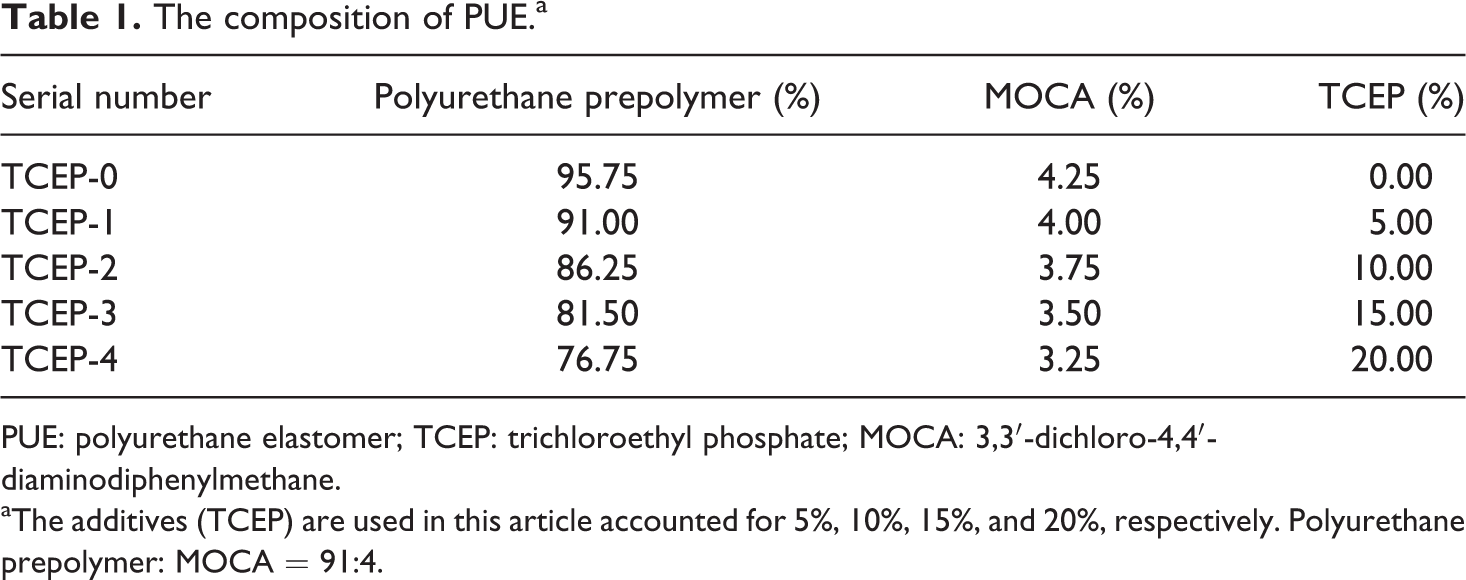
PUE: polyurethane elastomer; TCEP: trichloroethyl phosphate; MOCA: 3,3′-dichloro-4,4′-diaminodiphenylmethane.
aThe additives (TCEP) are used in this article accounted for 5%, 10%, 15%, and 20%, respectively. Polyurethane prepolymer: MOCA = 91:4.
Preparation of samples
TCEP was mixed in dry polyurethane prepolymer at 85°C in the Banbury mixer. MOCA was added slowly into the mixture at 85°C and mixed for 15 min. Then, the mixture was loaded into aluminum box with the size of 10 × 10 × 1 cm3. The product was dried at 120°C for 24 h in a vacuum oven.
Measurements
Cone calorimeter
The CCTs (Stanton Redcroft, UK) were performed according to ISO 5660 standard procedures. Each specimen of dimension 100 × 100 × 1 mm3 was wrapped in aluminum foil and exposed horizontally to an external heat flux of 35 kW m−2.
Thermogravimetric analysis
The data of TGA and derivative thermogravimetric analysis (DTG) were measured by TGA using non-isothermal method. The technique of program controlling temperature is adopted, and the PUE material was subjected to heating rates of 5, 10, 20, and 40°C min−1 under nitrogen atmosphere, respectively.
TGA data provide information for the calculation of the conversion of sample (α) during decomposition. At linear heating rate α is defined as: 15
where m0 is the initial mass, mT is the mass at decomposition temperature, and mfinal is the mass at final decomposition reaction. 15
The activation energy (Ea) of thermal decomposition kinetic for these specimens was then determined using Kissinger method and FWO method for kinetic studies. These methods can be applied for studying thermal degradation and decomposition kinetic of polymeric materials based on the Arrhenius equation. 16 –19
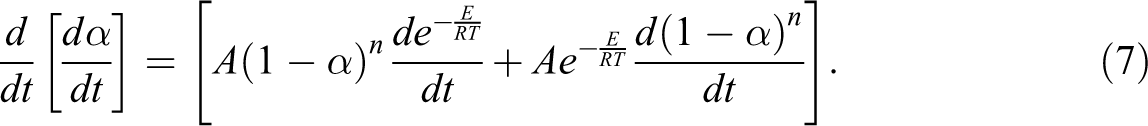
For the reaction: A(s) → B(s) + C(g), the decomposition rate can be expressed as:
According to the Arrhenius equation:
So,
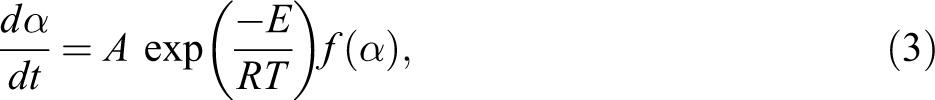
where α is the fraction of weight loss or conversion value of decomposition, A is the pre-exponential factor, E is activation energy, R is universal gas constant, n is reaction order, t is time, and T is temperature.
When the heating rate is constant:
where β is the heating rate (K min−1).
For the kinetic study of non-isothermal experimental, the equation is rewritten using the following equation:
So, differential and integral methods were applied for the calculation of thermal degradation or decomposition kinetic parameter 18,19
Kissinger method
According to equation (1) and support
From the equation,
When thermal mass loss rate is maximum, in other words
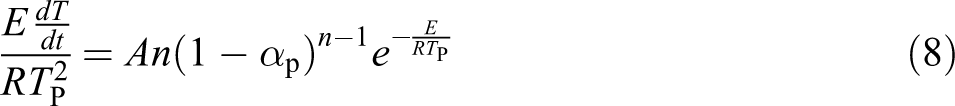
The Kissinger method is based on this support:
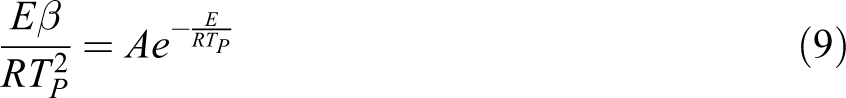
The Kissinger model can be described as:

Through the plot of
The Kissinger method was derived from the basic kinetic equation for heterogeneous chemical reactions that could be applied for calculating the thermal decomposition of PUE without the need to know the reaction order or the conversion function.
15
FWO method
The decomposition kinetic information of Flynn and Wall method was developed by Ozawa to form a kinetic equation known as the FWO model, 16,20 –22 which is derived from the integral method of equation (6). The FWO model involves measuring the degradation temperatures corresponding to values of weight loss during the decomposition (α). This equation is integrated with α = 0 at T = T0 (the initial temperature) and can be assigned by the Doyle approximation. 23,24 FWO model is expressed as follows:
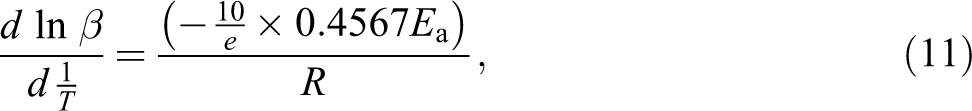
where E can be calculated from the slope of logarithm heating rate as a function of inverse temperature.
Results and discussion
Cone calorimetry test
The cone calorimetry based on oxygen consumption principle has been a universal method used to compare and study the flammability characteristics of materials. It remains one of the most useful bench-scale tests that can be used to predict the combustion behavior of materials in a real fire. Focused by external heat flux, the cone calorimeter represents a well-defined flaming condition after ignition. The heat release rate (HRR) measured by CCT is a very important parameter, as it expresses the intensity of a fire. But, often used to describe the fire hazard behaviors are averaged HRR or peak HRR (PHRR) for actual situation. 25 –27 Usually, the value of averaged HRR is low for a highly flame-retardant system. The PHRR value is used to express the intensity of a fire.
Heat release rate
Figure 1 shows the HRR curves of different samples obtained from CCT. It is obviously found that the HRR of all materials shows only one peak during combustion. The value of PHRR and the time to PHRR is different for different samples. It can be found that the PHRR of pure PUE (TCEP-0) is 2940 kW m−2. With the addition of TCEP, the PHRR value decreases. For instance, TCEP-1 is dramatically reduced to 2422 kW m−2. The PHRR values of TCEP-2, TCEP-3, and TCEP-4 are 2140, 1956, and 1589 kW m−2, respectively. TCEP-4 with 20 wt% TCEP has the lowest PHRR value among all samples. In addition, the time to PHRR is shortened with the addition of TCEP. TCEP-0 is the last to reach PHRR value. The time to PHRR of TCEP-0 is 175 s, and the time to PHRR of TCEP-2, TCEP-3, and TCEP-4 is 160 s, 145 s, 150 s, and 150 s, respectively. The time to ignition of TCEP-0 is 37 s, and it increases with the addition of TCEP. In the case of flame-retardant samples, the time to ignition of TCEP-1, TCEP-2, TCEP-3, and TCEP-4 is 57 s, 47 s, 56 s, and 50 s, respectively. The complete combustion time of all samples also decreased with the increase of TCEP. The burning time of TCEP-0 is about 330 s, and the burning time of the samples containing TCEP decreases obviously with the addition of TCEP.
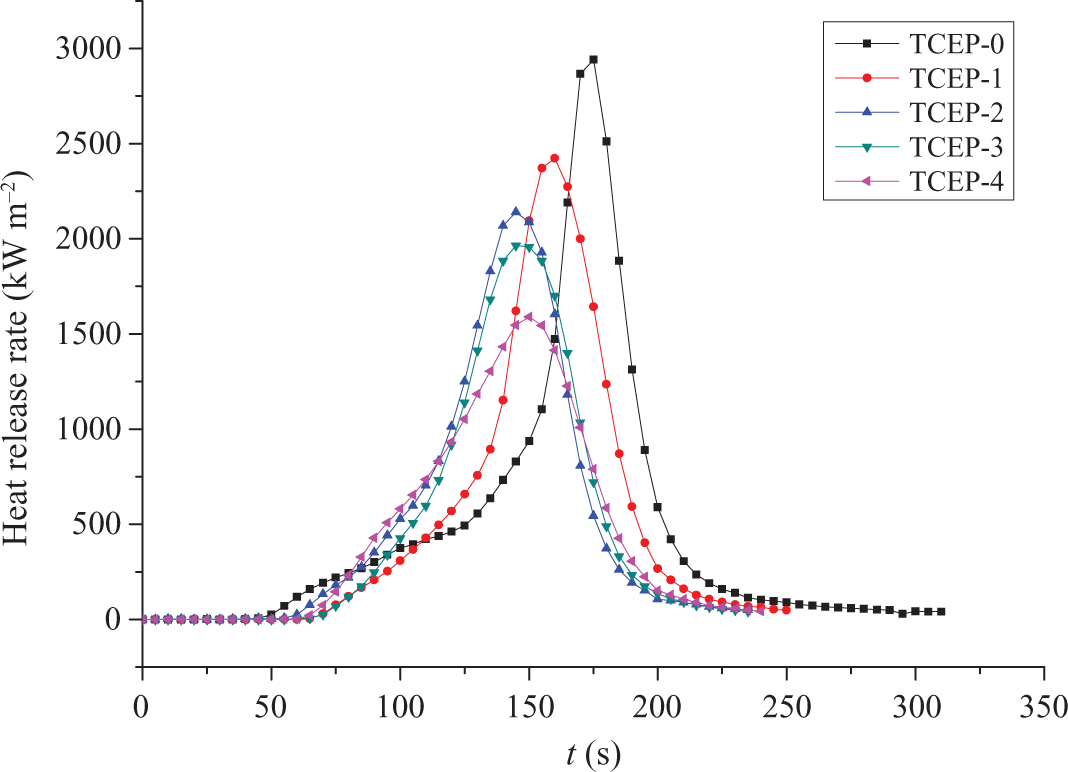
The HRR curves of PUE. HRR: heat release rate; PUE: polyurethane elastomer.
It can be concluded that with the increase of TCEP, the value of PHRR, the time to PHRR, and the burning time are all decreased. This is likely due to the fact that TCEP can form efficient protective layer, which can isolate the materials from heat resource, prevent heat transfer, and protect underlying materials, thus reducing the HRR values and the related parameters.
Total heat release
Figure 2 presents the total heat release (THR) for all the samples. The slope of THR curve can be assumed as representative of fire spread. 28 From Figure 2, it can be seen that with the increase of TCEP, the value of THR decreased. The values of THR from TECP-0 to TCEP-4 are 142.3, 126.3, 119.7, 113.9, and 109.2 MJ m−2, respectively. This suggests that TCEP can reduce the combustion heat of PUE in the burning process. In other words, the test results showed that TCEP has good flame-retardant effect for PUE. It can reduce the heat release during combustion process and reduce the fire severity.
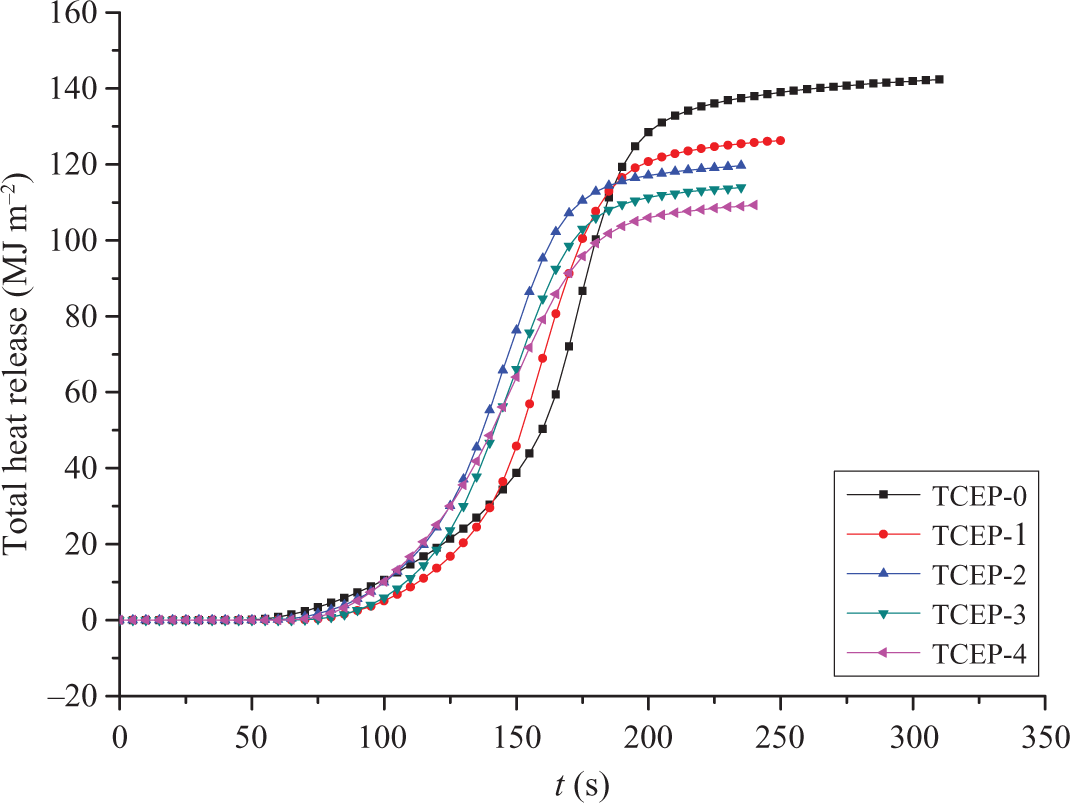
The THR curves of PUE. THR: total heat release; PUE: polyurethane elastomer.
Pyrolysis behavior and dynamics of PUE materials
Thermogravimetry analysis
The thermal stability of a flame-retardant polymeric material is very important, which mainly concerns the release of decomposition products and the formation of char. TGA is a useful technique to evaluate the decomposition kinetics of the composites as a function of temperature and time. 15
TGA and DTG curves of all samples, performed at a constant heating rate of β = 10°C min−1, are shown in Figures 3 and 4. It can be seen that TCEP-0 has one broad main decomposition process. It begins to decompose at about 317°C (5.0% weight loss). The temperature of maximum mass loss rate (Tmax) is 413°C, as shown in Figure 4. The initial decomposition temperatures of the samples with TCEP, from TCEP-1 to TCEP-4, are 297°C, 273°C, 267°C, and 267°C, respectively, which are all lower than that of TCEP-0. In the degradation process, samples with TCEP decompose faster than TCEP-0 owing to the less thermal stability of TCEP, which can degrade into polyphosphoric acid. TCEP-0 and TCEP-1 have one broad main decomposition process, but TCEP-2, TCEP-3, and TCEP-4 have two main decomposition processes. It can be seen from Figure 3 that the char residues (Yc, wt %) at 800°C of TCEP-4 is 10.4 wt%, which is higher than others. The above results indicate that the samples with TCEP have more Yc than the sample without TCEP. Furthermore, the Yc increased with the increasing TCEP.
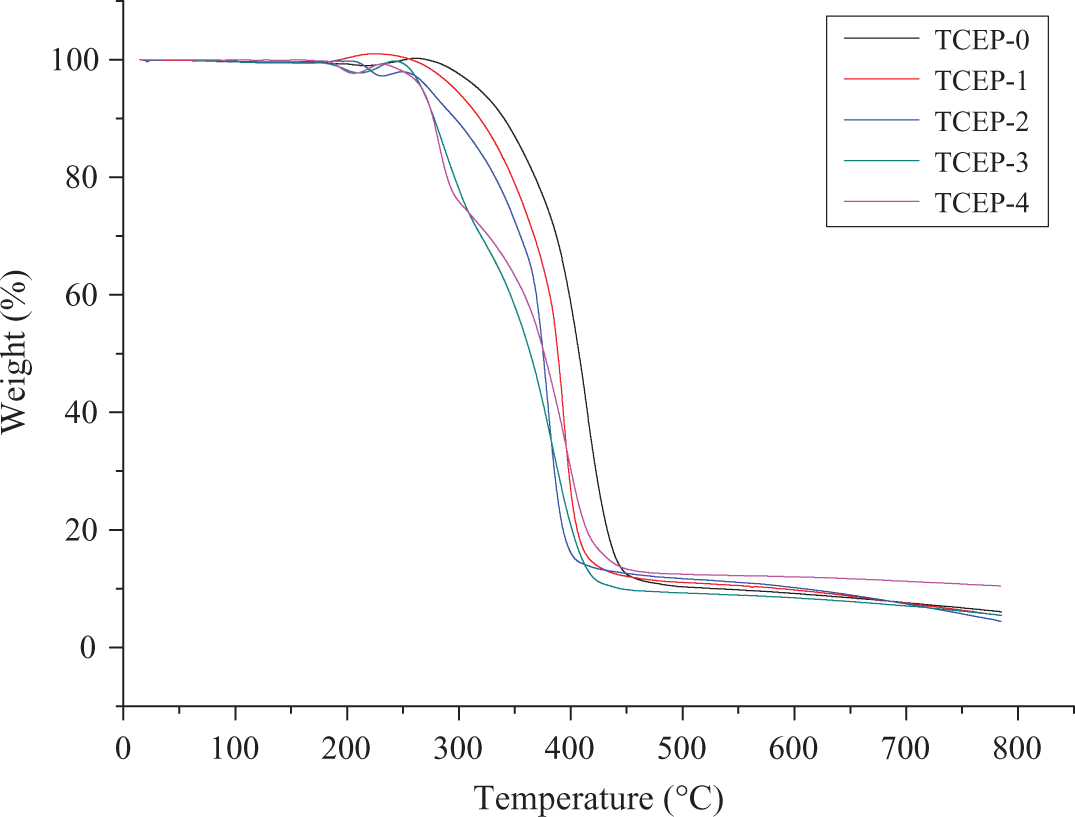
TG curves of all samples degradation processes, performed at a constant heating rate of β = 10°C min−1. TG: thermogravimetry.
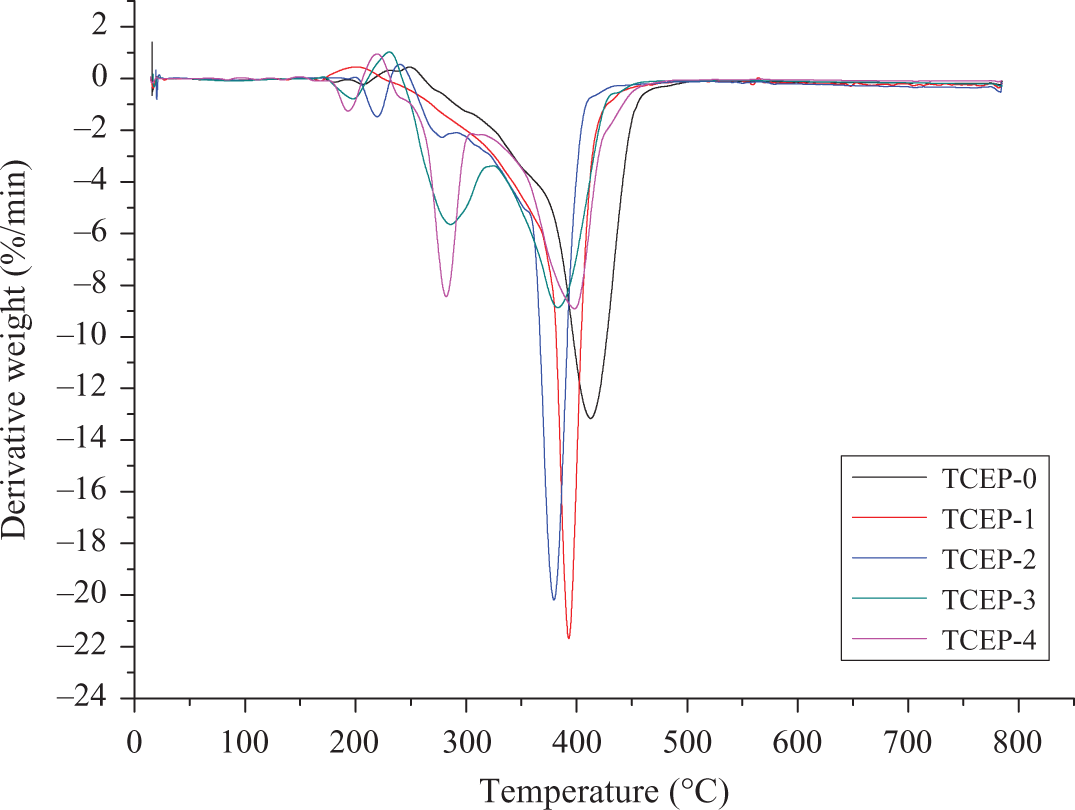
DTG curves of all samples degradation processes, performed at a constant heating rate of β = 10°C min−1. DTG: derivative thermogravimetry.
Figures 5 and 6 show the TGA and DTG curves of TCEP-0 at four different heating rates. For this sample, DTG curves are asymmetric, with a single, highly expressed peak. It can be concluded that PUE without TCEP has only one decomposition process. When the heating rate is 5, 10, 20 and 40°C min−1, the initial decomposition temperatures are 292°C (5.0% weight loss), 317, 326 and 352°C, respectively. The corresponding temperatures of maximum weight loss are 396°C, 414°C, 432°C and 460°C. From the above results, it can be found that the temperatures of onset and maximum weight loss are both increased with the heating rate increasing.
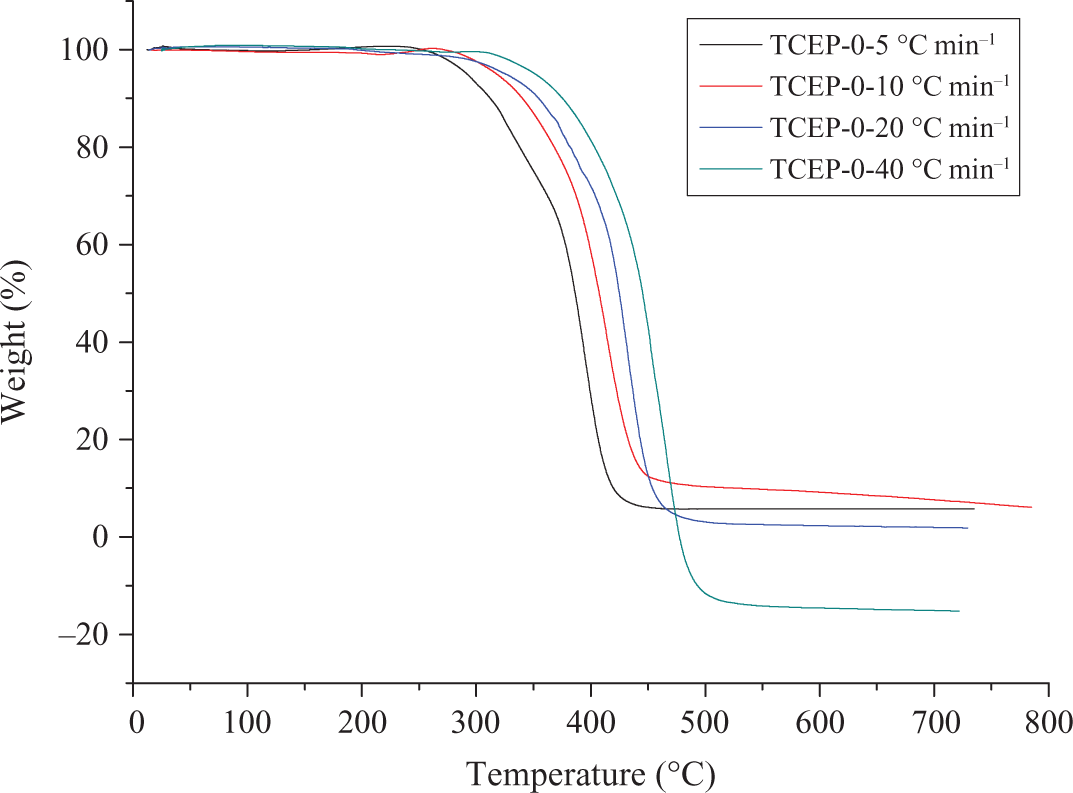
TGA curves of TCEP-0 at different heating rates. TGA: thermogravimetric analysis; TCEP: trichloroethyl phosphate.
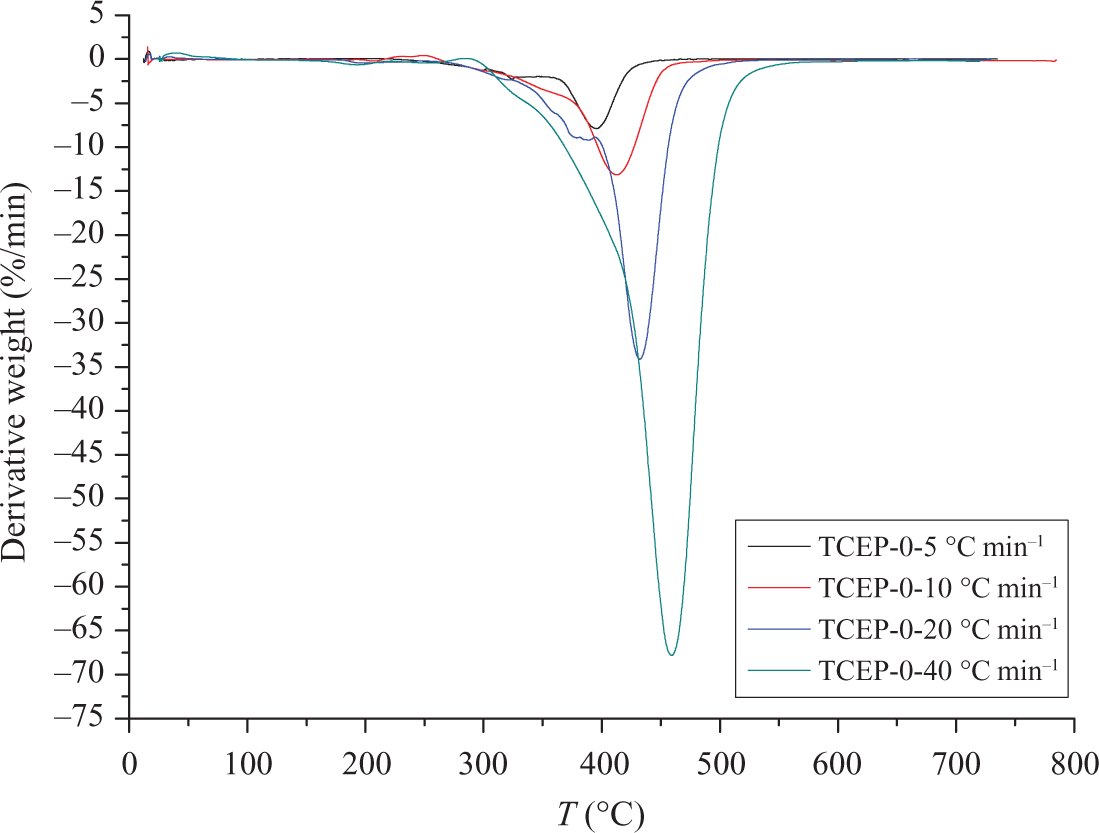
DTG curves of TCEP-0 at different heating rates. DTG: derivative thermogravimetry; TCEP: trichloroethyl phosphate.
Figures 7 and 8 show the TGA and DTG curves of TCEP-4 at four different heating rates. There is a small asymmetry between TCEP-4 and TCEP-0 samples. TCEP-4 has two main decomposition processes, as shown in Figure 8. The first decomposition stage is the decomposition of TCEP. The second decomposition stage is the decomposition of PUE. When the heating rates are 5, 10, 20, and 40°C min−1, the initial decomposition temperatures are 223°C, 267°C, 275°C, and 313°C, respectively. This means that the degradation temperature increases with increase in the heating rate (β). In the first stage of decomposition, when the heating rate is 5, 10, 20 and 40°C min−1, the temperature of maximum weight loss is 256, 282, 304, and 342°C, respectively. In the second stage, the temperatures of the maximum weight loss are 355, 398, 358, and 414°C, respectively.
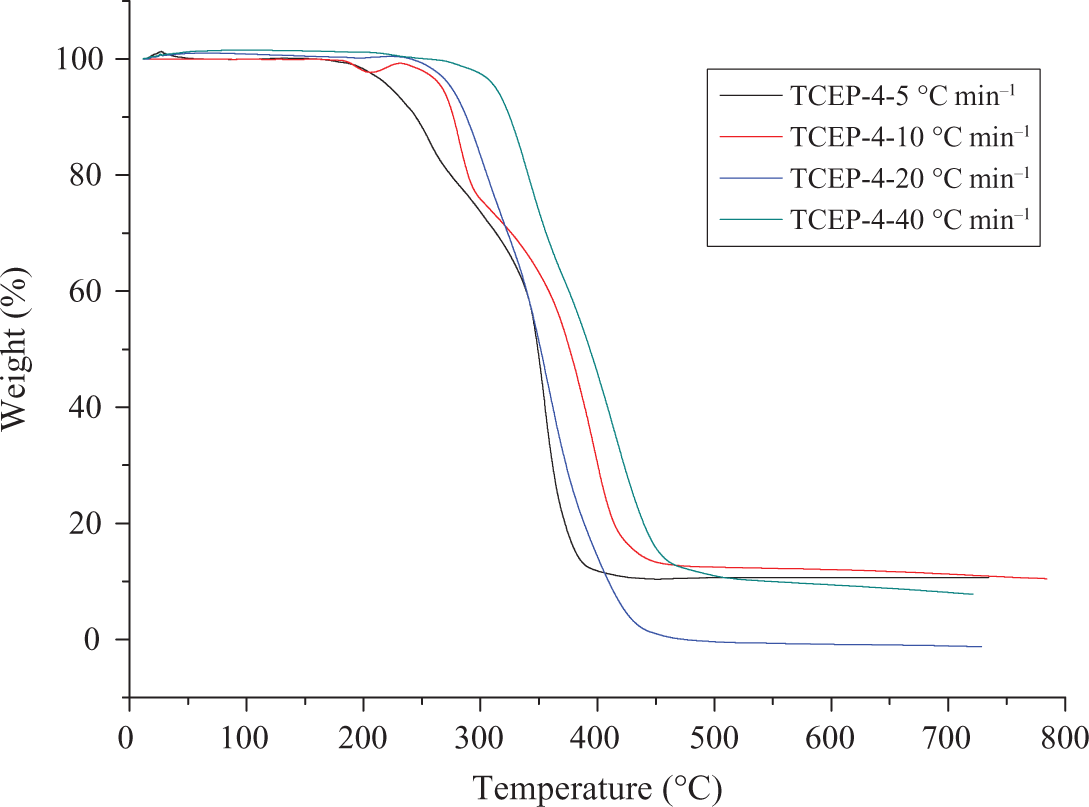
TG curves of TCEP-4 at different heating rates. TG: thermogravimetry; TCEP: trichloroethyl phosphate.
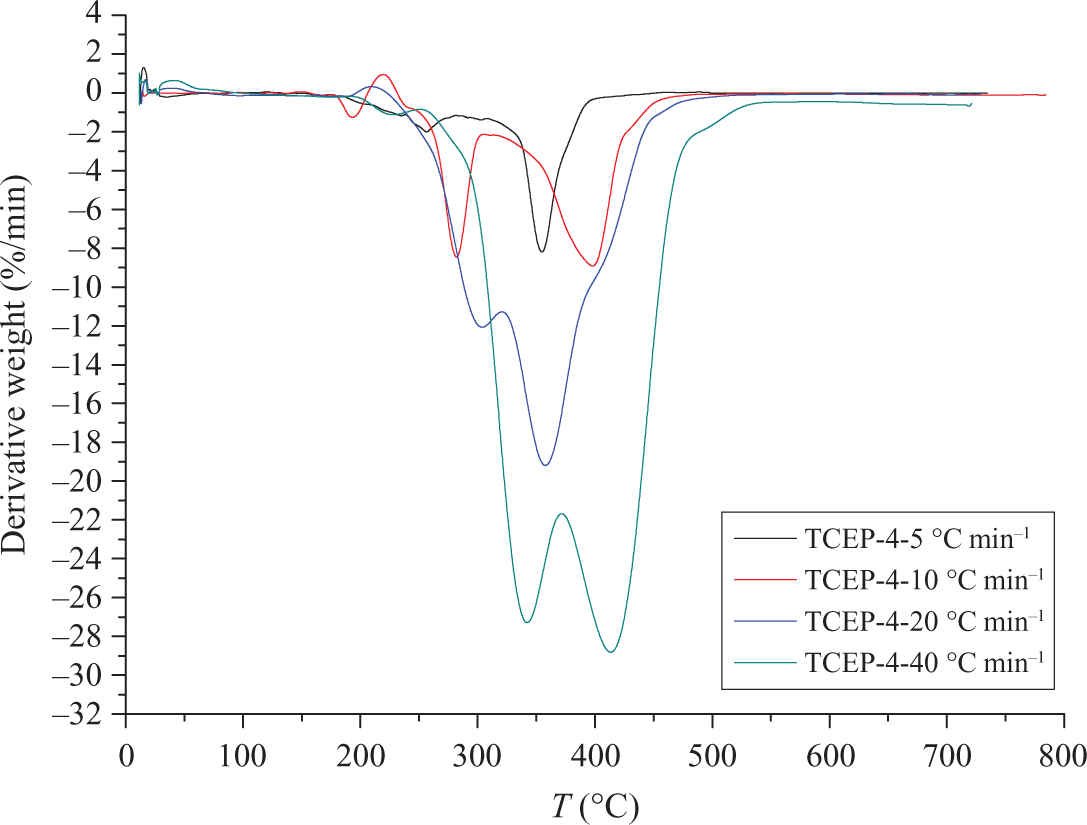
DTG curves of TCEP-4 at different heating rates. DTG: derivative thermogravimetry; TCEP: trichloroethyl phosphate.
It can be noted that the heating rate would significantly affect the decomposition characteristics of the specimens. The degradation temperature is found to increase with the heating rate (β) increasing, which corresponds to the temperature superposition principle. 29 The TGA and DTG results show that the temperatures of initial decomposition and Tmax increase with the rising of heating rates, and the rising of heating rates make the decomposition rate fast, which means that much poisonous harmful gases will be produced when the heating rate is high. This is harmful for the environment and people. 2
Non-isothermal decomposition kinetics for PUE
From equations (7) and (10), a line can be made and the slopes from the plots can be used to calculate the E values. The value of Tp is the maximum heat loss temperature.
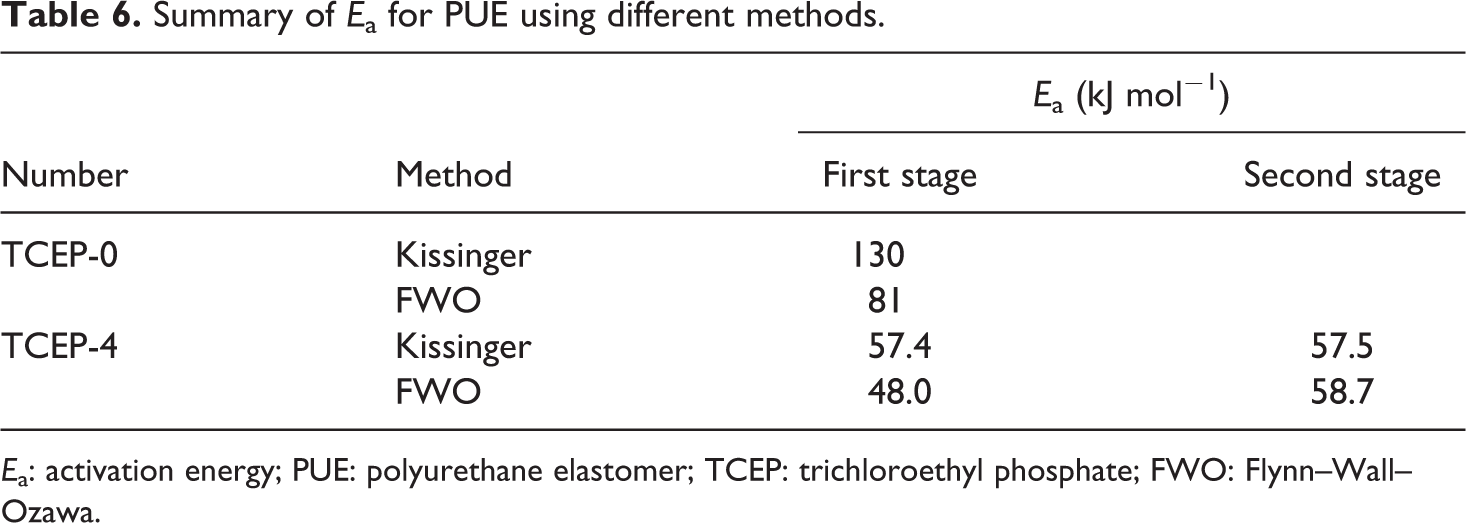
From Figure 9, it can be seen that by adopting Kissinger method to solve the Ea, a good diagram of linear regression can be obtained. From this, the Ea value is much reliable, and the dynamics parameter value, such as reaction order, can be calculated. From Table 2, it can be found that the Tmax of TCEP-0 increases with the improvement of heating rate. Computational results of Kissinger showed that the Ea of PUE is 130 kJ mol−1.
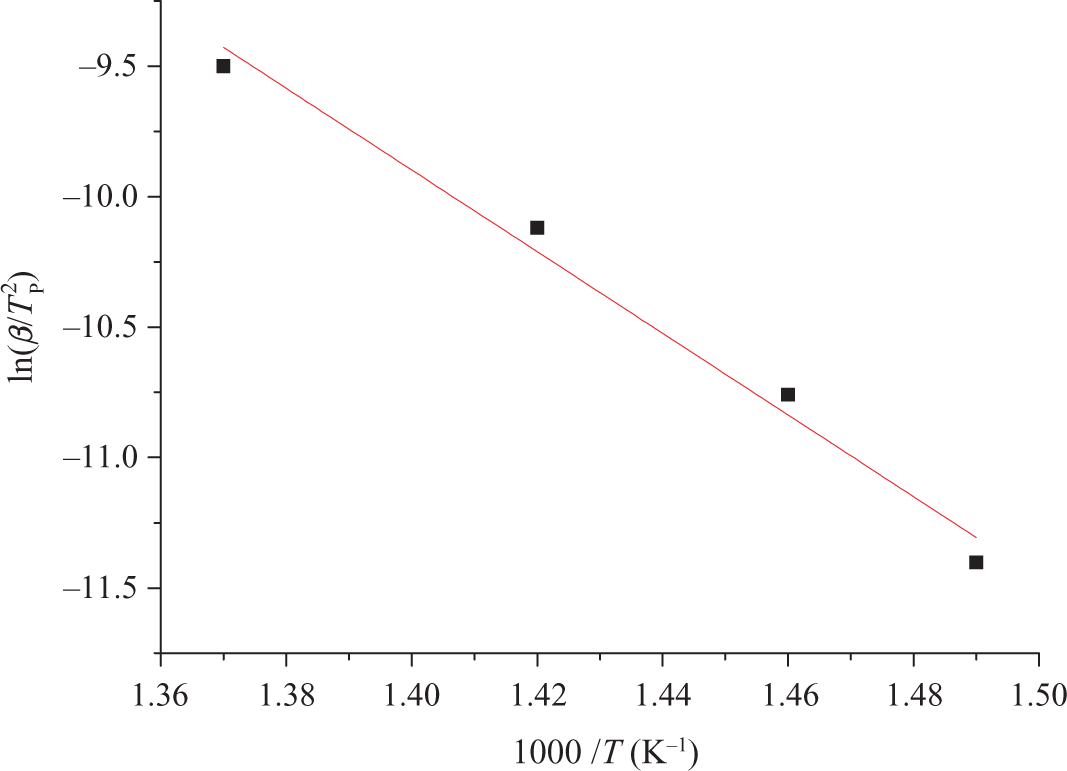
Kinetic parameters of TCEP-0 evaluated by Kissinger method. TCEP: trichloroethyl phosphate.
Parameters of TCEP-0 evaluated by Kissinger method.
TCEP: trichloroethyl phosphate; β: heating rate; Tp: maximum heat loss temperature; Ea: activation energy.
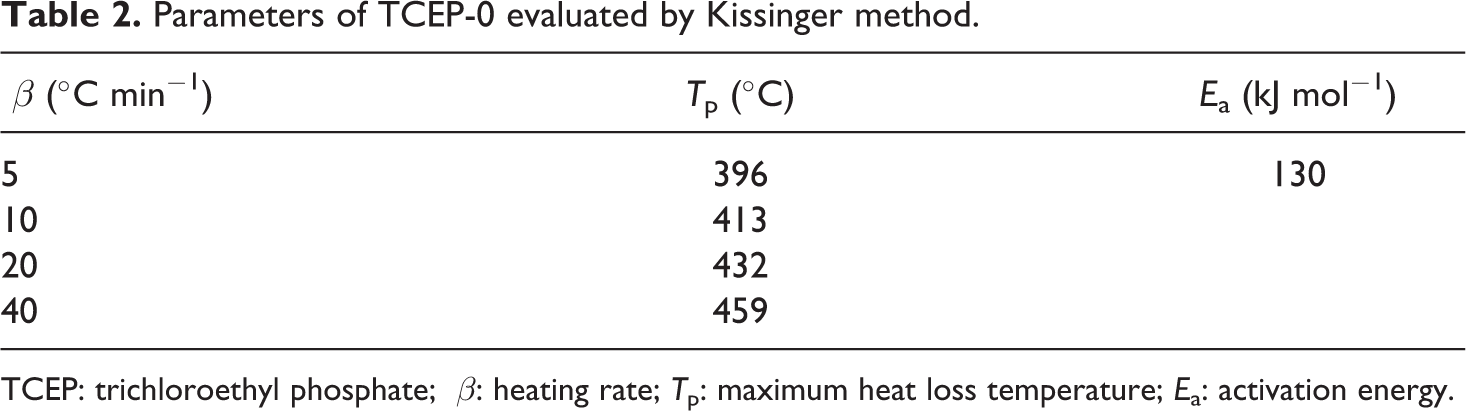
Although TCEP-4 has two main decomposition stages, it is possible to determine the Ea for each stage value using Kissinger method. From Figure 10, it can be seen that by adopting Kissinger method to solve the Ea, a good diagram of linear regression can be obtained. From Table 3, it also can be found that the Tmax of TCEP-4 increases with the improvement of heating rate. Computational results of Kissinger showed that the first stage Ea of TCEP-4 is 57.4 kJ mol−1, and the second stage Ea is 57.5 kJ mol−1.
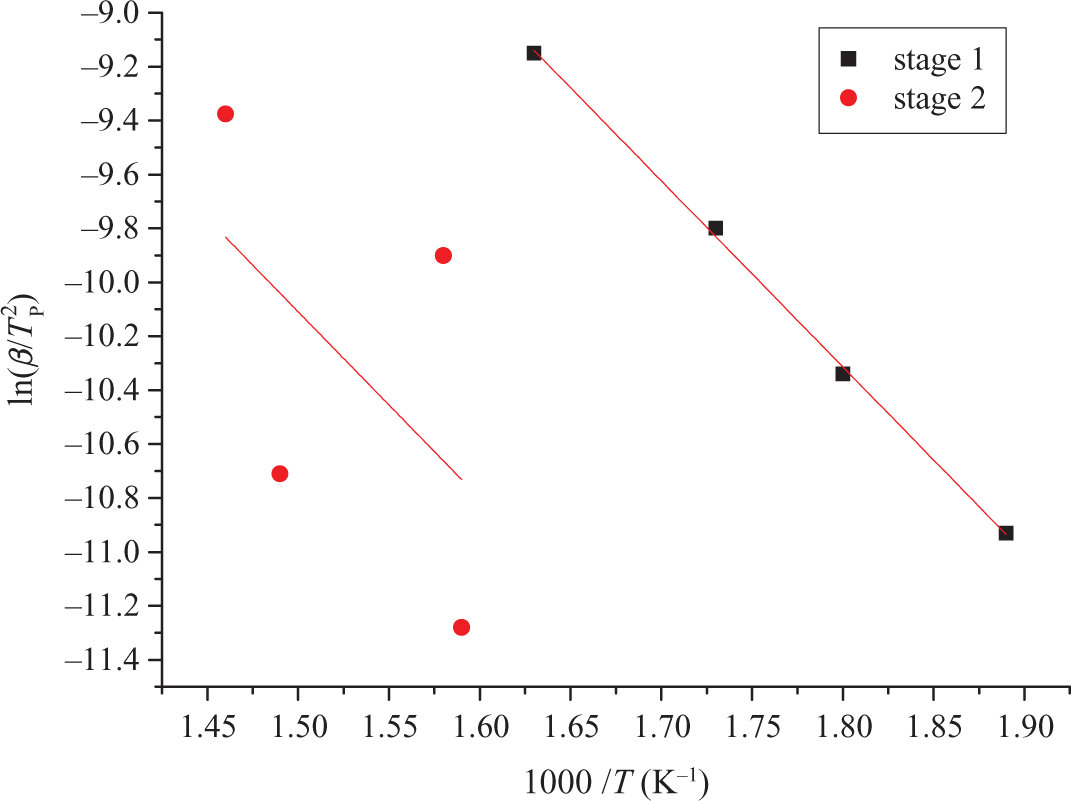
Kinetic parameters of TCEP-4 evaluated by Kissinger method. TCEP: trichloroethyl phosphate.
Kinetic parameters of TCEP-0 evaluated by FWO method. TCEP: trichloroethyl phosphate; FWO: Flynn–Wall–Ozawa.
Kinetic parameters of TCEP-4 evaluated by FWO method. TCEP: trichloroethyl phosphate; FWO: Flynn–Wall–Ozawa.
Parameters of TCEP-4 evaluated by Kissinger method.
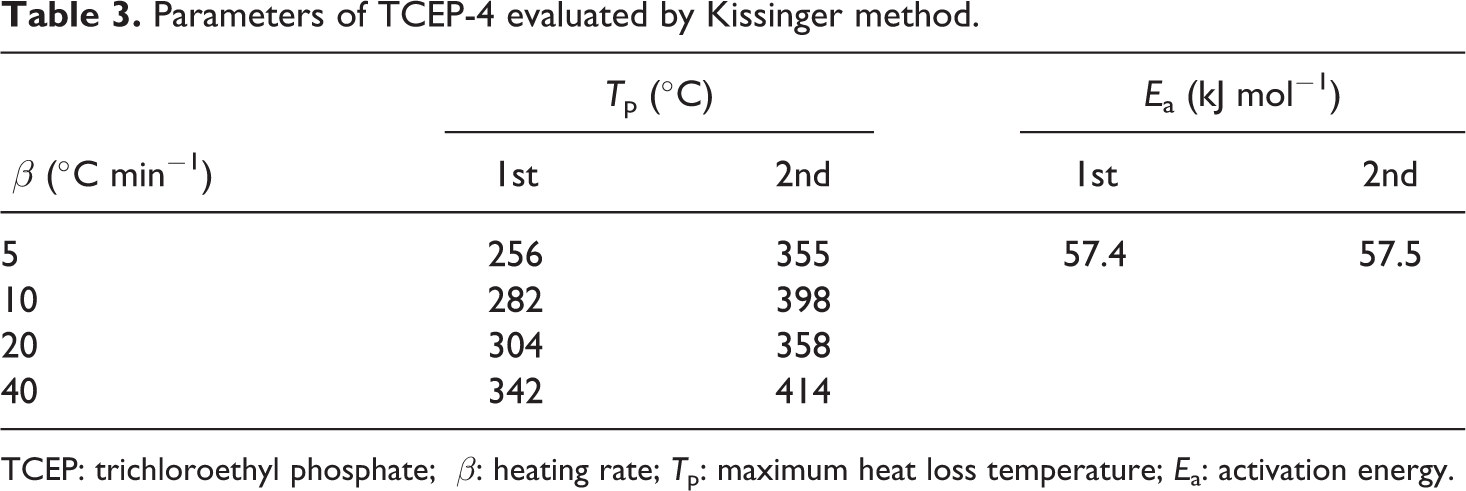
TCEP: trichloroethyl phosphate; β: heating rate; Tp: maximum heat loss temperature; Ea: activation energy.
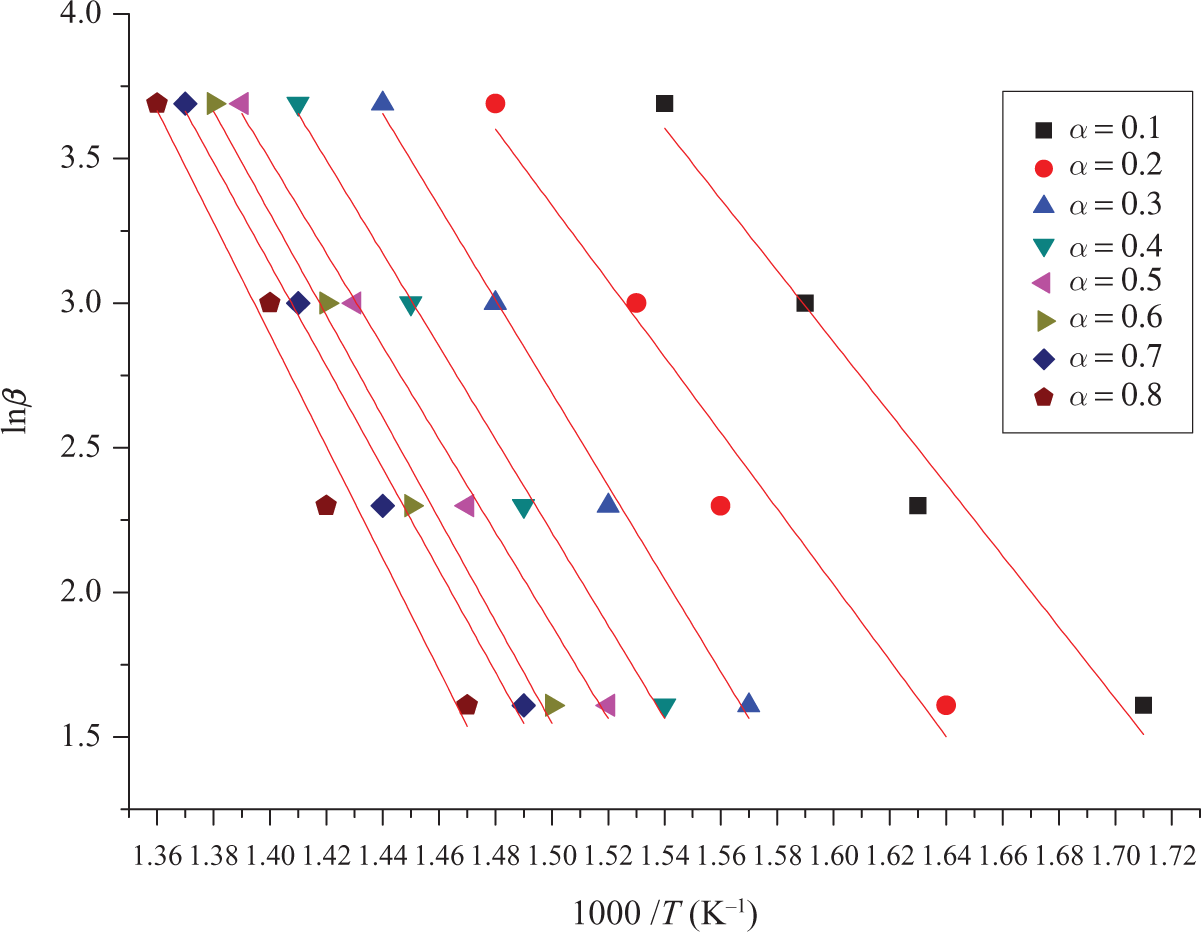
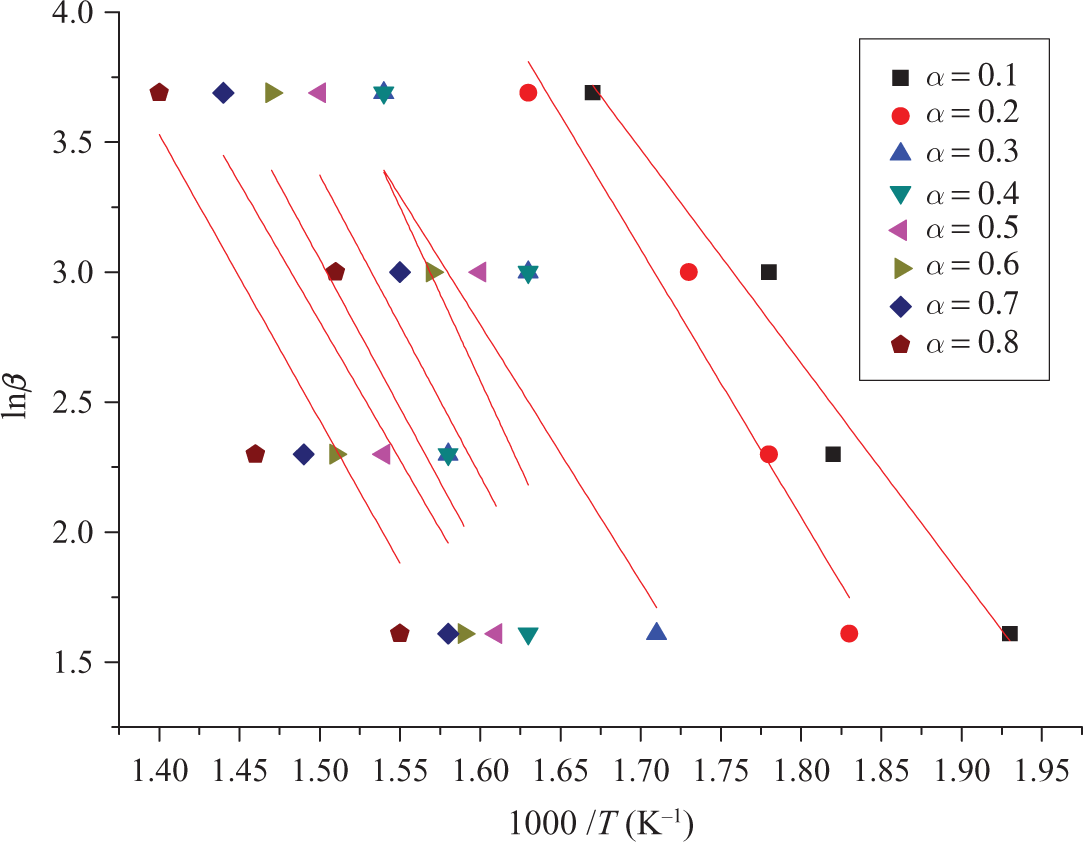
From equation (11), slope and Ea of PUE can be drawn and linear fitted, which can be calculated from the slope of logarithm heating rate as a function of inverse temperature. If a particular specimen decomposition mechanism was the same at all conversion levels, the lines would all have the same slope. 17 TCEP-0 is in accordance with this situation. So, TCEP-0 has only one decomposition process.
The apparent activation energies of TCEP-0, from α = 0.1 to α = 0.8 conversions, calculated with FWO method are shown in Table 4. It can be seen that the Ea value of TCEP-0 increases with the increase of thermal mass loss rate.
Apparent Ea of TCEP-0 obtained from FWO method.
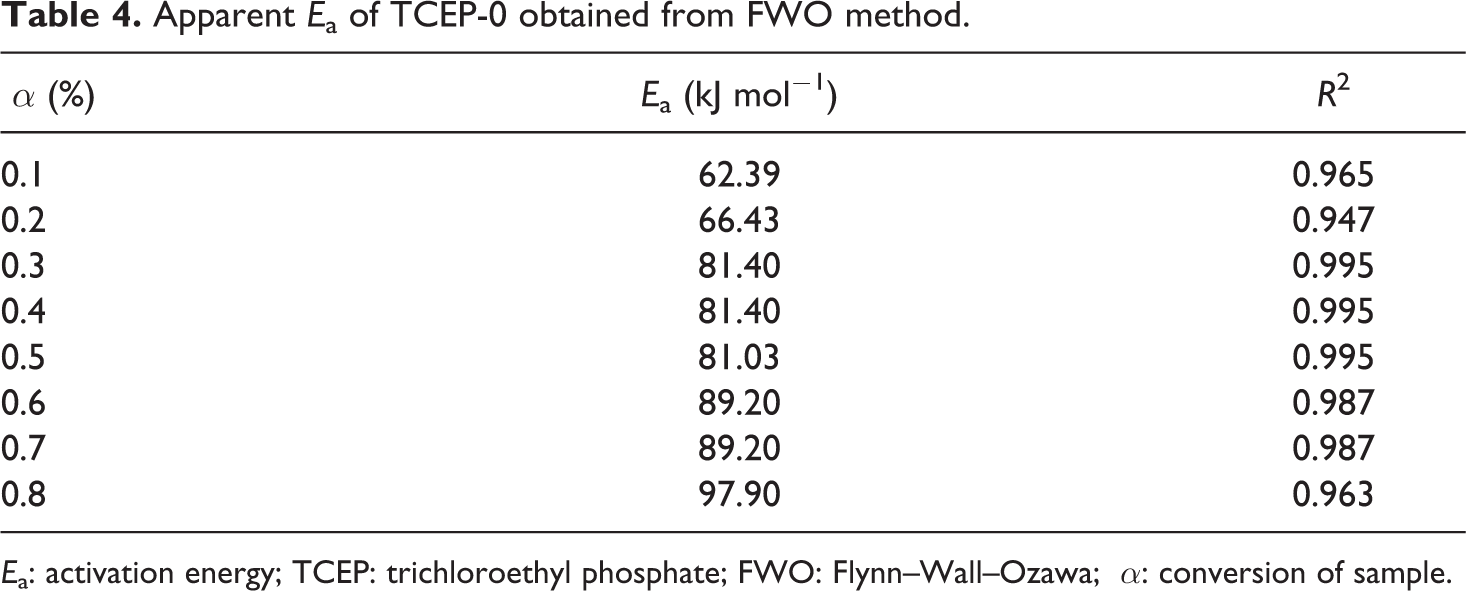
Ea: activation energy; TCEP: trichloroethyl phosphate; FWO: Flynn–Wall–Ozawa; α: conversion of sample.
It can be seen from Table 5 that at lower conversions (up to α = 0.3; looking the values of Ea obtained using FWO method), we have a sharp increase in the Ea value from Ea = 50.07 kJ mol−1 to Ea = 67.56 kJ mol−1. After that (in the conversion range of (
Apparent Ea of TCEP-4 obtained from FWO method.
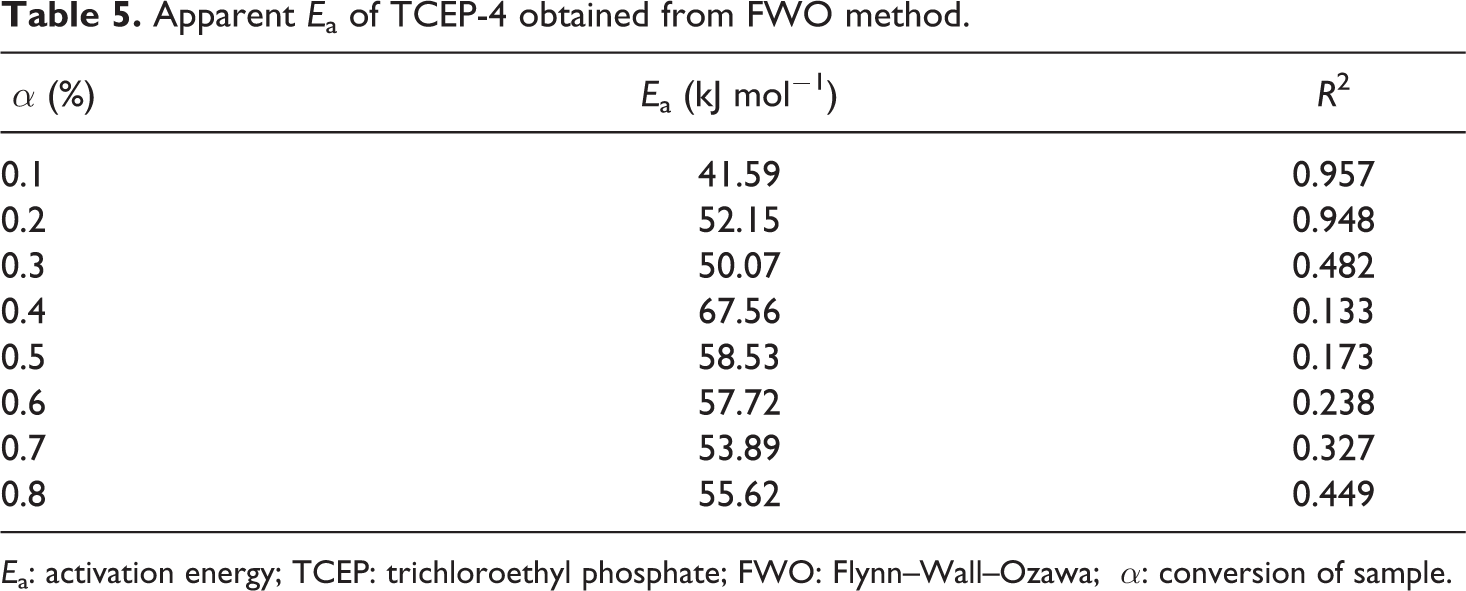
Ea: activation energy; TCEP: trichloroethyl phosphate; FWO: Flynn–Wall–Ozawa; α: conversion of sample.
The first mechanism corresponds to the part where the small mass loss appears, while the second part where the substantial mass loss take place is due to the main degradation mechanism, which corresponds to conversion levels after α = 0.3.
The apparent Eas of PUE, calculated with Kissinger method and FWO method, are shown in Table 6. It can be seen from Table 6 that there are some differences in the Ea values calculated by using the Kissinger method and the FWO method. Namely, the difference of the calculated Ea by two methods can be explained by a systematic error due to improper integration. 31 The relation of Kissinger method is derived assuming a constant Ea value, introducing systematic error in estimation of Ea in the case that Ea varies with α. 32 It was due to the calculation of Ea from the peak degradation temperature using the Kissinger model may have neglected some of the decomposition reactions at other temperatures. 33
Summary of Ea for PUE using different methods.
Ea: activation energy; PUE: polyurethane elastomer; TCEP: trichloroethyl phosphate; FWO: Flynn–Wall–Ozawa.
Conclusions
TCEP has good flame-retardant effect for PUE. The CCT results showed that with the increase of TCEP, the value of PHRR and THR decreases. TCEP can reduce the combustion heat of PUE in the burning process.
The TGA and DTG results showed that the addition of TCEP can affect the thermal decomposition progress. The addition of TCEP can affect the initial thermal decomposition, leading the decomposition temperature to low temperature area. In addition, the initial decomposition temperatures, the mass loss rate, the maximum mass loss temperature, and the decomposition rate of PUE increase with the rising of heating rates. The Kissinger results showed that the Tmax of PUE increases with the improvement of heating rate. The Ea values can be solved under different percent conversion by the method of FWO.
Footnotes
Declaration of Conflicting Interests
The author(s) declared no potential conflicts of interest with respect to the research, authorship, and/or publication of this article.
Funding
The author(s) disclosed receipt of the following financial support for the research, authorship, and/or publication of this article: The authors gratefully acknowledge the financial support of the National Natural Science Foundation of China (grant no. 51106078).