
Abstract
This article presents the results of acoustic emission (AE) monitoring of crack propagation in 2024-T3 clad aluminum panels repaired with adhesively bonded octagonal and elliptical boron/epoxy composite patches using FM-73 adhesive under tension–tension fatigue loading. Two crack propagation gages and four broadband AE sensors were used to monitor crack initiation and propagation, respectively. The acquired AE signals were processed in time and frequency domain to identify sensor features correlated with fatigue cycle and crack propagation, which were used to train neural networks for predicting crack length. The results show that AE events are correlated with crack propagation, and crack propagation signals can be differentiated from signals due to matrix cracking, fiber breakage, and shear of the composite patch. Three back-propagation cascade feed-forward networks were trained to predict crack length using number of fatigue cycles, number of AE events, and number of fatigue cycles and number of AE events together as inputs, respectively. It was found that network with fatigue cycles as input gave good results, while the network with just AE events as input gave greater error. However, the network using both fatigue cycles and number of AE events as inputs to predict crack length gave much better results.
Keywords
Introduction
The high acquisition costs and long backlog associated with the purchase of modern military and commercial aircrafts, coupled with the existing economic and market forces, have resulted in the utilization of aircrafts beyond their original design life. Due to extended service life of aircrafts, many military and commercial aircrafts have suffered structural damage or failure from fatigue, stress corrosion, structural cracks, or their combination; hence, maintenance or repair has become an important issue in recent years.
The technique of repairing cracked metallic aircraft structures using high-strength advanced composite materials is commonly known as “crack patching” and was pioneered by the Aeronautical and Maritime Research Laboratories for the Royal Australian Air Force in early 1970s. 1 The composite reinforcement, also known as a patch, can be attached to the damaged or weakened structure either by mechanical fastener or adhesive bonding. The use of adhesively bonded composite patch as a method of repair has several advantages over mechanically fastened repair methods, which include reduced installation cost, increased strength, and fatigue life and hence effective crack retardation, reduced repair downtime, elimination of unnecessary fastener holes in an already weakened structure and stress concentrations at fasteners, corrosion resistance, high stiffness, and lightweight.
Development of a reliable Nondestructive Testing and Evaluation (NDT&E) method for detection of crack initiation and propagation is very closely related to assessing the integrity of structures and thereby increasing their safe operational life. Acoustic emission (AE) testing is one of the most popular and widely used methods of NDT&E and is amenable to real-time monitoring of fatigue crack growth. AE signals are high-frequency transient stress waves produced by rapid release of energy from localized sources that travel through the material. During fatigue crack propagation, a portion of the strain energy released by the growing crack is transmitted through the parent material as an AE signal. These AE waves can be detected by broadband high-fidelity AE sensors attached to the specimen.
The difference between the AE testing technique and other NDT&E methods is that AE detects the activities inside the materials, while other NDT&E methods, such as ultrasonic, eddy current, and X-ray, attempt to examine the internal structures of the materials and require scanning the whole structure, which often needs to be disassembled and taken to the laboratory to be examined when the damage areas are inaccessible to these techniques. Furthermore, AE only needs the input of one or more relatively small sensors attached to the surface of the structure.
Gorman 2 conducted important study of the classical plate wave theory in which the waves in plates can be separated into two types, namely, extensional and flexural plate modes. These features provide superior AE source location and noise reduction.
Prosser et al. 3 discussed advanced waveform-based AE beam analysis technique to study initiation of matrix cracking in cross-ply graphite/epoxy composite plate. Four broadband, high-fidelity AE sensors and a high sampling rate of 25 MHz were used for accurate source location. They reported that noise signals from grip damage on the surface of the specimen produce large amplitude and low-frequency flexural mode signals and that high frequency and low amplitude extensional mode signals are generated by crack propagation. The authors reported that the thickness of the laminates, especially the 90° laminates, was observed to be proportional to the signal amplitudes.
Ziola and Searle 4 discussed several signal processing approaches for automated source identification using modal AE technique. They showed that the signal processing and analysis routines they developed, which is based on AE wave propagation in the tested media, are capable of detecting growing fatigue crack in the plate-like structure. They obtained information about the change of signal frequency as a function of time using short-time Fourier transform, wavelets, Wigner–Ville transforms, and Gaussian correlations. They showed that Gaussian correlation provided the necessary frequency information and was computationally fast. Cawthorne and Ziola 5 monitored the fatigue testing of the US Navy H-46 Series helicopter Dynamic Component Upgrade (DCU) rotor system using modal AE and reported that crack growth produces relatively large amplitude signals with high-frequency content and that modal AE detected crack growth even with a lot of noise in the environment. May et al. 6 demonstrated that AE monitoring and data analysis could predict crack geometry with sufficient accuracy to provide information beneficial for maintenance and operation of F-16 fleet, during their AE monitoring system proof of concept for the F-16 fighter as a part of the aircraft structural integrity program. They reported that the identified source location was in very good agreement with the results from nondestructive inspection and analysis. Huang et al. 7 used AE technique to monitor defect formation and failures in materials under service. They conducted fatigue tests on cobalt-based superalloy at a frequency of 5 Hz initially to study crack initiation behavior, which was increased to 25 Hz after 2000 cycles. Daniel et al. 8 investigated and analyzed AE signals from a propagating crack in a metallic notched specimen under fatigue loading performed at a frequency of 2 Hz with a stress ratio (R) of 0.1. The material studied was 4340 steel and the specimen type used was a standard compact tension specimen. They used a pair of resonance AE sensors equally spaced from the specimen notch to monitor crack induced AE signals. Crack propagation was monitored concurrently with AE signal using crack propagation gages. They observed that crack growth is a function of normalized fatigue lifetime but independent of fatigue load and amplitude. They reported that crack growth increased smoothly with fatigue cycles and that AE activity increased near the middle of the fatigue test. Daniel et al. 9 investigated the application of high-pass frequency filtering, threshold filtering, and spatial filtering techniques for processing AE signals from fatigue tests. Crack extensions were monitored with two different crack propagation gages. They reported that AE activity occurred at all levels and phases of the loading cycle, both during loading and unloading, which was identified as an important parameter in analyzing AE data. They concluded that crack growth is a function fatigue life but is independent of fatigue load amplitude. Granata et al. 10 used AE monitoring to detect crack in materials containing intermetallic compounds that have very small critical flaw sizes. They reported that most of the AE signals occurred at rising load near maximum, with very few scattered at low and falling loads, that crack-like events have a fast rise time, followed by a gradual decay, and are more predominant compared with the non-crack event that has a slow rise and abrupt fall. The third type of signal was classified as noise. They performed Fourier transforms of the autocorrelations for each type of signal and their results showed that crack-like AE events have narrow frequency spectrum, while the other two have broad spectrum.
This article presents the results of AE monitoring of crack propagation in 2024-T3 clad aluminum aircraft panels repaired with adhesively bonded octagonal and elliptical, single-sided boron/epoxy composite patch, under tension–tension fatigue loading. Crack initiation and propagation were monitored using two crack propagation gages and four broadband AE sensors. Three back-propagation neural network models were developed and used to predict crack length from recorded number of AE events and number of fatigue cycles as inputs to the neural network. A methodology for noise reduction, accurate source location, and crack length prediction is presented.
Design and fabrication of patch
Patch design
The composite patches used in this research were designed using CRAS® Version 0.3
11
developed by the United States Air Force. The acronym CRAS stands for composite repair of aircraft structures. The patches were designed for a single-sided repair of a 1 in. crack on a 15 × 3 × 0.063 in.
3
sheet of 2024-T3 clad aluminum. The patch was designed for a maximum uniaxial stress of
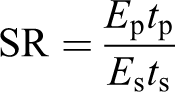
where E p is the modulus of elasticity of patch material, t p is the thickness of composite patch, E s is the modulus of elasticity of skin material, and t s is the thickness of skin material.
Machining of aluminum panels
Specifications of the unpatched and patched aluminum specimen are shown in Figure 1. 2024-T3 clad aluminum panels were machined to a dog bone shape as shown in Figure 1(a), on a Cincinnati Milacron SABRE-750 Vertical Machining Center (in the Computer Numerical Control Laboratory located in the Department of Mechanical and Aerospace Engineering at Missouri University of Science and Technology). The aluminum was machined such that the grain direction was aligned with the loading axis. The dimensions of the panels were 3 × 0.063 in. in cross section and 15 in. in length A central through crack of 1 in. was machined by a wire electric discharge machining (EDM). A small hole of 0.02 in. at the center was drilled first for the EDM wire to go through.
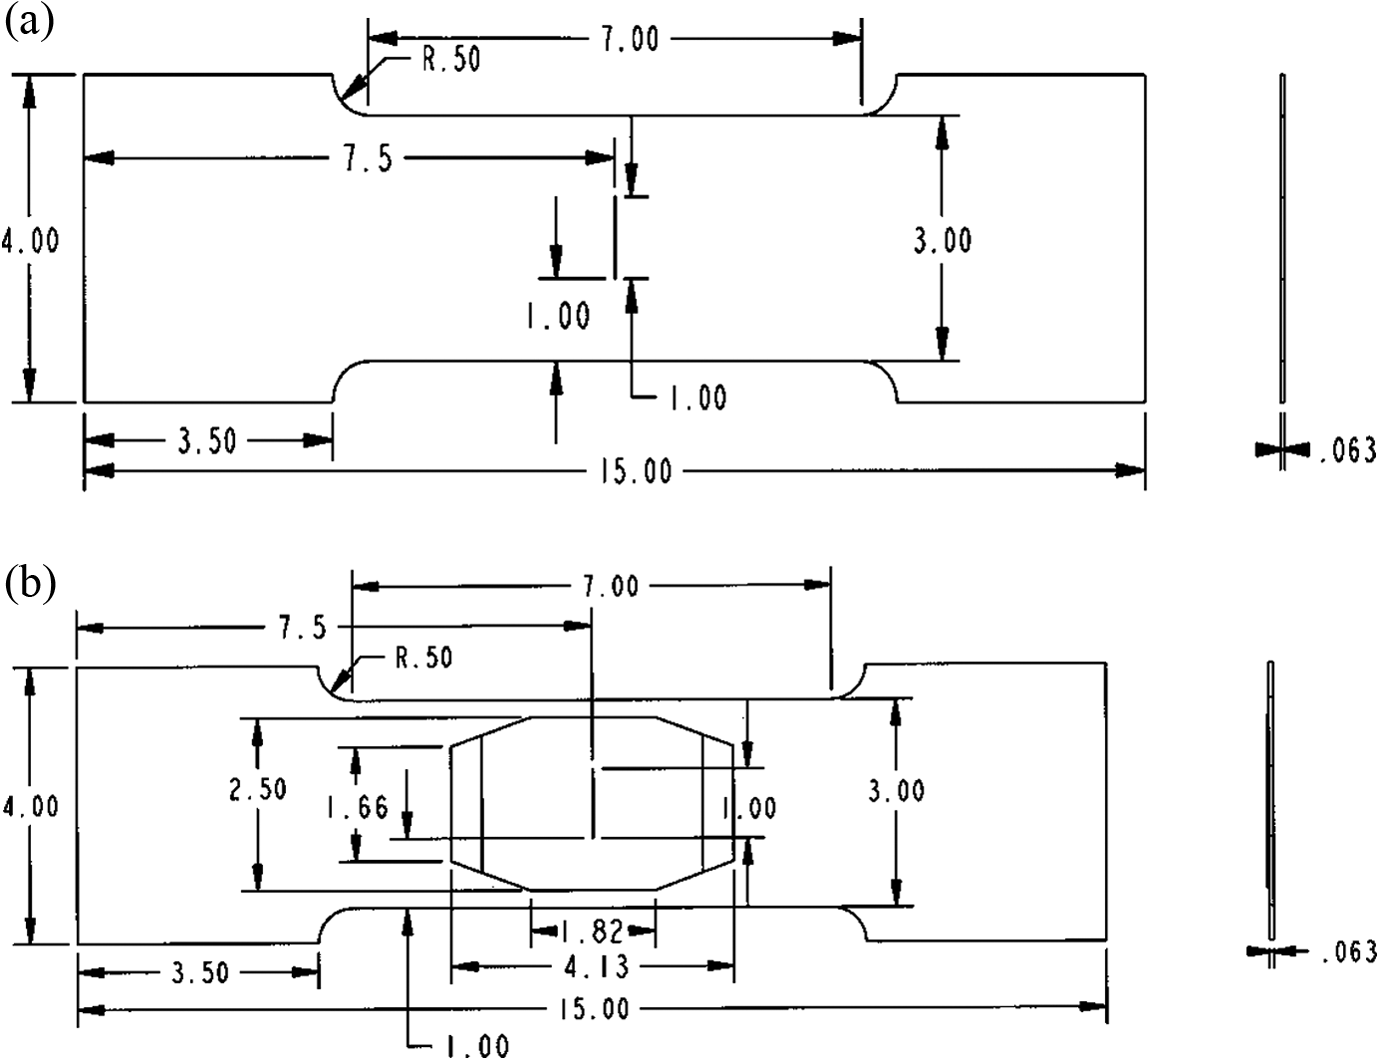
Specifications of an (a) unpatched and (b) patched aluminum specimen. All dimensions in inches.
Fabrication of patches
Figure 1(b) shows the placement of the composite patches on the pre-cracked aluminum panels. The composite patch is made from boron/epoxy 5521 prepreg (Textron Specialty Materials Inc., Lowell, Massachusetts, USA) with a unidirectional layup of [0] n (where n is the number of plies) with fibers oriented in the direction of loading. The patches were applied to the aluminum panel using FM-73 (Cytec Fiberite, Winona, Minnesota, USA) adhesive. The surfaces of the aluminum panels were prepared before placing on the patch. Surface preparation consisted of degreasing the aluminum panels with acetone, followed by grit blasting and application of a primer. The primer was applied to prevent oxidation before placing the patch since the adhesive, aluminum, and the boron/epoxy prepreg were shipped to a vendor for co-curing in an industrial autoclave.
The curing conditions for boron/epoxy require the temperature to ramped up at a rate of 3–5°F min−1 to 250°F and soaking at this temperature for 60 min at a pressure of 50–85 lbf in.−2, followed by a ramping down at 8°F min−1. The curing cycle for FM-73 requires the temperature to be ramped up at 3–5°F min−1 up to 250°F and soaking at this temperature for 60 min at 40 lbf in−2 pressure, followed by a cooling rate of 8°F min−1. Since the FM-73 adhesive and the boron/epoxy have the same curing cycles, the patches were co-cured in an autoclave at a pressure of 45 lbf in−2. The patches were fabricated and applied to the aluminum panels by Integrated Technologies Inc. (Bothell, Washington, USA) under the direct supervision of the principal author. The nominal thickness of the adhesive film layer is 0.007 in.
Exprimental setup and procedure
Experimental procedure
The fatigue tests were conducted on a material testing system (MTS 880 [MTS Systems Corporation]) with a maximum load capacity of 110,000 lbs. The tests were conducted at 10 Hz and 17.4 × 10³ lbf in.−2 under tension–tension fatigue loading with a R ration of 0.1. Four Digital Wave B-1025 (Digital Wave Corp., Centennial, Colorado, USA) broadband AE sensors with frequency response in the range of 1 kHz to 1.5 MHz were used to detect AE waves. The sensors were placed at a distance of 1 in. on either side of the crack and from the center line of the specimen (Figure 2) and attached to the specimen with vacuum grease and electrical tape (Figure 3(a)).
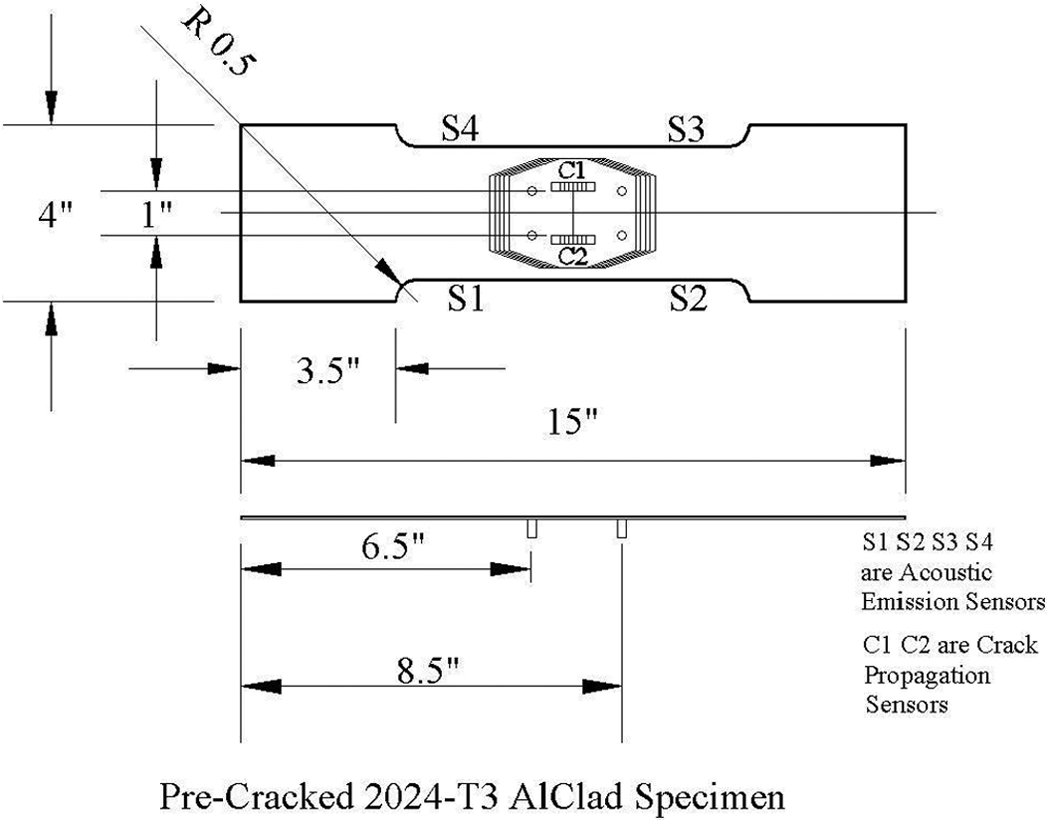
AE transducer location for fatigue testing. AE: acoustic emission.
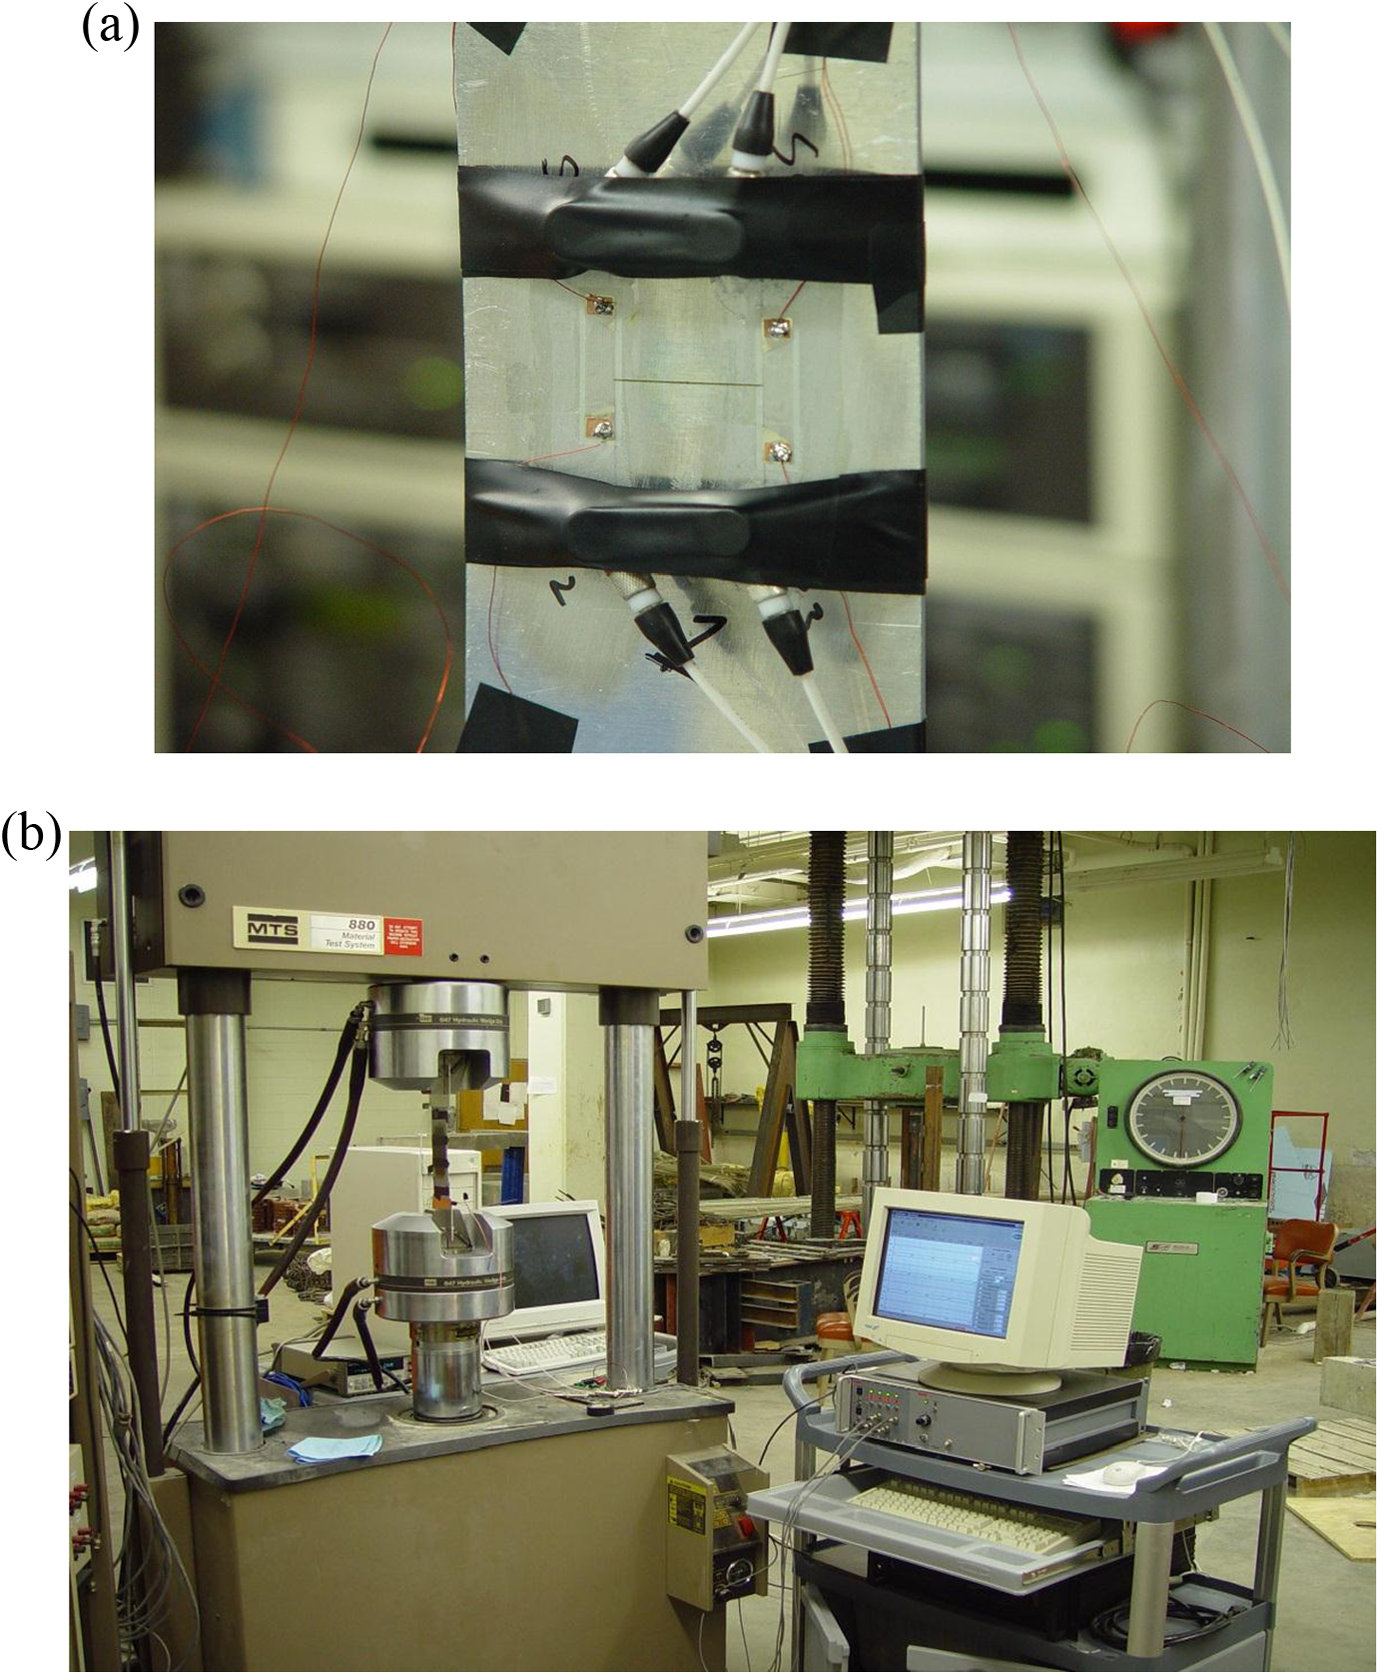
Experimental setup for fatigue and AE. (a) Attachment of AE sensors and crack propagation gages. (b) MTS 880 fatigue testing system and AE data acquisition setup. AE: acoustic emission.
The continuous increment in load in the tension–tension fatigue test makes it difficult to determine when crack initiation takes place and when the crack is propagating. An economic way of doing this is by employing special purpose crack propagation gage (sensor). For this study, two crack propagation sensors were attached on the unpatched side of the aluminum panel, one each near the crack front with adhesive. M-Bond 610 adhesive was used. It is a two-component, solvent-thinned, epoxy-phenolic adhesive for high-performance applications. The adhesive was cured at a temperature of 325°F using a hot bonder. Once it is cured, the crack propagation gage cannot be removed without damaging it. The crack propagation gage patterns consist of a number of resistor strands connected in parallel. When bonded to a structure, progression of a surface crack through the gage pattern causes successive open circuiting of the strands, resulting in an increase in total resistance. Two crack propagation gages (model no.TK-09-CPA01-005/DP; Vishay Measurements Group, Inc., Wendell, North Carolina, USA) shown in Figure 3(a) were mounted one on each side of the crack front and used to detect crack initiation and initial crack propagation. The fatigue tests were conducted on the MTS 880 fatigue testing machine as shown in Figure 3(b). All specimen were fatigued tested up to failure, when the crack has propagated through the width of the specimens.
Digital Wave VLF-UT/AE AE data acquisition system (Digital Wave Corp.) was used to acquire the AE data. AE waveforms were acquired at 25 MHz sampling rate using 4096 data points during the fatigue tests. Shannon sampling theory 14 states that sampling frequency must be equal or greater than two times the maximum frequency of interest, that is, F s ≥ 2F max for accurate conversion between time and frequency domain and for accurate source location. Typical AE broadband events have frequency content from 20 KHz to 5 MHz, 2,3 therefore by assuming F max = 5 MHz, the sampling frequency, F s = 5F max = 25 MHz, was chosen to satisfy Shannon sampling and for accurate source location.
Figure 4 shows the schematic of AE data acquisition setup. The AE signals from the four sensors were passed through a preamplifier and preamplified at 24 dB and then passed through the band pass filter set at 300 KHz and 5 MHz, respectively. The filtered signal was then passed through a signal conditioner unit where additional amplification of 24 dB was done. The trigger gain was set to 32 dB. AE events were monitored and accurately located by using the event detector. The total system gain was set at 80 dB. The threshold was set at 100 mV in order to filter out the noise signals that are far below the chosen threshold. A high-level signal output voltage from the MTS 880 was fed to the AE data acquisition system (Digital Wave Corp.) parameter channel and also digitized, this enabled viewing of the loading cycle of the MTS 880 and subsequently the elimination of events that occur in the lower part of the sine wave in loading that are not related to crack initiation and propagation.
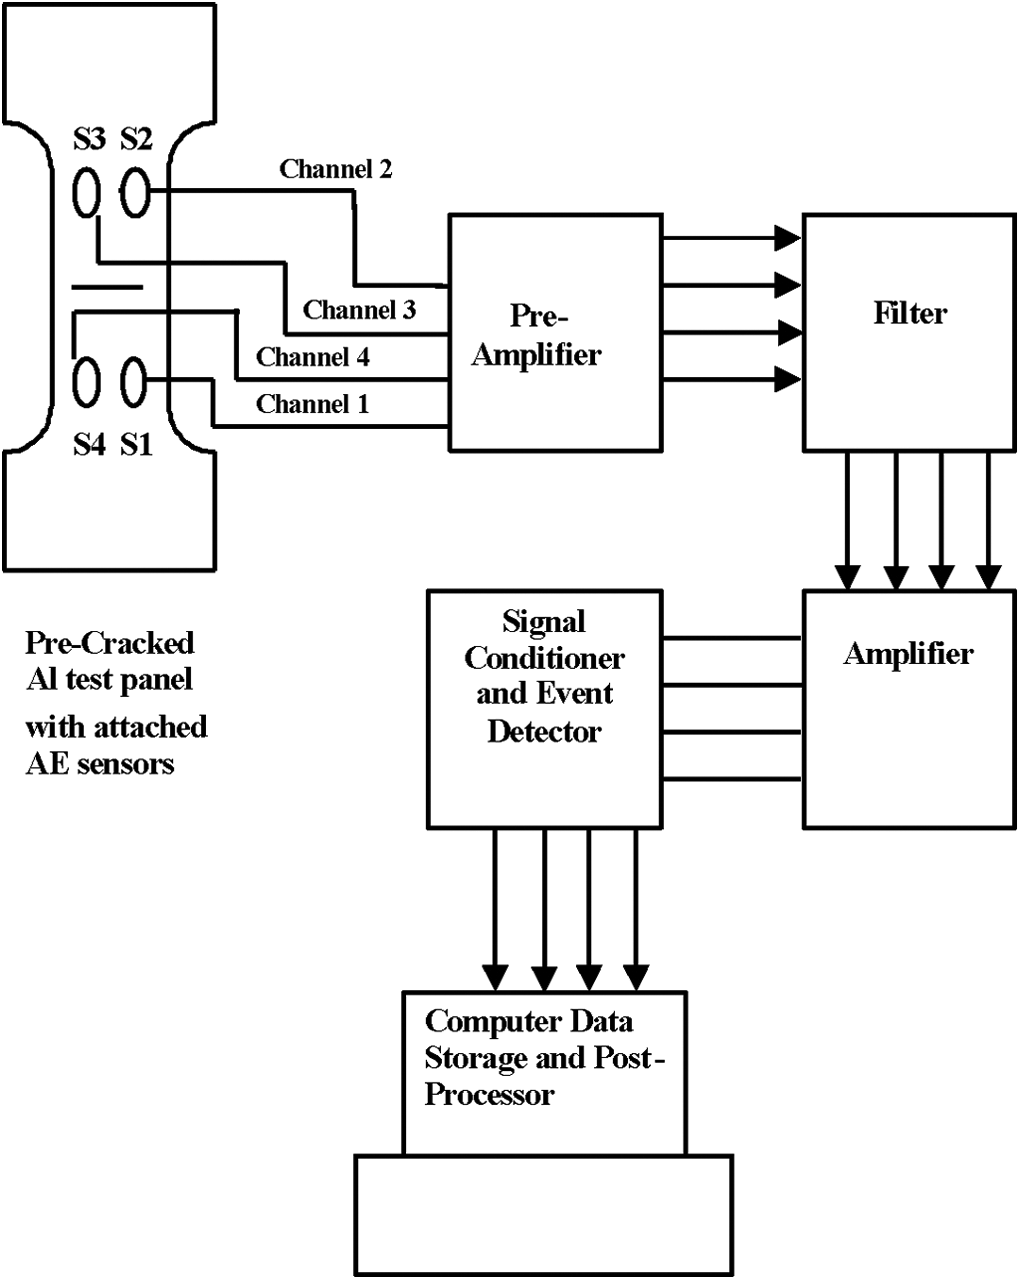
Schematic of AE setup. AE: acoustic emission.
The acquired parameters and waveforms were stored in a computer for later processing and elimination of non-crack events. Figure 3(b) shows the fatigue test and AE data acquisition setup. The fatigue tests generated between 5000 and 7000 waveforms. The analysis of the data was carried out using the WaveExplorer® software (Digital Wave Corporation, Denver, Colorado, USA). The WaveExplorer software runs the AE part and provides real-time data acquisition and posttest data replay and analysis. Included in the software are noise check, wave check analysis tools, built-in theory for computing plate velocities, and accurate source location. The AE signals were processed in time and frequency domain and analyzed to identify sensor features correlated with fatigue cycle and crack propagation. The AE features, namely, number of AE events, energy, amplitude, and frequency were investigated. The identified sensor features were used to develop neural network models for predicting crack propagation. Two different patch configurations (octagonal and elliptical) were investigated to determine optimum patch configuration. Some methods of waveform filtering that are necessary for accurate crack propagation monitoring are presented.
AE waveforms
A wave propagating in a plate produced by a crack growth source has extensional and flexural mode. 2,3 The extensional mode has significantly higher frequency content and significantly lower amplitude than flexural mode. Also extensional mode has higher attenuation rate than flexural mode. Typical AE waveforms obtained from crack events are shown in Figure 5(a) and (b). Figure 5(a) shows a typical AE event emanating from a crack in 2024-T3 alclad aluminum specimen as sensed by sensors 1, 2, 3, and 4 of Figure 4. Figure 5(b) shows an AE event emanating from boron/epoxy composite patch matrix cracking and shear as observed from the surface of the patch during and after failure when the crack has propagated through the width of the specimen. An AE event emanating from a crack growth is of extensional mode, and it is seen that the initial displacements on all four channels are all in the same downward or upward direction. An extensional mode in an AE event appears at the beginning of each wave and is characterized by (1) relatively smaller amplitude of ±0.25 V than the flexural mode of ±1 V and (2) a progression from lower frequency to higher frequency. A flexural mode in an AE event appears after the extensional mode, with the frequency in this mode decreasing as the wave propagates, and the amplitude is considerably larger ±1 V than that of the extensional mode. The AE event (shown in Figure 5 (a)) originating from crack growth in thin (0.063 in.) aluminum specimen has very high-frequency content and is almost completely extensional. The AE event (shown in Figure 5(b)) is assumed to be originating from matrix cracking and shear of the composite patch and is predominantly flexural in nature as the patch is located on the surface of the aluminum and has high frequency content compared to noise as it is emanating from cracking and shearing of a brittle composite patch material.
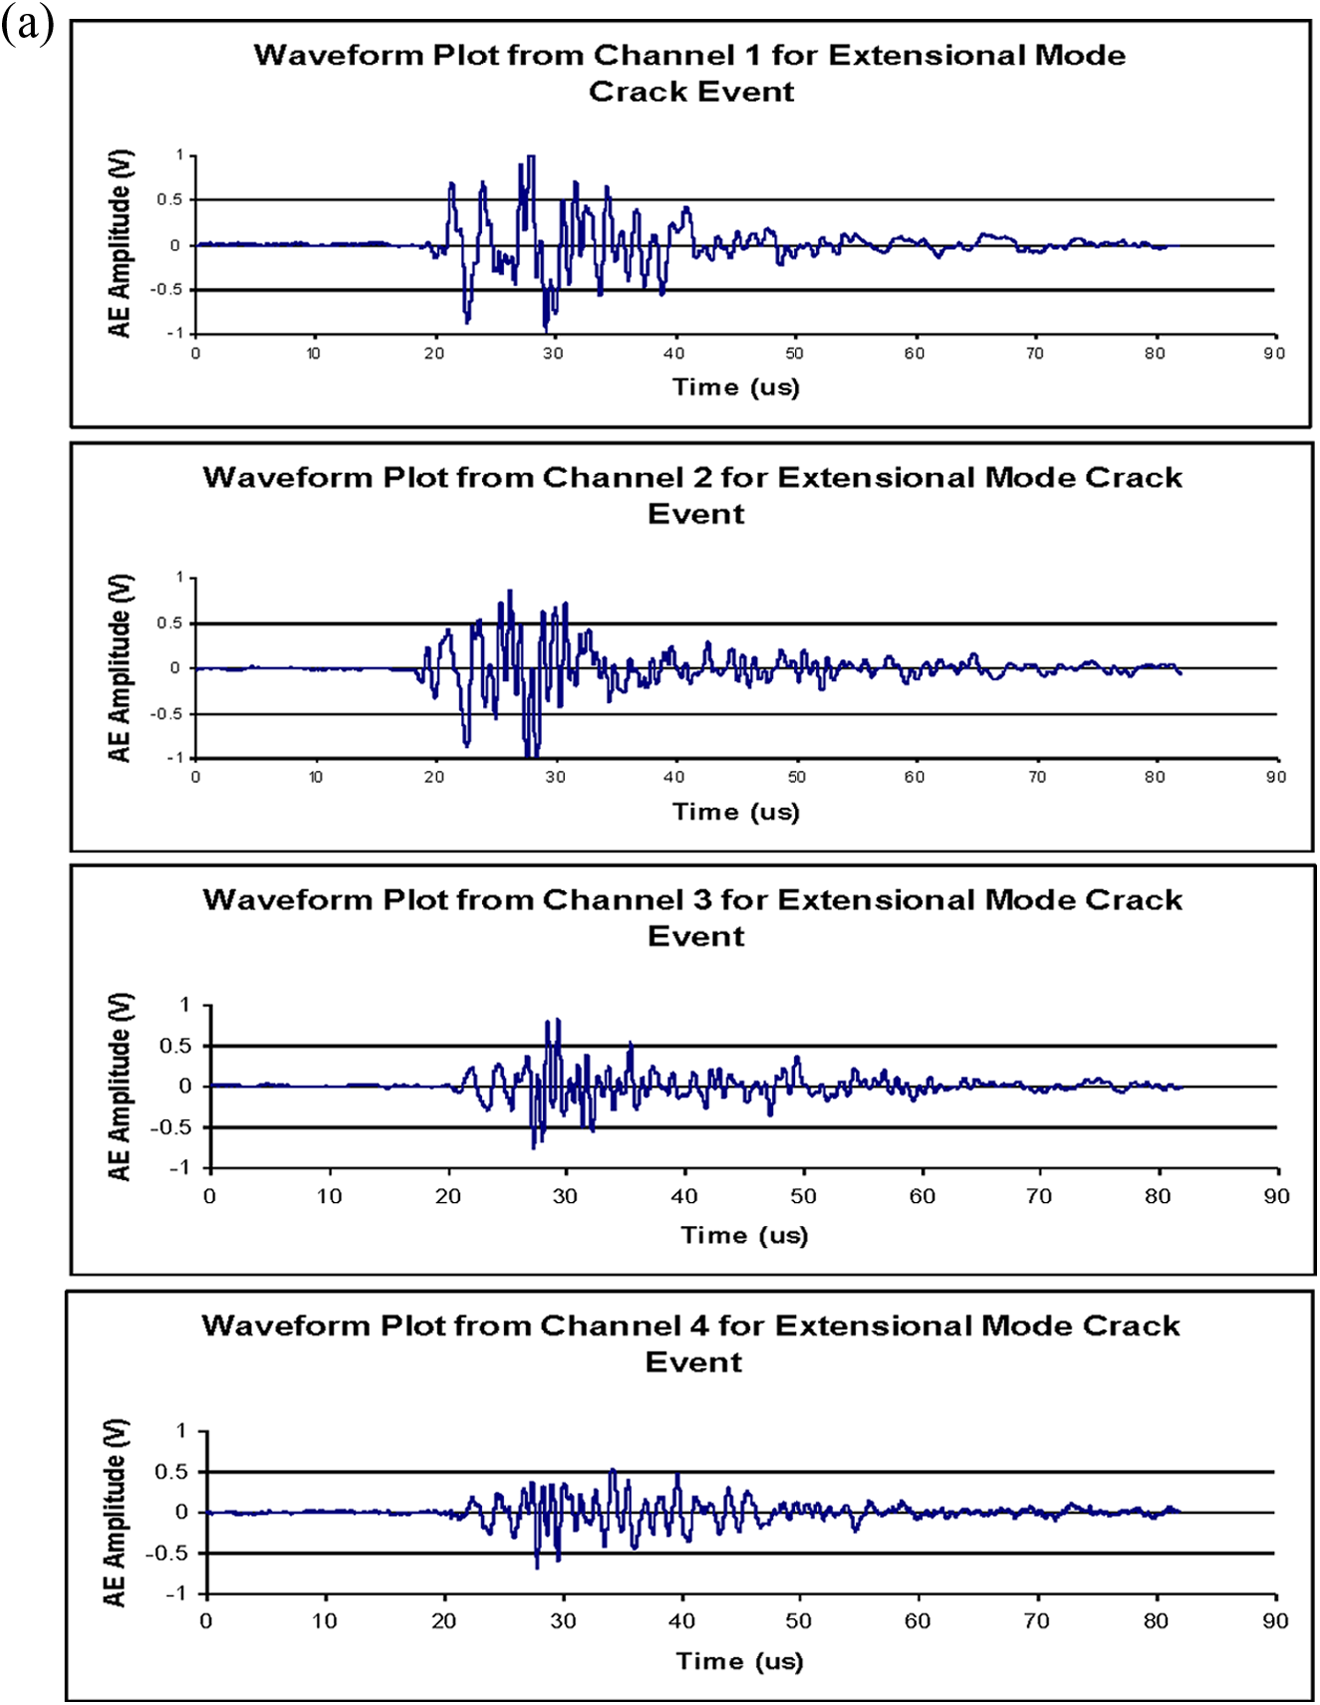
Typical waveform for crack events. (a) AE signal from extensional mode crack event. (b) AE signal from a flexural mode matrix-cracking event. AE: acoustic emission.
AE signal processing and noise rejection
The basic approach to signal analysis for AE is to (1) reject the obvious noise signals due to mechanical noise (fretting), (2) apply location filter to filter out events taking place outside the expected area of event occurrence, and (3) determine based on frequency content if the remaining signals could have been produced by sources of interest, in this case, crack propagation.
Analysis of the AE data was done using WaveExplorer software. After acquiring all the waveform data, the signals were subjected to some filtering techniques in order to get rid of the noise and other events. Noise signals cause saturation of the analog/digital (A/D) board. If the signal voltage is greater than the range of the A/D converter, the A/D converter saturates and the signal is clipped. The result is a signal that has been significantly altered and is difficult to analyze. Figure 6 shows typical waveforms obtained from noise events due to A/D saturation.
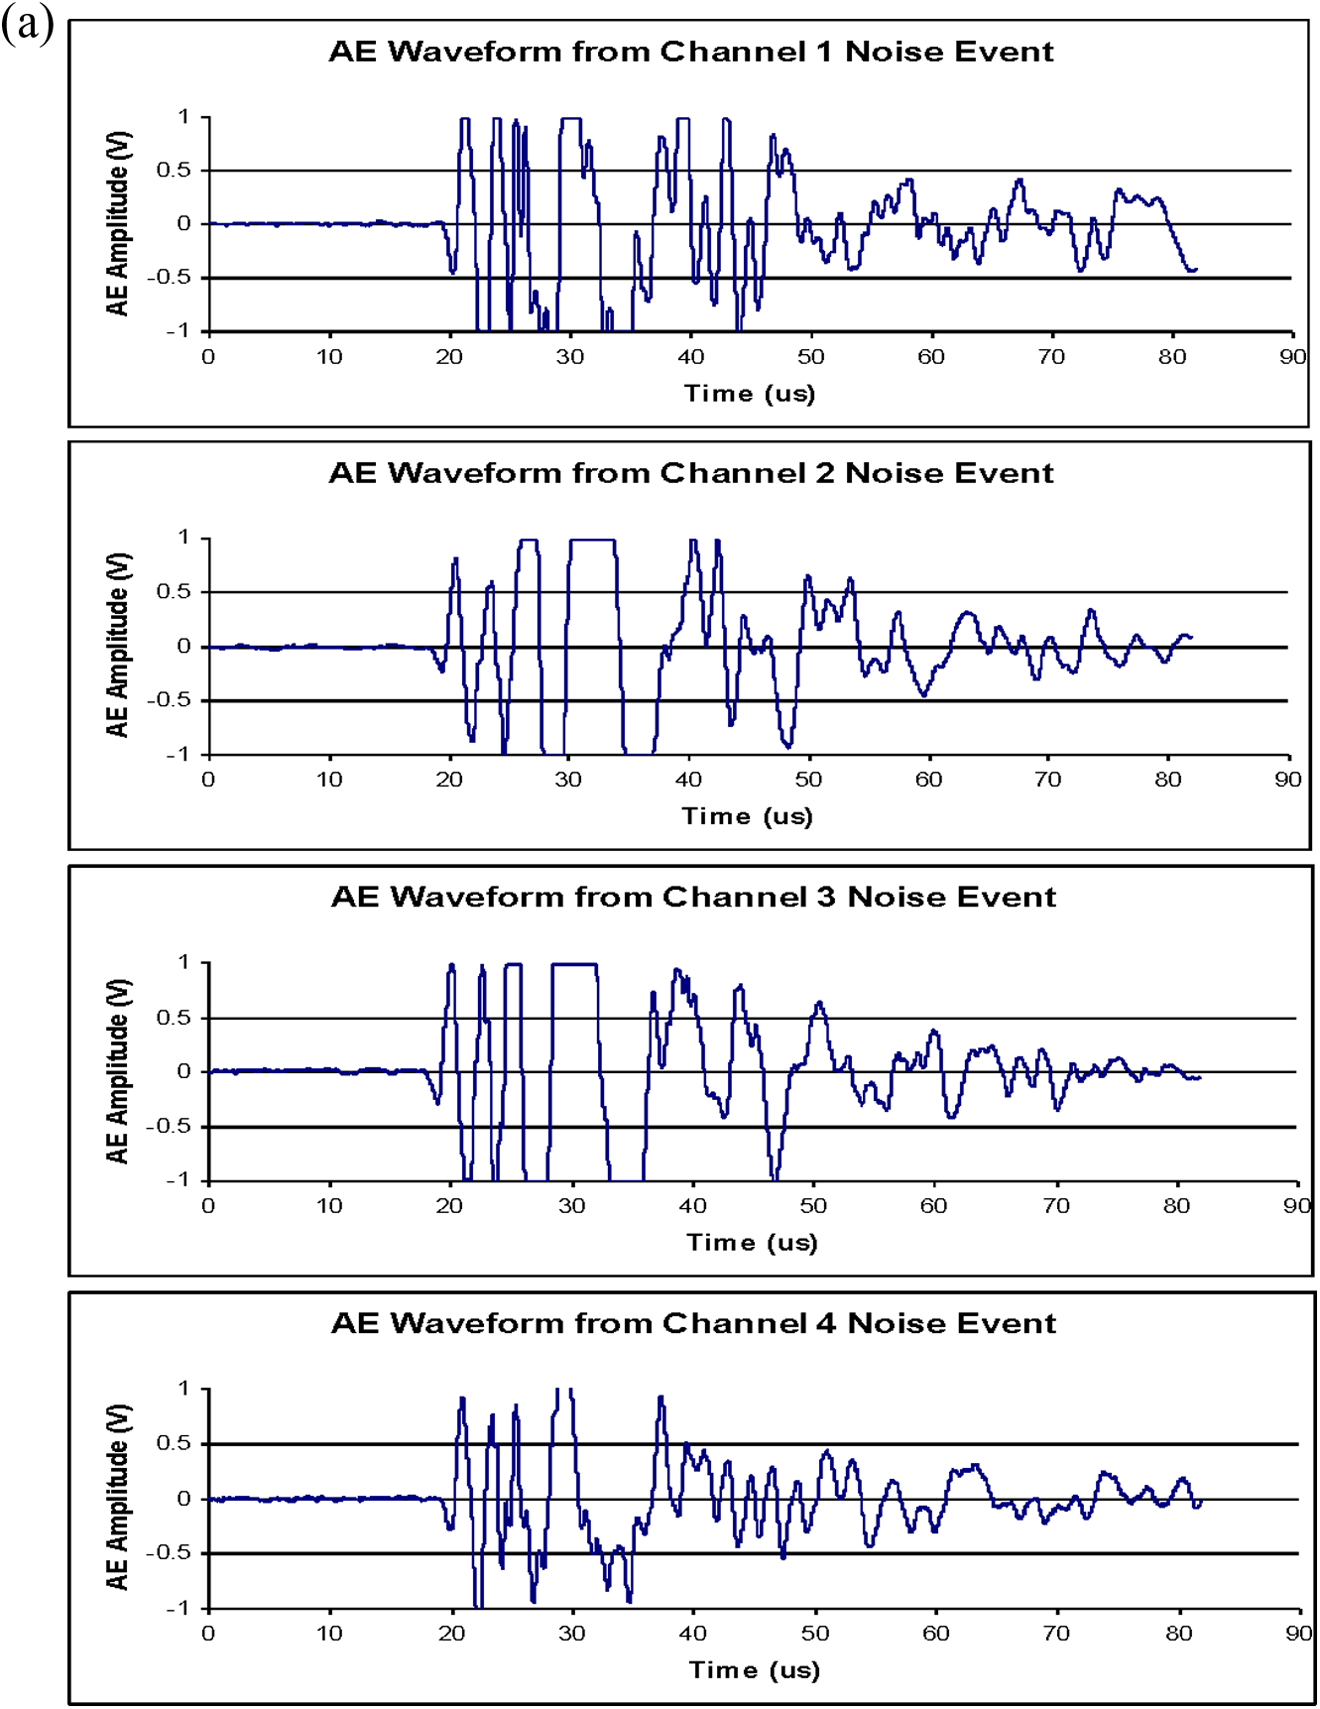
Typical waveforms for noise events.
Event source location
One of the effective ways to filter out noise events is location filtering. All events that were outside the expected area of occurrence can be disregarded as noise. The waves being generated by crack growth and/or crack propagation are all within the specimen medium and hence are extensional waves. The front end of the extensional waves is nondispersive and hence a low threshold is needed to trigger the front end of the extensional wave on which the source location calculations are performed. The noise events had been significantly reduced by applying a threshold of 150 mV. The threshold was then dropped to 40 mV and the velocity of the waves set to 3018 m s−1 (825.13 in. s−1). The time of arrival calculations is performed using the threshold crossing algorithm. On closer examination, one can find three different kinds of events. The events that are generated due to crack growth in aluminum. These have very high-frequency content and are almost completely extensional mode (Figure 5(a)). The events that are situated in the middle and show large flexural modes. These events are most probably generated fiber breakage and shear of the composite patch. As the patch is on the surface of the aluminum and is a brittle material, the waves that are associated with cracking and shearing of such material will have high-frequency content and will produce large flexural modes (Figure 5(b)).
The noise events signals detected by the four AE broadband sensors are shown in Figure 6(a) and (b). These signals are of flexural modes with large amplitudes greater than ±1 volts and chopped off by the data acquisition system.
Results and discussion
The results of the fatigue tests were analyzed and plotted. Figure 7(a) and (b) shows the plot of number of AE events and crack length versus the fatigue cycles for 5-ply octagonal patch bonded with FM-73 adhesive; Figure 7(c) and (d) shows the plots of number of AE events and crack length versus fatigue cycles for the 5-ply elliptical patch. It can be seen that there are regions of rapid AE activity and some regions of moderate AE activity. From the crack length versus fatigue cycles, as shown in Figure 7(b) and (d), it is observed that the number of AE event increases as crack propagation increases. It can be seen in Figure 7(a) and (c) that when the crack has propagated fully across the 3 in. width of the specimen, there is a corresponding high number of AE events, showing a good correlation between crack propagation and AE event. The frequency was slowed down to 1 Hz to measure propagation of crack length. The crack length measurements were made visually. A saturation filter was applied to the waveforms in order to filter out the noise events. A 10% saturation criterion was applied for this filter. The threshold was also now increased to 150 mV. After the application of the saturation filter, the total number of events for the octagonal patch was reduced to 6290, while the number of events for the elliptical patch came down to 1630 indicating that the majority of events recorded for the elliptical patch were noise events. After application of location filtering, the number of events in the case of octagonal patch reduce to 1460 and those in the elliptical patch reduced to 926.
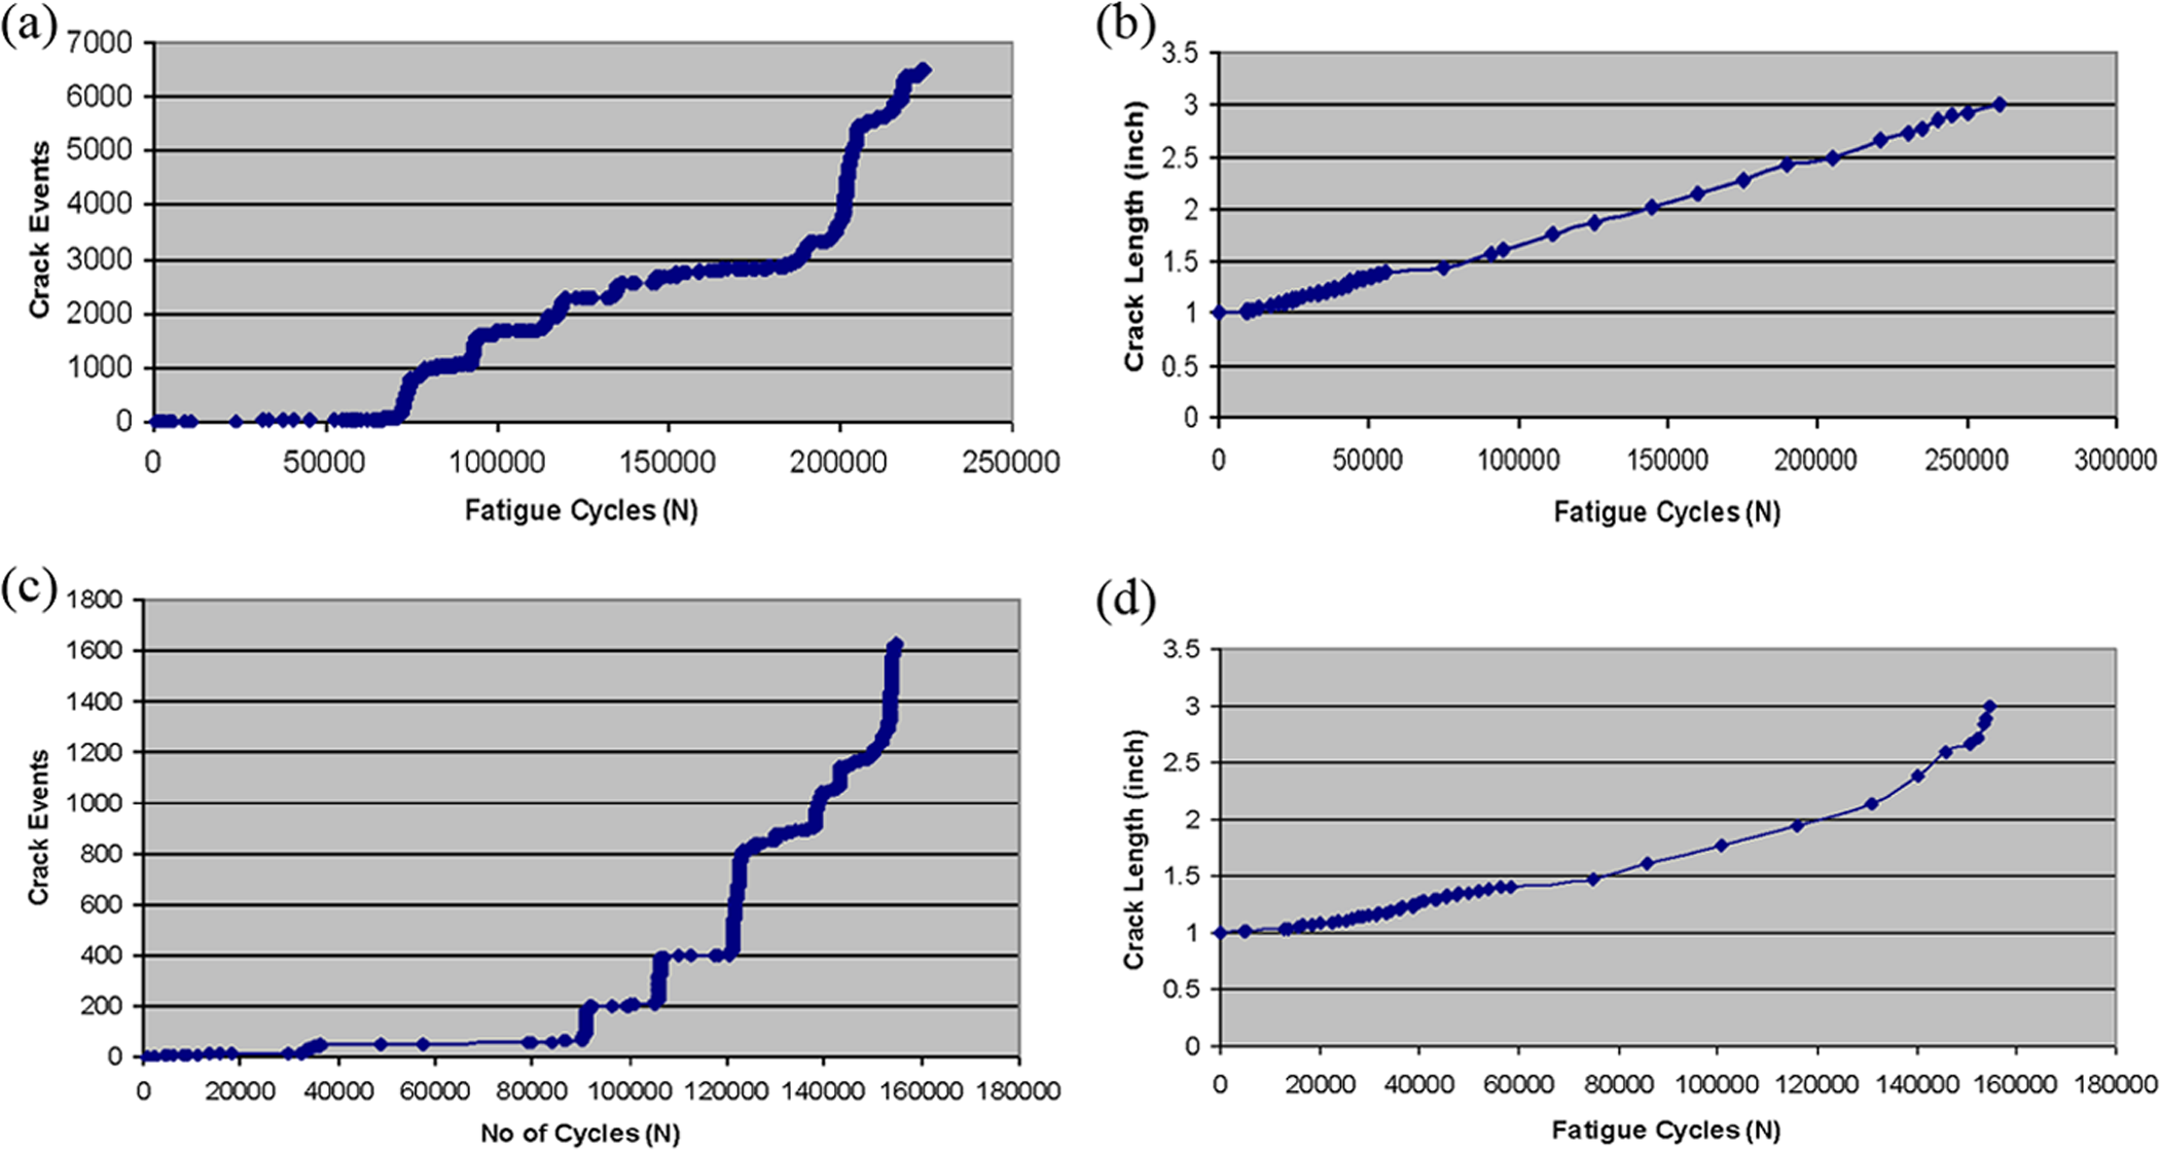
AE events versus fatigue cycle and crack length versus fatigue cycle for octagonal and elliptical patches. (a) AE event versus fatigue cycles for 5-ply octagonal patch bonded with FM-73. (b) Crack length versus fatigue cycles for 5-ply octagonal patch bonded with FM-73. (c) AE event versus fatigue cycles for 5-ply elliptical patch bonded with FM-73. (d) Crack length versus fatigue cycles for 5-ply elliptical patch bonded with FM-73.
Figure 8(a) and (b) shows the AE source locations after performing location filtering for the 5 ply octagonal and elliptical patch repair, respectively. Almost all the AE events took place on or near the crack front indicating that the AE sensors were effective in detecting crack propagation.
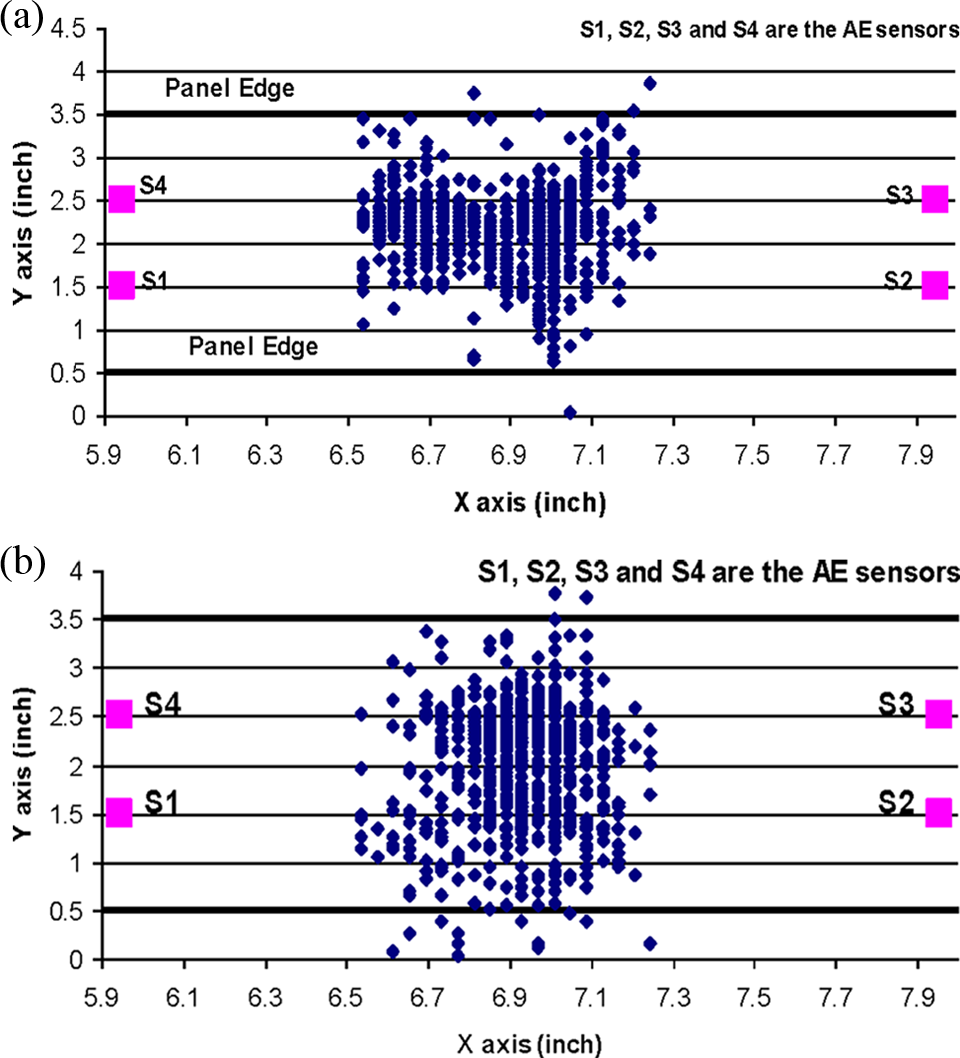
Results of AE source location for octagonal and elliptical patch repair. (a) AE source location for 5-ply octagonal patch repair bonded with FM-73. (b) AE source location for 5-ply elliptical patch repair bonded with FM-73. AE: acoustic emission.
Another criterion for differentiating crack signals from the other signals is by examining the frequency content of the signal. Figure 9(a) and (b) shows the frequency content of noise waveforms for channels 1, 2, 3, and 4. The frequency of a noise waveform rapidly decays from a higher value between 9 dB and 14 dB to a lower value of below 2 dB in a short period of time, whereas the crack waveforms (extensional and flexural modes) as shown in Figure 10(a) and (b), respectively, have more uniform or flatter frequency response with amplitudes below 2 dB.
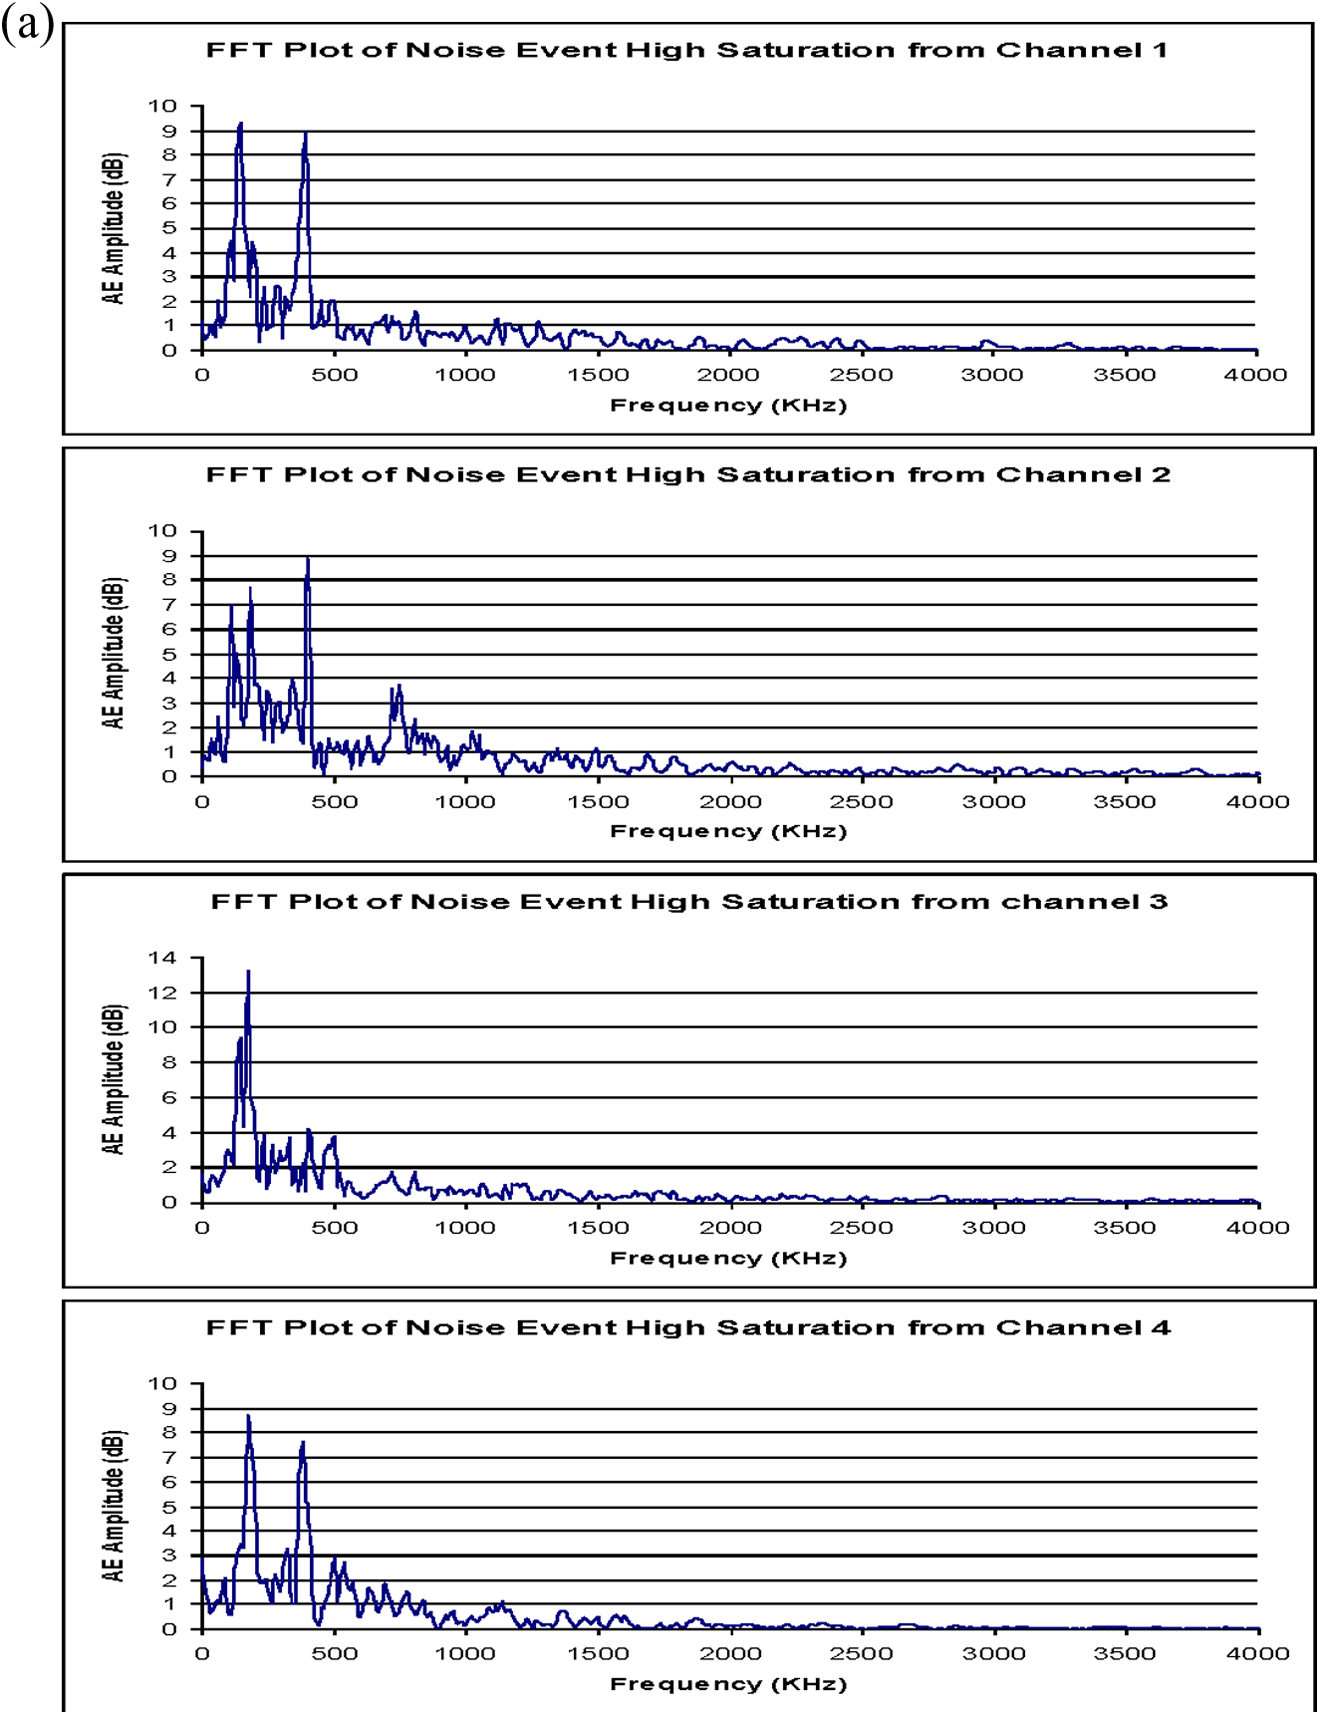
AE plots of noise events. (a) FFT plots of noise events. (b) FFT plots of noise events. AE: acoustic emission; FFT: Fast Fourier transform.
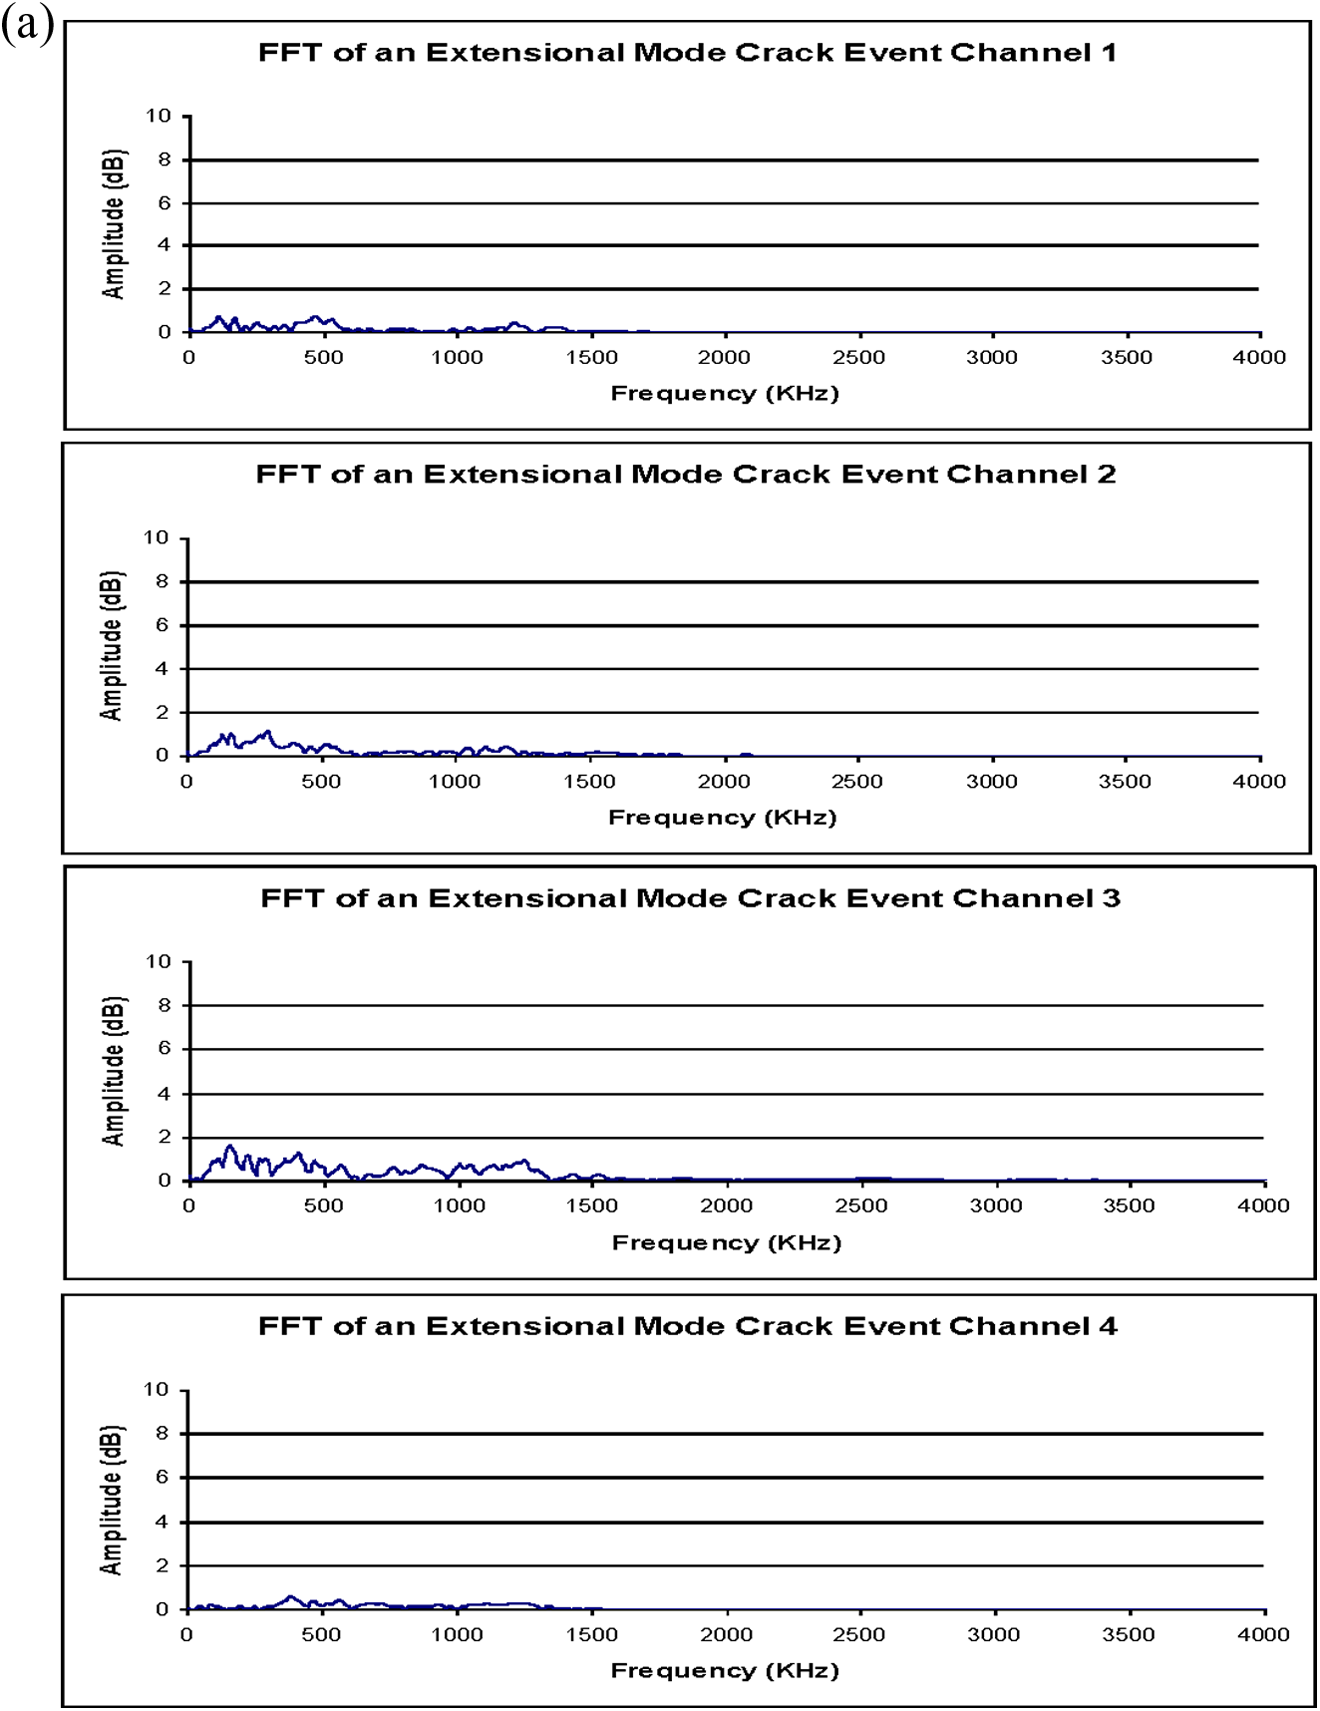
FFT plots for crack propagation events. (a) FFT plots for an extensional mode crack event. (b) FFT plots for a flexural mode crack event. FFT: Fast Fourier transform.
Predicting crack length with neural networks
The cascade feed forward back-propagation neural network
15
was used to predict crack length based on the number of fatigue cycles and number of AE events. Figure 11(a) shows the details of a feed forward network with one hidden layer and one input, while Figure 11(b) shows the details of a feed forward neural network with one hidden layer and two inputs. A neuron with a scalar input vector, “p” and a scalar bias “b” is shown in Figure 11(a) and (b). The transfer function net input “n”, again a scalar, is the sum of the input “WP” and the bias “b”. This sum is the argument of the transfer function “f” given by: Architecture of a feed-forward neural network with one and two inputs. (a) A neuron in a multilayer feed-forward neural network with one input. (b) Architecture of a feed-forward neural network with two inputs.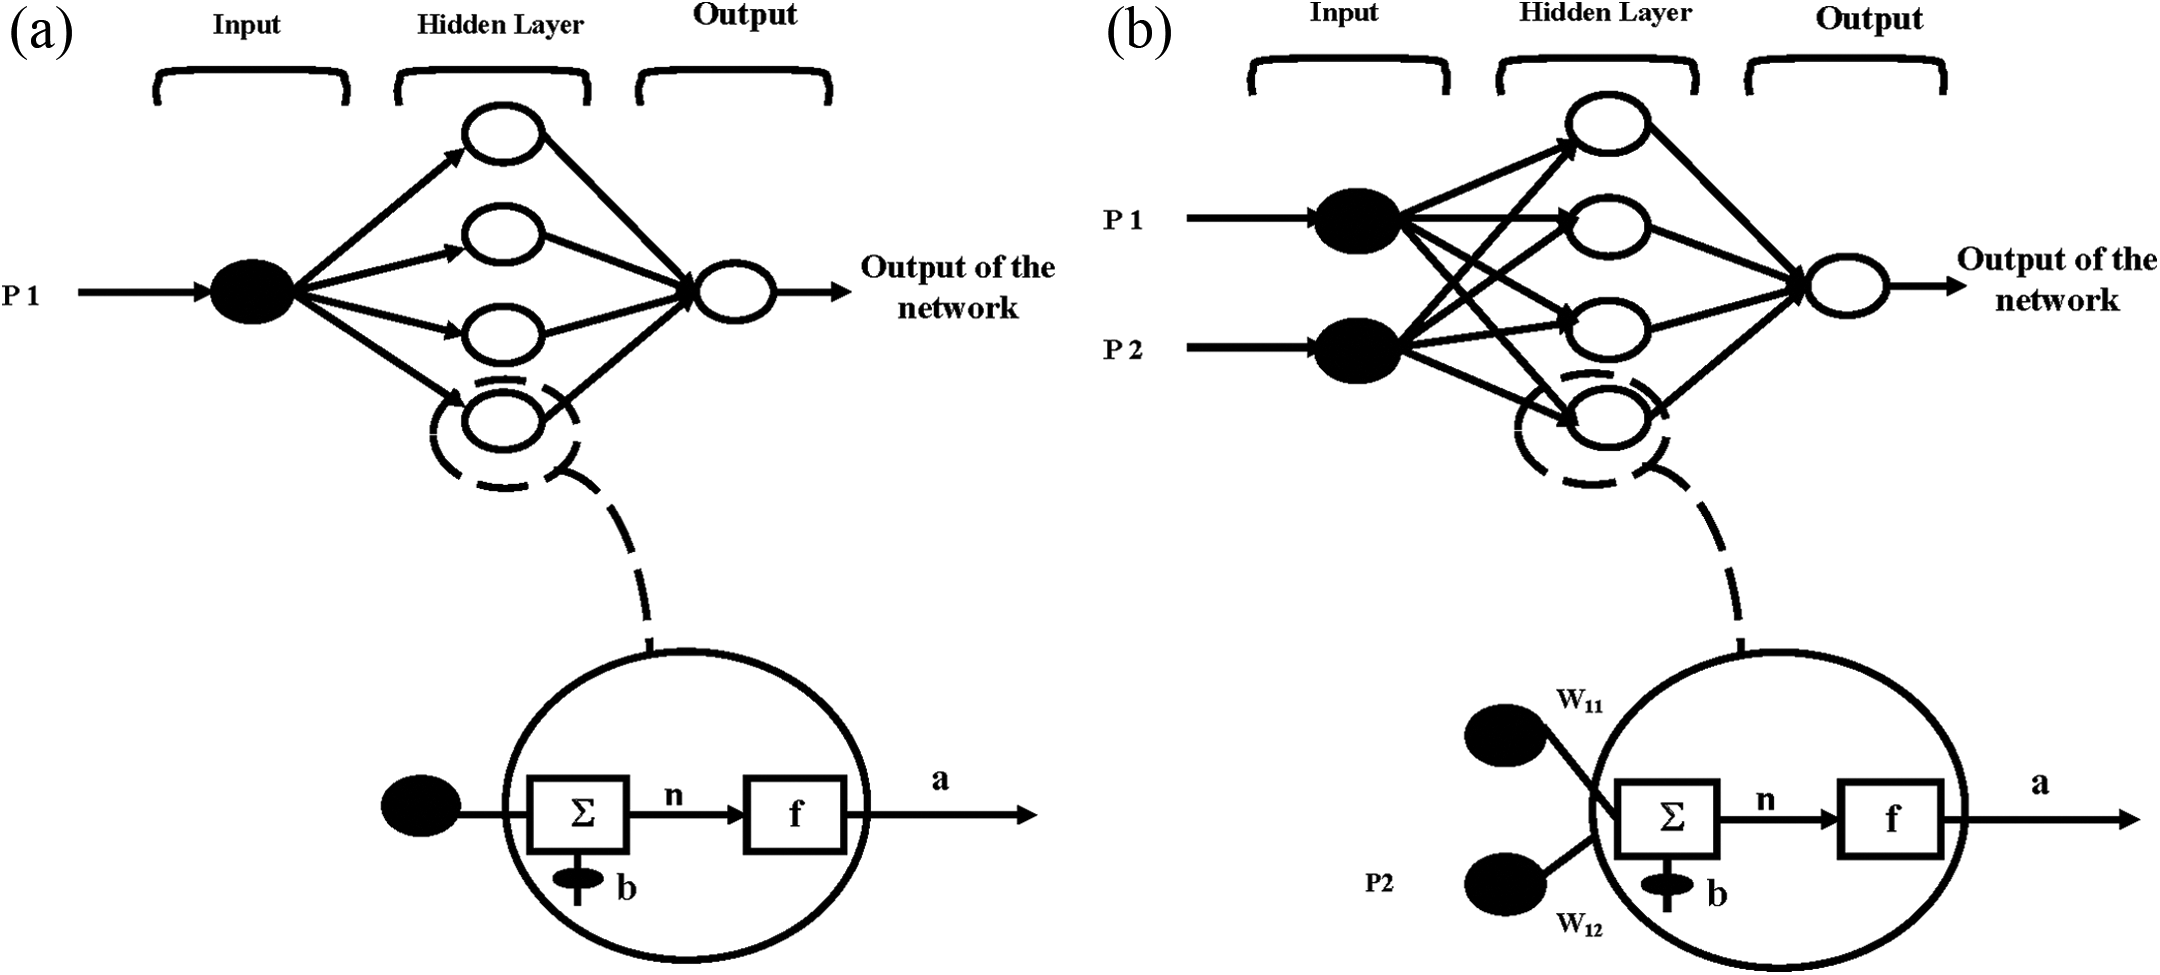
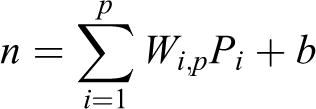
The weights, “w” and bias “b” are both adjustable scalar parameters of the neuron. The central idea of neural networks is that such parameters can be adjusted so that the network exhibits some desired behavior. Thus, a network can be trained to do a particular job by adjusting the weight and/or bias parameters to achieve some desired end.
Three separate networks were used to predict crack length, that is, one network was used to predict the crack length from the number of fatigue cycles, while the second network was trained to predict the crack length from the number of AE events, and a third one was used to predict crack length from both fatigue cycles and AE events as inputs. All the networks were cascade feed-forward networks with three fully connected layers. Table 1 details the network architecture of all the three neural networks. All networks had a tan sigmoid function in the input layer, a log sigmoid function in the hidden layer, and a linear function in the output layer.
Neural network variables.
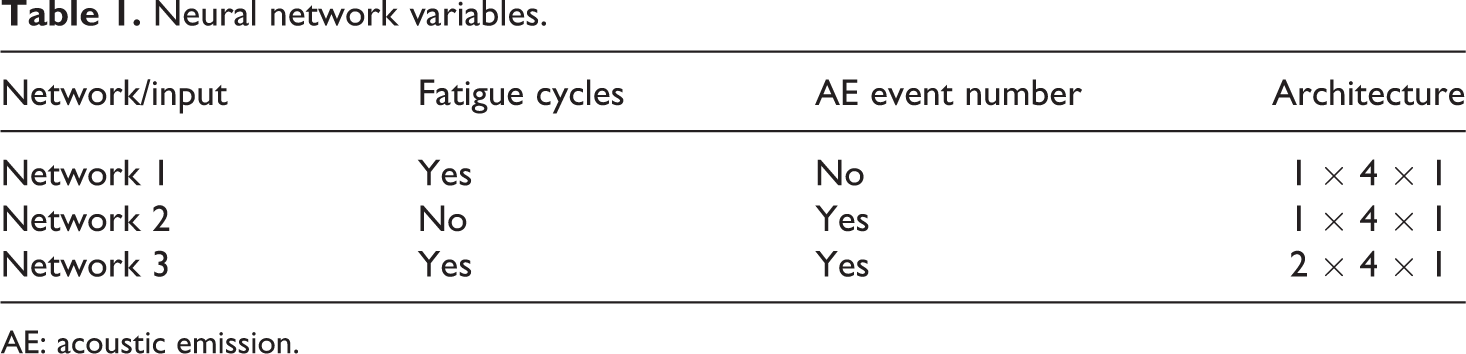
AE: acoustic emission.
Back-propagation was created by generalizing the Widrow–Hoff learning rule to multiple layer network and nonlinear differentiable transfer functions. 15,16 Input vectors and the corresponding target vectors are used to train a network until it can approximate a function, associate input vectors with specific output vectors, or classify input vectors in an appropriate way as defined by the trainer. Feed-forward networks often have one or more hidden layers of sigmoid neurons, followed by an output layer of linear neurons. Multiple layers of neurons with nonlinear transfer functions allow the network to learn nonlinear and linear relationships between input and output vectors. The linear output layer lets the network produce values outside the range −1 to +1. The cascade feed-forward network is similar to the standard feed-forward network; however, this is a fully connected network, which means that the first layer has weights coming from the input, and each subsequent layer has weights coming from the input and all previous layers. All layers have biases. The last layer is the network output. This network is more efficient with respect to the number of neurons used to achieve final target; however, since it involves calculating and updating more weights than the standard feed-forward network; this network is slower than the standard one.
The training data for network 1 consisted of 38 sets of input, 19 unknown inputs were also presented to the network. The inputs to the network were number of fatigue cycles and the output from the network was the crack length. For network 2, the training set consisted of 62 inputs; 18 unknown inputs were also presented to the network. The inputs were the AE event number and the output from the network was the crack length. For network 3, the inputs were fatigue cycle number and AE event number, and the output was crack length. This network was trained on 57 sets of data and had 23 unknown inputs. All networks were trained to 500 epochs with the Levenberg–Marquardt training algorithm.
The information used to train network 1 was only the number of fatigue cycle as inputs, and the corresponding measured crack propagation lengths as the outputs. Figure 12(a) to (c) shows the results for network 1 that predicts the crack length from the number of fatigue cycles. The network was trained for 500 epochs using the Levenberg–Marquardt algorithm. The network was trained with 38 inputs, after training the network these training sets were presented to the network as inputs. The comparison of the measured and predicted crack length by neural network 1 is shown in Figure 12(a). Figure 12(b) shows the prediction percentage error for the data of the training set data that varied between −1.6% and 1.3% for the training set and between 0% and 9% for the unknown inputs. Nineteen unknown inputs were also presented to the network, these were totally new inputs and the network had not been trained on these inputs before. Figure 12(c) shows the prediction percentage error for these unknown inputs.
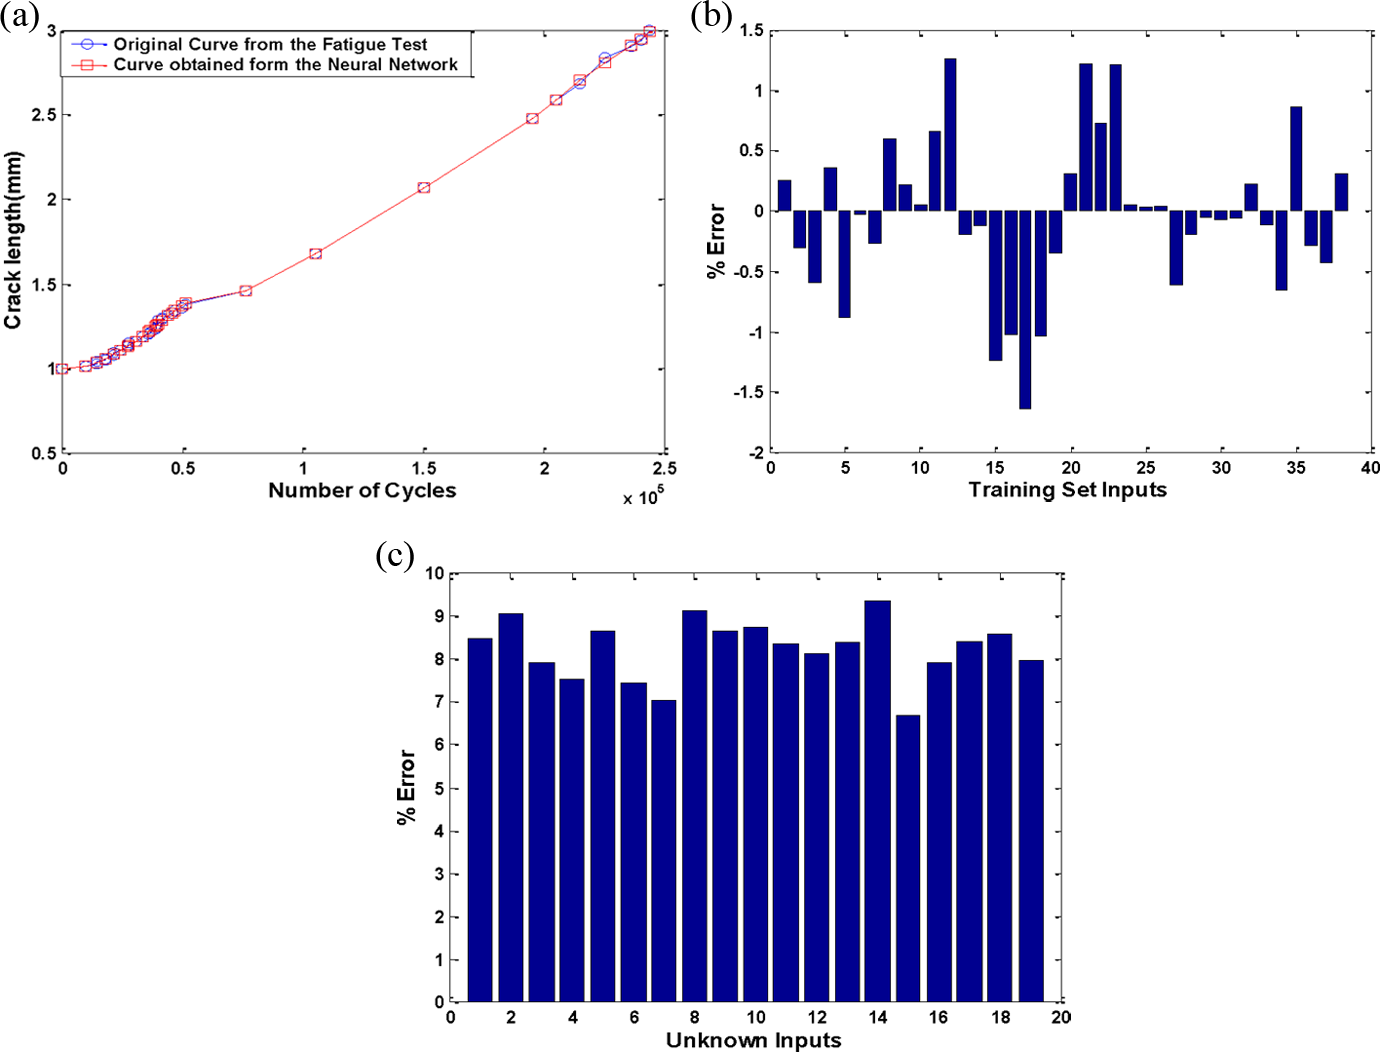
Actual and predicted crack length for neural network 1. (a) Measured and predicted crack length versus fatigue cycles for neural network 1. (b) Percentage error for training set inputs. (c) Percentage error for unknown inputs.
Network 2 was developed and used to predict crack propagation length based on the number of AE events. The information used to train network 2 was only the number of AE events per fatigue cycle as inputs, and the corresponding measured crack propagation lengths as the outputs. This network was trained on 62 data sets and was later presented with 18 unknown inputs. Figure 13(a) to (c) shows the results obtained from neural network 2. Figure 13(a) shows the comparison of measured and predicted crack propagation length by neural network 2. Figure 13(b) and (c) shows that the percentage prediction errors varies between −15% and 10% for the input training set and varies between −9% and 10% for the unknown inputs. It was found that the convergence of network 2 was much slower than network 1 since the relationship between the AE events and crack length is highly nonlinear. However, the network was still able to predict the crack length based on the AE events with acceptable accuracy.
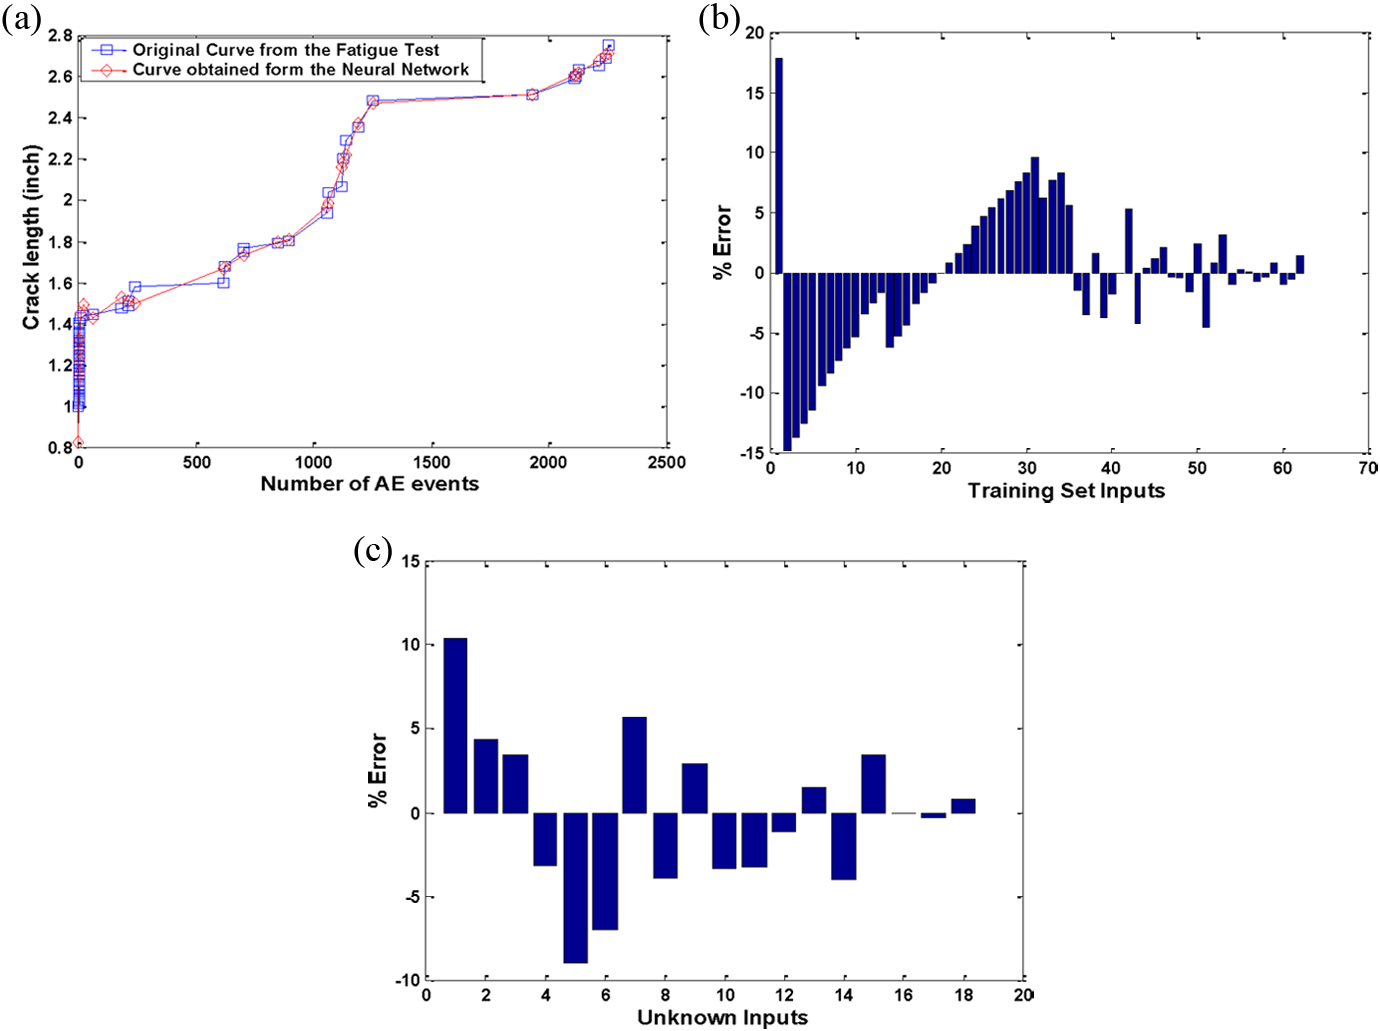
Measured and predicted crack length by neural network 2. (a) Measured and predicted crack length versus AE events for neural network 2. (b) Percentage errors for training set inputs. (c) Percentage errors for unknown inputs. AE: acoustic emission.
Figure 14(a) to (d) shows the results of the neural network 3. The information used to train network 3 was both the number of fatigue cycles and the number of AE events per fatigue cycle as inputs, and the corresponding measured crack propagation lengths as the output. Network 3 predicted the crack length based on both the fatigue cycles and AE events as inputs. This network was trained on 57 data sets and was presented with 23 unknown inputs. Figure 14(a) and(b) shows the comparison of measured and predicted crack length by neural network 3. Figure 14(c) and (d) shows the predicted percentage errors between −1% and 1% for the input training set and between −3.5 and 0 for the unknown inputs. This network was found to work really well in predicting the crack length and gave the most consistent results.
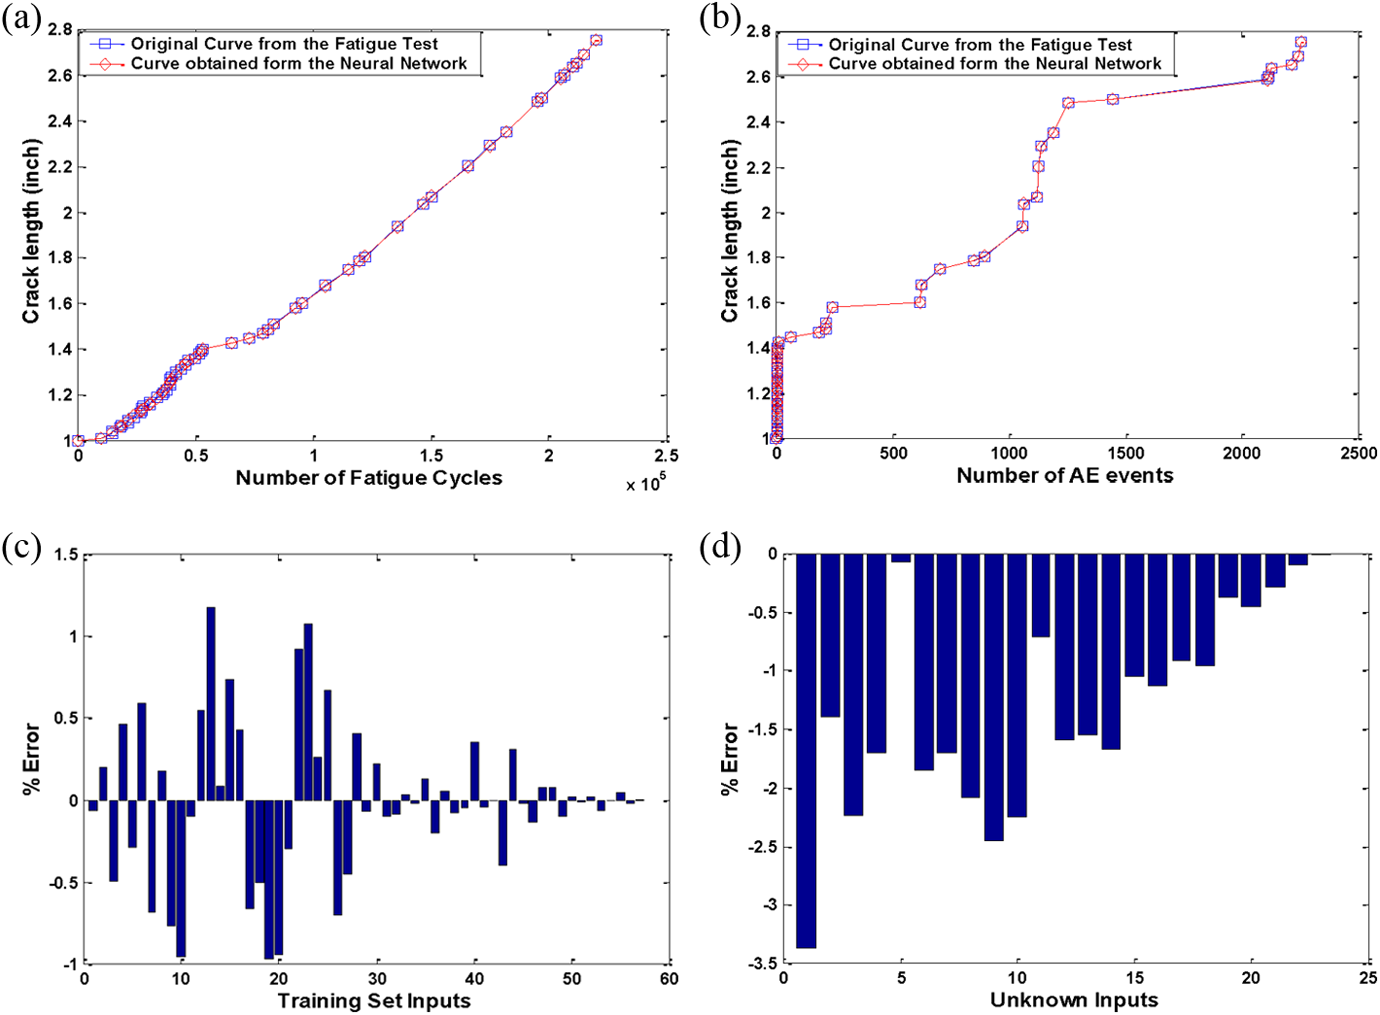
Measured and predicted crack length by neural network 3. (a) Measured and predicted crack length versus fatigue cycles by neural network 3. (b) Measured and predicted crack length versus AE events for neural network 3. (c) Percentage errors for training set inputs. (d) Percentage errors for unknown inputs. AE: acoustic emission.
Conclusions
A method for real-time monitoring and detection of crack propagation in adhesively bonded composite patch repair of cracked aluminum panels using AE has been developed and successfully demonstrated. A method for predicting crack propagation in the patched panels using neural networks has also been developed and successfully demonstrated. Two 5-ply boron/epoxy panels namely an octagonal patch and an elliptical patch bonded to a cracked 2024-T3 aluminum panels were monitored with AE sensors while undergoing a fatigue test. From the results of the research, the following conclusions can be made: There is a correlation between number of AE events and crack propagation in cracked aluminum panels repaired by bonded composite patch. Number of AE events increases with fatigue cycle and crack propagation. Use of multiple AE sensors is necessary for accurate source location and screening of non-crack-related events like fretting, gripper noise, and structural vibration. Even at the high noise condition of 10 Hz loading, AE is capable of detecting crack propagation. Noise signals can be differentiated from the signals originating from crack propagation by application of filtering techniques such as saturation, threshold, and source location. Crack propagation events in aluminum panels produce extensional waves that can be differentiated from flexural waves generated from matrix cracking and shear of the composite patch repair. Noise signals have a lower frequency content, which sharply decays with time, while crack propagation signals have higher frequency content and a flatter frequency response. It has been demonstrated that artificial neural networks can be used to accurately predict crack length from fatigue cycles and number of AE events. Three different neural network models have been developed and successfully used to predict crack length with acceptable errors within 0 to 9%, −9 to 10%, and −3 to 0% for the three neural networks developed.
Footnotes
Acknowledgments
The help of Dr Steve Ziola with the acoustic emission wave analysis is gratefully acknowledged. The Graduate Research Assistantships from this grant and the Intelligent Systems Center are also gratefully acknowledged. The help of Mr Jeff Bradshaw, Department of Civil Engineering, in using the MTS 880 fatigue-testing machine is also acknowledged.
Declaration of Conflicting Interests
The author(s) declared no potential conflicts of interest with respect to the research, authorship, and/or publication of this article.
Funding
The author(s) disclosed receipt of the following financial support for the research, authorship, and/or publication of this article: This research was supported by Universal Technology Corporation under grant no.F33615-97-D-5009 with Mr Mark M Derriso, United States Air Force Research Laboratory, as the technical monitor.