
Abstract
Adding fillers of high thermal conductivity to the base polymer materials is a solution to make composites of high thermal conductivity. Expanded graphite sheets have been recognized as an economic and efficient filler material to make composite polymers of high conductivity. However, the prediction of the effective thermal conductivity of the composite materials is a difficult task due to the random nature in fillers distribution. The anisotropic properties of the sheet fillers make the heat transfer analysis difficult. In this study, a conjugate heat conduction model considering the random distribution nature of fillers is set up and numerically solved. A validated commercial software FLUENT and finite volume method was used in the analysis. Then an experiment is done to validate the model. The numerical results are used to summarize a correlation for the prediction of the effective thermal conductivity of the composite materials. It is found that the filler height to thickness ratio plays an important role in intensifying the heat conduction in the composite materials. At a given filler content, the graphite sheets should be fabricated thin enough to have higher height to thickness ratios and consequently higher performance in effective conductivity.
Keywords
Introduction
Heat exchangers have been widely used in various industries like chemical processes, power plants, petroleum production, air conditioning, and so on. 1 –3 Conventional heat exchangers are mainly made of metals, which are corrosive in acid environment. In fact, corrosion is the number one killer for traditional metal heat exchangers. In acid environment, most iron and steel heat exchangers cannot live longer than 1–2 years. The malfunction can lead to serious disasters. To solve this problem, plastics or polymers instead of metals have been used as the materials to make heat exchangers. 4 –7 However, the thermal conductivity (K) of these plastics is rather low, in the order of 0.2 W m−1 K−1, 8 which makes the heat exchangers poor in performance.
It has been recognized that adding fillers of high conductivity to the base polymers is an efficient method to increase the thermal conductivity of the base polymers. The fabricated composite polymers are promising materials for heat exchangers 9 because they combine the virtues of anticorrosive and high thermal conductivity. Many efforts have been spent in finding optional fillers. They include carbon black, carbon fibers, ceramic or metal particles, carbon nanotubes. 10,11 Recently, sheet-structured expanded graphite (EG) has been recognized as an efficient filler material in intensifying heat conduction in polymers. 12 Compared with other filler materials, it has several advantages. First, the heat conductivity of graphite is high (200 W m−1 K−1). Second, the cost of materials is low, which is very important in engineering applications. Cost is the number one concern for market penetration. Last, it is easy to be further processed. EG sheets are in a layered structure, that is, a piece of graphite is usually formed by many layers of graphene clustered together. Carbon atoms within a graphite layer are covalently bonded. Neighboring layers are bound by much weaker van der Waals forces, which is easy to be broken through by outside forces like ultrasonic bath. 13 When the layers are broken apart, a thicker sheet is exfoliated into several thinner sheets. In this way, the contact areas between the base material and the fillers are increased, which is beneficial for heat conductivity augmentation. It has been practiced as an efficient way to enhance the thermal conductivity of polymers, 14 especially when the filler content is low.
Prediction of the effective thermal conductivity of the composite polymers with expanded graphite sheets is highly desired in the analysis of the composite materials. However, due to the random nature in fillers distribution in orientation, a successful prediction is still very difficult. The EG fillers have the shapes of elliptical disks, which are highly anisotropic. When they are mixed well with the base polymer materials, the fillers can be assumed to be uniformly distributed in space. However, their orientations are difficult to control locally. They are randomly distributed. This is the reason why until today there is still no mature predictions for the effective thermal conductivity of the composite materials. Previous correlations for the estimation of effective conductivity of composite materials 14 –19 were either proposed for particulate fillers or for fibrous fillers. The only correlations proposed for graphite sheets fillers by Hatta et al. 20 didn’t consider the interactions between the EG sheets and the base materials. Therefore, it is not likely to have accurate predictions of performance. It is believed that the effective thermal conductivity of the composite materials is not a simple mixing between the sheet fillers and base materials. Rather, filler shapes and their distributions in the base materials have great impacts on the final thermal conductivity of the filled composite materials. The topic will be investigated in this research. This is the novelty of this study.
Numerical work
Generation of unit cell model
A scanning electronic microscopic (SEM) graph of the microstructure of EG sheet fillers is shown in Figure 1. The positions and orientation angles of fillers are assumed to be randomly distributed in space. This is true when they are well mixed with the base materials. The fillers can be assumed to be distributed homogeneously in space. However, the distribution of each filler in orientation is random, meaning it can orientate randomly in three dimensions at a position. The fillers are like elliptic disks. Figure 1 shows the surface and cross-sectional pictures of a filler. As seen, the shape can be approximated by an elliptical sheet with dimensions about 80 × 40 μm. The sheet thickness is 20 μm. The fillers are in three dimensions, which make heat transfer highly anisotropic.
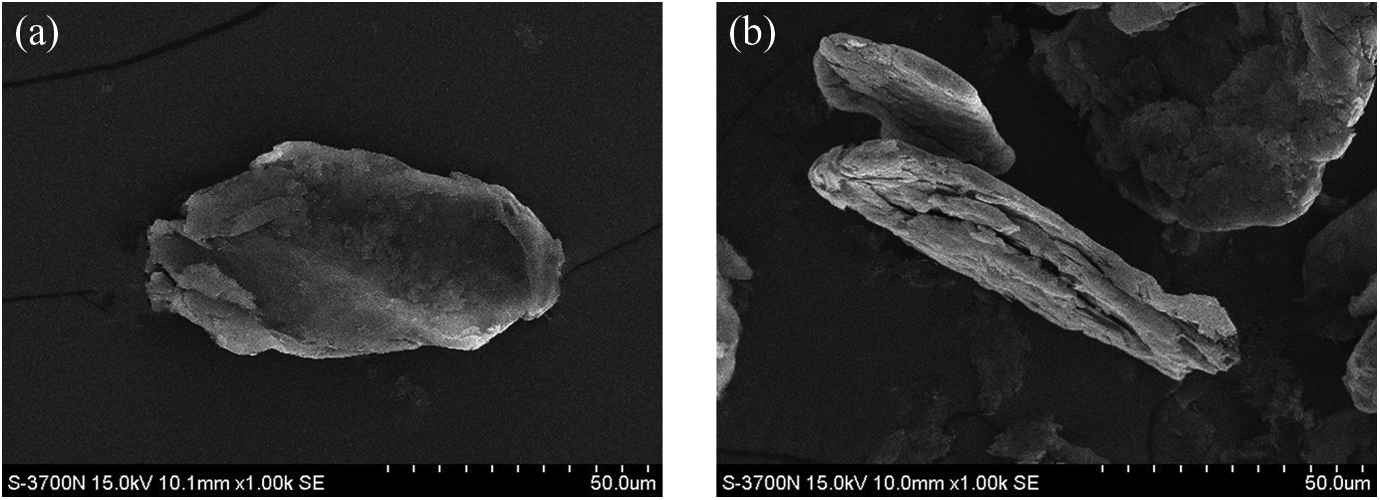
SEM micrographs of expanded graphite sheet fillers: (a) surface of a filler and (b) cross section. SEM: scanning electron microscopy.
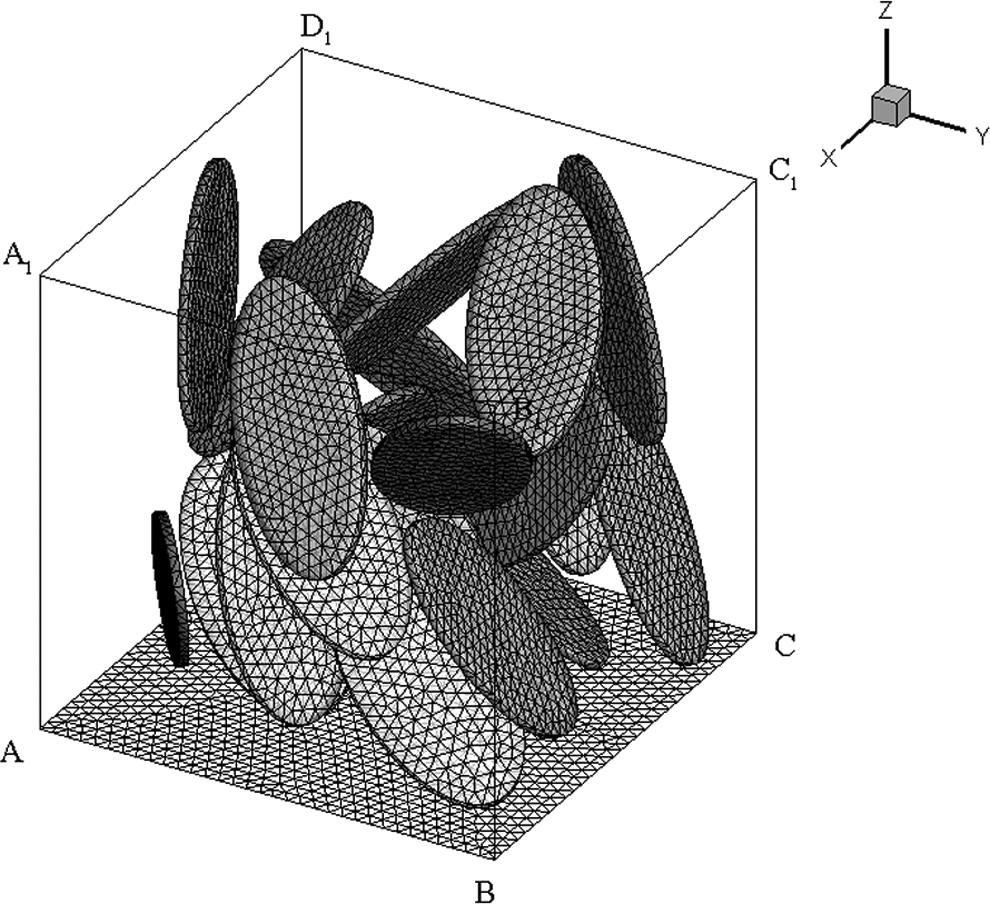
To numerically analyze the heat conduction in the composite materials, a three-dimensional elementary cell comprising of fillers in the base material, as shown in Figure 2, is considered. The cell should be small and convenient for calculations but large enough to represent a periodic section in the material. The selected cell here is a 1 × 1 × 1 cm3 cube. The fillers are assumed to be distributed uniformly in the base materials with no aggregates. This is true when the filler content is below 25%. When the fillers are aggregated together, the mechanical strength of the composite materials will be seriously deteriorated. One filler in the cell is also shown in Figure 2. Its local axis is a, b, and c, corresponding to its height, width, and thickness directions, respectively. Its position can be specified by its coordinates (x1, y1, and z1) at the filler center. Its distributions in orientations can be specified by the revolving angles around axis a, b, and c.
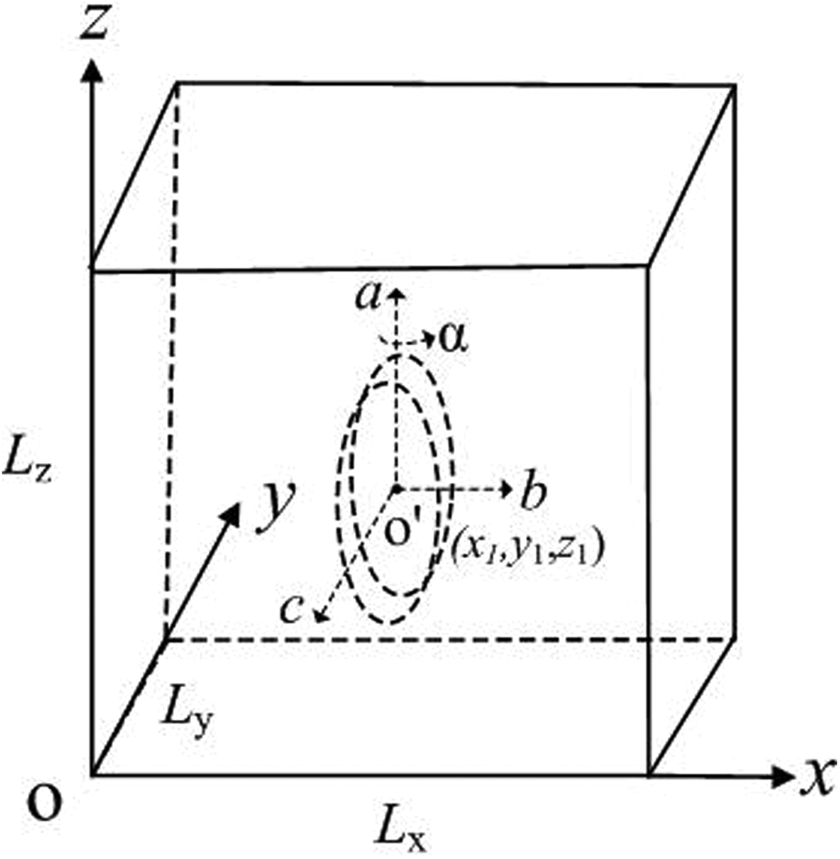
Schematic of a sheet filler distributed in a cell model.
In this research, a computer program is developed to automatically generate the positions and orientations of the fillers that are distributed uniformly in space but randomly in orientations in the cell.
21
At first, the positions for the filler centers are determined uniformly in the cell based on the filler content. Then, the fillers are packed inside one by one. After one filler is positioned, it is revolved in three dimensions around axis a, b, and c, respectively. Before each revolving, a random number rx (0 < rx < 1) is generated by the computer. The revolving angle (α) is calculated as the product of the generated random number rx and
Figure 3 shows a generated fillers distribution. The filler content is 5%. The fillers have a width of 40 µm, a height of 80 µm, and a height to thickness ratio of 20. As seen, the fillers distribution in the cell is quite random. This is in agreement with practical composite materials. The fillers are mixed with the base material completely, so they are distributed quite randomly in orientations but uniformly in space.
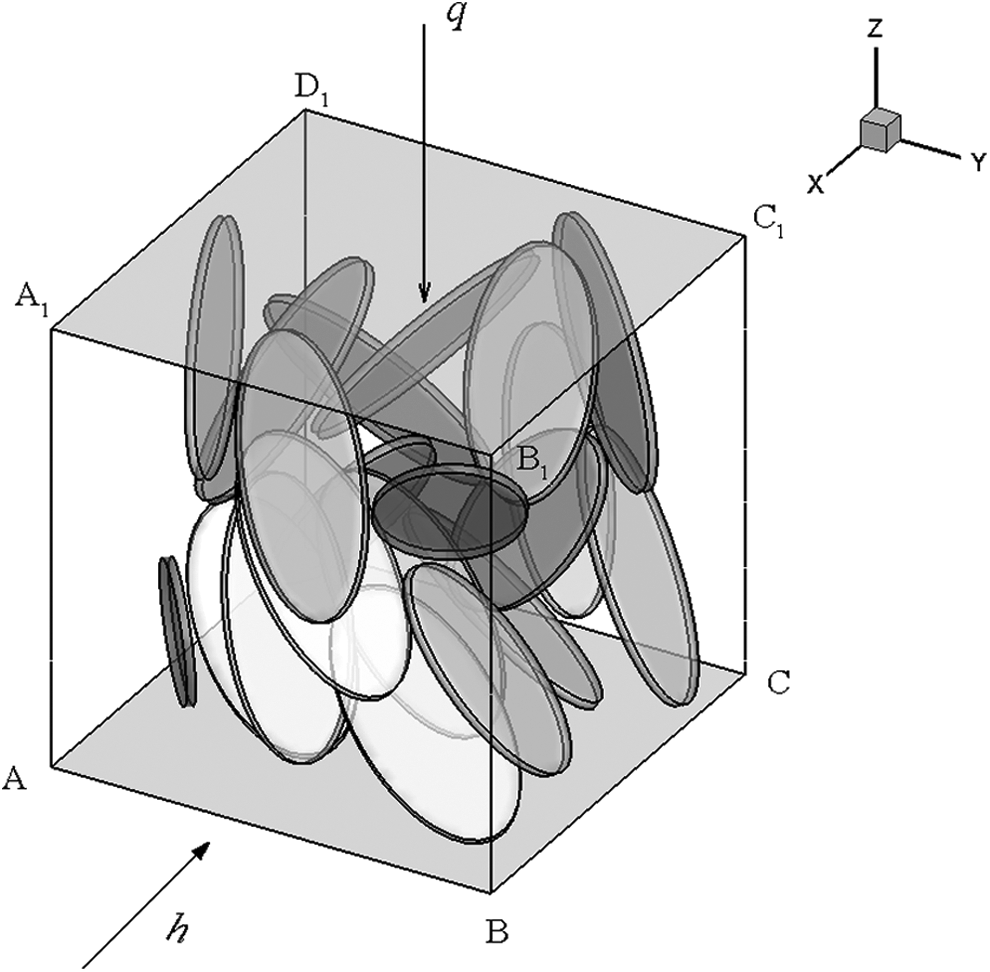
Three-dimensional cell model comprising of randomly distributed fillers and the base material: Vf = 0.05, τ = 20.
Heat conduction equations
For the three-dimensional cell generated in Figure 3, heat conduction in base materials is satisfied by the following equation:
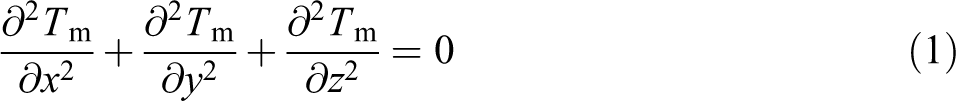
where T is temperature (K) and x, y, and z are coordinates, subscript “m” means base polymer materials.
Heat conduction in the fillers is given using the following equation:
The boundary condition at the top surface of the cell, A1B1C1D1:
where q is the set heat flux (W m−2), which is uniformly imposed on the upper surface, and n is the normal direction of the surface. It is the second-class boundary condition. In calculation, q is set to 1 kW m−2.
A third-class boundary condition is set on the bottom surface of the cell, ABCD:

where the convective heat transfer coefficient (h; W m−2 K−1) and ambient temperature (Tf) are set to constants. In this numerical work, h is set to 20 W m−2 K−1, and Tf is set to 300 K. In the problem, the heat flow through the cell is prescribed and known as q, but the temperatures at other boundaries are unknown. They should be calculated by the heat conduction equations and the boundary conditions.
The other four boundary conditions include ADD1A1, DCC1D1, BCC1B1, ABB1A1:
They are assumed adiabatic.
Heat conduction coupling
At the boundaries between the base materials and the fillers, heat fluxes are the same. They are expressed as:

where subscript “Γ” means contact surfaces between the base materials and the fillers.
When the temperature fields in the cell are calculated, the effective thermal conductivity in z direction for the cell is estimated by the following equation:
where ▵Tcell is the mean temperature difference between the upper and bottom surfaces of the cell. The surface mean temperature here is weighted by area Lx−Ly. Dimensions Lx (along the x axis), Ly (along the y axis), and Lz (along the z axis) are the cell length, width, and height, respectively.
Calculation scheme and solution
Equations (1)
to (7) for conjugated heat conduction in the base materials and fillers are solved by finite difference technique. The cell is discretized by finite volume method. The discretized equations are solved numerically. The calculation methodology can be summarized as following: Assume initial temperature values for both the filler and the base materials. Solve equation(1), get the temperature fields in the base materials, using the temperature values for fillers at interface as the boundary values for the base materials. Solve equation (2), get the temperature fields in the fillers, taking just the calculated base material temperatures at interface as the boundary values. Return to step (2) until all the old values and new values for both the base materials and the fillers are converged. In this way, the conjugate heat conduction equations are satisfied.
To assure the accuracy of the results calculated, a grid independence test is conducted. It indicates that meshes with 27,668 grids are adequate for this problem, which is less than 0.2% difference compared with 33,420 grids. The computational mesh of the cell and fillers in the cell are shown in Figure 4. To see clearly the fillers inside the cell, only the meshes on the bottom surface of the cell are plotted. The volumetric content of fillers is 5%. A validated commercial software FLUENT (ANSYS, Pennsylvania, United States) is used to calculate the temperature distribution. When the temperature fields are known, the effective thermal conductivity is calculated using equation (7).
The mesh structure of the cell (only showing the bottom surface) and fillers in the cell: Vf = 0.05, τ = 20.
Experimental study
An experiment is done to study the heat conduction intensification of polymers by EG fillers. As mentioned, thicker EG sheets can be exfoliated by ultrasonic bath to produce thinner sheets, which is useful for performance improvement. When the EG sheets are treated, their surface dimensions are usually kept unchanged. Only the thickness is changed. So the height to thickness ratio is a key parameter. In this experiment, the raw EG material (sheets of width 40 µm, height 80 µm, and thickness 20 µm) are treated in ultrasonic bath for seven periods of time: 0, 15, 30, 60, 90, 120, 150 min. When treated, they are dispersed in N,N-dimethylformamide (DMF) solvent placed in an ultrasonic bath (400 W). 22 They are kept in the bath for different periods of time. Different ultrasonic treatment time (t; min) would have different sheet thickness, as listed in Table 1. They were measured by SEM observations after composite materials are prepared. When treated for a certain period of time, the EG/DMF solution is ready for further use.
The structural parameters of expanded graphite sheets with various ultrasonic treatment time.a
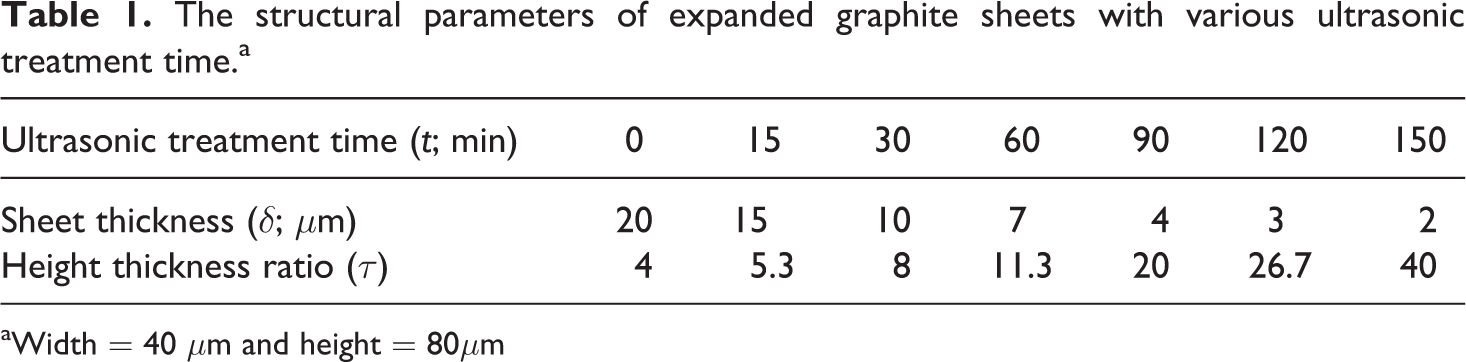
aWidth = 40 μm and height = 80μm
To make composite materials, polyvinylidene fluoride (PVDF) polymer (melting point 175°C and conductivity 0.28 W m−1 K−1) is dissolved in DMF solvent. It is then mixed with the above prepared EG/DMF suspension. The solution is stirred for 3 h until the whole system is uniform and stable. The mixed solution is added in dropwise into a large water bath under stirring. Due to phase exchange, the dropped composites are coagulated into powder forms, which are then isolated via filtration. The powders are then dried in vacuum for 24 h at 70°C to remove residual solvent and moisture. After dryness, the samples are cut into small pieces. The composite material is then melted under pressure in a mold and subsequently water cooled for solidification. The following are the operating conditions for the mold: temperature, 195°C and pressure, 120 MPa. The formed plate samples are used for thermal conductivity measurements and SEM observations. The dimensions of the plates are 40 mm in length, 40 mm in width, and 4 mm in thickness. The thermal conductivity of the samples is measured at 30°C by Hot Disk (DRX-2) [Hot Disk AB (Sweden)]. The uncertainty for thermal conductivity measurement is 3%. Totally seven samples are made with different ultrasonic treatment time. The filler content is controlled to 0.05 as an example.
Figure 5 shows the fractured surface of an EG/PVDF composite sample with Vf = 0.05 and ultrasonic time of 60 min. The image indicates that the fillers dispersed randomly in orientations in the PVDF matrix with no aggregation. Compared with Figure 1 (treatment time 0 min), the height and width of fillers change little, but the thickness decreased obviously. This is in consistent with the assumptions. Commonly, EG sheets are easy to be attracted together due to their very high specific surface area and high surface energy. The present technique of making composite in solution is efficient to overcome this problem. No aggregates are observed. It’s better than melt blending technique. Further, the whole process is carried out in the same solvent, which makes the material fabrication process simple.
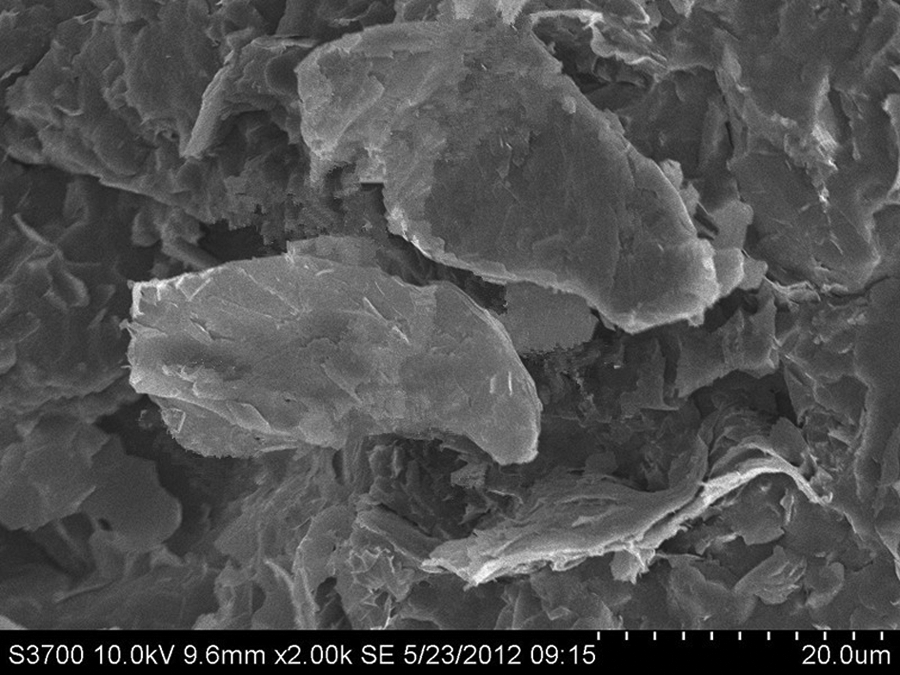
SEM micrograph showing the fractured surface of EG/PVDF composites with Vf = 0.05 and ultrasonic time t = 60 min. EG: expanded graphite; PVDF: polyvinylidene fluoride.
Results and discussion
Validation
The heat conduction problem in the composite samples is modeled. The final effective thermal conductivity is plotted in Figure 6 versus the height to thickness ratios of fillers. For comparison, measured data are also plotted for the seven samples prepared above. Hatta et al.’s model 20 can estimate heat conductivity when the fillers are distributed parallel or normal to the heat flow. When all the fillers are distributed parallel to heat flux (heat flux is along filler height), it is called a parallel model. When all the fillers are distributed normal to heat flux (heat flux is along thickness), it is called a normal model. They are two extremes, which only provide coarse references for heat conductivity estimation. The calculated data with Hatta et al.’s model 20 are also shown in Figure 6. As seen, the tested thermal conductivity is in good agreement with the predictions by the current random model. The maximum deviation is less than 5%. Compared to the predictions with Hatta et al.’s model, it is clear that the fillers are neither parallel nor normal to the heat flux. They are distributed randomly. This is in accordance with the observations in microstructure.
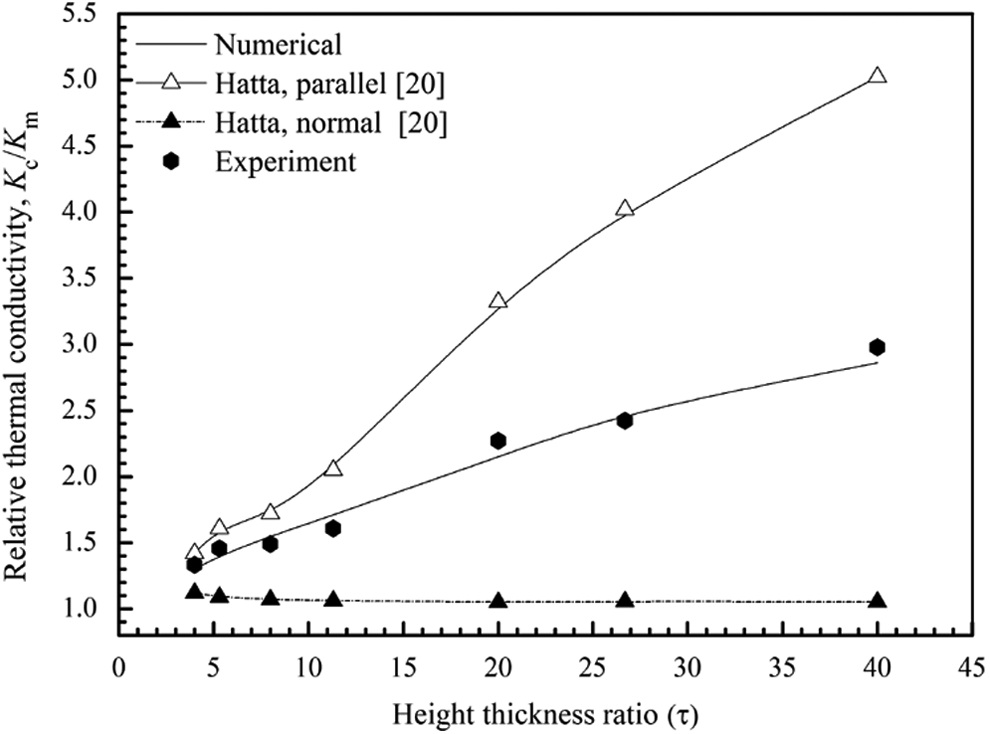
Comparison of the effective thermal conductivity of the composite EG/PVDF materials, calculated, tested, and estimated by Hatta et al.’s model. Vf = 0.05. EG: expanded graphite; PVDF: polyvinylidene fluoride.
Effects of filler height thickness ratios
The validated model is used in the analysis of composite materials with different fillers under different filler contents. For a given filler content (volumetric ratio of all fillers to base materials), it is discovered that the height to thickness ratios of fillers have great impacts on the final effective thermal conductivity of the composite materials. Figure 7 shows the relative thermal conductivity (Kc/Km) of the composite materials with various filler height to thickness ratios at different filler contents. As seen, the thermal conductivity increases with filler content, regardless of the filler height thickness ratios. The steps of increase are similar for different filler height to thickness ratios. This is because the higher the filler content is, the more fillers the materials have and the higher the performance is.
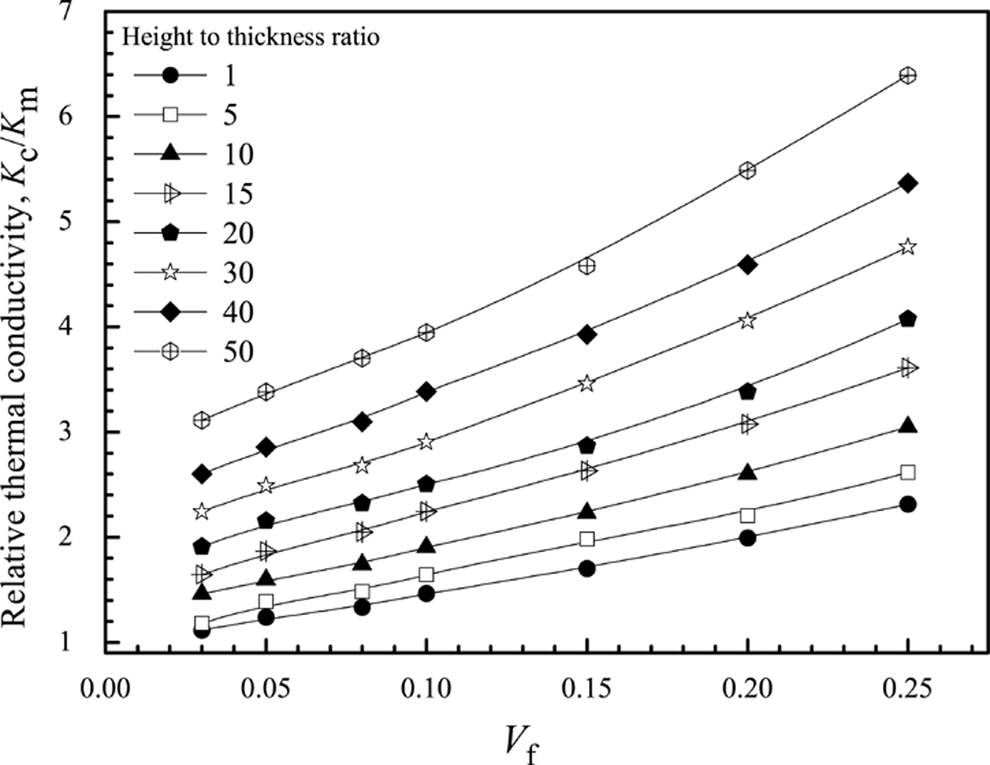
Effects of the filler height to thickness ratios (τ) on the thermal conductivity of the composite EG sheets-filled materials under various filler volume content (V). EG: expanded graphite.
At a given filler content, the higher the filler height to thickness ratios are, the more fillers the materials have. The performance is thus improved. In other words, if the fillers are treated longer by ultrasonic bath, they become thinner after the clustered layers are separated apart. More fillers can be resulted with a given filler content. Heat conduction is thus intensified. The influences are great. For example, at VF = 0.05, when the filler height to thickness ratio is increased from 5 to 50, the thermal conductivity increases by 2.3 times. The ultrasonic treatment of fillers is a convenient technique to realize heat conduction augmentation of polymers. Sheet fillers with large height to thickness ratios should be searched.
To further explain the heat augmentation mechanisms, temperature fields in the unit cell are calculated and plotted in Figure 8. Three samples with different filler height to thickness ratios are calculated and plotted: τ = 20, 30, 40. The filler content is set to 0.05.
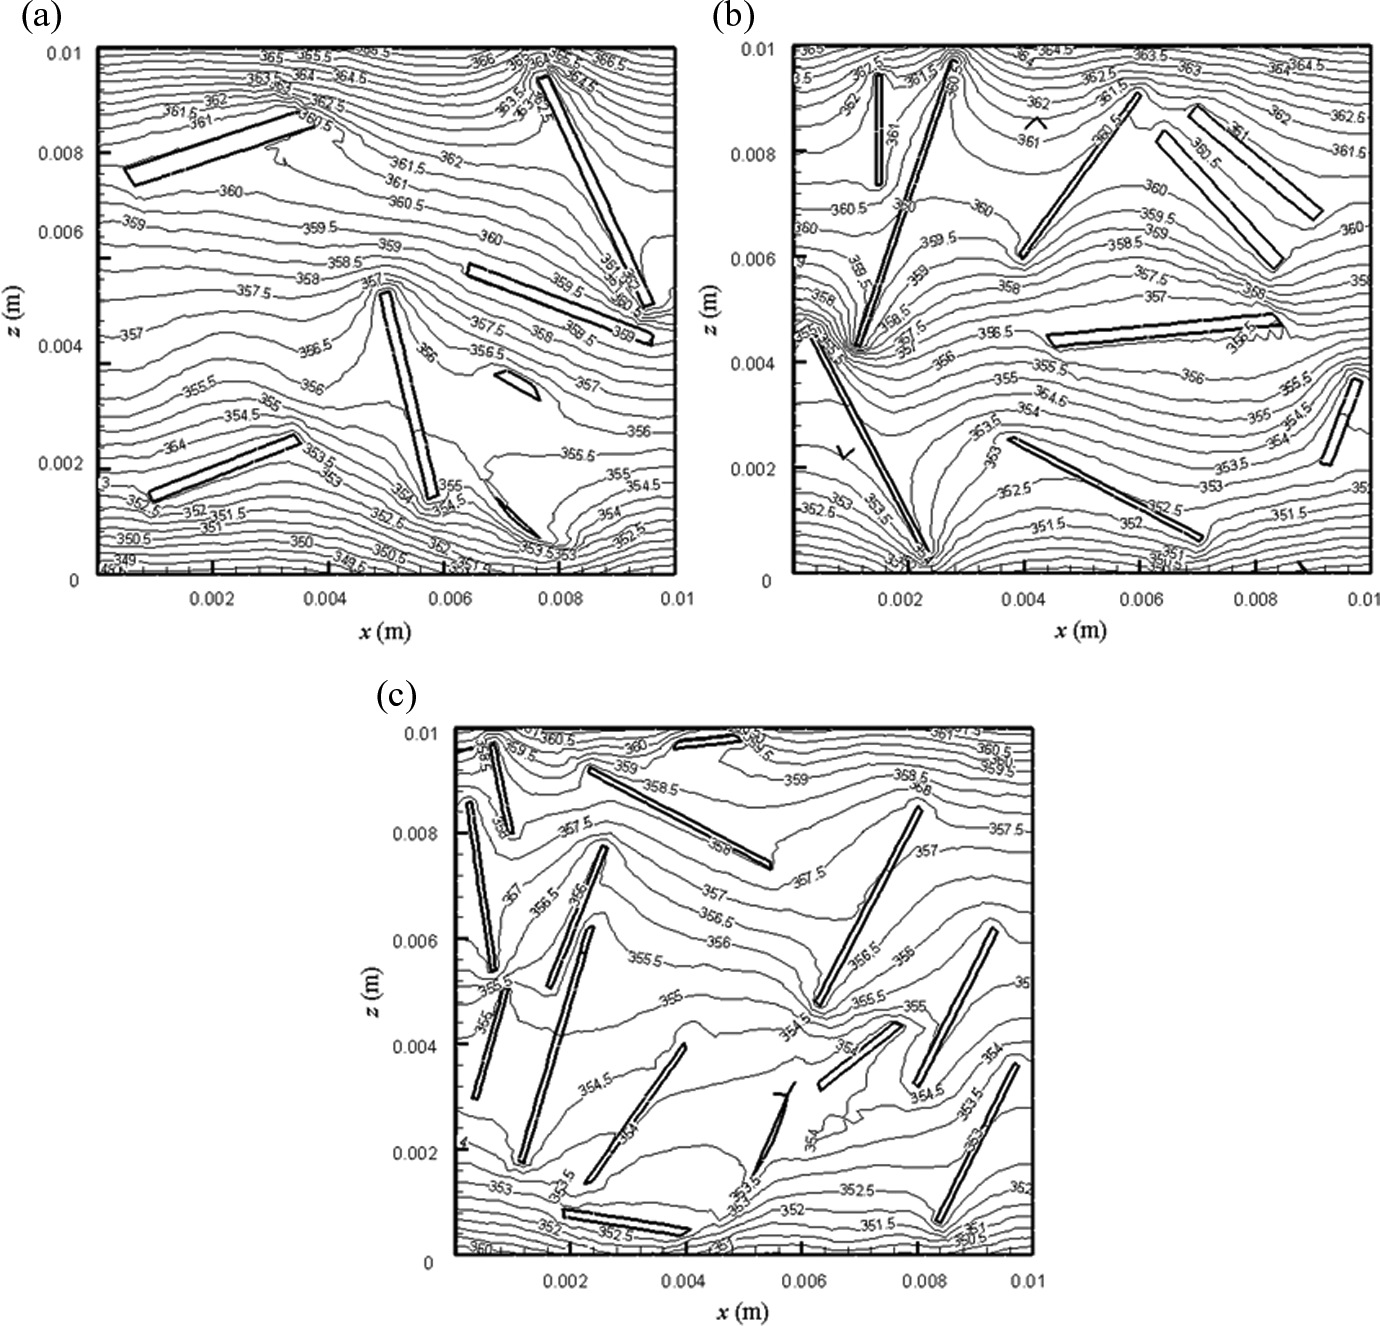
Contours of temperature (K) on the centered x–z plane (y = 0.5Ly) in the unit cell, Vf = 0.05. (a) τ = 20; (b) τ = 30; (c) τ = 40.
The temperature fields in the base materials are deformed and shortcut by fillers. The fillers act as numerous bridges, transporting the heat fluxes through them. For each bridge, it absorbs heat at the source and releasing it at the downstream. The base material near the filler seldom takes part in heat transport, rather, it is shortcut. In this way, the heat transport is increased in the cell. As seen, the thinner the fillers are, the higher the density (ρ) of fillers is. Because more fillers can participate in heat conduction, temperature gradients become less and heat transfer is intensified.
For a single filler, it is the most efficient in heat transfer when it is aligned parallel to heat flow or vertically placed in this case. It is like a tree, absorbing heat from the source and releasing it to downstream. The horizontally placed fillers have little use in heat conduction. Not all the fillers are aligned vertically; however, the percentage of such fillers (vertically placed or nearly vertically placed) will increase with fillers population. That’s the reason why in general the thermal conductivity increases with higher height to thickness ratios, when filler content is fixed. The filler height has the largest effects on heat transfer, so height to thickness ratio is a key parameter.
Correlations
The random model, though accurate, is not convenient for engineering applications. Correlations are convenient for practitioners in the evaluation of thermal conductivity of composite materials. Previous correlations didn’t consider the interactions between the sheet fillers and the base materials. Based on the data regression of the numerical results from this model, following correlation is proposed for EG sheets fillers:
where τ is filler height to thickness ratio.
where δ is the thickness of fillers and H is the length of filler long axis.
The applicable range for filler content is 0.03 ≤ Vf ≤ 0.25, and Kf/Km is less than 100. When Kf/Km exceeds 100, Kf must be replaced by 100Km. The reason is that when the filler thermal conductivity is 100 times greater than that of the base material, there is no significant further improvement in the thermal conductivity of the composite materials. In other words, there is little use by solely increasing the thermal conductivity of fillers if the fillers conductivity has already been 100 times higher than the base materials. Further, for most filler filled composites, the filler content is greater than 3% to have real improvements in conductivity. At higher filler contents (>25%), filler aggregates would usually happen, and the correlations are no longer valid. Under such high content, composite materials will become brisk and they will lose mechanical durability and use. The uncertainty for above correlation is 5.2%.
Conclusions
This study proposes a random model for the prediction of the thermal conductivity of composite polymers filled by EG sheets fillers. They are uniformly distributed in space but randomly orientated locally. The anisotropic characters are considered in the modeling. The following results can be concluded: The random model is satisfactory in predicting the heat conduction augmentation in polymers by EG sheets fillers because it takes into account of the randomly distribution nature. For convenience in practical use, a simple correlation is also proposed. Best sheet fillers should have larger height to thickness ratios. They should have long heat conduction distances and large contact areas and, whenever, be aligned parallel to heat flow. Although fillers are usually distributed randomly, a larger population of fillers will increase the possibility to see such fillers. EG sheets are good candidates for fillers because they can be easily processed. The layered structure makes them promising in producing ultrathin sheets, which are beneficial for heat conduction.
Footnotes
Declaration of Conflicting Interests
The author(s) declared no potential conflicts of interest with respect to the research, authorship, and/or publication of this article.
Funding
The author(s) disclosed receipt of the following financial support for the research, authorship, and/or publication of this article: The Project is supported by Natural Science Foundation of China (no.51406072).