
Abstract
Zinc oxide (ZnO) is a very important compound used in different industries. Several methods are currently used to synthesize ZnO. In this study, we discuss a novel chemical route used to synthesize and purify ZnO in the nanometer scale, with full control on the particle size. The resultant product is chemically and physically characterized using high-resolution X-ray diffraction, thermal analysis, spectral analysis, and ultrasonic measurements in order to determine the crystallite size and the chemical composition of the product as well as to confirm the absence of impurities. Electron microscopy (scanning and transmission) is used to confirm the particle size of the resultant material and confirm particle size uniformity and absence of agglomeration.
Introduction
Nanoparticles attract great interest due to their unusual chemical and physical properties which make them suitable for many technological applications such as catalysis, electronics, optics, and biotechnology. From the technological point of view, due to the capability of tuning their optical and the electronic properties by gradually controlling the particle size and shape make them usable in different applications. One of the most important properties of the nanomaterials is that as the size of a material is reduced, the number of atoms at the surface compared to the number of atoms in the bulk material itself increases, leading to a drastic change in the physical and electronic properties of those materials. This allows chemists to change the electronic and chemical properties of the materials by only changing the size or modifying the surface of the particle.
Nanoparticles exhibit a strong ultraviolet (UV)–visible absorption band that is not present in the spectrum of the bulk metal. This absorption band is due to the collective excitation of the conduction electrons when the size of the particles is less than the mean free path of the electron in the metal. This is known as the localized surface plasmon resonance. The position of the surface plasmon absorption band depends mainly on the shape of the particles and on their size 1 .
Zinc oxide (ZnO) powder is widely used as an additive into numerous materials and products including plastics, ceramics, glass, cement, rubber (e.g. car tires), lubricants, paints, ointments, adhesives, sealants, pigments, foods (source of zinc (Zn) nutrient), batteries, ferrites, fire retardants, first aid tapes, and so on. ZnO is present in the Earth’s crust as the mineral zincite; however, most of the ZnO used commercially is produced synthetically.
In materials science, ZnO is often called II-VI semiconductor because Zn and oxygen belong to the second and sixth groups of the periodic table, respectively. This semiconductor has several favorable properties such as good transparency, high electron mobility, wide band gap, and strong room temperature luminescence. These properties are already used in emerging applications for transparent electrodes in liquid crystal displays, in energy-saving or heat-protecting windows, and electronic applications as thin film transistors and light-emitting diodes.
The hexagonal structure has a point group 6 (Hermann–Mauguin notation) or C6v (Schoenflies notation), and the space group is P63mc or C6v. The lattice constants are a = 3.25 Å and c = 5.2 Å; their ratio c/a is approximately 1.60, which is close to the ideal value for hexagonal cell c/a = 1.633. 2 As in most group II-VI materials, the bonding in ZnO is largely ionic, which explains its strong piezoelectricity. Due to the polar Zn–O bonds, Zn and oxygen planes bear electric charge (positive and negative, respectively). Therefore, to maintain electrical neutrality, those planes reconstruct at atomic level in most relative materials, but not in ZnO because its surfaces are atomically flat, stable, and exhibit no reconstruction. This anomaly of ZnO is not fully explained yet. 3
Nano-ZnO is a unique material that exhibits dual properties of semiconductivity and piezoelectricity. ZnO has a long history of usage for pigments and protective coatings on metals. The electrical, optoelectronic, and photochemical properties of ZnO has resulted in use for solar cells, transparent electrodes, and blue/UV light-emitting devices. In the past decade, numerous studies have been made on both production and application of one-dimensional ZnO. 4
The nanosized ZnO with the features of large volume to area ratio, high UV absorption, and long life span 5 has been widely used as catalyst, 6,7 gas sensor, 8,9 active filler for rubber and plastic, UV absorber in cosmetics, and antivirus agent in coating. 10 – 12 Moreover nano-ZnO, also is one of the multifunctional inorganic nanoparticles, has drawn increasing attention in recent years due to its many significant physical and chemical properties, such as chemical stability, low dielectric constant, high luminous transmission, effective antibacterial and bactericide, intensive UV and infrared absorption. Nano-ZnO can be used in antibacterial and bactericide, field-emission displays, and UV-shielding materials. 13,14
In most recent literatures, nanoinorganic particles, such as titanium dioxide, silicon dioxide, and iron oxide, were used to synthesize composite microspheres. 15 – 18 In case of ZnO nanoparticles, there are few methods used to synthesize nano-ZnO; one of them is the indirect or the French method 19 where metallic Zn is melted in a crucible and vaporized at temperatures above 907°C (typically around 1000°C). Zn vapor instantaneously reacts with the oxygen in air atmosphere to give ZnO, accompanied by a drop in its temperature and bright luminescence. ZnO particles are transported into a cooling duct and collected in a bag house. Its product normally consists of agglomerated ZnO particles with an average size of 0.1 to a few micrometers. In the direct, American, method, the starting material can be several Zn composites, such as Zn ores or smelter by-products. It is reduced by heating with a carbon additive (e.g. anthracite) to produce Zn vapor, which is then oxidized as in the indirect process. Because of the lower purity of the source material, the final product is also of lower quality in the direct process as compared to the indirect one. Large single crystals (many cubic centimeters) are usually grown by the gas transport (vapor phase deposition), hydrothermal synthesis, or melt growth. 19,20 However, because of high vapor pressure of ZnO, growth from the melt is problematic. Growth by gas transport is difficult to control, leaving the hydrothermal method as a preference.
Many ZnO nanostructures can be produced via aqueous methods. They are attractive because of relatively low synthesis temperatures (<300°C) and absence of complex vacuum setup. Aligned ZnO nanoparticles on preseeded silicon, glass, and gallium nitride substrates have been grown in aqueous solutions using aqueous Zn salts such as zinc nitrate (Zn(NO3)2) and zinc acetate in basic environments. 21 The morphology of the resulting nanostructures can be tuned by changing the parameters such as temperature, precursor concentrations, and pH. Preseeding substrates with ZnO creates sites for homogeneous nucleation of ZnO crystal during the synthesis. Common preseeding methods include in situ thermal decomposition of zinc acetate crystallites, spin coating of ZnO nanoparticles, and the use of vapor deposition methods to deposit ZnO thin films. 22,23 Preseeding can be performed in conjunction with top-down patterning methods such as electron beam lithography and nanosphere lithography to designate nucleation sites prior to growth. The synthesis is typically carried out at a temperature about 90°C, in an equimolar aqueous solution of Zn(NO3)2 and hexamine, the latter providing the basic environment. The addition of polyethylenimine improves the aspect ratio of the ZnO nanoparticles. 24
Anzlovar et al. used zinc (II) acetate (0.1 M) and di(ethylene glycol) or tetra(ethylene glycol) under sonication. ZnO was then washed with ethanol followed by drying to obtain ZnO powder. 25 Hong et al. synthesized ZnO by the precipitation method, using polyethylene glycol solution, Zn(CH3COO)2·2H2O and (NH4)2CO3 aqueous solutions followed by precipitation, filtration, and washing, after which ZnO nanoparticles were obtained. 26 Huang and Hsieh 27 prepared ZnO nanoparticles using Zn(Ac)2·2H2O and LiOH-H2O under vigorous stirring, by adding hexane, followed by centrifugation, after which the nanoscale ZnO particles were obtained. Cao et al. 28 prepared ZnO nanoparticles using aqueous ammonia that was added to the solution of zinc sulfate under continuous stirring with the addition of ammonium bicarbonate and heating. At the end of the reaction, the ZnO precipitate was filtered, washed, and dried. Li et al. 29 prepared ZnO nanoparticles by precipitation method. Two solutions of zinc nitrate hexahydrate (Zn(NO3)2 6H2O) and sodium carbonate (Na2CO3) were added under vigorous stirring. The resulting white precipitates were filtered and washed. Finally, ZnO nanoparticles were obtained after calcination of the solids in air atmosphere for 2 h.
It is clear that the nanoparticles of ZnO have wide range of applications. However, several synthesis methods discussed above are either expensive, produce agglomerates or particles with size in the micrometer range. This makes it difficult to control and tune the properties of the nanoparticles. In this research, we report a new method of synthesizing ZnO nanoparticles with full control on the particle size. The structure of the resulting material is fully characterized using different techniques in order to assess their stability, chemical and physical properties as well as crystallite and particle size.
Experimental
Materials
Zinc nitrate
Zn(NO3)2 was supplied from Alfa Aesar, A Johnson Matthey Company (Ward Hill, Massachusetts, USA), in colorless, deliquescent crystal form. It has molecular formula Zn(NO3)2 6H2O, density 2.065 g cm−3 (hexahydrate), and melting point of 36.4°C. It is used for preparation of ZnO nanoparticles.
Sodium carbonate
Na2CO3, also known as washing soda or soda ash, was supplied from Alfa Aesar, A Johnson Matthey, in white solid form. It has a density of 2.54 g cm−3 and melting point of 851°C. It is used for the preparation of ZnO nanoparticles.
Solvents
The solvents, namely acetone, ethanol, and xylene used in this work are obtained from El-Nasr Pharmaceutical Chemicals Company (Egypt).
Preparation of ZnO nanoparticles
ZnO nanoparticles were prepared by a precipitation method described by Wang et al. 30 The precipitation method makes the production of large quantities of ZnO nanoparticles possible in a reproducible way. Moreover, this is a relatively cheap synthesis method. Chemicals of analytical purity and distilled water were used as follows: two solutions were prepared, solution (A) 0.1 mol Zn(NO3)2·6H2O was dissolved in 0.2 dm 3 distilled water; and solution (B) 0.12 mol Na2CO3 was dissolved in 0.24 dm 3 distilled water. Then, solution (A) was added to solution (B) dropwise under vigorous stirring. The resulting white precipitates were filtered and washed with distilled water three times. The solids were then washed with ethanol and were dried at 100°C for 6 h in vacuum system to remove the solvent. Finally, ZnO nanoparticles were obtained after calcination of the solids in air atmosphere at 200, 250, 300, 350, 400, 500, and 600°C for 2 h. In order to distinguish the different samples of ZnO, they are given codes as shown in Table 1.
ZnO nanoparticles prepared by calcination of precursor at different temperatures for 2 h.
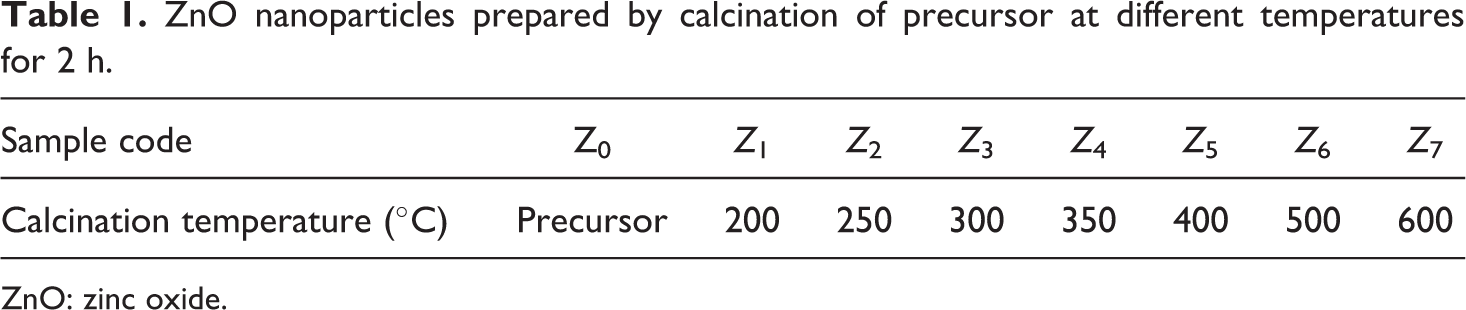
ZnO: zinc oxide.
Characterization of ZnO nanoparticles
XRD analysis
X-Ray diffraction (XRD) technique was used to determine the diffraction patterns of the crystal structure. X-Ray diffractometer (model 7000; Shimadzu, Japan), operating with copper K α radiation (λ = 0.154060 nm) generated at 30 kV and 30 mA with a scanning rate of 4° min−1 for 2θ values between 20° and 75°.
The recorded XRD pattern chart including the intensities of diffraction beam versus the diffraction angle (2θ) was obtained. The diffraction patterns were recorded automatically with a scanning speed of 4° min−1 starting from low angle (2θ = 20°).
The crystallite size can be determined from the broadening of corresponding X-ray spectral peaks by Scherrer formula.
Fourier transform infrared spectroscopy
Thin films were prepared from the resulting products by compression molding with potassium bromide pellets and Fourier transform infrared spectra were recorded on a Nicolet 380 spectrometer (France) in the spectral range of 4000–400 cm−1 with a resolution of 0.5 cm−1 and precision of 0.01 cm−1.
Transmission electron microscopy
Transmission electron microscopy (TEM) of ZnO samples was performed with a transmission electron microscope (model H-800, Hitachi, Japan), and the particle sizes from TEM were estimated with software (SemAfore 4.0). The powder of ZnO was dissolved in tetrahydrofuran solution before measurements.
Scanning electron microscopy
The morphologies of ZnO samples were studied using a scanning electron microscope (model XL 30; Philips, Germany) with an accelerating voltage of 30 kV and magnification 10× up to 400,000× and resolution 3.5 n.m. This analysis shows the change in the particle morphology after the calcination process. Also the fracture surface morphology of composites was studied. Prior to the measurement, the specimens were coated with gold.
Thermogravimetric analysis
Thermogravimetric analysis (TGA) was performed on nano-ZnO and polyethylene/ZnO nanocomposite on an analyzer (model TA-50, Shimadzu, Japan) using 5 mg sample, at a heating rate of 10°C min−1. TGA was conducted with the compounds placed under high-quality nitrogen atmosphere in order to avoid unwanted oxidation.
Ultrasonic measurements
The longitudinal ultrasonic wave velocity (V L) was measured at room temperature (300 K) using the pulse–echo method. In this method, x-cut and y-cut transducers operated at a fundamental frequency of 4 MHz and a digital ultrasonic flaw detector (USIP 20, Krautkramer, Germany) were used. The samples were prepared as follow: 0.5 g of nano-ZnO from Z 0 to Z 7 dissolved in 10 ml hydrochloric acid (HCl) were used. From ZnO solutions, the density (ρ) of ZnO was measured as ρ = m/V, where m is the mass of ZnO after dissolvation in V volume (10 ml of 70% concentrated HCl). Also the molar volume M v of ZnO was calculated as M v = M w/ρ, where M w is the molecular weight of ZnO.
Results and discussion
The homogeneous precipitation method was used to prepare ZnO nanoparticles from the precursor (since the precursor is a complex of zinc carbonate (ZnCO3) and zinc dioxide (Zn(OH)2), which is a result of reaction of Zn(NO3)2 and Na2CO3). Eight samples of nano-ZnO from Z 0 to Z 7 were prepared after calcinations of the precursor (Z 0) in air at ambient, 200, 250, 300, 350, 400, 500, and 600°C for 2 h, respectively, with variable fine particle sizes (Table 1). Investigation of the effects of calcination temperature on particle size and structural properties of ZnO nanoparticles was carried out.
XRD analysis
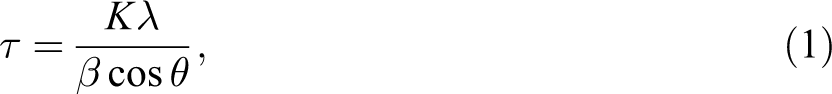
Figure 1 displays the XRD patterns of nano-ZnO calcinated at different temperatures. X-Ray patterns that were taken on numerous samples showed change in intensity or full-width half maxima (FWHM) in the various X-ray peaks. They show that ZnO is formed after calcination of the precursor at 200°C or more. The ZnO crystallite sizes are calculated using Scherrer’s formula
29
:
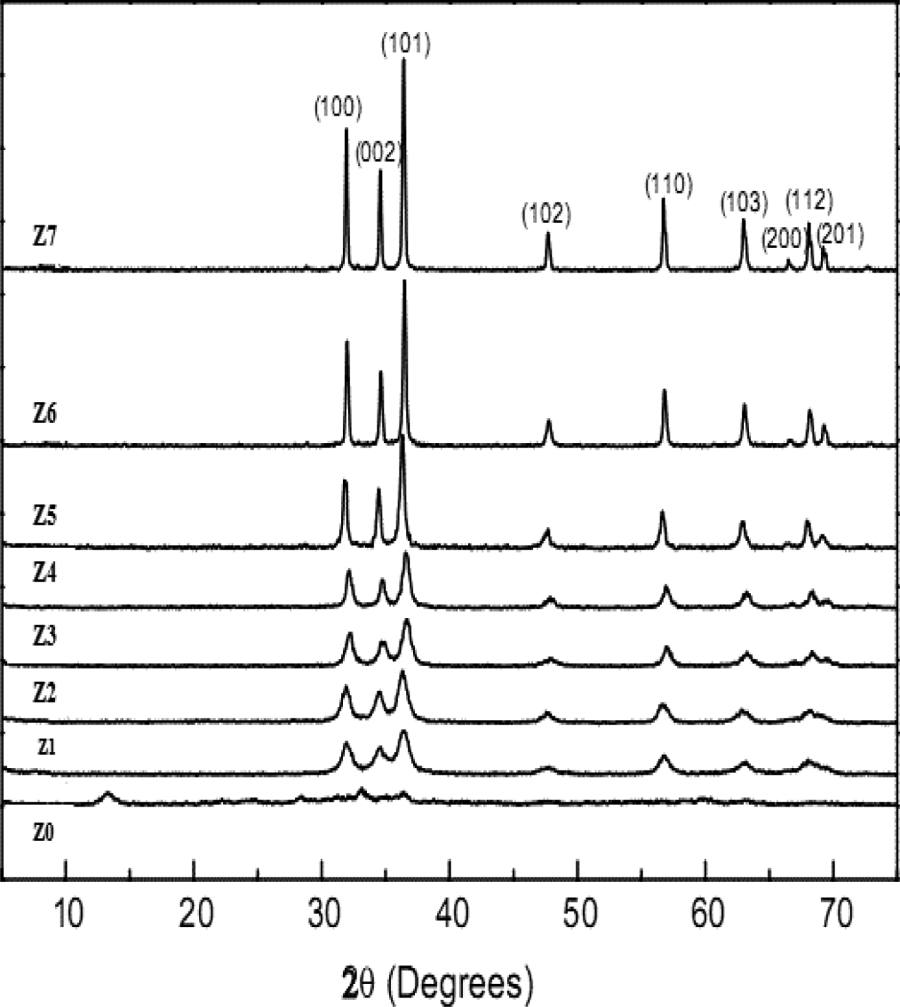
XRD patterns of ZnO nanoparticles calcinated at different temperatures. XRD: X-ray diffraction; ZnO: zinc oxide.
where K is the shape factor and is equal to 0.9, λ is the X-ray wavelength, β is the line broadening at half the maximum intensity (FWHM) in radians, and θ is the Bragg’s angle; τ is the mean size of the ordered (crystalline) domains, which may be smaller or equal to the grain size. The dimensionless shape factor has a typical value of about 0.9, but varies with the actual shape of the crystallite. The Scherrer equation is limited to nanoscale particles. It is not applicable to grains larger than about 0.1 μm, which precludes those observed in most metallographic and ceramographic microstructures.
X-Ray diffractograms of the synthesized ZnO show peaks at 2θ values of 31.8°, 34.5°, 36.2°, 47.6°, 56.6°, 62.9°, 66.4°, 67.9°, and 69.1° as illustrated in Figure 1. They are in accordance with the zincite phase of ZnO which are typical for the hexagonal ZnO wurtzite structure with lattice parameters (a) and (c) of 3.249 and 5.205 Å, respectively, 25 hence (a) and (b) are equal in hexagonal lattice. No peaks of impurities are observed, suggesting that the high-purity nanoZnO are obtained. Moreover, an increase in calcination temperature brings about sharper diffraction peaks, corresponding to the increase in the degree of crystallinity.
The crystallite size of ZnO nanoparticles estimated using the Scherrer’s equation are given in Figure 2. It is obvious that an increase in calcination temperatures brings about corresponding increase on crystalline size, leading to sharper diffraction peaks.
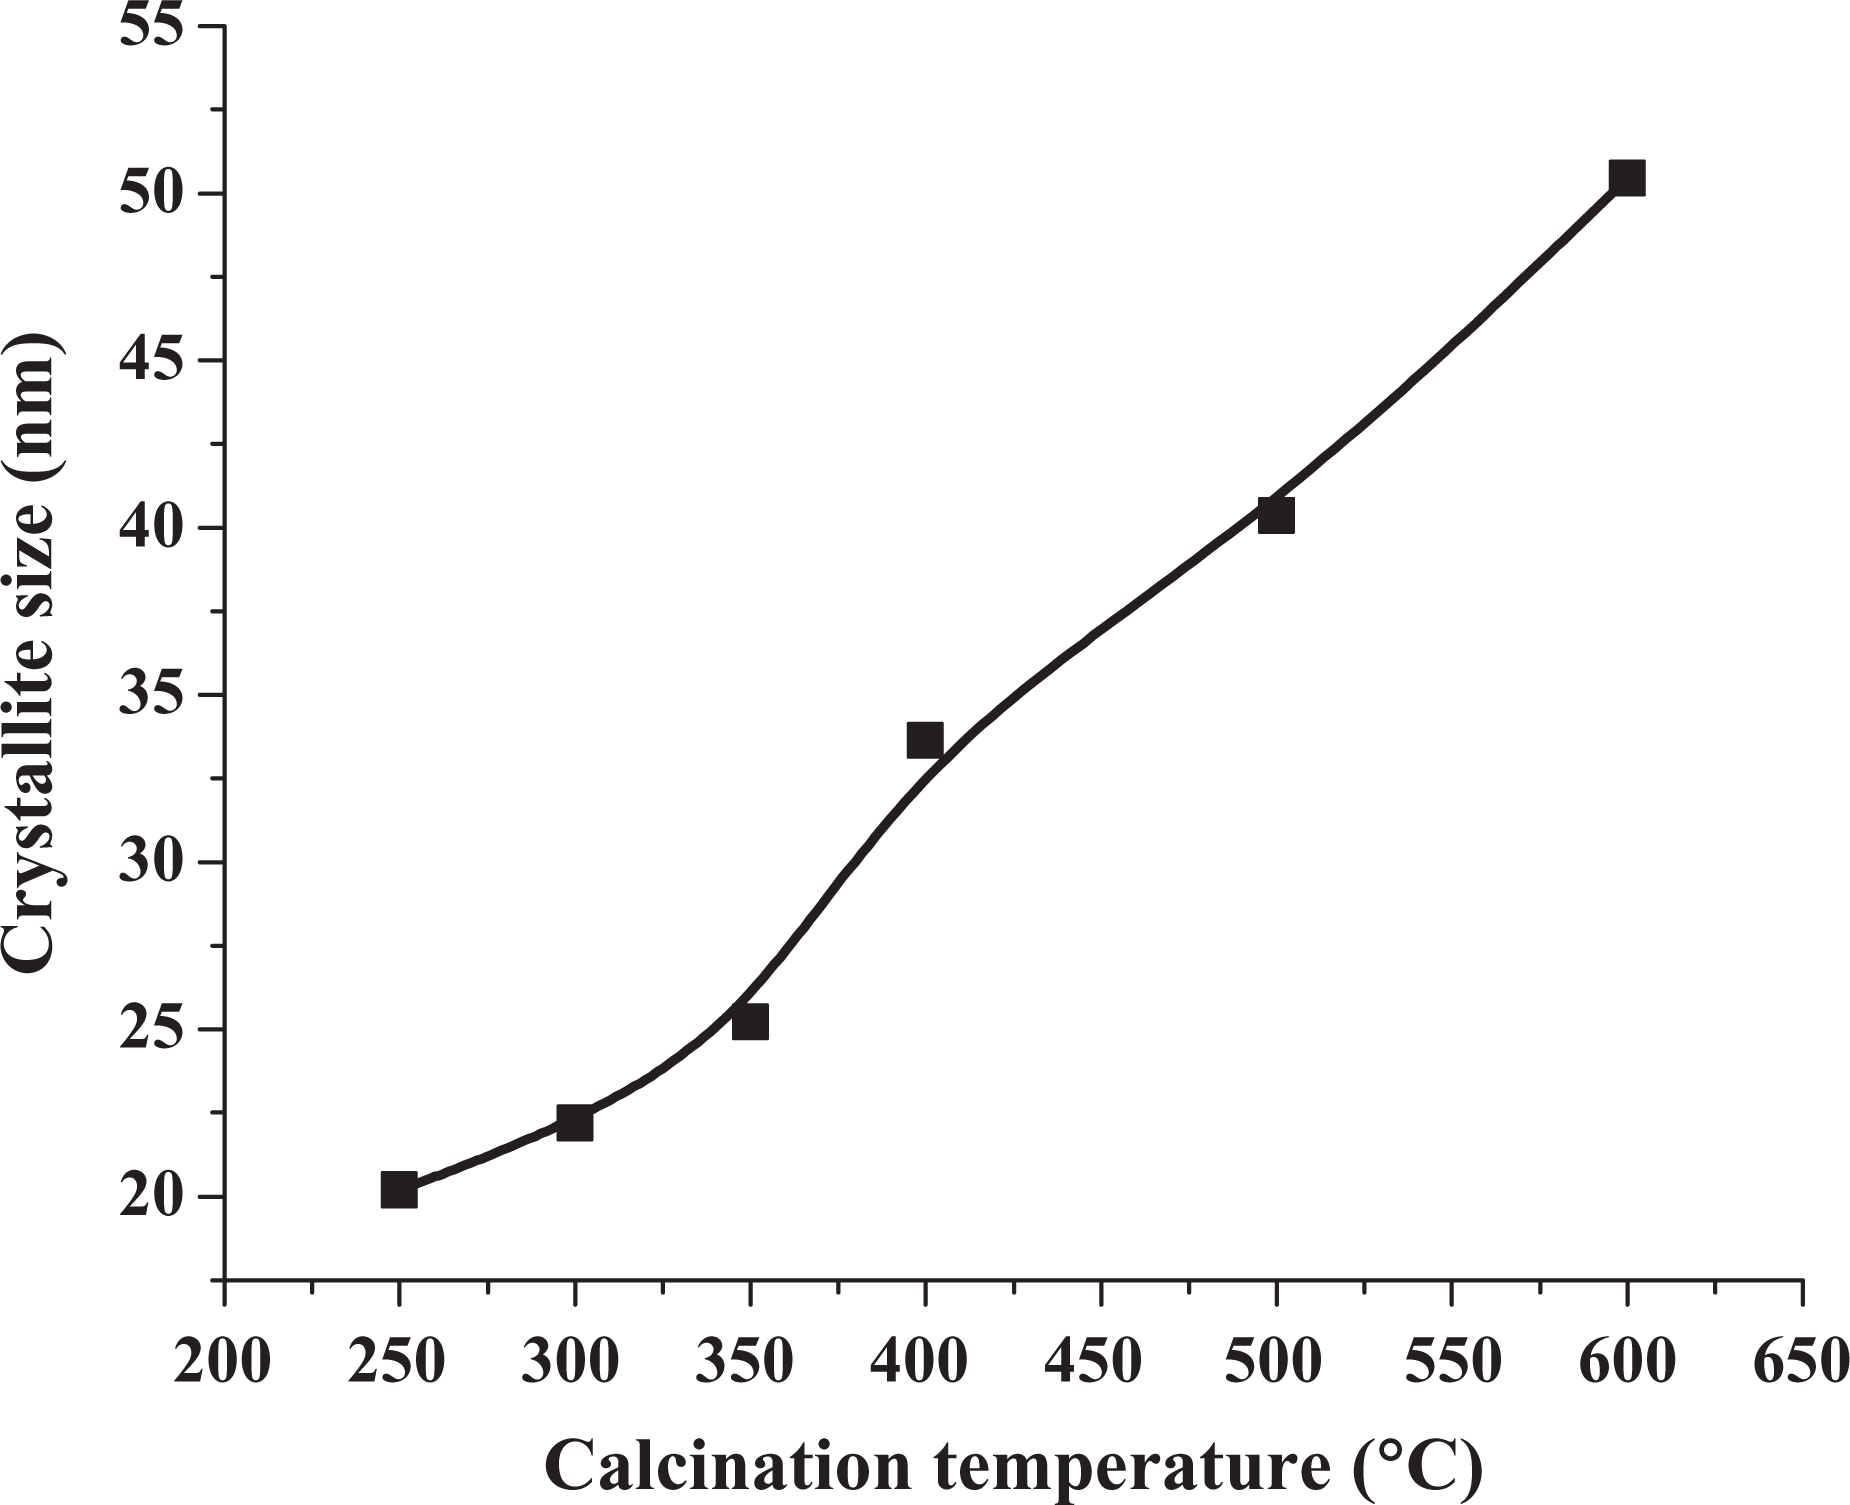
Crystallite size of ZnO nanoparticles estimated using the Scherrer’s equation. ZnO: zinc oxide.
FTIR spectroscopy
The FTIR spectra of samples Z0 to Z7 are given in Figure 3. The main feature of the spectrum is corresponding to basic ZnCO3 as the precursor. After calcination of the precursor, ZnCO3 transformed to ZnO nanoparticles, and a peak was observed at 480 cm−1. This can be identified corresponding to the two transverse optical stretching modes of Zn–O bond.31 The FTIR spectra also show that the shoulders of ZnO stretching peaks in the range of 1200–1500 cm−1 become steeper as the calcination temperature increases, suggesting that the purity of ZnO increases with increase in calcination temperature. 29 Figure 3 also shows a broad band in the range of 3200–3700 cm−1 characteristic to absorption of hydroxyl group (from Zn(OH)2) and has become a broad peak centered at 3450 cm−1 indicating at least the partial disappearance of the OH group. Also the sharper peaks observed for sample Z 4 that was calcinated at 350°C indicates high crystallinity and purity of the nano-ZnO obtained at this temperature.
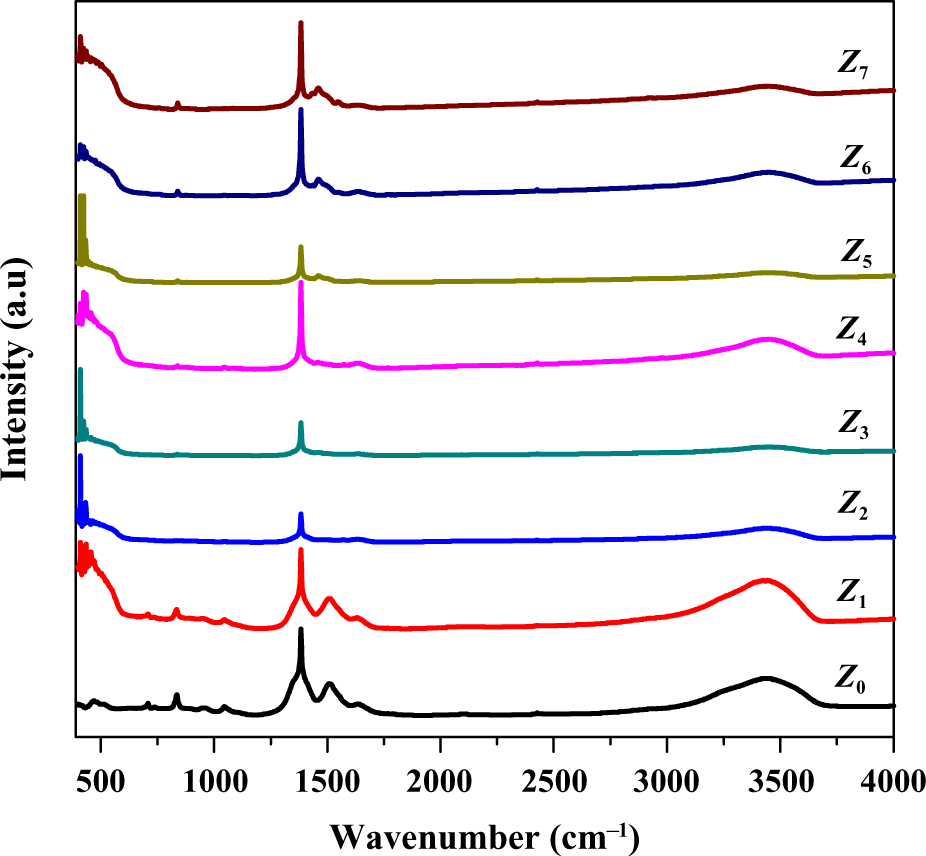
FTIR spectra of samples Z0-Z7. FTIR: Fourier transform infrared.
EM analysis of ZnO nanoparticles
Figure 4 shows TEM micrographs of the precursor and the nano-ZnO samples prepared at different calcination temperatures.
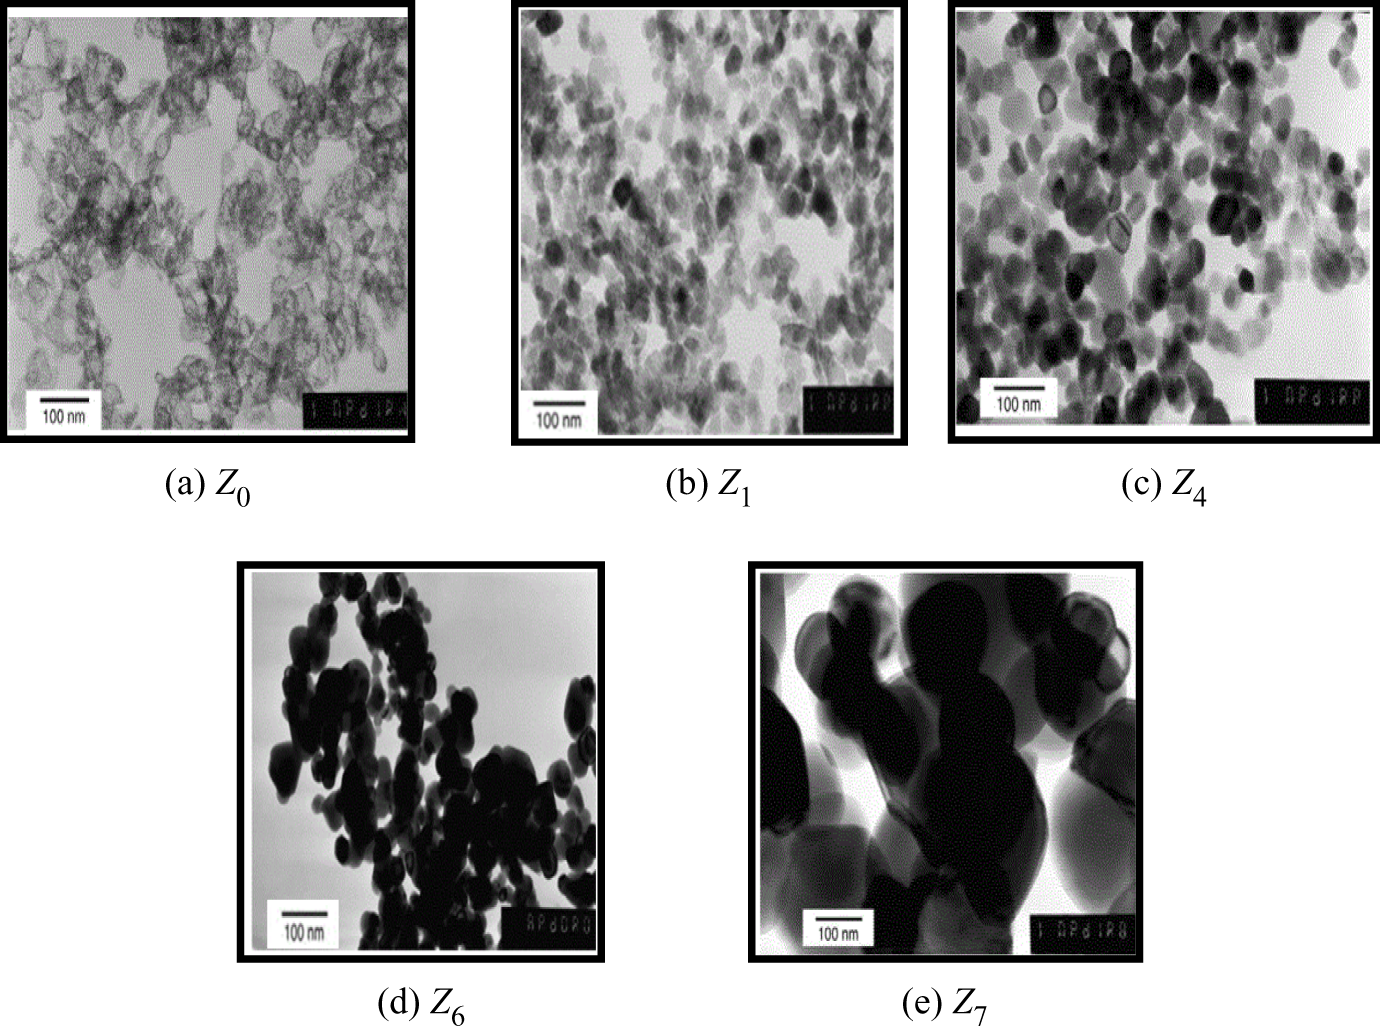
TEM micrographs of nano-ZnO at different calcination temperatures. (a) Precursor, Z0 , (b) calcinated at 200°C, Z 1, (c) 350°C, Z 4, (d) 500°C, Z 6, and (e) 600°C, Z 7. TEM: transmission electron microscopy; ZnO: zinc oxide.
It is clear from the figure that the precursor (Z 0) consists of 30–40 nm spherical particles. After calcination of the precursor at different temperatures, the ZnO nanoparticles with variable fine particle sizes are obtained and the particle size increases with calcination temperatures. For the samples calcinated at 200°C, Z 1 (Figure 4(b)) and 350°C, Z 4 (Figure 4(c)), the average particle sizes are 22.7 and 28.3 nm, respectively. The figure also shows a uniform distribution of particle size up to this temperature. For samples calcinated at 500°C, Z 6 (Figure 4(d)), and 600°C, Z 7 (Figure 4(e)), ZnO nanoparticles aggregated into clusters of very large nanometers in size. These agglomerates would impair proper dispersion in polymer matrices and lead to inferior properties of the resulting nanocomposite as discussed in another publication. 32
SEM analysis of nano-ZnO
Figure 5 shows SEM images of the ZnO nanoparticles prepared at different calcination temperatures. The precursors calcinated at different temperatures led to the formation of ZnO nanoparticles with variable fine particle sizes Z 0-Z 7. It is clear from Figure 5 and Table 2 that the particle size increases with increasing the calcination temperature in accordance with the XRD results discussed previously. For the samples calcinated at relatively high temperatures, Figure 5(g) and (h), ZnO particles aggregated into clusters, 33 and the average particle sizes are naturally relatively large. These aggregates occurred probably during the calcinations process may be due to large specific surface area and high surface energy of the nanoparticles. 34
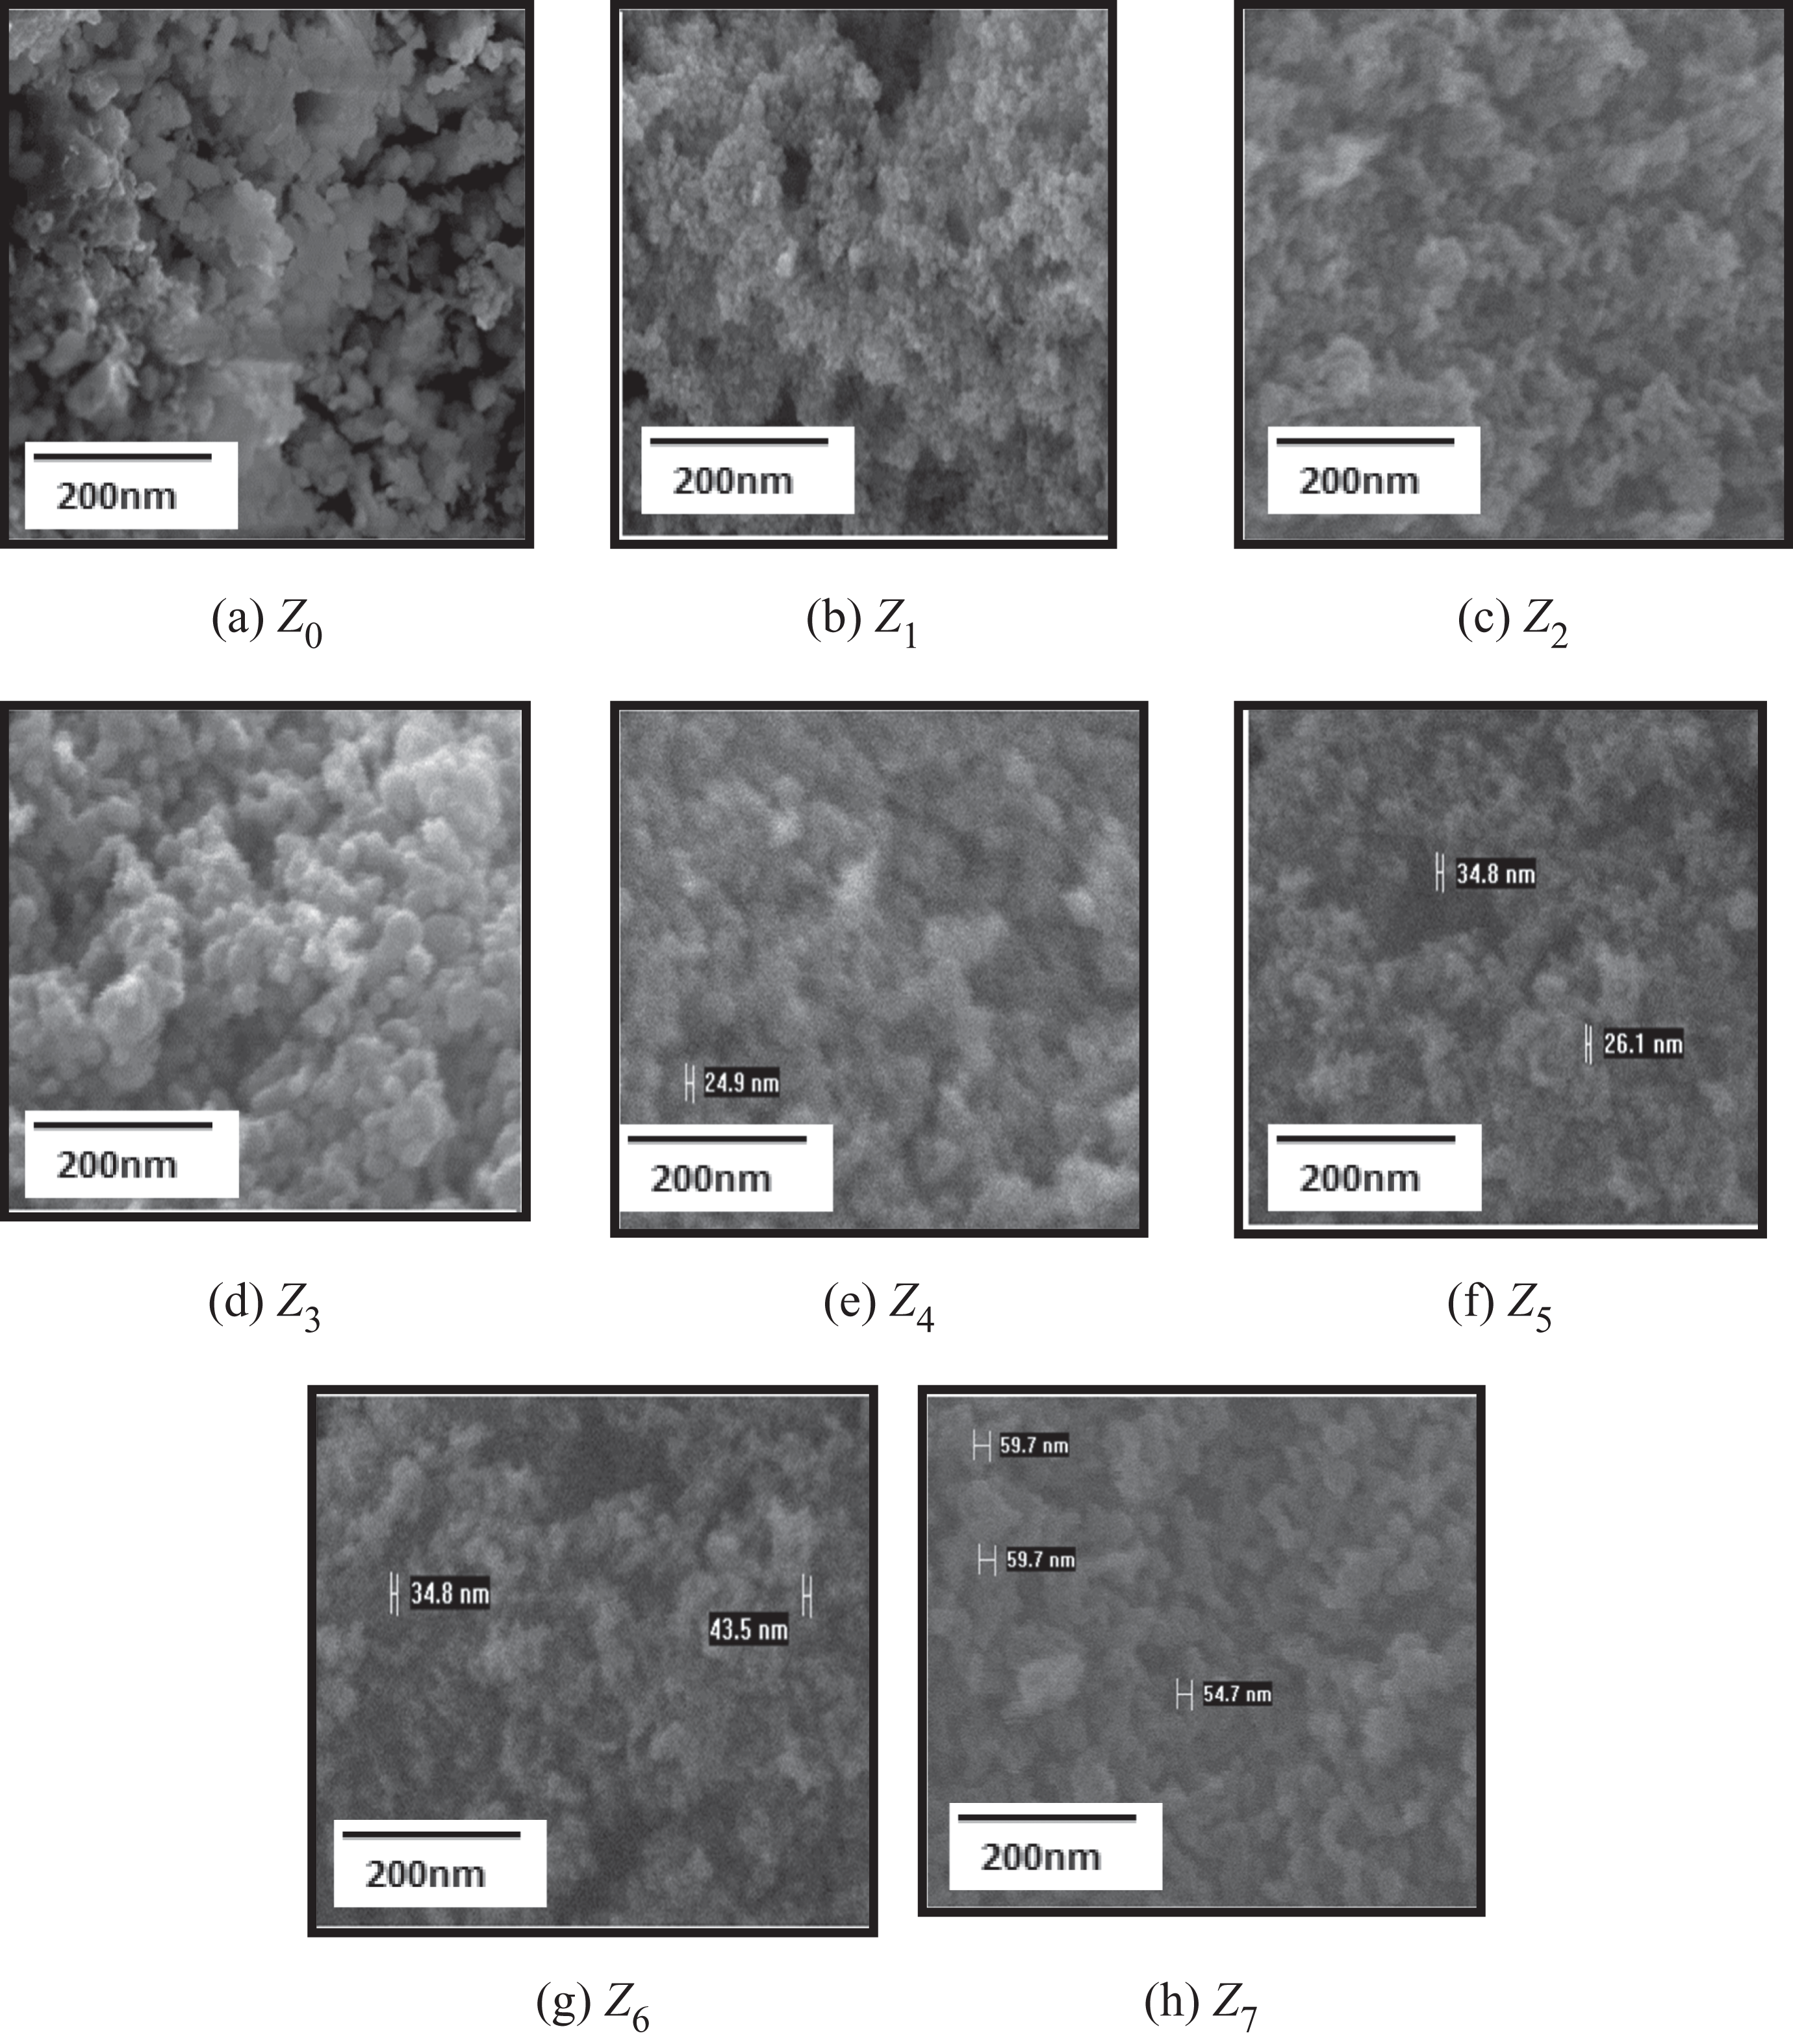
SEM micrographs of ZnO nanoparticles prepared at different temperatures. (a) Precursor, (b) calcinated at 200°C, (c) 250°C, (d) 300°C, (e) 350°C, (f) 400°C, (g) 500°C, and (h) 600°C. SEM: scanning electron microscopy; ZnO: zinc oxide
The particle size of nano-ZnO samples estimated using scanning electron microscope.
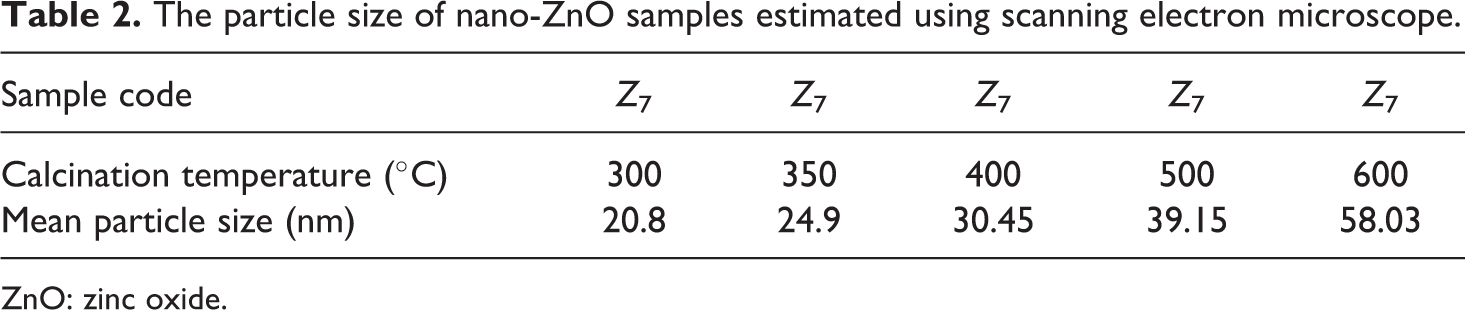
ZnO: zinc oxide.
Thermogravimetric analysis
Figure 6 illustrates the thermal stability of nano-ZnO samples obtained from TGA. TGA shows that the weight loss proceeds in successive stages with increasing temperature.
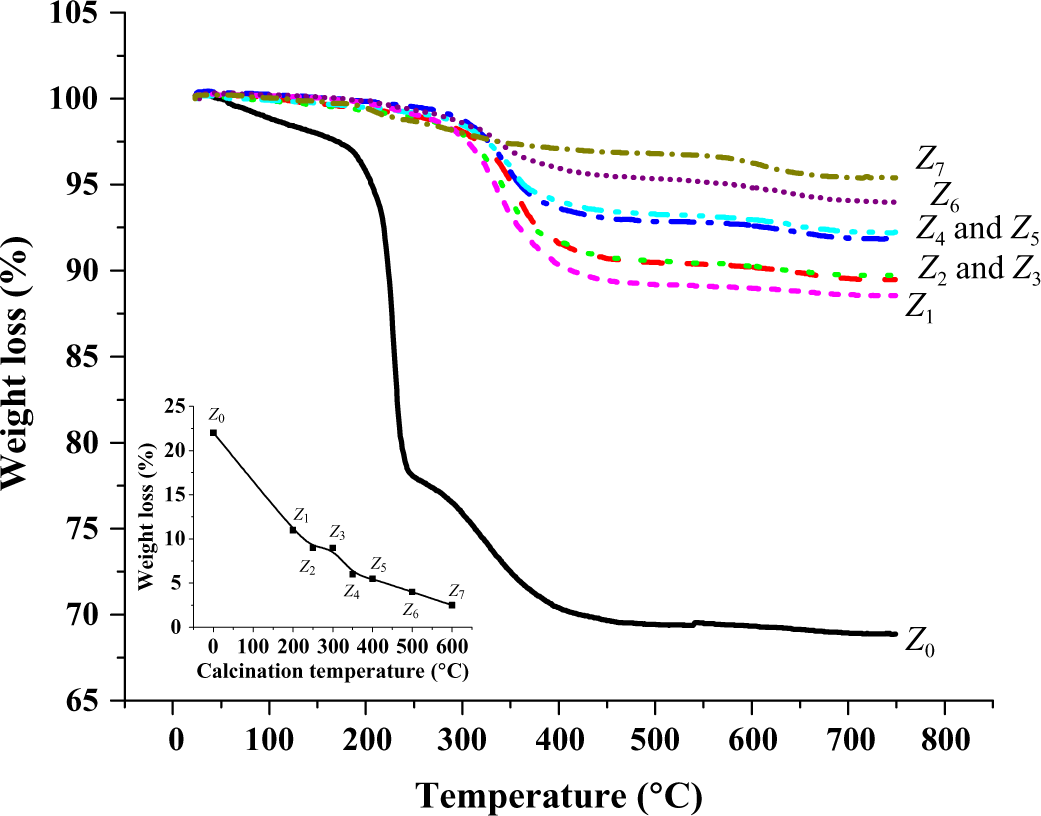
TGA patterns of ZnO nanoparticles calcinated at different temperatures. Insert: Weight loss for samples Z 0-Z 7. TGA: thermogravimetric analysis; ZnO: zinc oxide.
It can be seen that weight loss of precursor (Z 0) begins with a sharper slope compared to other nano-ZnO materials. A very steep weight loss was observed at approximately 170°C followed by another loss at about 250°C due to the presence of more than one component in the precursor complex. 29 On the other hand, ZnO nanoparticles start degradaing at temperatures greater than 350°C, 33 indicating the higher thermal stability of nano-ZnO (Z 1-Z 7) than the precursor. It is clearly shown from Figure 6 (inset) that the weight loss is inversely proportional to the calcinations temperatures confirming that the thermal stability of nano-ZnO increase with increase in calcinations temperatures. The high thermal stability of the ZnO nanoparticles indicates its suitability for usage in polymer nanocomposites, where the processing temperature is normally above the glass transition temperature (T g) of the polymer and below its melting temperature (T m).
Ultrasonic measurements
In general, the ultrasonic velocity depends on the intermolecular spacing and the geometry of the molecular structure. 35 Subsequently, we discuss in detail the usage of ultrasonic parameters in assessing the structure/property relationship of ZnO nanoparticles. The density (ρ) of ZnO was measured as ρ = M/V, where M is the weight of ZnO after dissolution in V (10 ml HCl). Also the molar volume (M v) of ZnO was calculated as shown in Table 3, where M v = M w/ρ, where M w is the molecular weight of ZnO.
Density and molecular volume of nano-ZnO samples (Z 0-Z 7).
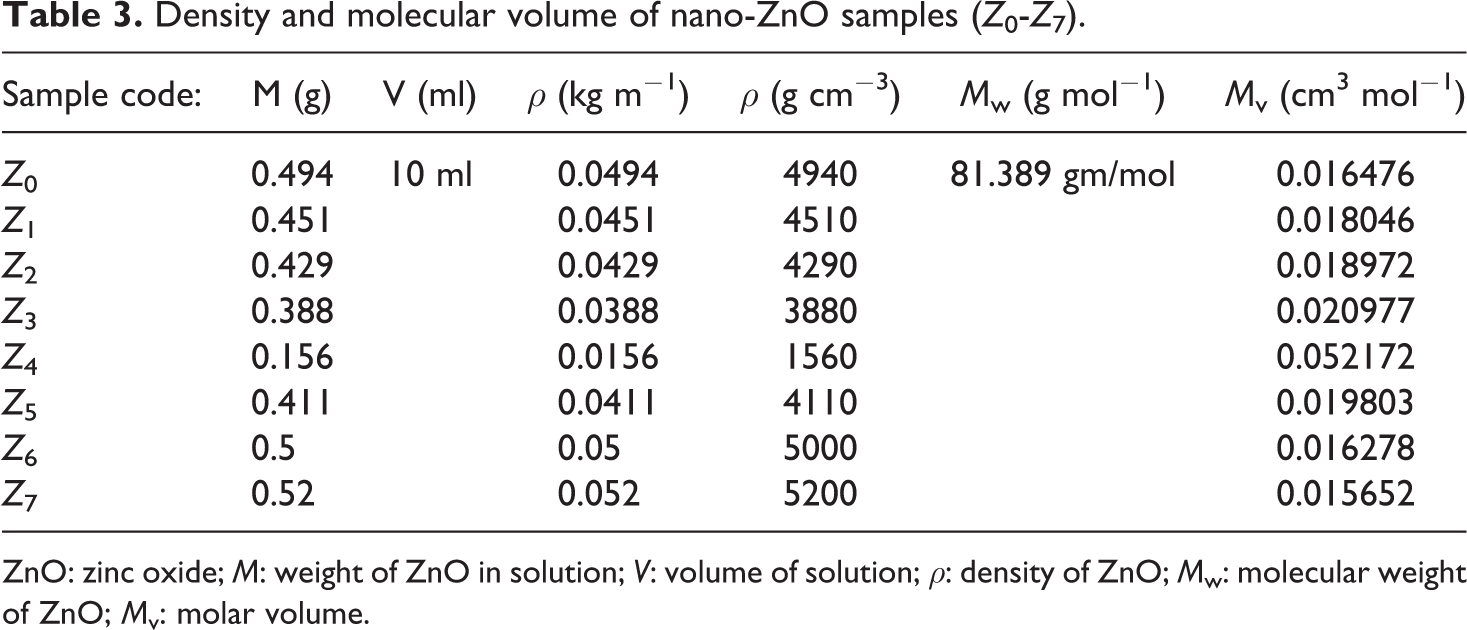
ZnO: zinc oxide; M: weight of ZnO in solution; V: volume of solution; ρ: density of ZnO; M w: molecular weight of ZnO; M v: molar volume.
Samples from Z 0 to Z 3 showed gradual decrease in density results, while it drops at Z 4. This behavior was suggested to be due to the increase in particle size and this confirmed by the molecular volume results. After that, the gradual increase in density values for samples Z5-Z7 was suggested due to the agglomeration of particles in to clusters causing a decrease in M v, which means nonuniform arrangement of ZnO particles and increase in the voids in the solutions. This is clearly shown in Figure 7.
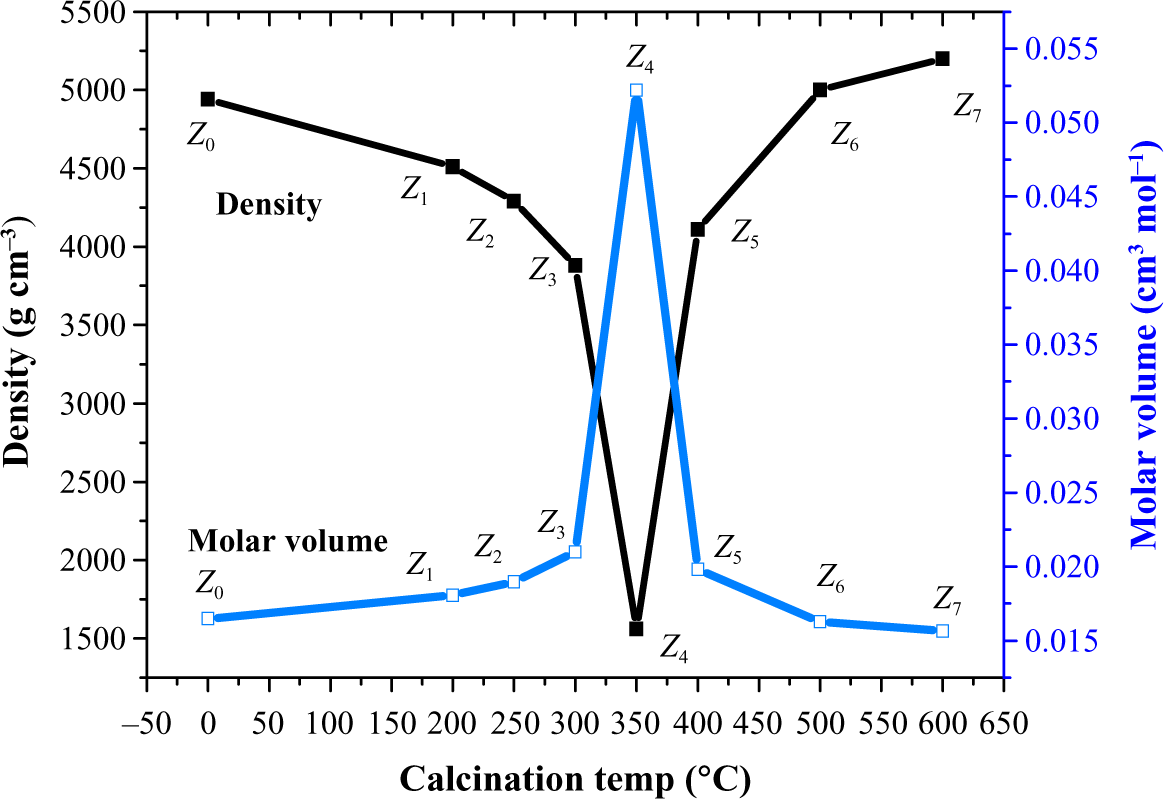
Density and molar volume of nano-ZnO (Z 0-Z 7). ZnO: zinc oxide.
V L value of ultrasonic waves was measured and reported in Figure 8. It also illustrates an increase from samples Z 0 to Z 4, which then showed decrease from Z 5 to Z 7. This behavior is expected due to the increase in particle size which means the decrease in intermolecular distances. As the particle size increase from Z 5 to Z 7, V L decreases due to the agglomeration of particles which means the increase in intermolecular distance. 35 This behavior confirms the results obtained from XRD, TEM, and SEM analyses.
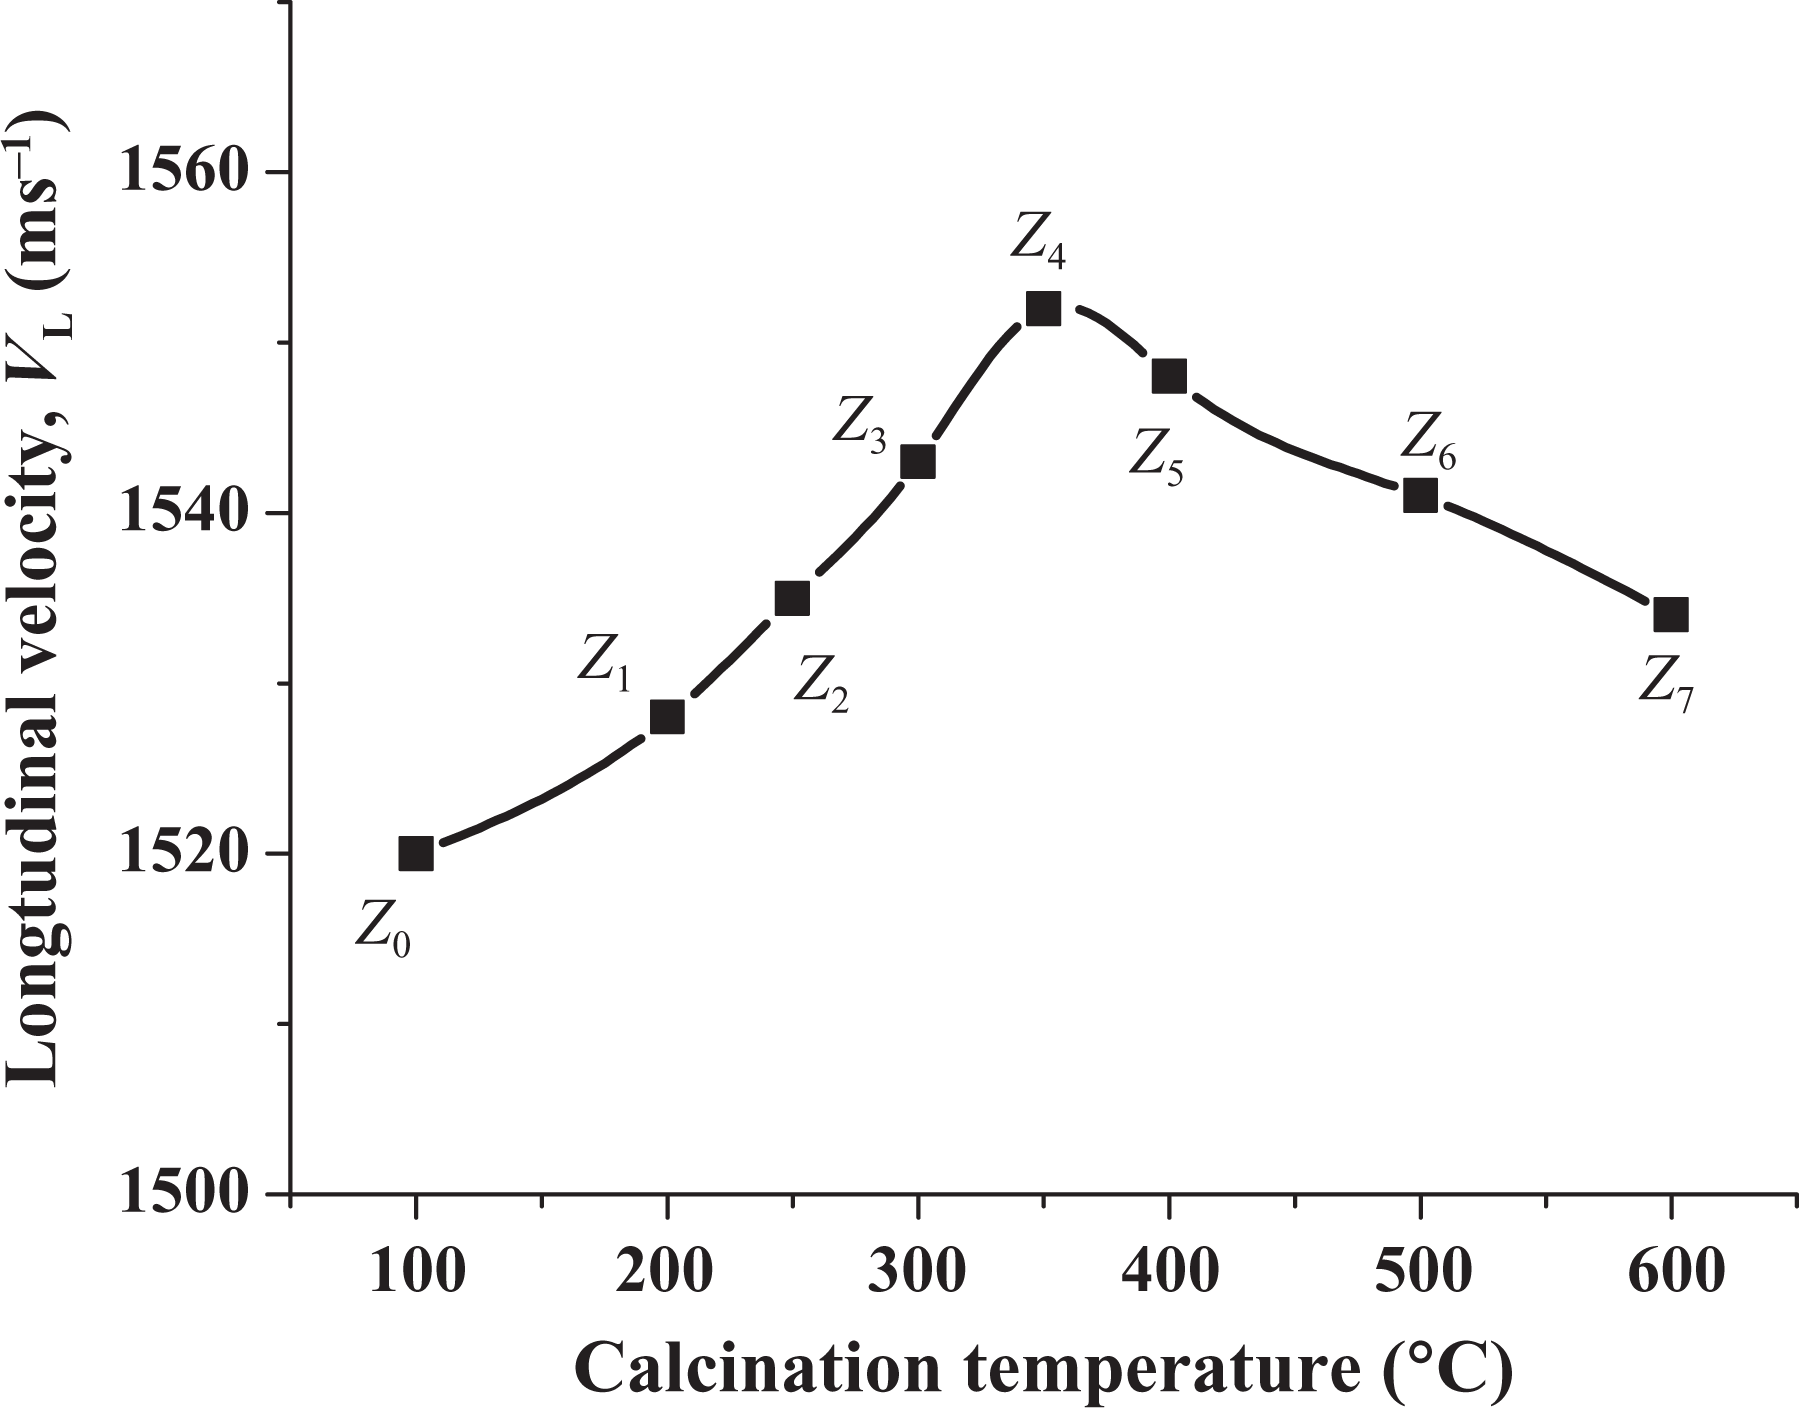
Ultrasonic velocity measurements of nano-ZnO of samples (Z 0-Z 7). ZnO: zinc oxide.
Conclusions
ZnO nanoparticles were chemically prepared in large quantities suitable for use in semiindustrial and industrial processes. Nano-ZnO was obtained with high purity and characterized thermally, spectrally, and electronically for the first time using ultrasonic measurements. We are able to control the particle size of the synthesized ZnO in the nanometer range. This would dictate the possibility of its usage for different applications depending on the required particle size of ZnO as well as chemical and physical properties of the end product. Due to the versatility of properties of ZnO nanoparticles, it has found its way in several composite applications. Some of these applications include improving the dielectric relaxation behavior and thermal stability of polycarbonate, 36 improving mechanical and antibacterial properties of ultrahigh-molecular weight PEe 37 and poly amide 38 and enhancement of thermal stability and degradation kinetics of poly(vinyl alcohol). 39 The use of ZnO nanoparticlese for UV absorption in polymer nanocomposites in food packaging industries and smart building materials are also discussed in another study. 32
Footnotes
Acknowledgement
Special thanks to the Polymer Metrology and Technology Laboratory in the National Institute of Standards (NIS) for continuous support and patience during the course of this work.
Funding
Author EM would like to thank the Academy of Scientific Research and Technology (ASRT) for funding this research.