
Abstract
Optical and electrical properties of conductive polymer composites made of polystyrene (PS) containing ultrafine iron particles of size 2 μm were studied under different measuring conditions: iron filler concentrations (0, 5, 10, 20, and 30 wt.%), ultraviolet radiation wavelength, temperature range (30–90°C), and applied frequency range (50 kHz–1.5 MHz). The absorption spectra from the composites were measured using a spectrophotometer. The analysis of the optical results showed that the electronic transitions are direct in the k-space. The optical energy gap and the energy tails were determined as a function of iron particles’ content. It was found that optical energy gap decreased and energy tails increased with iron content. The determined refractive index (n) and the extinction coefficient (k) increased with iron concentration. The alternating current (AC) conductivity and dielectric properties were determined using impedance measurements. The collected impedance data were analyzed and showed that the dielectric constant (ε′) and dielectric loss (ε″) of the composites are increasing as iron concentration increases and decreasing as the applied frequency increases. It was found that the AC conductivity increases with increasing frequency, temperature, and iron concentration. Some theoretical and empirical models are used to describe the observed optical and electrical behavior of the prepared PS composites.
Introduction
Addition of conducting particulate fillers to polymeric materials has been of great interest in recent times. The conducting polymer composites comprise an important group of engineering materials, with a great number of industry and electronic applications, such as discharging static electricity, heat conduction, electromagnetic shielding, gas storage, electrical heating, and converting mechanical signals to electrical signals, and they are also used in the production of many optical devices such as waveguides, sensors, and electronic components. 1 –9
The electrical conductivity of polymers can be increased by adding conducting particles, as carbon and iron, maintaining the physical properties desirable for many industrial applications. 7,10 Many reports appeared in literature dealing with optical and electrical properties of iron-filled polymer composite. For example, AL-Aqrabawi et al. 11 studied the absorption coefficient, optical energy gap, energy tails, refractive index, dielectric constants, and optical conductivity for polystyrene (PS) composites containing iron of different particle sizes. They found that the electron transition is direct in k-space and the optical energy gap values increase with increase in the size of iron particles. They analyzed the optical dispersion behavior of the composites using the single oscillator model. Psarras et al. 12 investigated the dependence of the alternating current (AC) conductivity and dielectric constant of iron particles dispersed in epoxy and found that conductivity increases with increasing temperature, but at low frequencies the AC conductivity tends to be constant. Zihlif et al. 13 reported the effect of iron concentrations of medium particle size (230 μm) on the AC electrical and optical properties of iron/PS composites. They reported that frequency, temperature, and iron concentration strongly affect the properties of composites. Costa et al. 14 reported that the large difference between conductivities of iron particles and PS promotes defect charges in the interfaces, which are loosely bound and are responsible for the electrical conductivity behavior at lower concentrations. Taşdemir and Gulsoy 15 reported that the physical properties are affected by adding the iron particles to the PS matrix. Recently, Elimat et al. 16 studied the effect of iron particle sizes on the thermal conductivity of PS composites and found large enhancement in the thermal conduction.
This article deals with the physical properties of PS composites containing different concentrations of ultrafine iron particles of size about 2 μm. The article also analyses the collected optical absorption spectra and determines the optical energy gap, energy tails, refractive index, and the extinction coefficient. The AC electrical properties like impedance, dielectric constant, dielectric loss, and AC conductivity in a frequency range of 50 kHz–1.5 MHz at different temperatures (30–90°C) were also studied.
Experimental work
Composites preparation
The studied composites are made of PS filled with ultrafine iron particles of sizes about 2 μm with different iron concentrations (0, 5, 10, 20, and 30 wt%). The iron particles were provided by MARBO S.P.A. (Milan, Italy). Iron particles were mixed with PS resin using a Brabender-like apparatus (Rheocord EC of Haake Inc., Hainesport, New Jersey, USA) at a temperature of 260°C, with a mixing time of 30 min and at a roller speed of 32 r/min. The composites coming from the mixer were compression molded in a heated press at a temperature of 260°C and a pressure of 100 bars to obtain sheets of 3 mm thickness. The composite categories contain different iron concentrations with fixed iron particle size of about 2 μm.
Optical measurements
The prepared composites were subjected to ultraviolet (UV) radiation by means of a Cary spectrophotometer. The optical absorbance and transmittance spectra of the composites were collected at room temperature in the wavelength range of 300–800 nm. In the absorption process, a photon of known energy excites an electron from a lower energy state to a higher one. The fundamental absorption manifests itself by a rapid increase in absorption, known as the absorption edge. This can be used to determine the optical energy gap and may be best explained based on band-to-band or band-to-exciting transition. Absorption is expressed in terms of the absorption coefficient defined as the relative rate of decrease in light intensity. Only the PS and 5 wt% composite showed absorption edges, while the rest of the composite showed total absorption.
AC electrical measurements
The AC electrical measurements were performed in frequency range from 50 kHz to 1.5 MHz. The AC measurements were carried out using a low-frequency (LF) impedance analyzer (model 4192) manufactured by HP (Hewlett-Packard), Tokyo, Japan. The used impedance analyzer is a fully automatic, high-performance test instrument designed to measure a wide range of impedance-related parameters, such as phase angle, real and imaginary impedance components, admittance, conductance, and capacitance. The LF impedance analyzer gives values of impedance and phase angle of the test specimen by varying the applied field frequency. Impedance measurements were performed at the frequency range of 50 kHz–1.5 MHz and temperature range of 30–90°C.
Scanning electron microscopy (SEM)
SEM images were taken using an InspectTM F50/FEG (FEI Company, Eindhoven, the Netherlands). Chamber vacuum (high) < 6e−4 Pa with high-resolution Schottky field emission up to ×1,000,000 magnifications with an accelerating voltage of 200 V to 30 kV. For cross-section analysis, the composite samples were frozen and fractured in liquid nitrogen. All samples were coated with platinum using sputter coater (Emitech K550 X, Quorum Technologies Ltd., Ashford, England) before analysis. Extensive interfacial adhesion can be observed using SEM analysis. Figure 1(a) shows a picture of aggregates or clusters each containing a number of pure iron particles of size less than 2 μm spread on a glass slide. The ultrafine iron particles are gathered as agglomerates since iron metal has a magnetic property. Figure 1(b) and (c) shows SEM micrograph for 5 and 30 wt% iron composites, respectively. The SEM exhibits good adhesion between the iron filler and the PS matrix, where no holes or voids are seen around the iron particle aggregates.
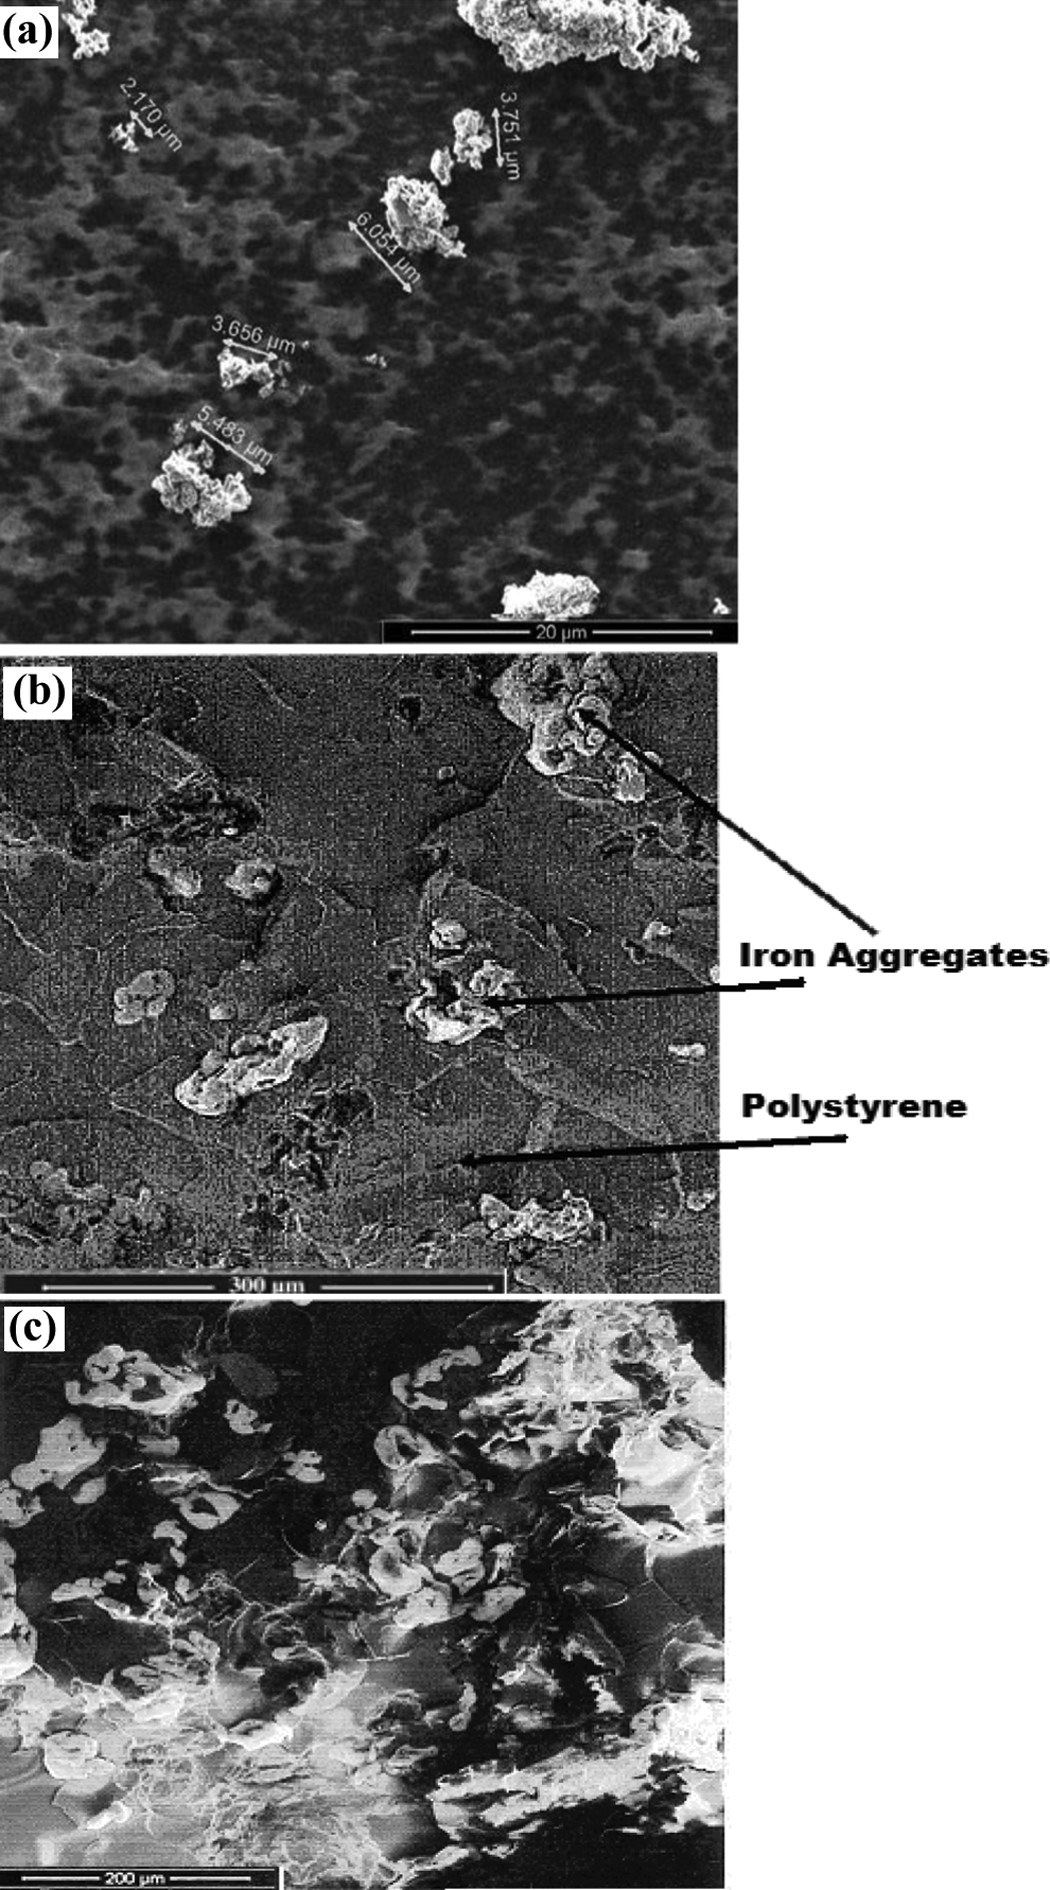
(a) SEM micrograph of the used iron of average particle size of 2 μm. (b) SEM for 5 wt% iron/PS composite showing iron particle clusters. (c) SEM for 30 wt% iron/PS composite showing iron particle clusters. SEM: scanning electron microscopy; PS: polystyrene.
Results and discussion
Optical results
When solids absorb an amount of light, optical transitions occur if the energy of photons absorbed is higher than or equal to the forbidden energy gap. If the required energy is almost equal to the difference between the lowest level of the conduction band and the highest level of the valence band, electrons will transfer from the valence band to the conduction band. The absorption coefficient α(ω) was calculated from the optical absorbance A(ω). After correction for reflection, α(ω) can be calculated using the formula:

Hence,

where I
0 and I are the incident and the transmitted intensities, respectively, and x is the sample thickness. At high absorption levels, where α(ω) > > 104 cm−1, the absorption coefficient α(ω) for noncrystalline materials can be related to the energy (ℏω) of the incident photon according to the formula:

where β is a constant, E opt is the optical energy gap, and the exponent r is an index determined by the type of electronic transition causing the optical absorption and can take the values of 1/2, 1, 2, 3, and 3/2. For allowed indirect transition, the exponent takes the values of 1, 2, and 3. 17 –22
Figure 2 shows the dependence of the absorption spectra of the 5 wt% iron composite and neat PS. It is shown that the absorption spectra decrease rapidly with increase in the incident photon wavelength of up to 400 nm and then fall exponentially up to 800 nm. The appearance of the exponential band around the 380 nm wavelength is due to the lack of long-range order in these samples. 11
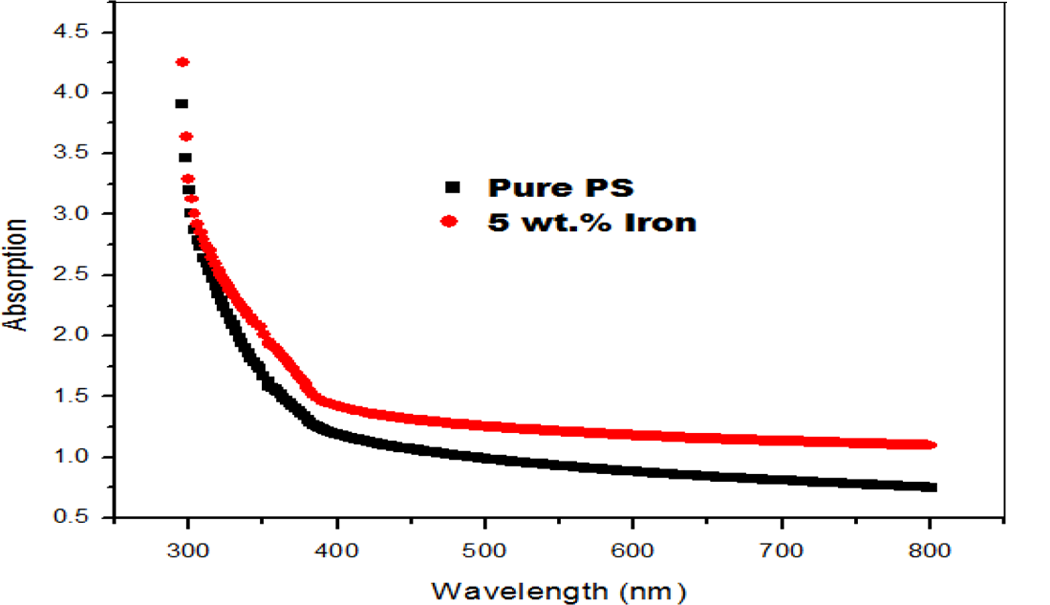
The dependence of the absorption spectra of the 5 wt% iron composite and neat polystyrene.
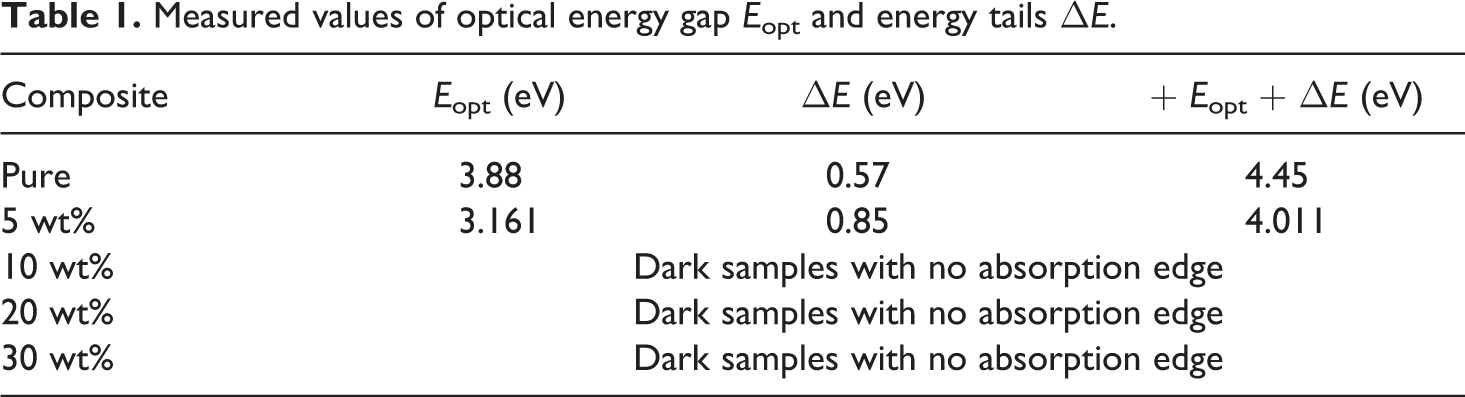
The optical energy gap (E opt) generally represents the energy difference between the localized states in valence band and the extended states in conduction band. On this basis, the energy E opt can be taken to represent the mobility gap. The optical band gaps were evaluated using (αħω) 2 versus ħω plots. The best fitting to the absorption spectra in Equation (3) gives r = 1/2, meaning the electron allowed direct transition for these composite samples in k-space. The allowed direct transition energies were determined by extrapolating the linear portion of Figure 3 curves to zero absorption. Table 1 includes determined values of optical energy gap E opt for the composites, which decrease with increasing iron concentration. The decrease in the optical energy gap due to dispersed iron particles may be explained on the basis of the fact that incorporation of small amounts of conducting fillers forms charge transfer paths in the host matrix. 19
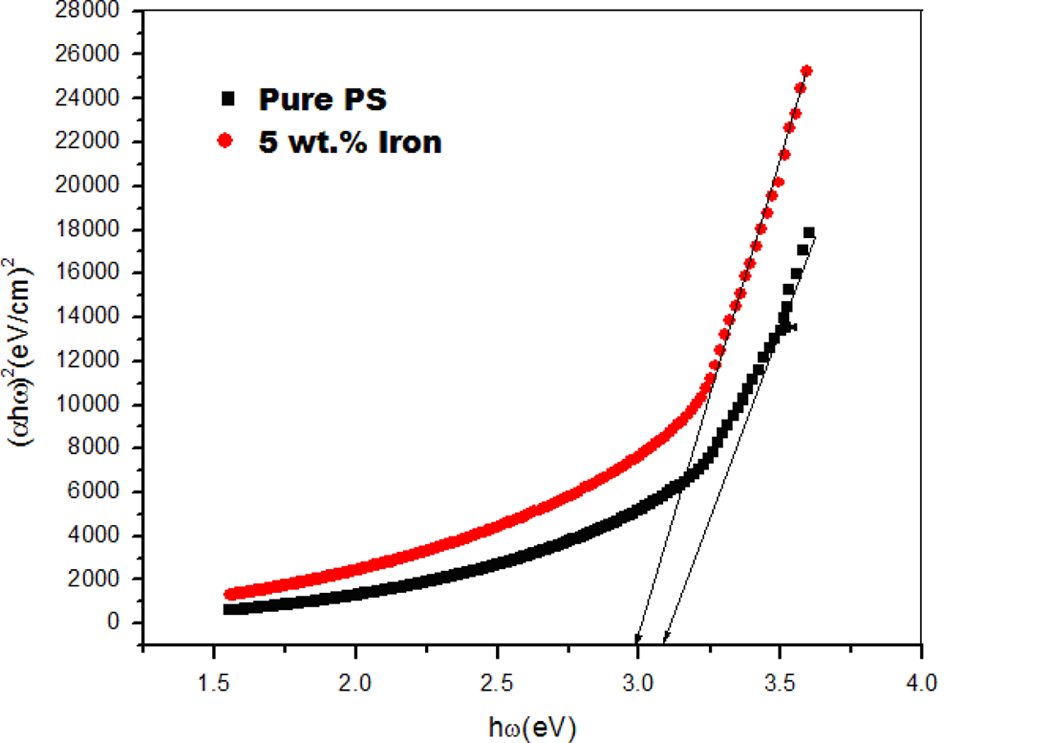
The dependence of (αħω) 2 versus ħω plots.
Measured values of optical energy gap E opt and energy tails ▵E.
The absorption coefficient α(ω) is described by the Urbach formula
20
:
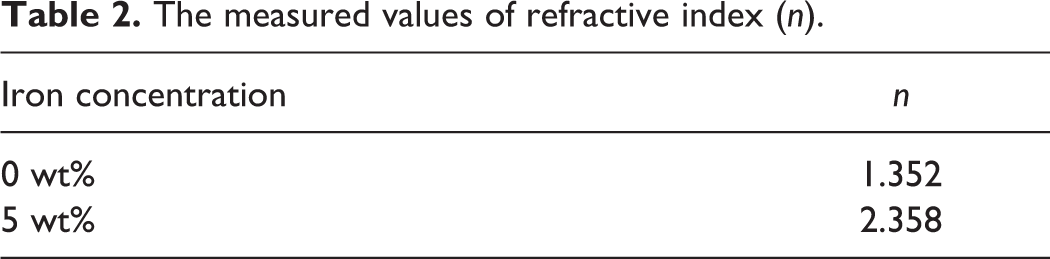
where α o is a constant and ▵E is the energy gap tail (the energy which is interpreted as the tail width of localized state of the forbidden band gap). 22 The Urbach formula in Equation (4) was used to calculate the width of the Urbach tail of the localized states due to the defect levels in the transition gap. 20 As mentioned before, only the PS and 5 wt% composite samples showed absorption edges, so the optical constants were calculated for those two samples as shown in Tables 1 and 2. The linear dependence of ln(α) versus photon energy ℏω is presented in Figure 4. The reciprocal of the slopes of the curves yields the magnitude of width of the band tail ▵E. Table 1 summarizes the obtained optical data. The reduction in the width of the Urbach tail due to filler may be due to the incorporation of conducting filler into the polymer chain and, thereby, extending the density of states more into the visible region of the electromagnetic spectrum as compared with that of the PS case. 21 From the table, it is clear that the band tail, direct band gap, values showed a decrease with iron particles concentration. The change in band gap could be due to structural changes introduced by dispersing ultrafine iron particles in the PS matrix. 19 The increments in energy tail width ▵E can be explained by the fact that the increase in iron particles’ content could lead to the creation of space charges, disorder, and imperfections in the composites structure, a case that may increase the localized states within the forbidden gap. The PS energy tails have the smallest values due to the neatness of its amorphous structure and scant impurities, leading to a decrease in the localized states within the forbidden band gap and increasing the values of the optical energy gap.
The measured values of refractive index (n).
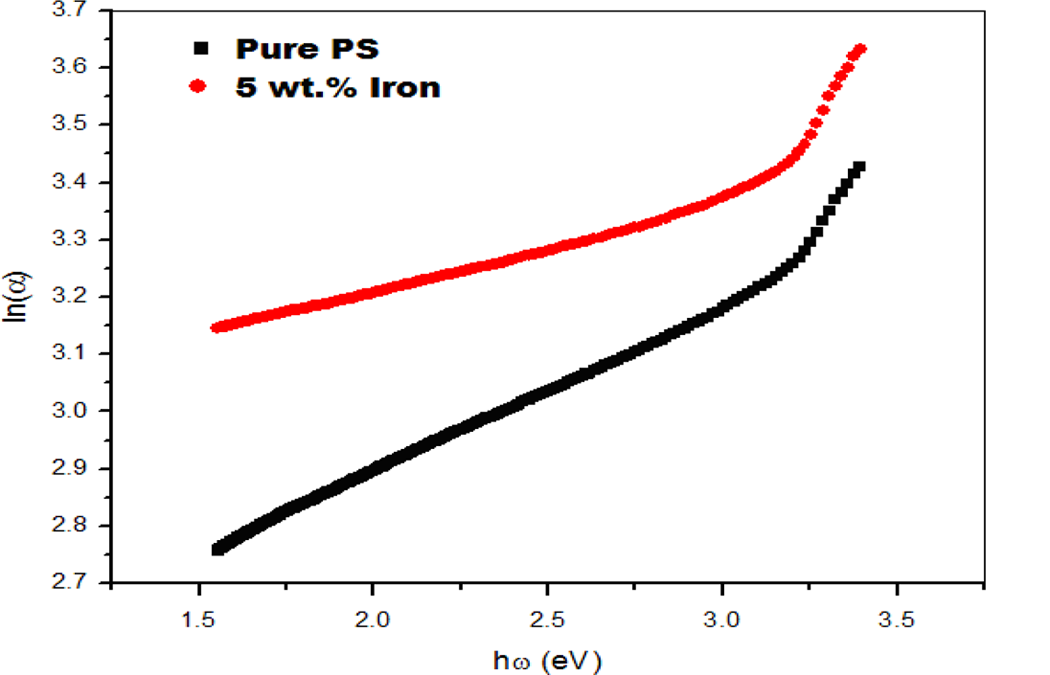
The linear dependence ln(α) versus photon energy ħω.
The reflectance (R) was determined from the absorption and transmittance spectra data. Figure 5 shows the variation in refractive index (n) for iron/PS composites with the UV wavelength. It shows that the refractive index decreases rapidly at lower wavelengths. The refractive index (n) values of the samples were obtained from the following equation
22
: The variation in refractive index (n) for iron/PS composites with the UV wavelength. UV: ultraviolet.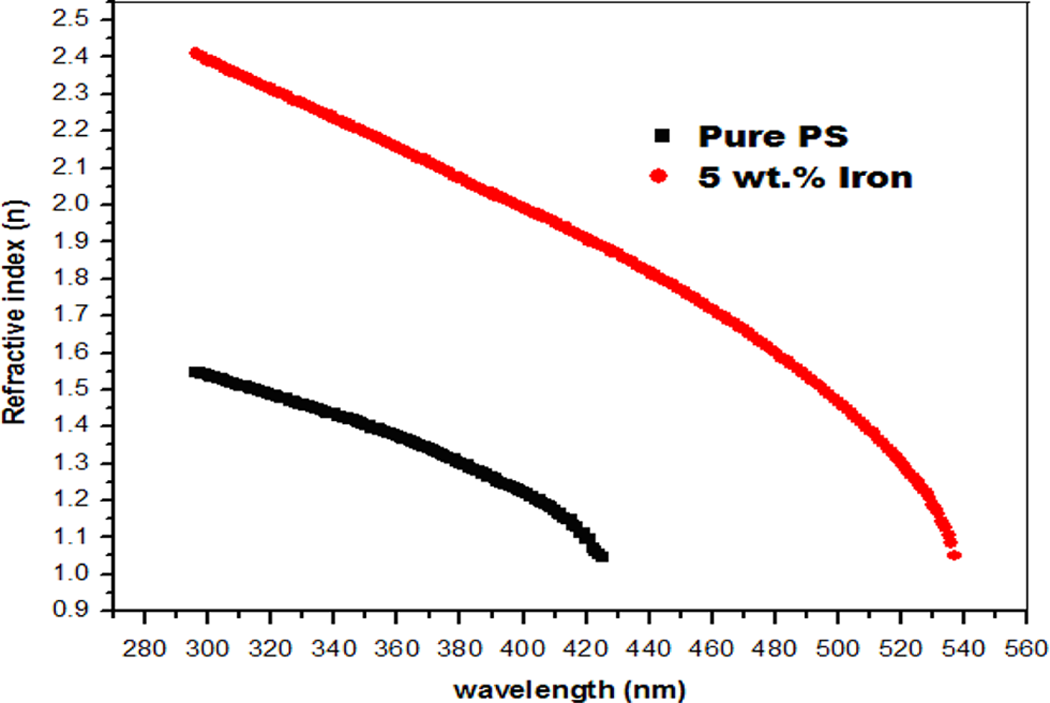
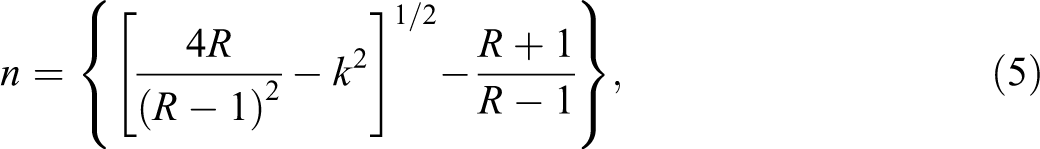
where R) is the reflectance, k is the extinction coefficient that is related to the absorption coefficient and wavelength by:
The variation in extinction coefficient (k) for iron/PS with UV wavelength is shown in Figure 6. It shows that the extinction coefficient (k) increases with increase in wavelength. The observed changes in the optical properties are attributed to the increasing conductive behavior of the prepared composites, as shown from the electrical results.
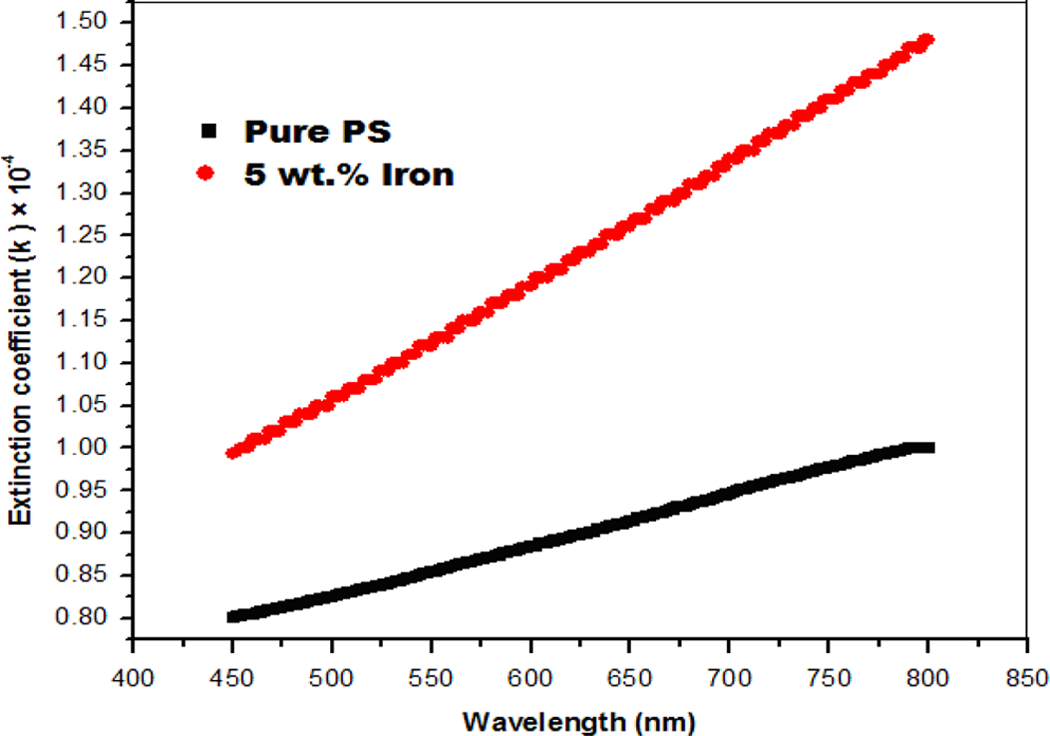
The variation in the extinction coefficient (k) for the iron/PS with UV wavelength. PS: polystyrene; UV: ultraviolet.
AC electrical results
Impedance data were collected for all prepared composites at different measuring conditions as applied frequency, temperature, and iron filler concentration. The AC electrical quantities were determined from the measured impedance values. Figure 7 represents the dependence of dielectric constant (ε′) calculated from impedance data as described in our published reports 23,24 on frequency for the PS/iron composites at T = 30°C. The dielectric constant (ε′) values decrease with increase in the frequency of the applied field. This decrease can be explained by the fact that as there is an increase in frequency, the polymer dipoles have less time to orient themselves in the alternating field. The high values of the dielectric constant at low frequencies can be attributed to interfacial polarization referred to Maxwell–Wagner–Sillars space charge effect. 25,26
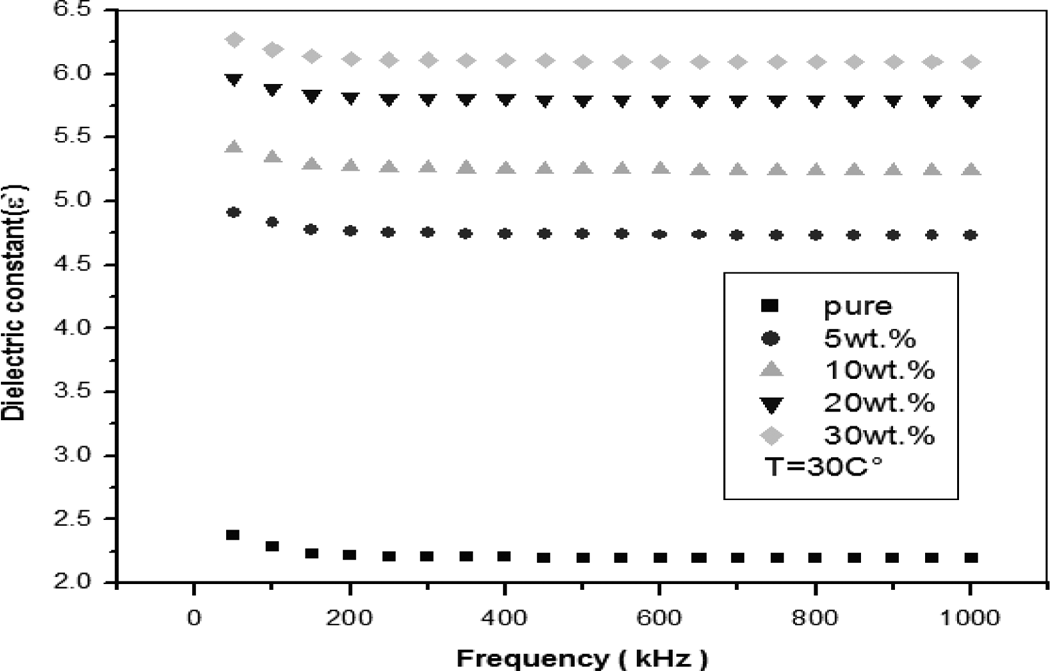
The dependence of dielectric constant (ε′) on frequency for the PS/iron composites.
Figure 8 shows temperature dependence of the measured dielectric constant ε′ of the 30 wt% iron composite where the dielectric constant increases as the temperature is increased. This increase is due to a greater movement freedom of the polymer dipole molecules and chains at high temperatures. At lower temperatures, as the dipoles become rigidly fixed in the dielectric, the field cannot change the coordination of dipoles. As the temperature increases, the dipoles comparatively become free and respond quicker to the applied electric field. Thus, polarization/orientation increases and hence the dielectric constant is also increased with increase in temperature.
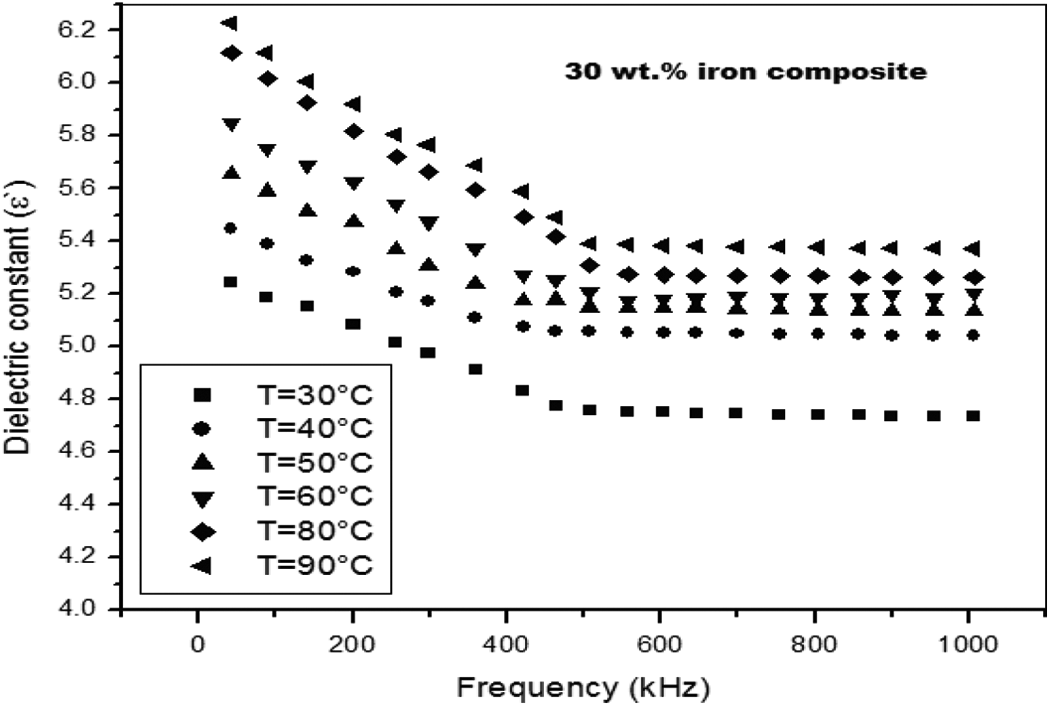
Dependence of temperature on the measured dielectric constant.
Figure 9 shows a comparative behavior of the AC conductivity (σ AC) for the iron/PS composite at different frequencies, where σ AC at 1000 kHz is higher. It can be seen that the AC conductivity increases as the frequency increases. This phenomenon could be attributed to resistive conduction through the bulk composite including tunneling between conducting iron particles. 27 But it rapidly increases at high frequencies, this rapid increase in σ AC at high frequencies is expected since at higher applied field more electrons can move; resulting in the enhancement of the electrical conduction process. The observed AC conductivity (σ AC) at high frequencies locates the prepared composite in the semiconducting level of the electronic materials. 28
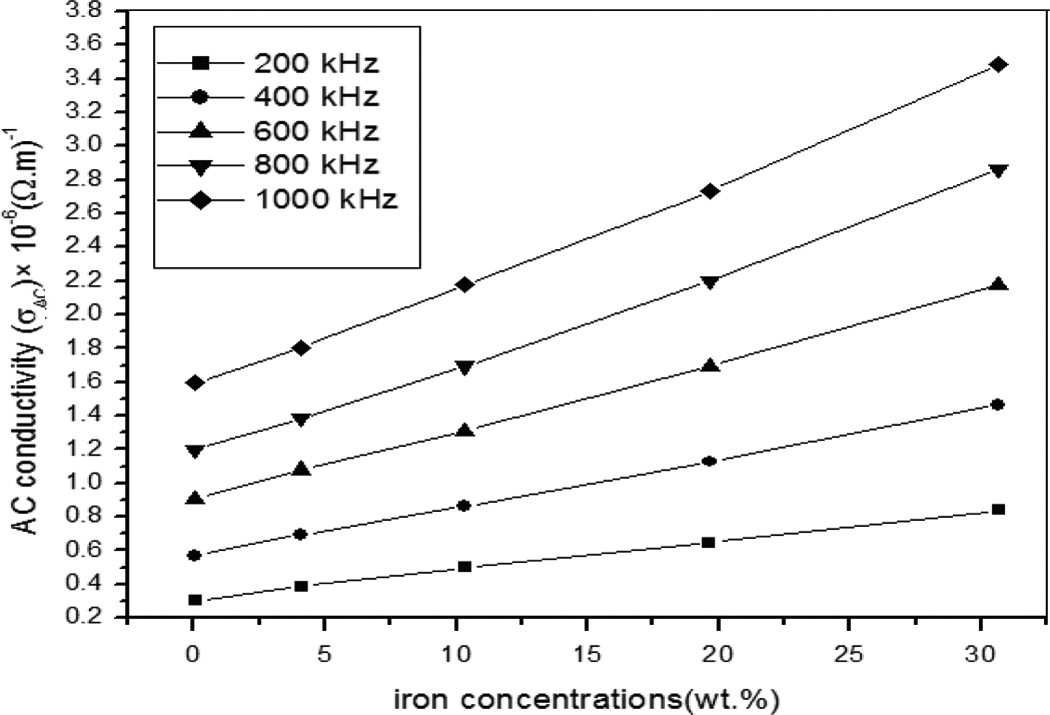
The AC conductivity (σ AC) for the iron/PS composite at different frequencies. AC: alternating current; PS: polystyrene.
When the iron concentration is high enough, a continuous conducting particle network is formed in the solid polymer matrix. It is known that the electrical conductance depends on the distance between neighboring conducting particles. Thus, the highly filled composites can be regarded as a system composed of random arrays of closely spaced conductors, dispersed in an insulating polymeric matrix. The density of contacts of the conducting particles may be varied according to the dispersion mode of conducting particles and the morphology of the polymer matrix. 26,27 Figure 10 shows the temperature effect on the measured the AC conductivity (σ AC) of the 30 wt% iron composite. We note that the AC conductivity values increase as the temperature increases for all frequencies, which is similar to ionic and semiconducting materials. When temperature increases, a band of energy levels can be formed close to the valence or conduction band called localized energy states. 1 The enhancement in α AC is attributed to the generation of contacts and paths for iron particles, which facilitate the electronic charge transport, and to the electron hoping mechanism takes place between the valence and conduction energy bands of the composites. 12,26,29
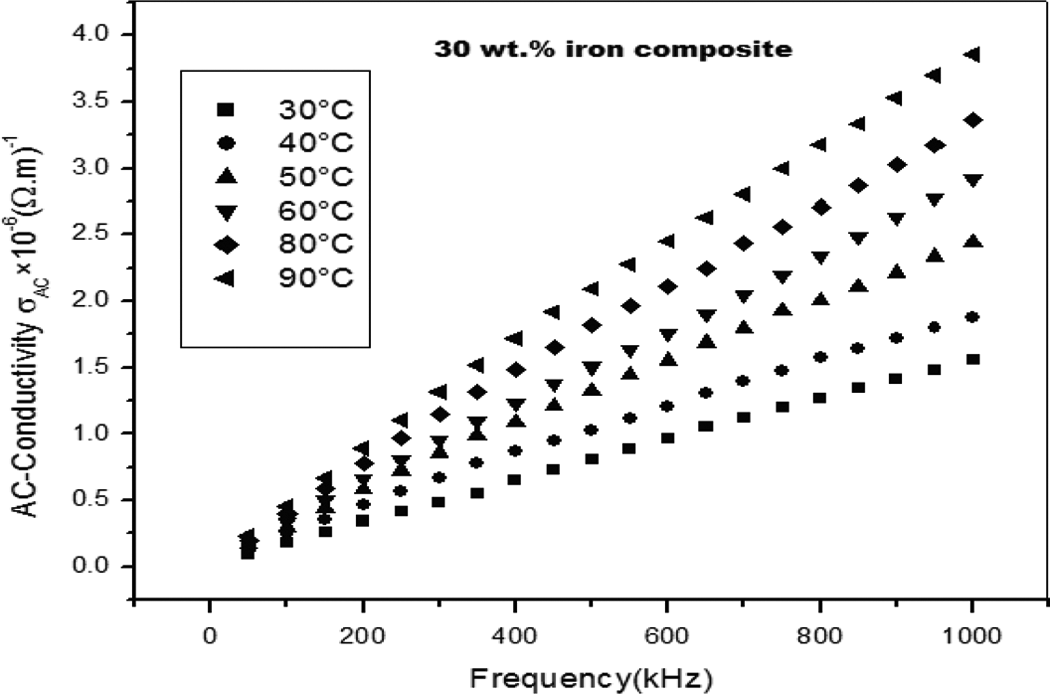
Dependence of temperature on the measured AC conductivity. AC: alternating current.
The activation energy (E
a) is defined as the minimum energy required to start a chemical reaction of the electrical conduction process and can be calculated by Arrhenius equation: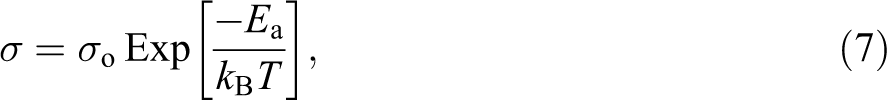
where σ is the conductivity, σ 0 is the material constant conductivity, T is the temperature of material in K, and k B is the Boltzman constant. Values of activation energy (E a) of the composites were obtained by plotting the natural logarithm of the AC conductivity versus 1000/T at different frequencies. Activation energy values were determined from the slopes of the approximated straight lines.
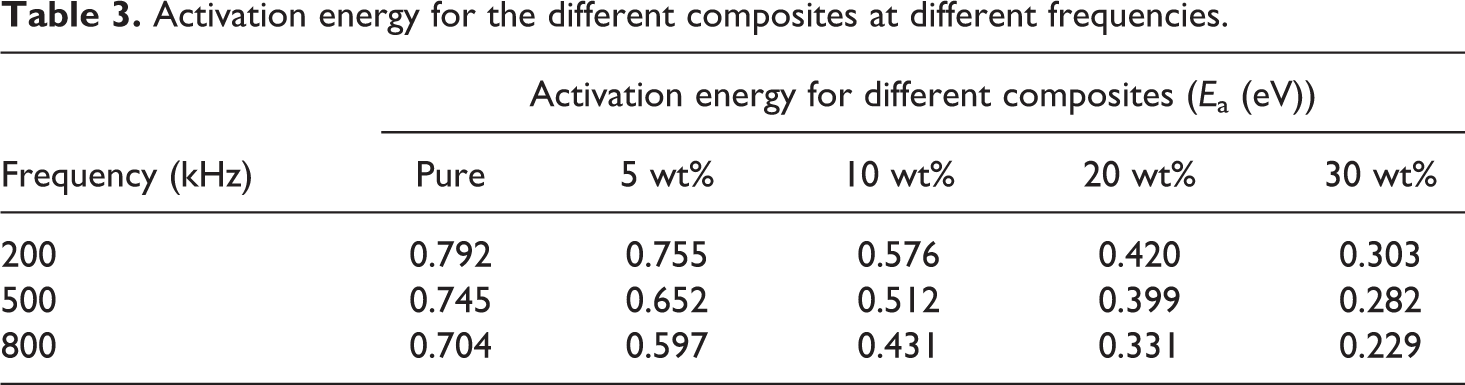
Figure 11 shows the logarithm of the AC conductivity versus 1000/T at different frequencies for 30 wt% composite using Arrhenius equation, the values of activation energy (E a) are included in Table 3 at different frequencies and shown in Figure 12 for all composites. Figure 12 shows that the decrease in activation energy by increasing the iron content in the PS matrix, which means that the prepared composites have better electrical conduction. Thus, it is expected that at high content of ultrafine iron particle, the prepared composites behave electrically as semiconducting materials.
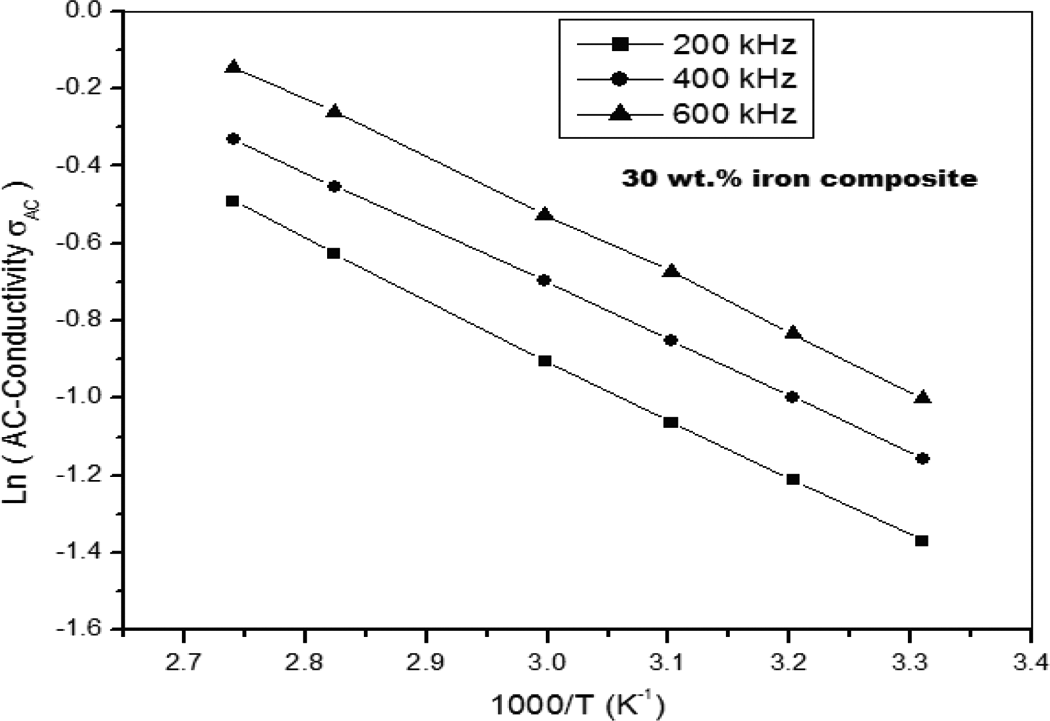
The logarithm of the AC conductivity versus 1000/T at different frequencies for 30 wt% composite. AC: alternating current.
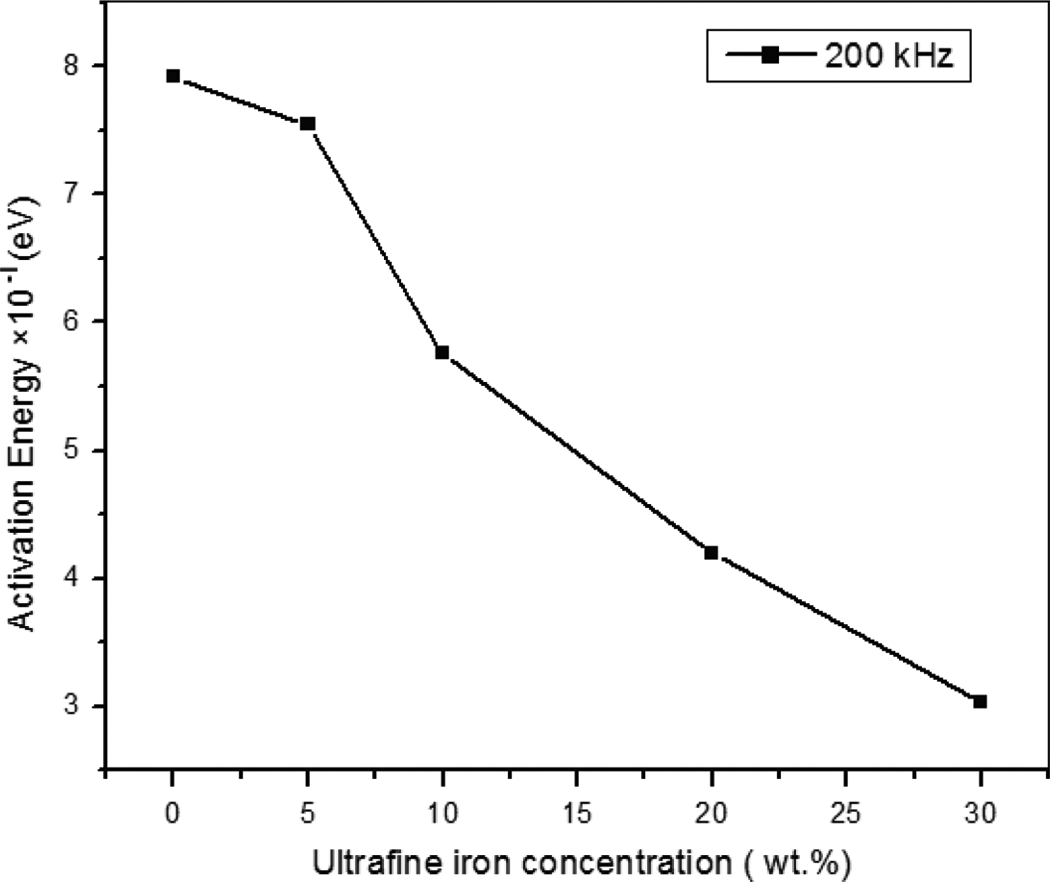
The dependence of activation energy on the iron content in the PS matrix. PS: polystyrene.
Activation energy for the different composites at different frequencies.
Conclusions
This research deals with the behavior of the optical and AC electrical properties of ultrafine iron particles dispersed in PS as a function of UV wavelength, iron concentration, temperature, and applied field frequency. Some conclusions can be drawn from the results obtained. The optical energy gap value decreases, while the band energy tails increase with increasing concentration of iron. The extinction coefficient increases with increase in the UV wavelength. The refractive index decreases with increase in the photon wavelength and increase in iron concentration. Impedance decreases with increasing temperature, frequency, and iron concentration. The dielectric constant and dielectric loss of the prepared composites increase with increase in iron concentration, temperature, and decrease with increase in the applied frequency. The AC electrical conductivity increases with increase in frequency, temperature, and iron concentration. The activation energy varied with variations in iron concentration, temperature, and frequency. The overall temperature dependence of the observed electrical conductivity of the composites is nearly similar to the semiconducting materials.
Footnotes
Declaration of Conflicting Interests
The author(s) declared no potential conflicts of interest with respect to the research, authorship, and/or publication of this article.
Funding
The author(s) received no financial support for the research, authorship, and/or publication of this article.