
Abstract
Long-fiber thermoplastic (LFT) composite materials are rapidly expanding in automotive, transportation, and recreational industry. Most of these materials are natural or black in color with a need for secondary painting of the manufactured products. Standard organic pigments and dyes are not stable above 250°C and degrade during processing. Alternatively, inorganic pigments are thermally stable to at least 800°C. High-performance inorganic pigments offer resistance to outdoor weathering, chemicals, and acids. However, in fiber-reinforced composites, the pigment causes fiber attrition and thereby shows reduction in strength. This work explores colored inorganic-pigmented LFT composites. The ability to integrate the color in the manufacturing steps eliminates the need for secondary painting. Pigment variables such as particle size, distribution, chemistry, and coatings have been investigated. The article presents the processing and performance envelopes of colored inorganic-pigmented LFTs in comparison with unpigmented standard LFTs.
Keywords
Introduction
The replacement of traditional materials with fiber-reinforced thermoplastics has been increasing exponentially in recent years due to reduced weight with superior mechanical and functional properties. Long-fiber thermoplastics (LFTs) are one of the fastest growing materials in the polymer composites industry. The global LFT usage is on the order of 300 MM lbs/year in a total glass-reinforced thermoplastic market of 1500 MM lbs/year. 1 In addition to automotive and mass transit applications, LFTs are starting to find applications in construction, consumer, industrial, and recreational applications. 2
The high-performance plastics market needs durable colored pigments which when added to glass-reinforced thermoplastic engineering resins do not reduce the properties of the final part. Most of the parts today are black or natural resin color, which limits their ability to displace traditional materials in structural applications and painting the part post manufacturing adds to the cost. Traditionally colors are imparted to plastics in the form of dyes and pigments. Organic dyes have good disperse ability in polymers but cannot withstand high processing temperatures (>250°C) of most of engineering thermoplastics. Complex inorganic color pigments (CICPs) that are predominantly oxides, chromates, and molybdates of transition metals have excellent heat stability, chemical inertness, weather ability, light fastness, infrared (IR) reflectance, and ultraviolet migration resistance. 3 –6 Due to their excellent durability in plastics, CICPs can be used for protection against heat build-up of roofs, fuel tanks and other structures exposed to solar radiations. 7 –10 CICPs impart color to plastics by absorbing the incident light as in organic dye stuff and also by change in orientation to give angle dependent color effects, decorative textures like illusion of optical depth, metallic and sparkle effect. 11 Recently, CICPs have been incorporated in plastics to impart functionality such as protective coatings, sensors, and actuators. 12 CICPs have also been used in conjugation with organic dyes to develop hybrid pigments which have added feature of enhanced dispersion in polymers along with their inherent rugged properties. 13,14
In general, CICPs can be tailored to impart color and added functionality to the thermoplastics. However, CICPs are not presently used for high-performance thermoplastic composite applications because they cause significant loss in key mechanical properties such as impact, tensile, and flexural strength. Being able to process homogenous-pigmented thermoplastic composites will open a wide range of products in construction, safety, sporting goods, appliances, furniture, industrial, transportation, and recreational applications. The challenge is to impart color without reducing material properties that may require either modification to the pigment or to the thermoplastic processing methodology. Pigment variables such as particle size, distribution, chemistry, and surface coatings are unknown as to their influence on the strength of the final part. Typically, it is the properties of the engineering resin that lead to its selection, so the influence of colorant on the physical and mechanical properties is of great importance. This study investigates the effect of pigment variables, pigment combination techniques, glass fibers (GFs)/polymer/pigment process combinations on the physical and mechanical performance of LFT materials under static and dynamic loading.
Materials and processing
Methods for introducing GF and pigment into the process
Colored compound was produced for each pigment in a Leistritz ZSE-27 (New Jersey, USA) modular/multimode twin-screw lab extruder by mixing pigment with polypropylene (PP) resin to achieve the required pigment concentration. The polypropylene resin used was Exxon Mobil Chemical PP1105E1 homopolymer with a melt flow rate of 35. The strands were chopped into 5 mm lengths. The resulting colored compound pellets were combined with the GF reinforcement to achieve a final part with 30% GF loading and either 0.5% or 5.0% pigment loadings by weight in three distinct processes described in detail below: (a) simple blended (SB), (b) wire coated second coat (WC), and (c) hot-melt impregnated (HM; Figure 1).
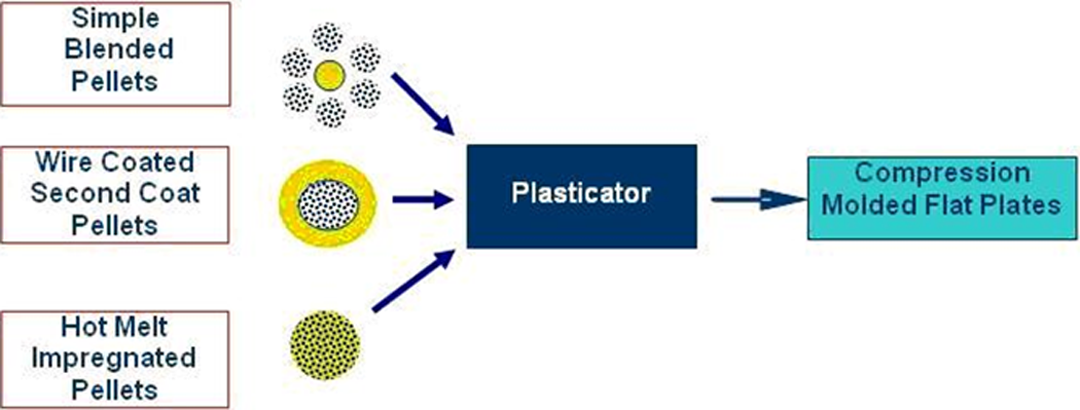
Processes for combining pigments with glass fiber in the polymer.
SB is a combination of colored compound and natural polymer fiber glass pellets; WC pellets have a coat of colored compound over a natural polymer fiber glass pellet; and HM pellets have colored compound impregnated and integral in the fiber glass pellet. Each variation was melted in a plasticator (a single screw 80 mm low shear extruder), compression molded into flat plates 254 × 254 × 4 mm3. The flat plates were cut into test samples for various tests using a water-cooled circular saw.
SB pellets
The GF-filled LFT pellets were formed on the tapeline by pultruding continuous GF tows through a heated die during which the individual filaments were wet out with neat PP and then chopped to 12.5 mm lengths. A PP-GF50 natural, a commercially available LFT product was used. Pigment-colored compound pellets of 8 lb of 1.25% (0.5% final pigment concentration target) or 12.5% (5.0% final pigment concentration target) described above were simply blended together with 12 lb of the 50% GF LFT pellets prior to being fed into the plasticator. Mixing was carried out manually prior to introduction into the plasticator.
WC pellets
The 12.5% (for a final pigment concentration of 5%) pigment-filled polymer or colored compound was melted and coated in a second coat around a glass tape already impregnated with the base natural (uncolored) polymer. The pellets were cut to length of 12.5 mm.
HM pellets
Continuous GF tows were pultruded through a heated die during which the individual filaments were wet out with 0.71 or 7.1% pigment-concentrated colored PP compound to achieve a target of 0.5 and 5.0%, respectively. The impregnated tows were cut into 12.5 mm pellets.
Extrusion–compression molding process
The production of LFT plates through extrusion–compression molding involves the following processing steps. LFT pellets are fed into a low shear plasticator where they are metered down a barrel, heated above the melting point of the polymer, and the polymer-rich fiber flows through the plasticator to form a molten charge (Figure 2). The molten charge is quickly transferred to a heated mold where it is compressed in a closed tool on a high-tonnage (400 metric tons) press. 1,2 The part is then removed after sufficient cooling, which typically takes 1–3 min.
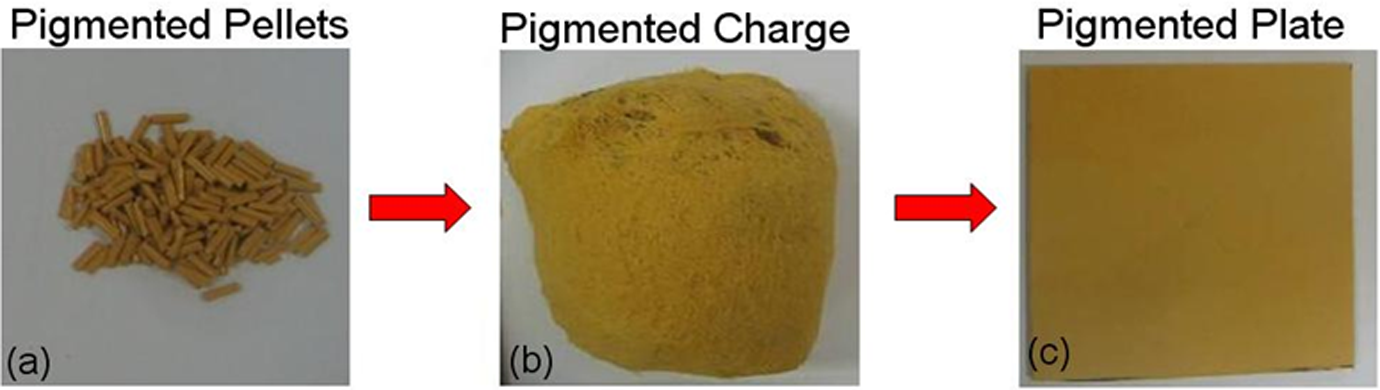
Material flow in extrusion–compression molding. (a) LFT pellets, (b) plasticized charge emerging from the plasticator, and (c) compression-molded charge forms LFT plate. LFT: long-fiber thermoplastic.
Pigment variations
The critical pigment variables assessed were (a) pigment type (shape and chemical composition); (b) pigment average particle size (small and standard); (c) pigment loading level in the final part – low and high (0.5 and 5%).
Pigment types
The CICP chemistries are listed in Table 1. Pigment shapes were roughly spherical (Figure 3(a)) or rod-like (Figure 3(b)).
Pigment descriptions including particle size, shape, chemistry, and color.
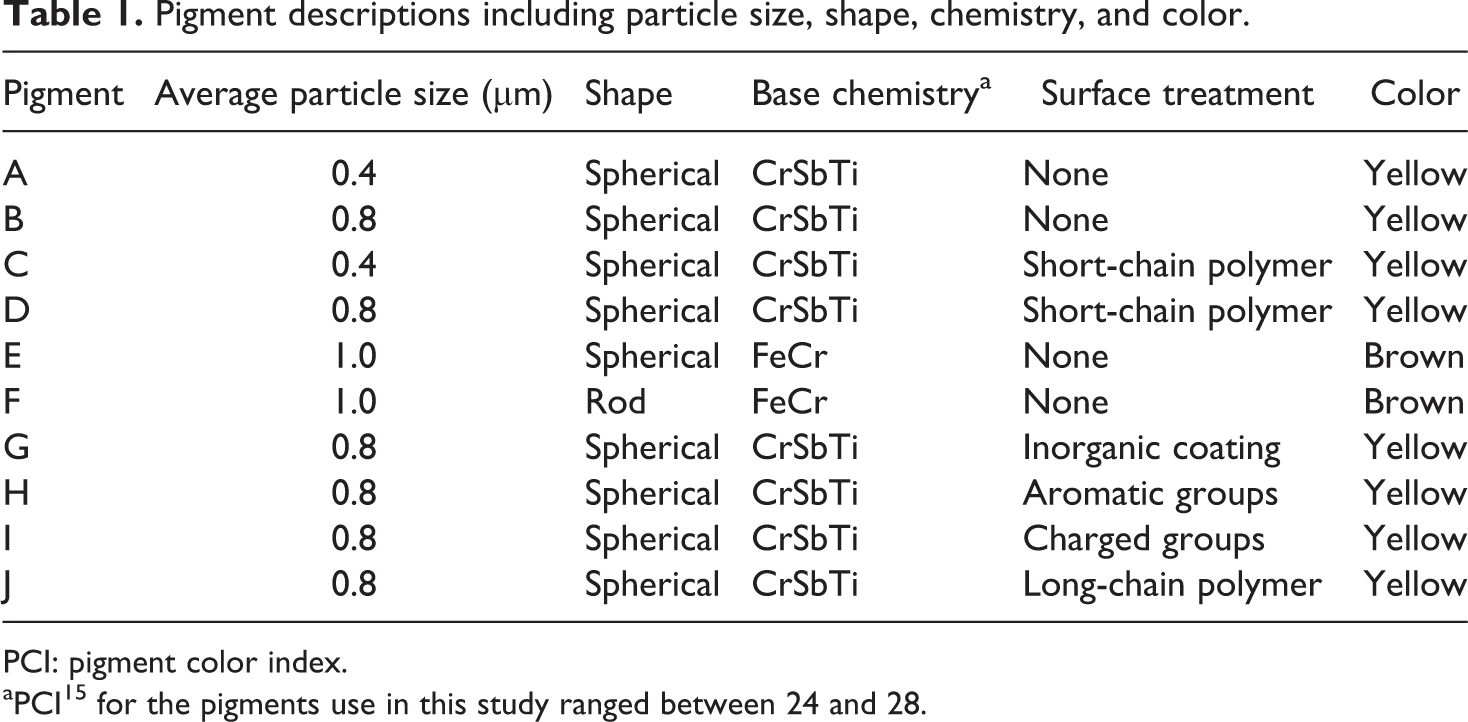
PCI: pigment color index.
aPCI 15 for the pigments use in this study ranged between 24 and 28.
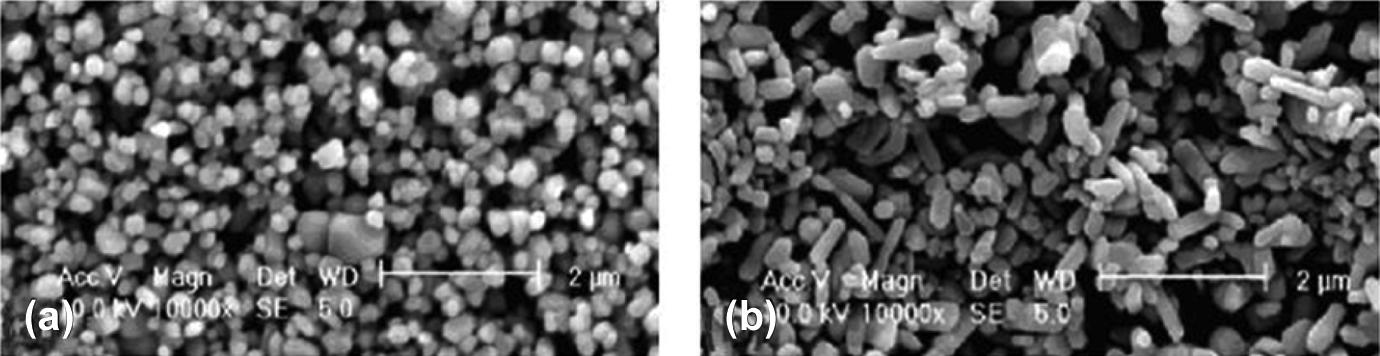
High-resolution images of pigments. (a) Example of spherical-shaped pigments and (b) example of rod-like pigments.
Pigment particle size
The average particle size for each pigment type is shown in Table 1. The average pigment particle size was varied from 0.4 to 1.0 μm.
Pigment loading levels
The target pigment loading levels were 0.5 and 5%. These levels are typically seen in uses when coloring plastics for outdoor weatherable products such as vinyl siding and window frames. The actual loading levels were determined by burn-off of the color compound and calculating the amounts used in creating the plaques. Actual pigment loading levels are shown in Table 2. In the current study, for a total of 54 samples, 36 were experimental samples and 18 were control samples.
Description of each tested sample; pigment used, pigment loading level, pigment and glass combination process, and whether the sample was experimental or control.
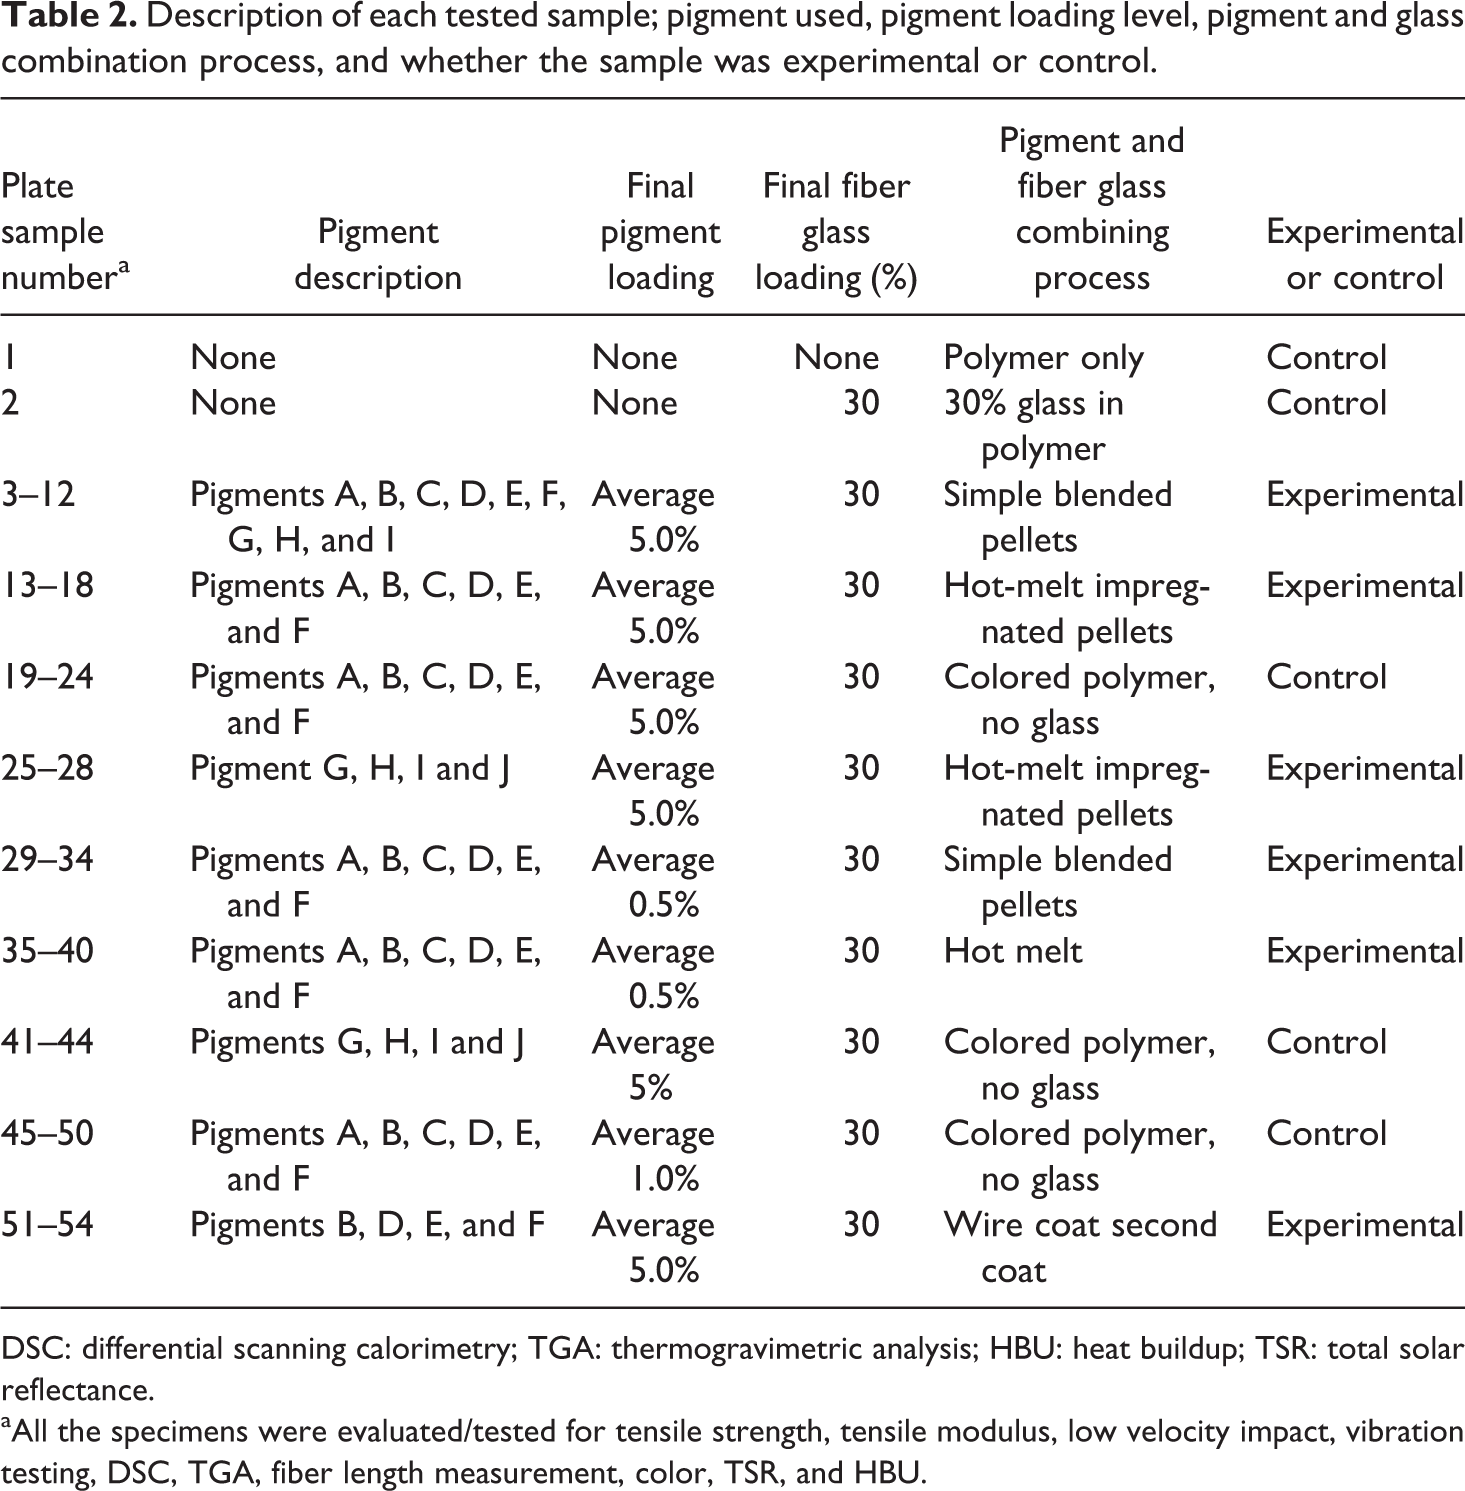
DSC: differential scanning calorimetry; TGA: thermogravimetric analysis; HBU: heat buildup; TSR: total solar reflectance.
aAll the specimens were evaluated/tested for tensile strength, tensile modulus, low velocity impact, vibration testing, DSC, TGA, fiber length measurement, color, TSR, and HBU.
Characterization
Polymer characterization (thermal and flow analysis)
Flow characteristics of the materials were measured above the melting point of the resin for all the sample types. The average melting point of the resin is 168°C as illustrated in the differential scanning calorimetry (DSC) curve (Figure 4).
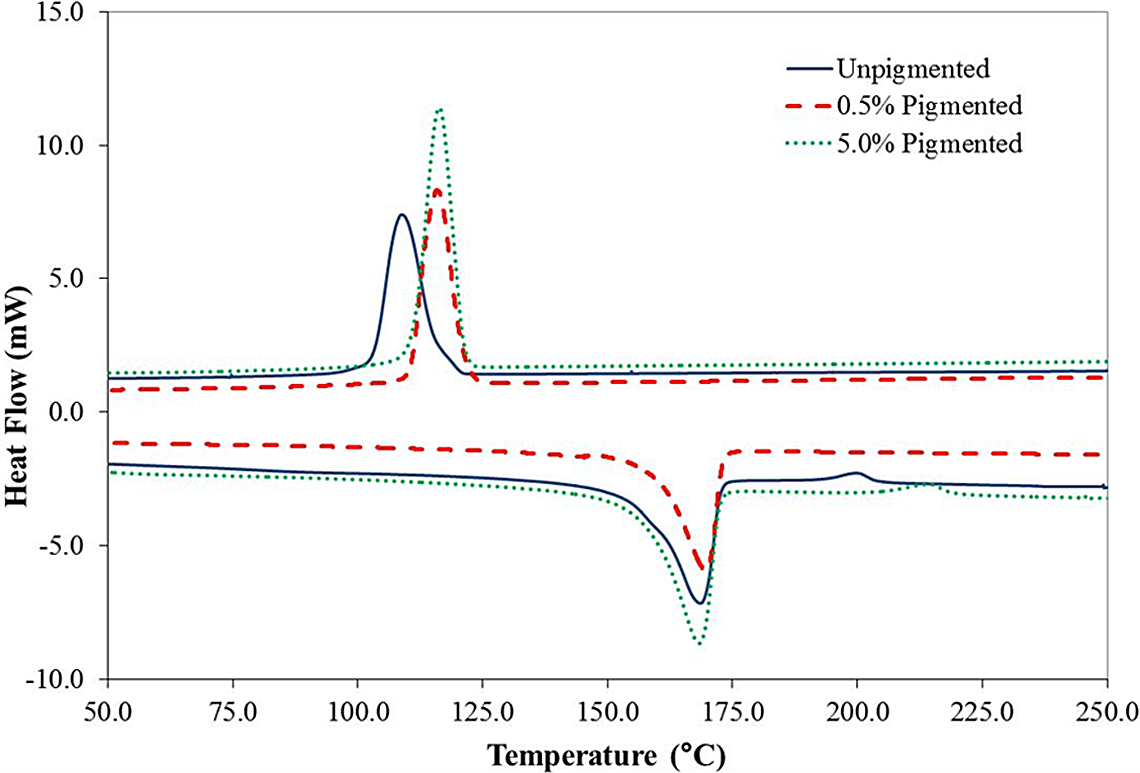
Heat flow versus temperature data obtained from DSC analysis. DSC: differential scanning calorimetric.
DSC studies indicated that the melting point remained the same for both pigmented and unpigmented samples. The addition of pigments had an effect on the recrystallization, because the pigments act as nucleating sites. The effect of viscosity was measured as a function of shear rate using a parallel plate rheometer. The flow study was performed at 170–200°C with 5°C increments by varying the shear rate from 0.001 to 10 (1/s). Figure 5 compares viscosity as a function of shear rate for pigmented and unpigmented samples. This study helped to establish the process ability of the variants considered in the study. Thermogravimetric analysis (TGA) was performed on all the unreinforced samples.
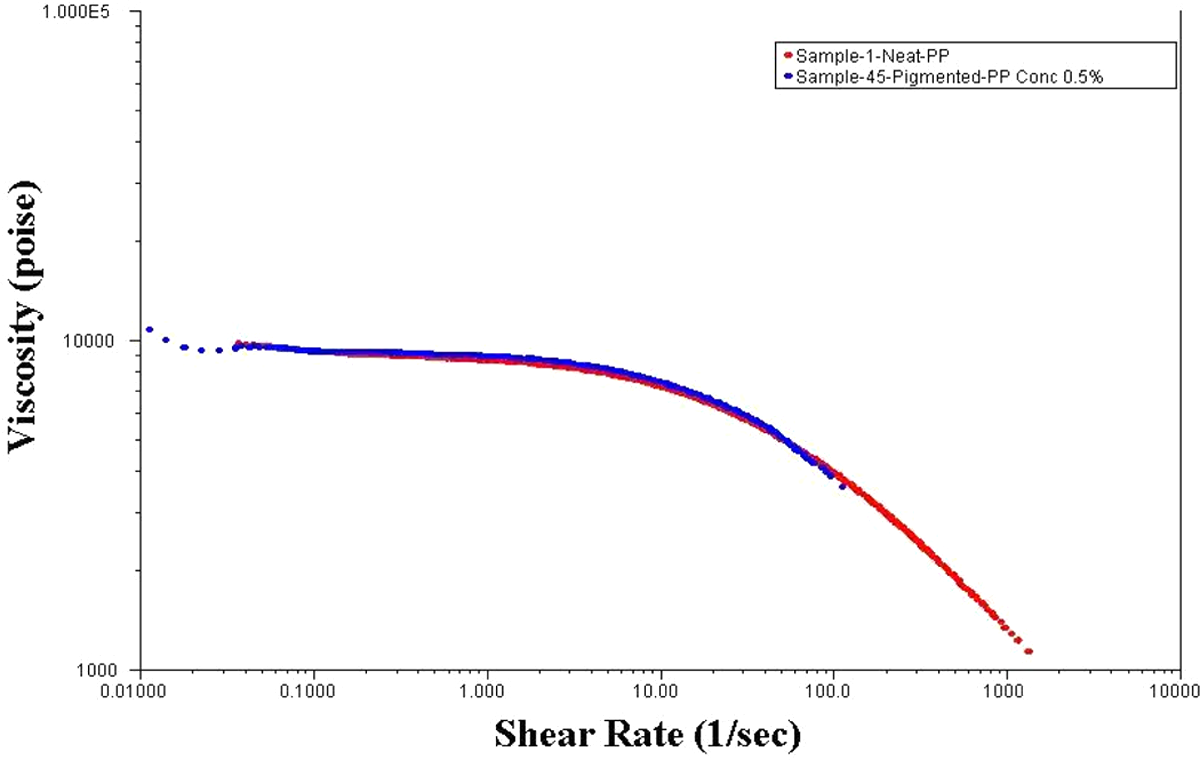
Comparison between viscosity and shear rate for pigmented and unpigmented LFTs. LFTs: long-fiber thermoplastics.
Figure 6 shows the mass loss as a function of temperature. The TGA results showed that the onset of degradation occurred at 300°C and a bulk mass loss occurred beyond 450°C, which is the degradation temperature of the resin. This suggested that the onset of degradation and the degradation temperature of the pigmented resin were the same as the unpigmented resin.
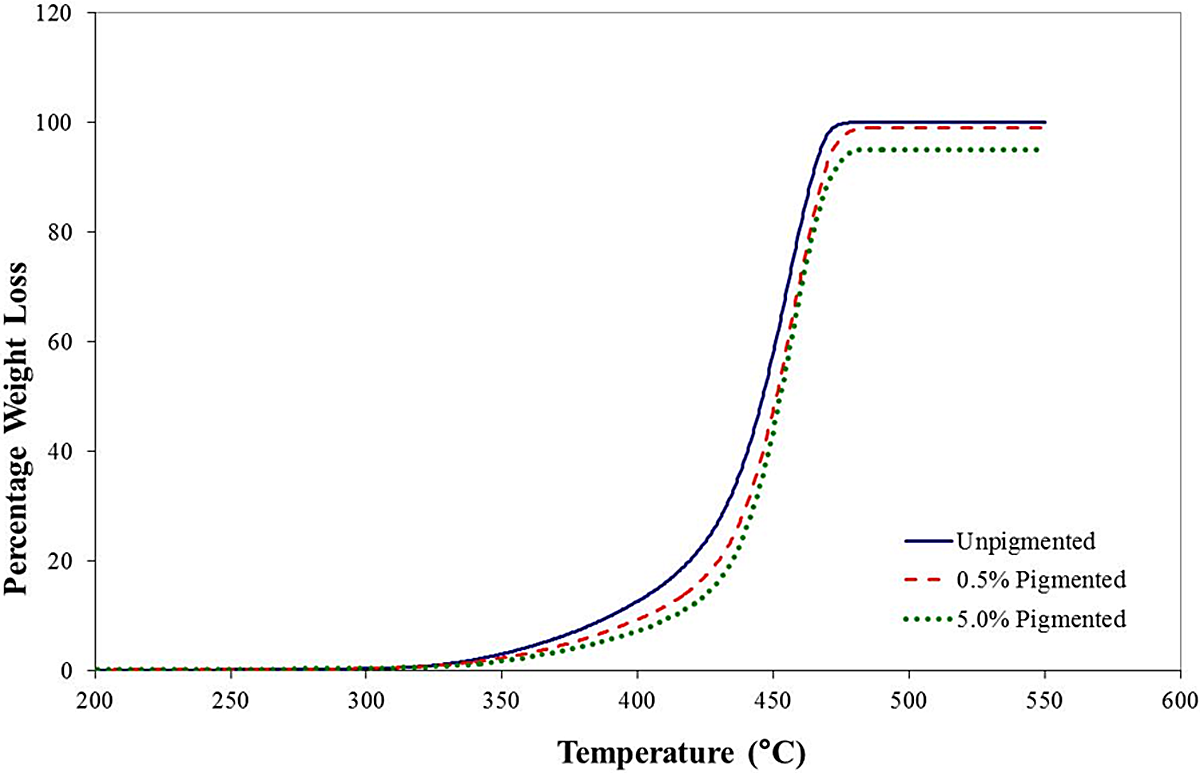
Weight losses as a function of temperature obtained from TGA. TGA: thermogravimetric analysis.
Tensile strength and modulus
Tensile strength and modulus of reinforced and unreinforced samples were determined according to ASTM D638-03 standard. A pneumatically activated testing machine operating at a constant crosshead velocity, equipped with 15 kN load cell was used. The grip distance was 115 mm with a speed of 5 mm/min and 0.1 mm/mm/min strain rate. The rupture time varied from 0.5 to 5 min. The test samples, classified as type 1 were dog bone-shaped with an average thickness of 4 mm, average overall length of 165 mm, and an average width of 19 mm. The average width of the narrow section was 13 mm with an average gauge length of 50 mm. A total of four specimens were tested. An extensometer was used on one of the specimens for duration of 10 s or until a load of 1000 N was surpassed, whichever occurred first, to calculate the modulus of elasticity. The linear region of the stress–strain curve was used to estimate the modulus of elasticity. The ultimate tensile strength and elastic modulus were calculated.
Flexural strength
Flexural strength of all the samples was determined using a three-point bend setup in accordance to ASTM D790-03 standard, using a support span to depth ratio of 16:1. The span length of 76.5 mm was held constant for all samples. The average depth of sample was 4.2 mm and with a width 19 mm. The rate of strain was in the range of 0.01–0.1 mm/mm/min.
Fiber length measurement
Samples (pellets, charge, and molded plates) were subjected to burn-off to separate the fibers from the matrix. A known quantity (by weight) of fibers were removed and dispersed in an aluminum pan as shown in Figure 7. A stereoscope was used to capture several images at various locations inside the pan dispersed with fibers. Postprocessing of the dispersed fiber images was carried out using the software Image Pro-Plus software (Media Cybernetics, Inc., Maryland, USA). The software enabled measurement of the individual fiber length. Hundred fibers were randomly chosen and each one was measured for length. Frequency versus fiber length distribution was plotted.
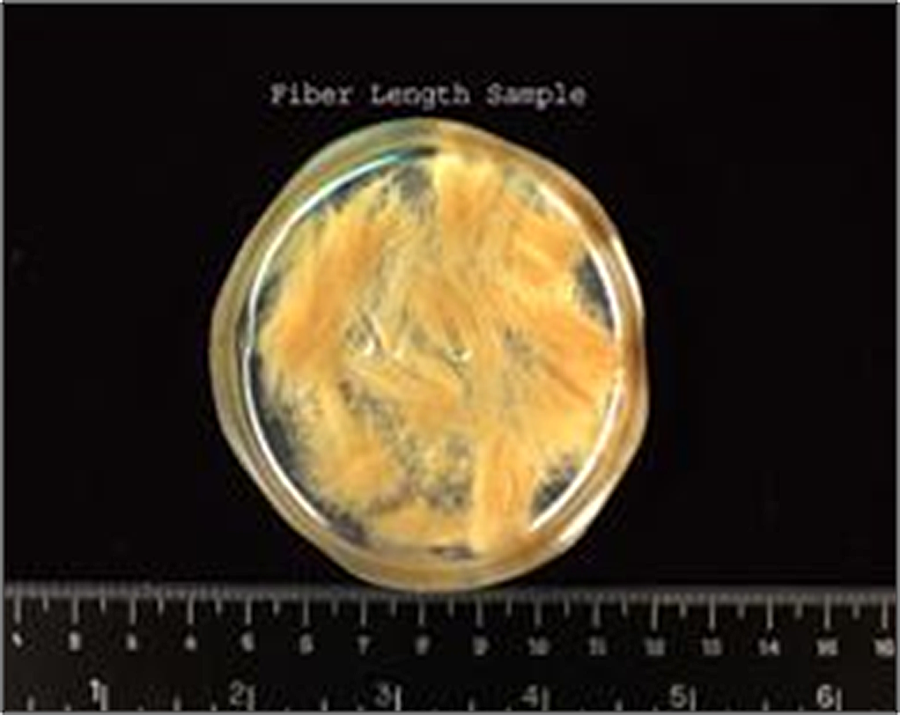
Burn off fibers dispersed in aluminum pan for fiber length study.
Color measurement
Color values were determined by Macbeth Color-Eye 3100 spectrophotometer (Kollmorgen Instruments Corp., Newburgh, New York, USA) along with Optiview® software package in the reflectance mode. Values were reported using the Commission Internationale de l’Eclairage (CIE) L*a*b* system. L* indicates lightness and darkness and ranges from 0 (black) to 100 (white). a* is the red/green measurement with +a* being red and –a* being green. b* is the yellow (+) and blue (−) measurement.
IR reflectance
IR reflectance was measured using a Perkin Elmer Lambda 900 (Waltham, Massachusetts, USA) ultraviolet–visible–near infrared spectrometer. This instrument includes spectra readings from 200 to 2500 nm. The spectral readings were converted using a formula to heat buildup (HBU). 7 Total solar reflectance (TSR) was measured on a D&S (Dallas, Texas) total solar reflectance (TSR) meter.
Fracture surface analysis
Fracture surfaces of the tensile specimens were analyzed to study the mode of failure. SEM was used to capture the images of fractured surfaces.
Results and discussion
As stated earlier, this work consisted of 36 experimental samples and 18 controls for a total of 54 samples. Table 3 provides comprehensive information on all the variables used in the study. The discussion of the results begins by focusing on the flow of the material through the process steps to make the final part; in our case, the flat plates were used for testing. Figure 2 shows the material forms from the pellet to charge to processed plates. Figure 8 shows the progression of degradation that the fiber experiences in the LFT extrusion–compression molding process.
Pigment and process variables.
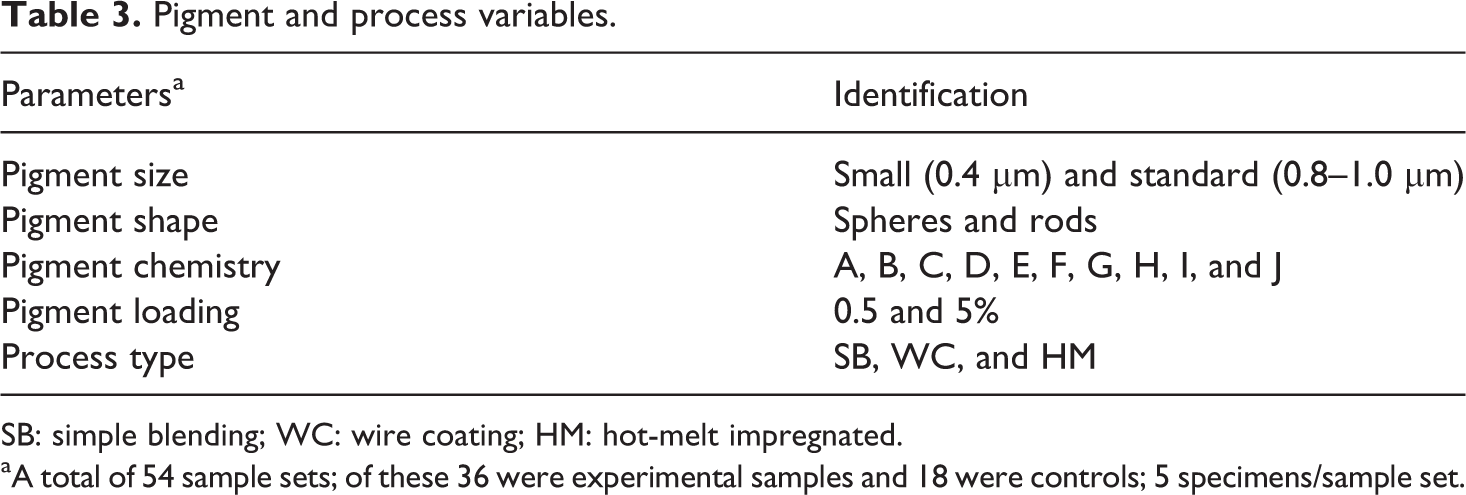
SB: simple blending; WC: wire coating; HM: hot-melt impregnated.
aA total of 54 sample sets; of these 36 were experimental samples and 18 were controls; 5 specimens/sample set.
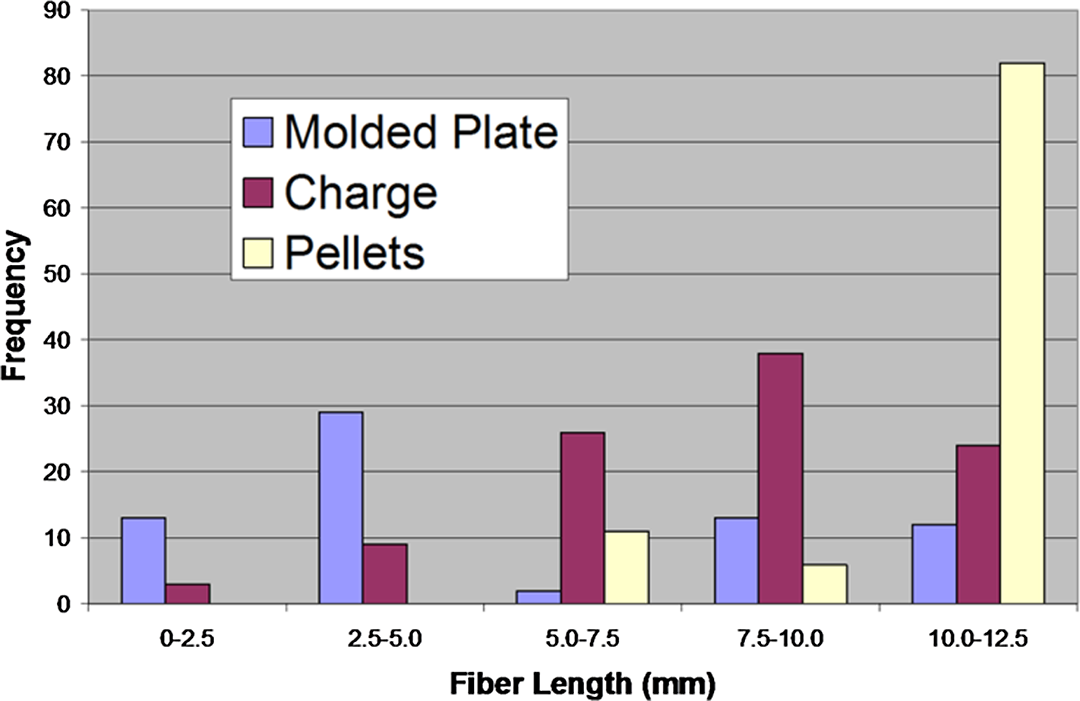
Representative fiber length distributions as the LFT material moved through each step of the process (pellets, charge, and molded plates) for a hot-melt process. Pigment loading level was 0.5%. LFTs: long-fiber thermoplastics.
As expected, the fiber length was the longest in the pellets (10–12.5 mm), and the distribution shifted to the shorter fibers (5–10 mm; Figure 8) in the charge after being processed in the plasticator even with low shear. Fiber length was further reduced (2.5–5 mm) in the compression molding process as the charge was flattened and forced to flow and fill the cavity to the final part dimensions.
Color and TSR
The color dispersion of the inorganic pigments was similar for the 0.5% concentration and the 5.0% concentration when compared with the same-sized pigments (Table 4). There was a 12% increase in TSR at the higher concentration of pigment. Higher TSR is desirable because it results in a cooler surface. 7 However, considering that there was a 10-fold increase in the amount of pigment needed to gain a 10% increase in TSR, while 0.5% concentration was considered as a reasonable compromise.
Color measured in CIE L*a*b* units, TSR, and HBU.
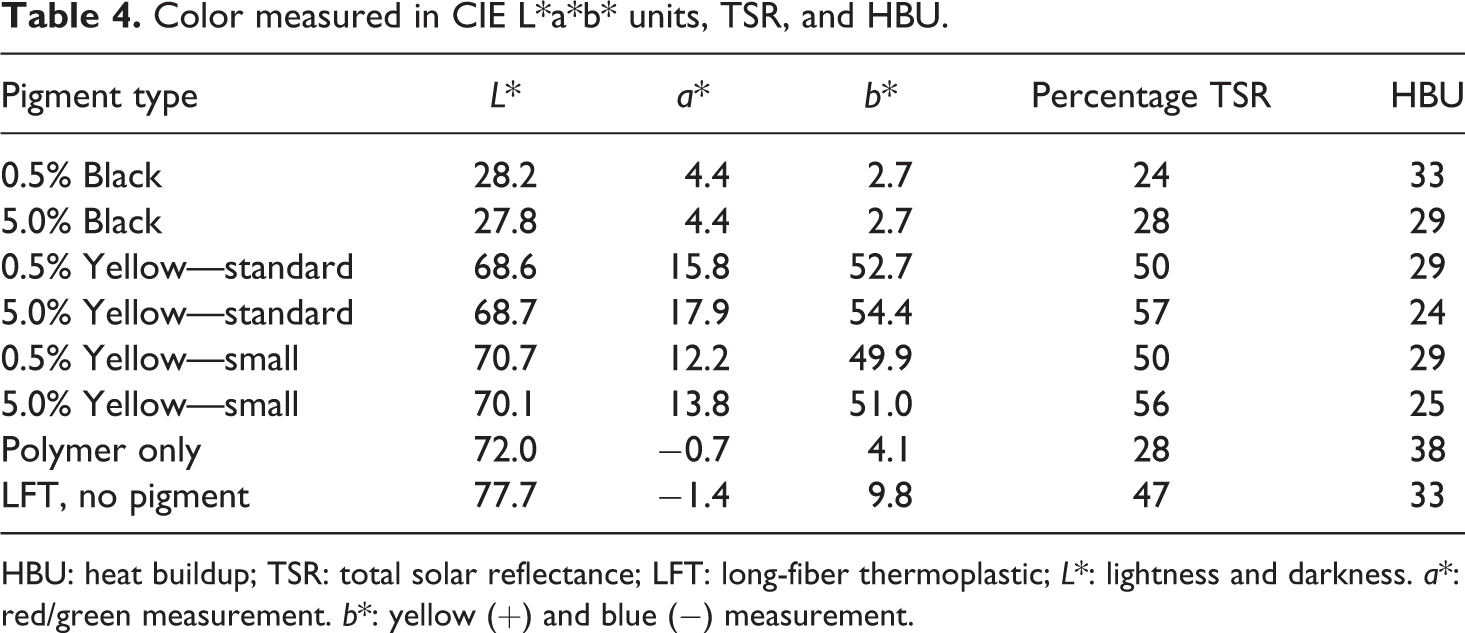
HBU: heat buildup; TSR: total solar reflectance; LFT: long-fiber thermoplastic; L*: lightness and darkness. a*: red/green measurement. b*: yellow (+) and blue (−) measurement.
Effect of processing condition
All the different processing types (SB, HM, and WC) were only run at the higher pigment concentration of 5%. SB and HM were also run at 0.5% concentrations. All the combinations showed tensile strength equal to or greater than the control (without color) as shown in Figure 9(a). There was a slight increase in tensile strength when pigment was added to the polymer only. The tensile modulus and flexural strength of the SB 0.5% samples was comparable to the unpigmented sample (approximately 9 GPa and 138 MPa, respectively) as shown in Figures 9(b) and 10. All other configurations, that is, SB 5%, HM 0.5and 5%, and WC 5% exhibited reduced tensile modulus. This suggests that fiber length and fiber orientation had a strong influence on resulting modulus. The 0.5% SB had the least effect on fiber attrition and retained higher fiber lengths and fiber alignment in the direction of loading; hence exhibited higher modulus.
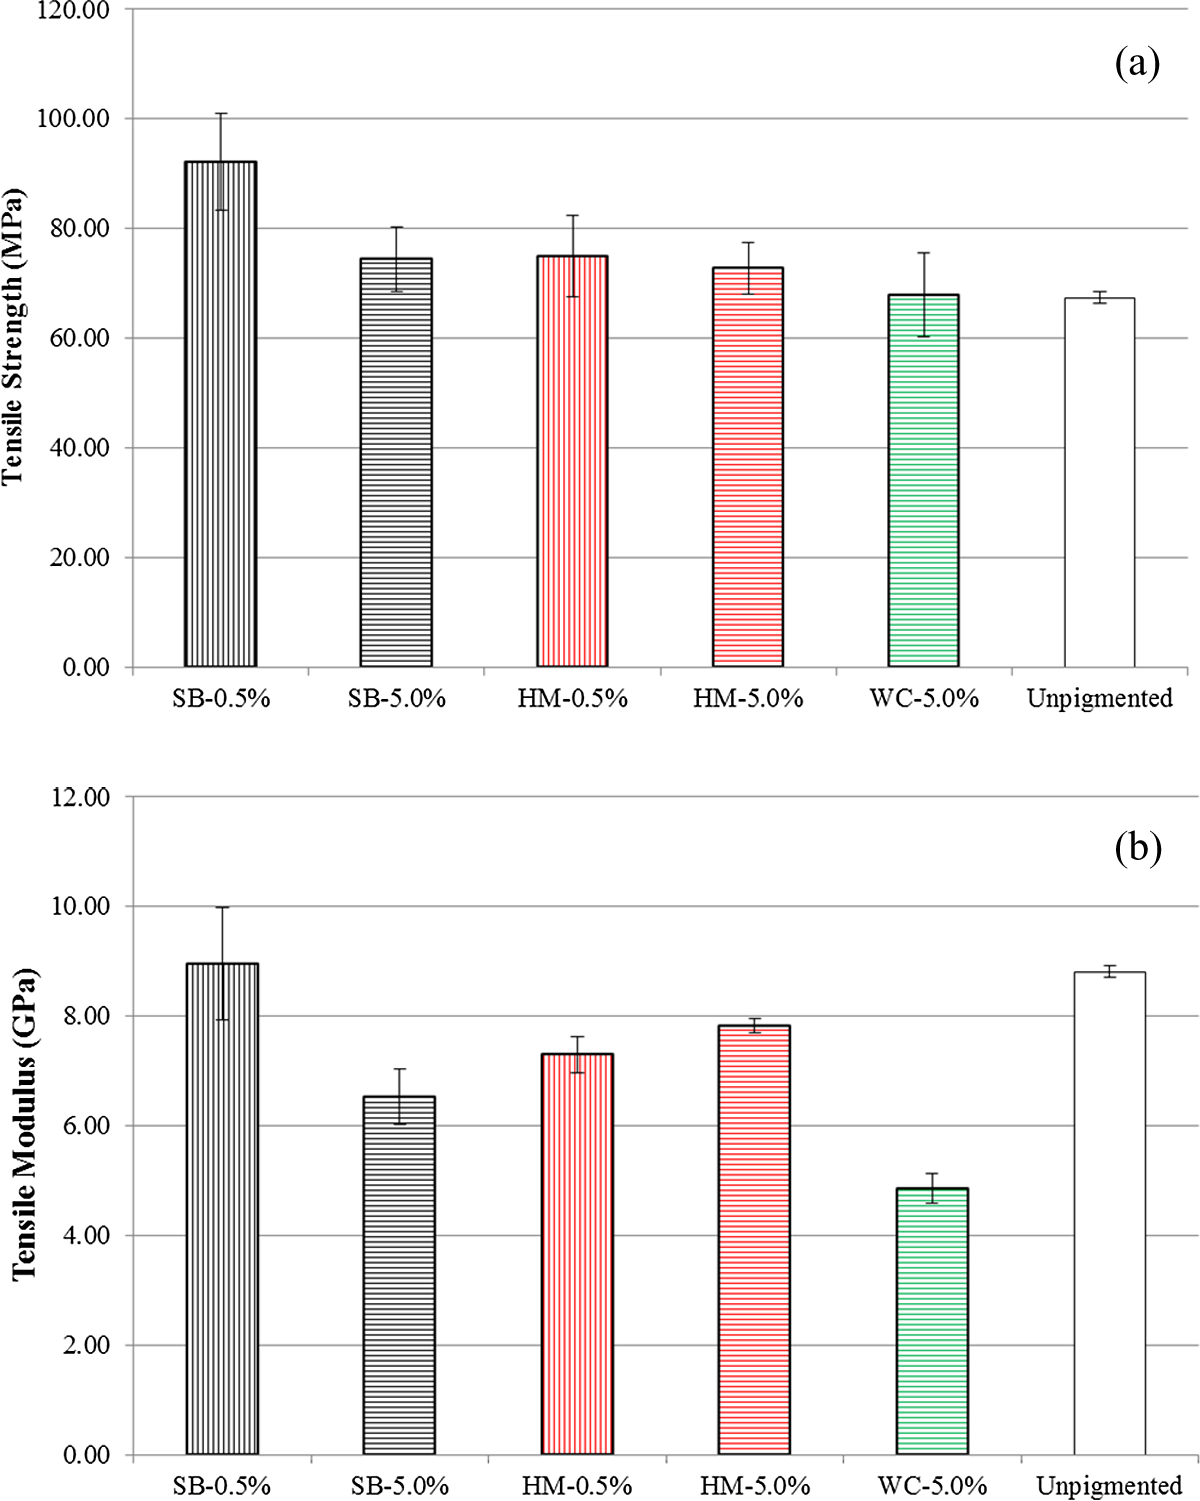
Tensile modulus of samples made from various processing conditions compared with unpigmented sample.
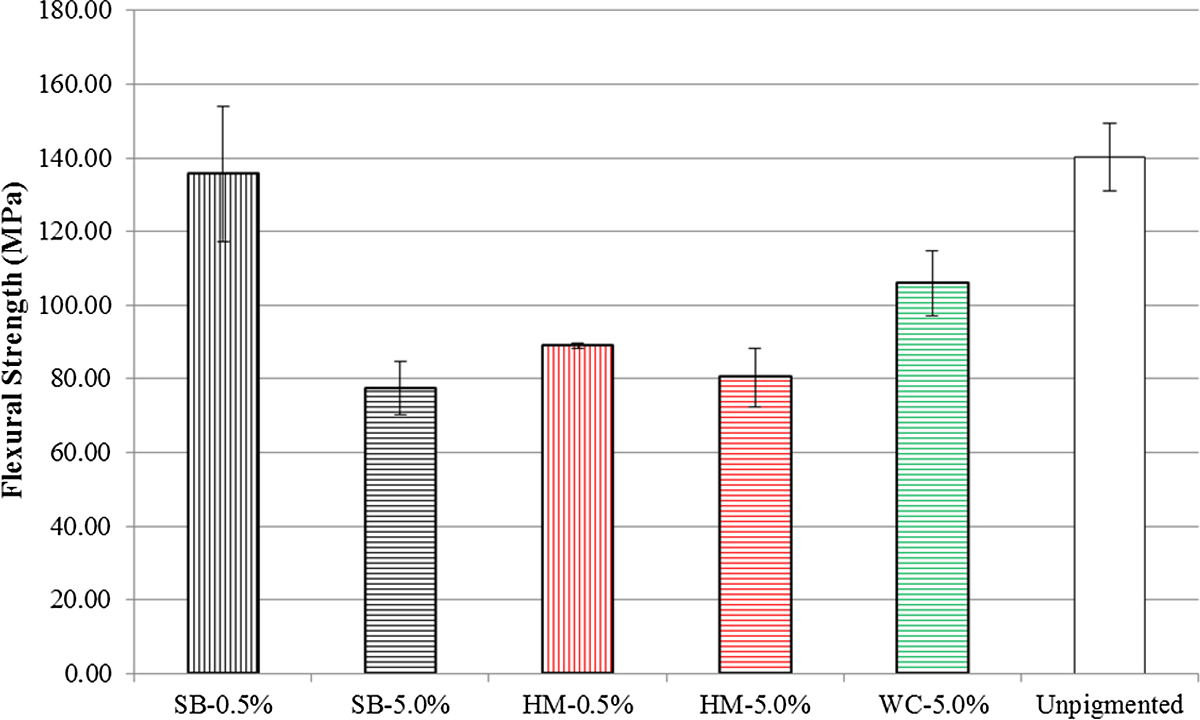
Flexural strength of samples made from various processing conditions compared with unpigmented sample.
In almost all the cases, the order of performance ranked as follows. The SB process yielded the highest performance, followed by the WC which was followed by the HM process. This might be because of the pigment source and the extent of abrasion done by the pigments to the fibers.
The SB process seemed to be the gentlest in terms of abrasive interaction of the pigments with the fiber and the mixing/extrusion screw. The pigments blended in gently with the LFT material during its passage through the extrusion screw. While some fiber attrition occurred, higher fiber lengths were still retained. In the HM process, the pigmented polymer was extruded onto the fiber (for wetting the fiber) in the restricted space of the HM die. The fiber moved through the die as the resin was being deposited within the restricted space. As a result, there was an abrasive interaction which may have caused fiber length attrition, and hence the resulting fiber length distribution was skewed toward shorter fiber lengths (Figure 11). The shorter fibers influenced mechanical performance adversely. In the WC process, while the pigment coated the polymer-impregnated tows, there was still interaction of the pigment within the restricted die space. Although the extent of abrasion was not as severe as in the HM process, some fiber attrition was still noticed.
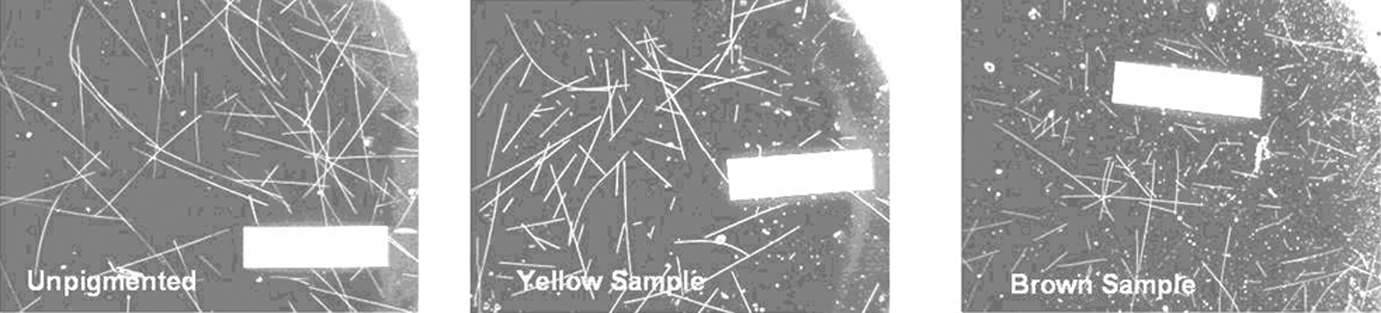
Evidence of fiber attrition for unpigmented versus pigmented sample. The yellow- and brown-pigmented samples were made by the SB process. SB: simple blending.
Effect of pigment size
At a loading of 0.5%, the standard-sized yellow-pigmented LFT exhibited the highest tensile modulus and also showed the most significant decrease in 5% pigment loading, that is, the smaller particle-sized pigment showed less difference between the loadings, but had lower tensile modulus at the lower concentration (Figure 12). The surface-treated yellow standard pigment yielded equivalent performance to the yellow small untreated pigment. The small yellow-treated pigment showed even better performance at the higher loading compared to the lower loading, but both values were lower than the unpigmented LFT (Figure 12). The smaller pigment showed an 18% improvement (92 vs. 78 MPa) in tensile strength relative to the standard size at the lower concentration of 0.5%. Both showed higher tensile strength than the unpigmented LFT at 67 MPa. Flexural strength was found to be dependent on concentration. At low concentration (0.5%), the small-sized pigment had 25% higher flexural strength (135 vs. 108 MPa) than the standard size. At high concentration (5.0%), the standard pigment had 14% higher flexural strength (97 vs. 82 MPa) than that of the small size. The unpigmented sample had flexural strength of 140 MPa.
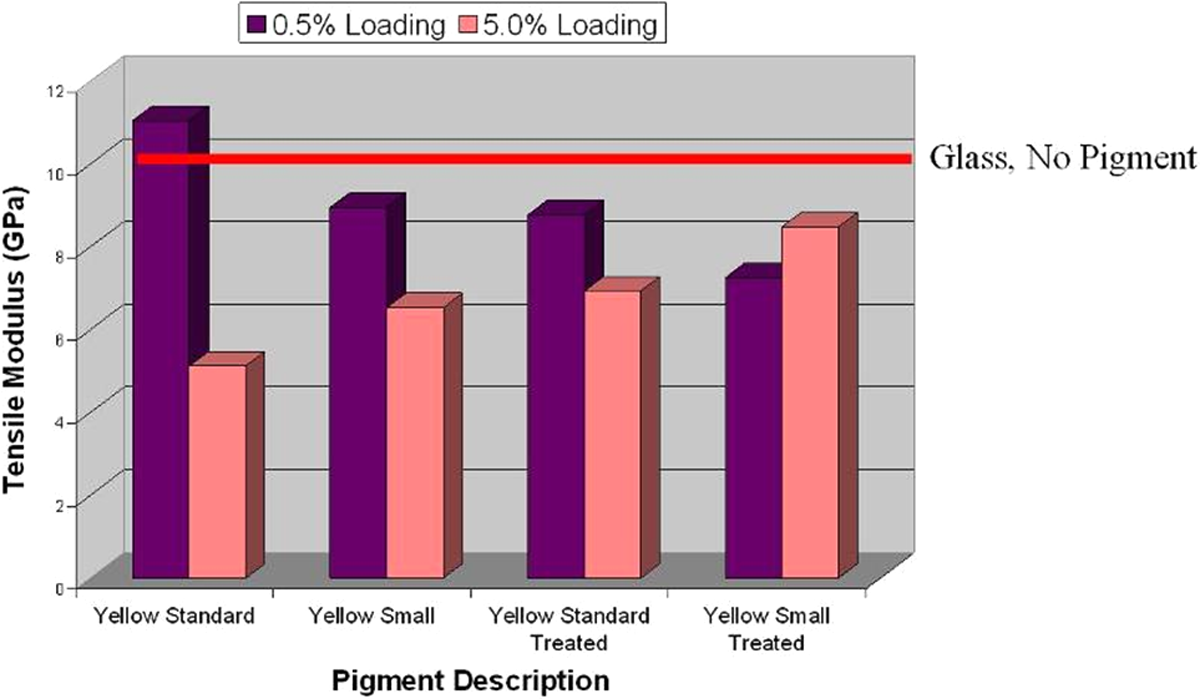
Particle size, treatment, and pigment concentration effects on tensile modulus.
The color intensity remained the same between the lower- and upper-bound concentrations, that is, 0.5% versus the 5% pigment concentration (Table 4). The color scattering occurred for 0.5% provided uniform color dispersion and the higher 5% concentration did not appear to provide any additional benefits, at least in terms of color intensity. SEM images of various specimens indicated uniform dispersion of the pigments.
Figure 13(a) represents the presence and uniform dispersion of the pigments. The tensile strength of the pigmented yellow and brown specimens at 0.5% concentration was higher across all the categories by an average of 20% when compared with the unpigmented specimens. Similarly, the tensile strength for the 5% concentration was higher than the unpigmented LFT by an average of 13%. The influence of the treatment and/or shapes (i.e. rods vs. spheres) did not seem to have influenced the tensile strength significantly. The higher tensile strength observed in pigmented LFT compared with unpigmented LFT could be because of enhanced resistance offered by the pigments to the polymer chains (i.e. higher contact area). Fiber pull out under tension is shown in Figure 13(b).
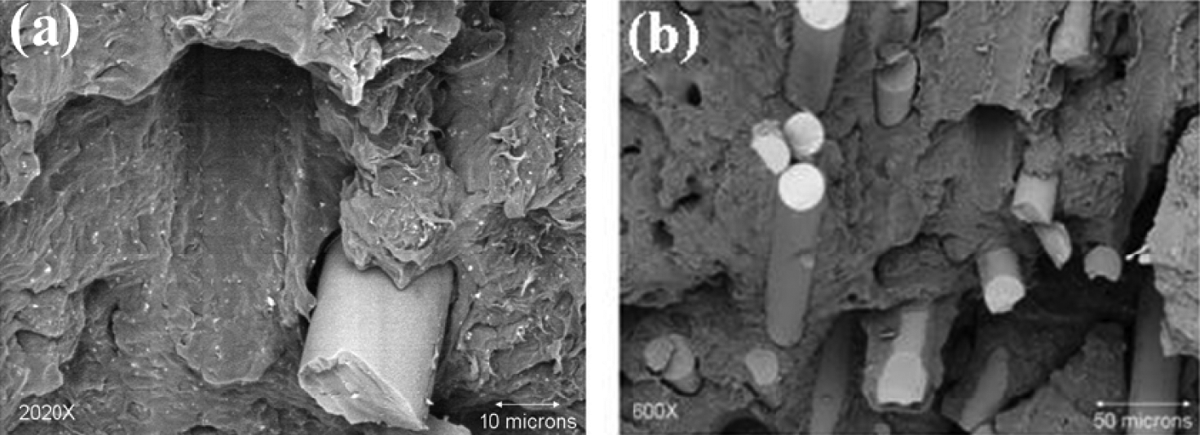
SEM images of fractured surface. (a) BSE image shows the uniform dispersion of pigments in the matrix and (b) fractured surface showing areas of fiber pull out. SEM: scanning electron microscopy; BSE: back-scatter detecter.
The tensile modulus of the 0.5% pigment loading LFT was closer to the tensile modulus of unpigmented LFT compared with the 5% pigment loading LFT. The modulus exhibited higher scatter and was influenced by the surface treatment (Figure 12). This suggested that at higher concentration, the agglomeration and stiffness, that is, hardness of the pigment particles and their resulting interaction with the polymer and fibers influenced the tensile response. While harder particles drive the stiffness up; they in turn resulted in more microcracks, and hence eventually reduce the stiffness.
The flexural strength was lower across all the fiber-reinforced pigmented categories compared with the unpigmented baseline. For the 0.5% concentration, the flexural strength reduced by an average 15% for the pigmented versus the unpigmented. For the 5% concentration, the reduction in flexural strength was 32% compared with the unpigmented. The transverse loading under flexure promotes pinning action from the pigment particles which serves as crack initiation sites, which lowers the strength.
A rule of mixtures approach is not applied to predict properties of the long-fiber colored composites since the constituents in the composite have different aspect ratio and complex processing conditions. The constituents include:(a) long fibers of 12 mm (0.5″) starting length and resulting fiber attrition by interaction with the extruder screw and pigment particles, (b) PP coating the fiber filaments and filament dispersion and wet out of the polymer during its migration through the screw, and (c) the pigment compound with particles of spherical- or rod-like aspect ratio. Follow-up work is underway to model the system by considering these constituents and making prediction from a micromechanics standpoint. Future work will also address the applicability of the present study to other color pigments, since the present study considered only yellow and brown pigments.
Summary and conclusions
This work established a comprehensive understanding of the effects of the pigment variables, various processes for combining pigments, GFs, and polymer and pigment/process combinations on the physical and mechanical performance of LFT materials under tensile and flexure loading.
A 0.5% SB, standard yellow pigment treated with a short-chain polymer measured the highest tensile strength at 102 versus 67 MPa for the unpigmented LFT. The highest tensile modulus seen was for a 5% HM standard yellow pigment treated with a long-chain polymer that measured 11.21 versus 8.81 GPa for the unpigmented LFT. The pigments possessing higher strength and modulus may have contributed to the increase of the mechanical properties. This treated pigment was only evaluated at 5% concentration, not at the lower concentration. For the flexural strength, a 0.5% SB rod-shaped pigment measured the best performance and was equivalent to the unpigmented LFT.
The IR reflectance increased from 50 to 56% for concentration of 0.5 to 5.0%, respectively. Higher concentrations (5.0%) yielded 12% higher IR reflectance than the lower concentration (0.5%). The color intensity remained the same between the lower- and upper-bound concentrations, that is, 0.5 versus the 5% pigment concentration. The color scattering for 0.5% provided uniform color dispersion and the higher 5% concentration did not appear to provide additional benefits, at least in terms of color intensity. In terms of performance, the 0.5% pigment loading yielded higher mechanical performance compared with the 5% pigment concentration.
In almost all cases, the order of performance ranked as follows. The SB process yielded the highest performance, followed by the WC, and followed by the HM process. This work has demonstrated that LFT composite material can be colored with durable pigments and still retain good mechanical properties.
Footnotes
Declaration of Conflicting Interests
The author(s) declared no potential conflicts of interest with respect to the research, authorship, and/or publication of this article.
Funding
The author(s) disclosed receipt of the following financial support for the research, authorship, and/or publication of this article: The present work was financially supported by the National Science Foundation— Small Business Technology Transfer (STTR) program Grant No. OII-0611123 and the Shepherd Color Company, Ohio, USA.