
Abstract
The tribological behavior of the sliding surfaces is dependent on the frictional heating. Surface and near surface temperatures may become high enough to cause changes in structure and properties of the sliding surfaces. It can also cause oxidation and even melting. Wear and frictional behavior of materials above ambient (25°C) conditions would become critical for polymers as the operating temperature bands of polymers are always limited. In the present study, tribological studies on two-phase and three-phase polystyrene composites at temperatures of 45 and 60°C have been reported. It is found that with increase in temperature the wear rate increases, whereas the friction coefficient decreases. Polymer–ceramic composite exhibited higher friction coefficient than other composites. At temperature of 45°C, the wear rate of the neat polymer increases exponentially whereas at 60°C it decreased. However, addition of fillers into polystyrene brought in drastic reduction in the wear rate of polymer composites. Scanning electron microscopic pictures revealed melting, flowing, and glazing after wear test. Higher pressure velocity resulted in higher wear coefficient.
Introduction
When two bodies slide against each other, friction occurs and results in heat generation. It is through these processes that mechanical energy is converted to internal energy or heat. 1 The exact mechanism by which the transformation occurs may vary from one model to the other. Most of the energy dissipation occurs through bulk solid beneath the contact area due to plastic deformation processes. During the rubbing process, interaction between frictional heating, thermal distortion, and contact mechanism may cause the development of nonuniform contact pressures and thermal instability. The effect of increase in sliding velocity might cause a reduction of contact area leading to higher interface temperature. During any friction and wear process, a significant amount of heat is generated between the two sliding surfaces. Depending on the material properties, sliding velocity, contact pressure, rubbing geometry, and mass, the heat flux generated on the friction interface will be partitioned among the pin and the disc. Only a part of the power is used to generate deformation and wear of material, because in reality kinetic energy can be converted by means of friction to heat, sound, vibration, chemical energy, and wear of materials. 2
Experimentally, it is shown that 95% of the energy is dissipated through the top 5 µm of the contacting bodies. It is generally accepted that all the energy dissipated at frictional contacts is transformed into heat.
There are many reports on polymer composites filled with fibers and particulate fillers. However, polymer composites filled with only particulates are rather less, though there are many reports with addition of lubricants into the polymer matrix. Addition of particulate fillers into the matrix is normally done when isotropic properties are desired and is usually application dependant. Another advantage of particulate composites is that they can be processed quickly with minimum mechanization/processing equipments. It would be better if the composite can be processed at ambient temperature. This is desired for in situ applications. Hanchi et al. 3 have investigated polyether ether ketone–thermotropic liquid crystalline polymer (PEEK-TLCP) blend polymer that were processed in situ. Wear and friction tests were carried out using a ball-on-flat configured pin-on-disk tribometer. The testing parameters include velocity being 0.15 m/s and load of 15 N in the temperature range of 20–250°C. The rotating polymer specimens were allowed to complete 3000 cycles. It was observed that up to 200°C the addition of TLCP had a reinforcing effect and after which the modulus dropped. Gomes et al. 4 have performed tribological tests on carbon fiber-reinforced composites (CFRP) at sliding speeds of 0.5, 2, and 3.5 m/s and at 100 N load with variation of temperature between22 and 600°C. At room temperature and low sliding speeds, the friction coefficient was too low and was almost independent of the sliding speed. However, at higher temperatures, it decreased a little. It is observed that the CFRP works better at room conditions whereas at higher temperatures, the tribological response deteriorates. Greco et al. 5 have studied the reinforcement morphology on high speed sliding friction and wear of PEEK polymer. Of the three materials, two of the PEEK materials were tested with reinforcements: one with long woven fiber and one with short, and the other without any reinforcements. The sliding speed was 65 m/s. It was observed that the composite with long woven reinforcement has exhibited least wear rate and lower friction coefficient at high sliding speeds. Tribological studies on epoxy-based tri-phase composites have been investigated by Vasconcelos et al. 6 Tests on neat resin (epoxy), aluminum-filled epoxy and epoxy with aluminum powder and milled glass or carbon fibers (tri-phase) have been carried out using a pin-on-disk tribometer at room temperature. It is observed that the neat epoxy had a constant friction coefficient up to 30 m of sliding distance. When the temperature reached 160°C (injection temperature), the friction coefficient of the neat polymer drastically increased to a higher value and the real area of contact increases. Both glass and frictional behavior show similar frictional behavior but slightly higher friction values at room temperature. Addition of carbon or glass fibers changes the friction coefficient to a smaller extent. Polytetrafluoroethylene (PTFE)-based composites filled with various inorganic fillers have been studied by Zhang et al. 7 It is seen that, under the given conditions in this work, carbon fibers (CF), glass fiber (GF), and potassium titanate whiskers as the fillers slightly increase the friction coefficients; nickel, lead sulfide, copper sulfide, silicon carbide (SiC), and silicon nitride as fillers increase the friction coefficient considerably; while other fillers including copper, lead, lead oxide, copper oxide, lead oxide (PbO), molybdenum disulfide, graphite, boron nitride, and boron trioxide have almost no effect on the friction coefficients, if one takes into account the scattering of the friction and wear test data. Additions of most of the fillers have shown reduction of wear except PbO, where the wear rates drastically increase. A study on the influence of PTFE content in PEEK-PTFE blends on mechanical and tribological properties has been reported by Jayashree Bijwe et al. 8 Five injection-molded blends of PEEK with PTFE were evaluated on a pin-on-disc tribometer. Adhesive wear and low amplitude oscillating wear tests were conducted. It was reported that inclusion of PTFE affected the adhesive wear and low amplitude oscillating wear in a beneficial way. With an increase in PTFE content, the coefficient of friction in both the wear modes (adhesive and low amplitude oscillating wear) decreased but the trends in wear performance differed. In the adhesive wear, the specific wear rate showed a minimum of 7.5% PTFE inclusion followed by a slow increase for further addition of PTFE. In the case of low amplitude oscillating wear test, the wear rate continuously decreased for the selected compositions. The 30% PTFE blend showed excellent combinations of coefficient of friction and wear rate and limiting pressure–velocity (PV) values. But any increase in tribological properties was at the expense of deterioration of mechanical and abrasive properties. Palabiyik and Bahadur 9 conducted tribological studies on polyamide-6 (PA6) and high-density polyethylene (HDPE) blends filled with PTFE copper oxide (CuO) and reinforced with GF. With increased PTFE, the coefficient of friction of the blends (80 wt% PA and 20 wt% HDPE) decreased. There was a large reduction in wear with PTFE addition to the blend. When CuO was added, the coefficient of friction increased but the wear loss reduced. With the addition of 10 wt% of glass fiber to 80 wt% PA and 20 wt% HDPE, the wear was found to reduce. The changes in the coefficient of friction with the addition of GF were insignificant. At 10 wt% of glass fiber the wear rate was minimum. With 15 wt% GF reinforcement, the transient wear state became longer and the steady state wear rate increased. Chang et al. 10 have investigated the tribological properties of high temperature resistant PEEK and polyethylenimine (PEI) polymers filled with short CF (SCF), graphite flakes, and submicron-sized titanium oxide (TiO2) and zinc sulfide under dry sliding conditions. Pin-on-disk tribometer was employed for the test. Tests were conducted at room temperature and elevated temperatures. Additions of filler greatly enhanced the wear resistance. At a given PV condition, the friction coefficient of neat PEEK was found to be more than SCF and graphite-filled PEEK. The temperature of the disk and wear rates decreased. Particulate additions into the same composite (SCF + graphite + TiO2) reduced the friction coefficients, increased the temperature of the disk slightly but wear rates increased. At elevated temperatures, the friction coefficient of particulate-filled composite reduced substantially. The specific wear rates increased at the lower elevated temperature and decreased at higher elevated temperature.
In the present study, the tribological behavior of polystyrene composites (two-phase and three-phase) at temperatures above ambient is reported. The test sample pins were heated to temperature of 45 and 60°C when the ambient temperature is approximately 25°C. The testing parameters include normal load and velocity of the disc. The coefficient of friction and specific wear were computed for two-phase and three-phase composites for the purpose of comparison.
Experimental
Materials and testing
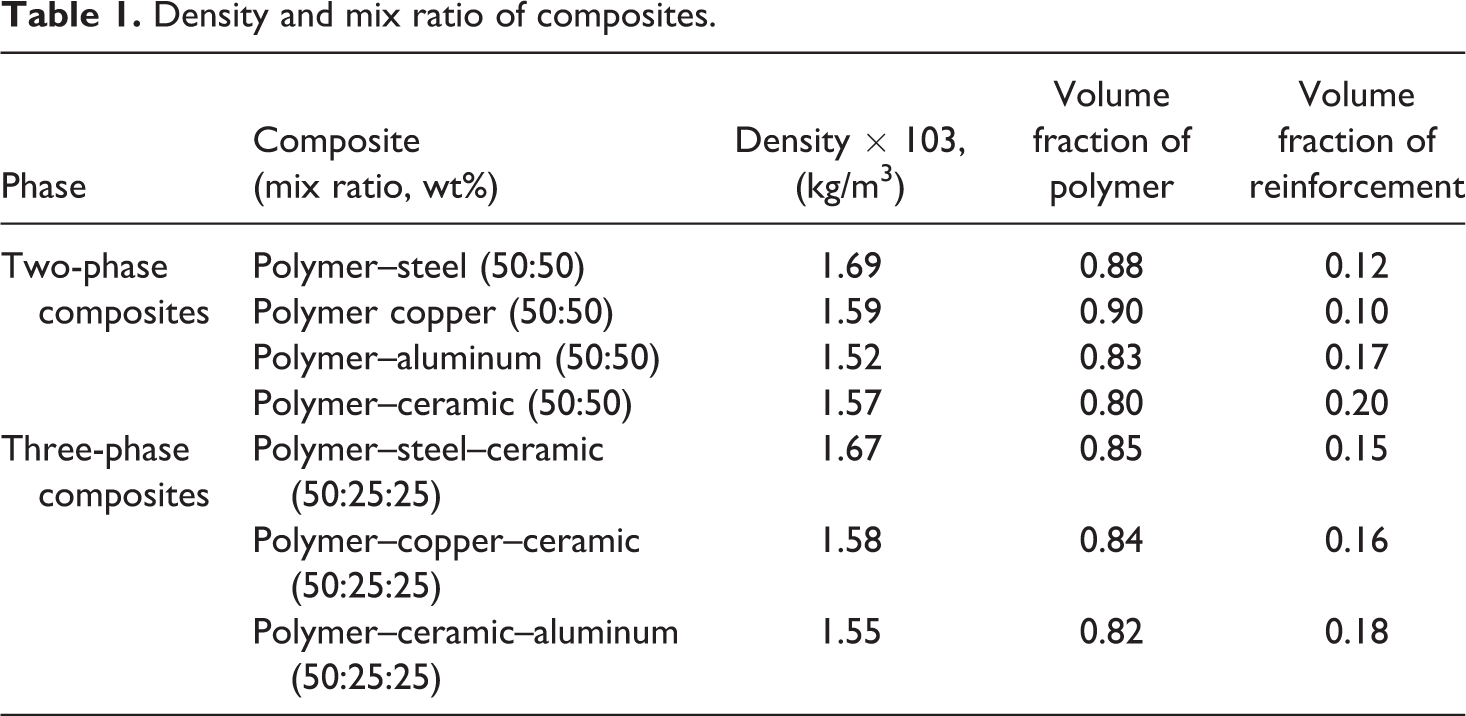
Two-phase and three-phase composite samples were prepared by mixing powder fillers (aluminum, copper, steel, and alumina) into polystyrene matrix in 50:50 wt% and 50:25:25wt% ratio. In the three-phase composites, 25 wt% each of two fillers were added into 50 wt% polymer. 2.5 wt% of Dibenzoyl peroxide was used as a catalyst. The mixure was filled into a syringe, air evacuated, and then injected into a horizontal pipe of 6 mm diameter. The mix was allowed to set for few minutes. The pipes were cut open and the samples were retrieved. The samples were cut to a length of 25 mm in length and run in for 5 min before the test for better contact between the pin and the disk on a pin-on-disk tribometer. Care was taken to avoid any blowholes and damage to samples during casting. The properties of the composites are shown in Table 1.
Density and mix ratio of composites.
The samples were tested on a modified high temperature pin-on-disk tribometer (Figure 1(a)). Various loading arrangements were compared and modified to improve the performance. Ball bushings were employed to reduce the friction and improved alignment. The modified attachment which houses the sample pin holder (sleeve) is shown in Figure 1(b). Sample pin holder houses the heating coil also. Feedback system for controlling the temperature of the pin was facilitated. The tribometer has a loading (normal) capacity of 1000 N and could measure to an accuracy of 1 N. The frictional transducer has a resolution of 0.1 N and can measure 10 N. The tribometer has a mechanical advantage of five for loading. Computerized data acquisition was employed for data collection and analysis. All samples were run up to a distance of 2 km. Each data point was an average of five readings. A steel disk of 62 HRC, 0.3 Ra was used as counter face disc. The wear loss was measured through mass loss. Volume loss was calculated considering the density of the composite by Archimedes principle. The mass was measured using an electronic balance (Shimadzu-Aux220, Tokyo, Japan) of 0.1 mg accuracy. Wear coefficient was calculated by standard relation. All tests were carried out under dry conditions and the wear debris was cleared from the track continuously during the test to avoid three body wear.
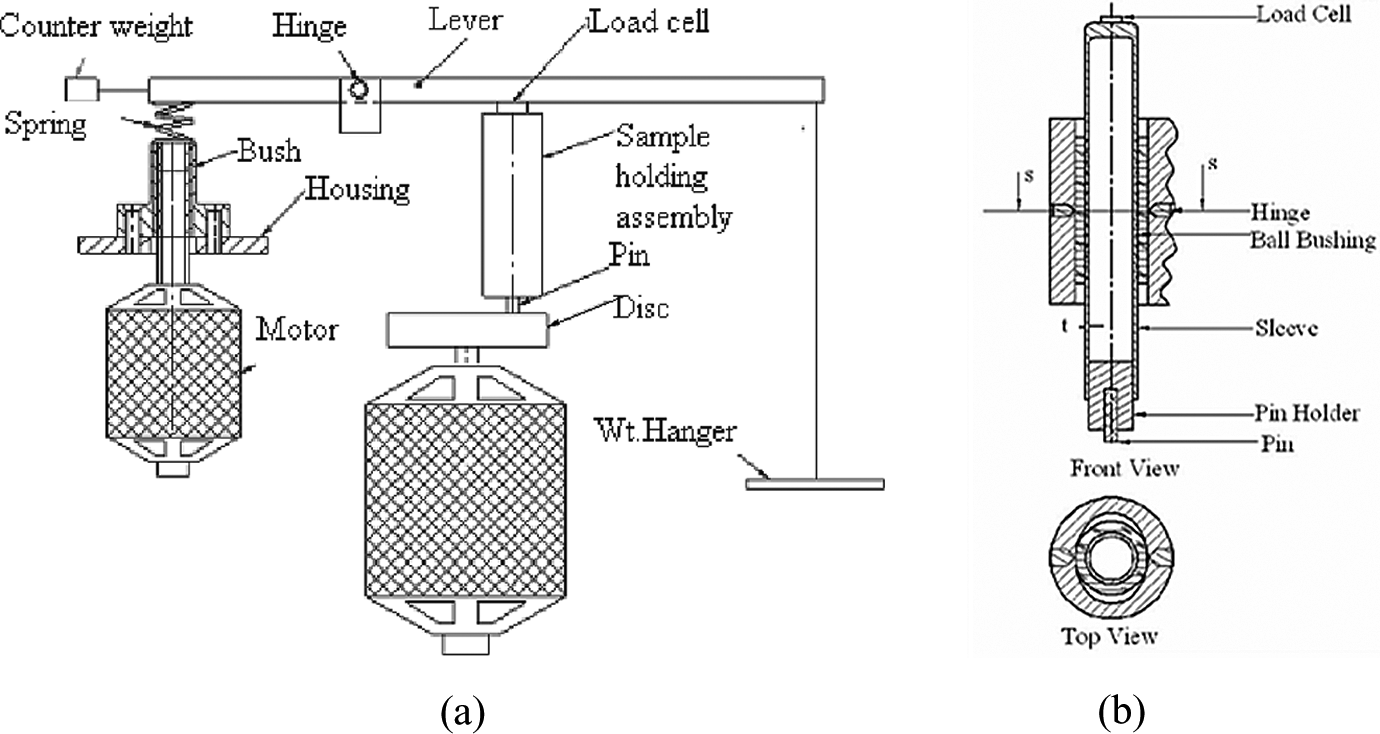
(a) Line diagram of a modified loading arrangement of a pin-on-disc tribometer. (b) Modified pin holding attachment.
A typical run time data of coefficient of friction as a function of time (50 N load, 1.5 m/s velocity) is shown in Figure 2. Design of experiment was carried out to determine the loading range and velocity range. The samples were found to withstand 50 N load and 1.5 m/s velocity.
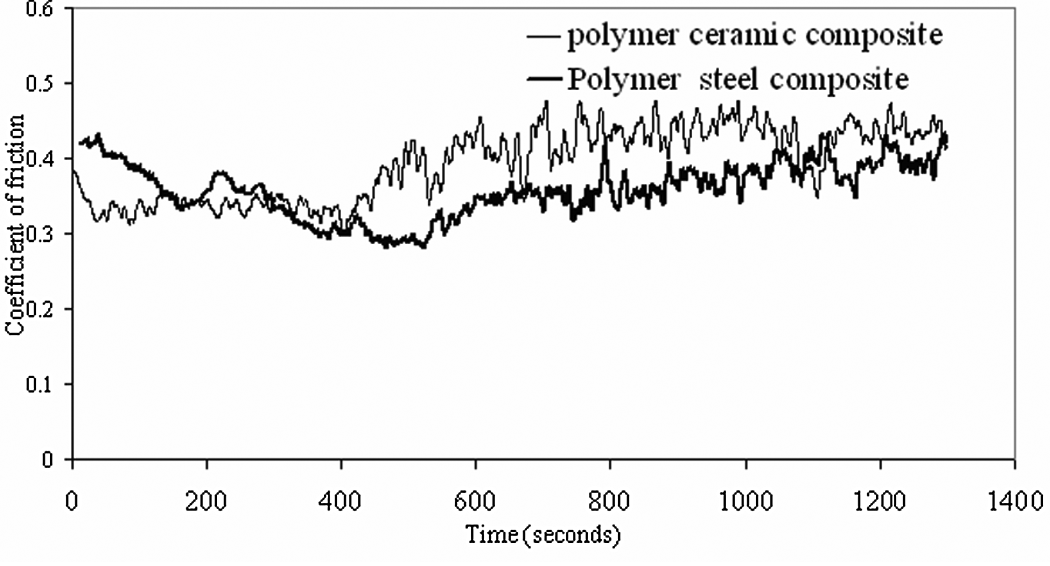
Typical run time data display drawn from data acquired by the data acquisition system.
Results and discussions
Coefficient of friction
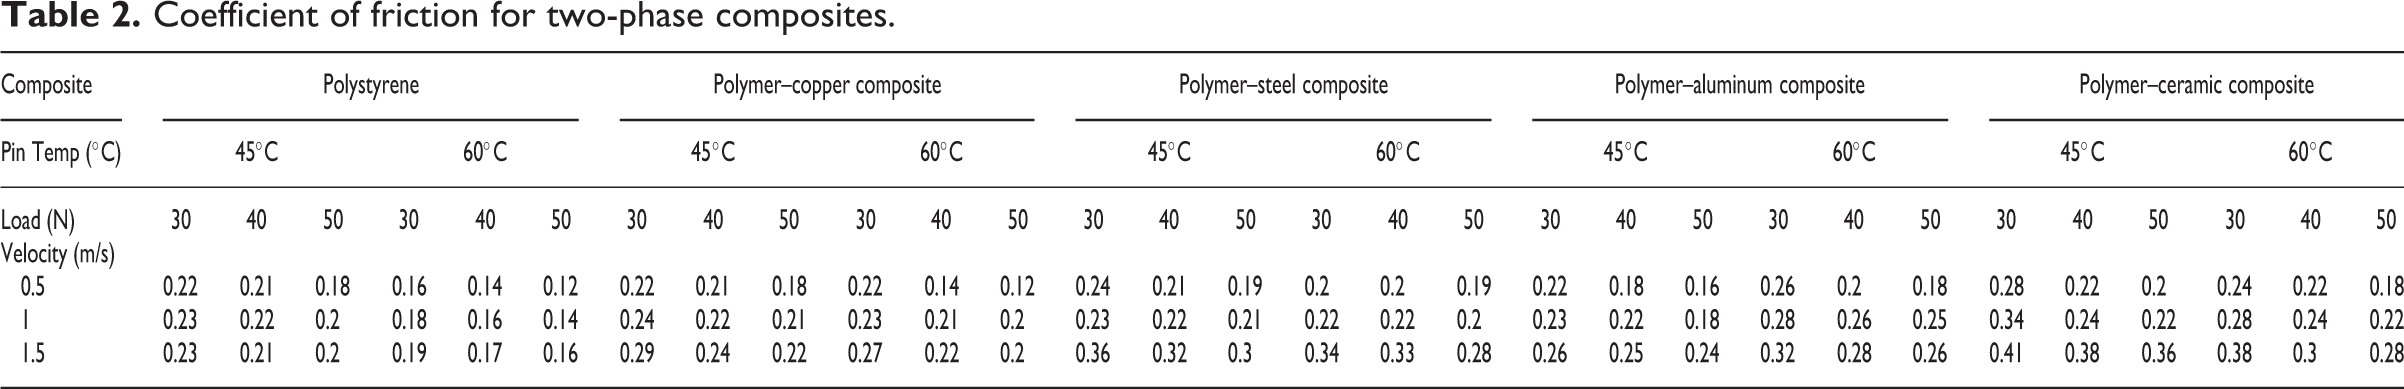
All composites were tested between 30 and 50 N in steps of 10 N load and 0.5 and 1.5 m/s velocities in steps of 0.25 m/s. Tests were conducted at pin temperatures of 45 and 60°C. Wear and friction data of composites tested under ambient conditions has been published. 11 –13 The friction coefficient values at different operating conditions for two- and three-phase composites are shown in Tables 2 and 3.
Coefficient of friction for two-phase composites.
Coefficient of friction of three-phase composites.
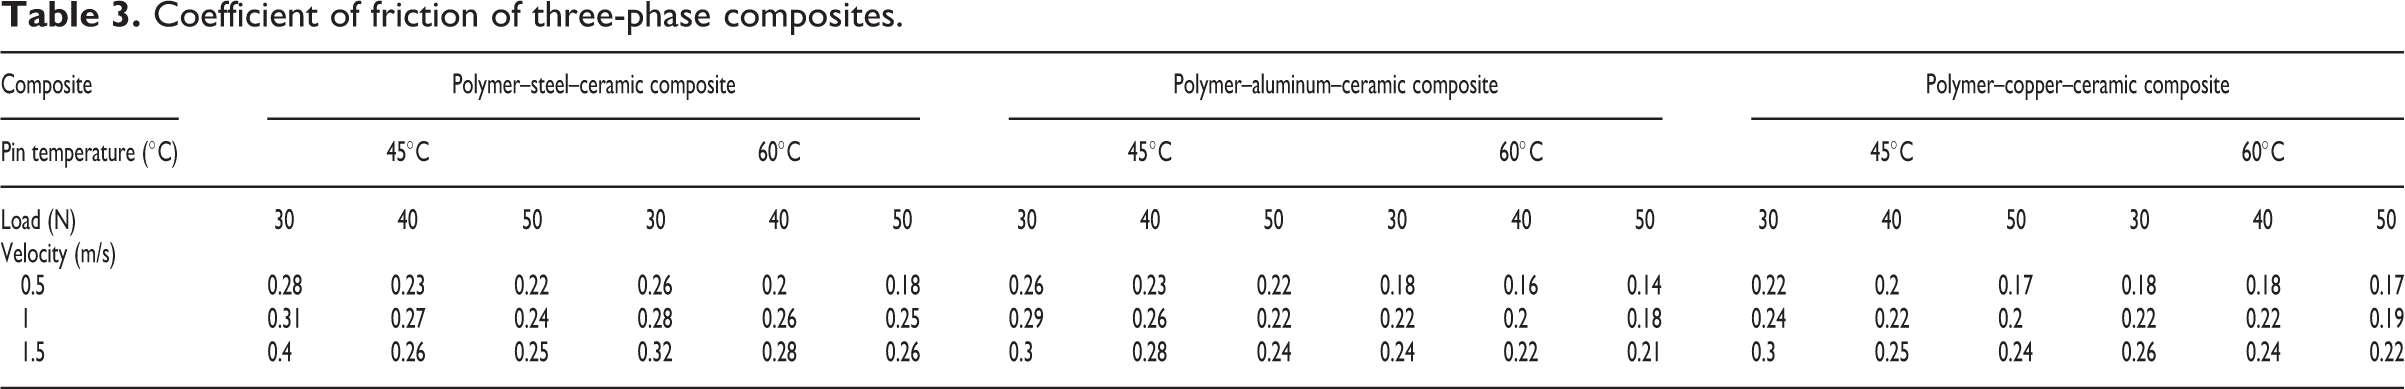
It is observed that, among the two-phase composites, the polymer metal composites have friction coefficient less than the polymer–ceramic composite. The neat polymer has the least friction coefficient. Among three-phase composites, the polymer–steel–ceramic composite has the highest friction values, whereas the polymer–copper–ceramic and polymer–aluminum–ceramic composites have friction values nearly equal. However, friction coefficient of three-phase composites is slightly higher than the corresponding two-phase composites. With increase in temperature from 45 to 60°C, the friction values reduced for all composites and neat polymer.
Specific wear
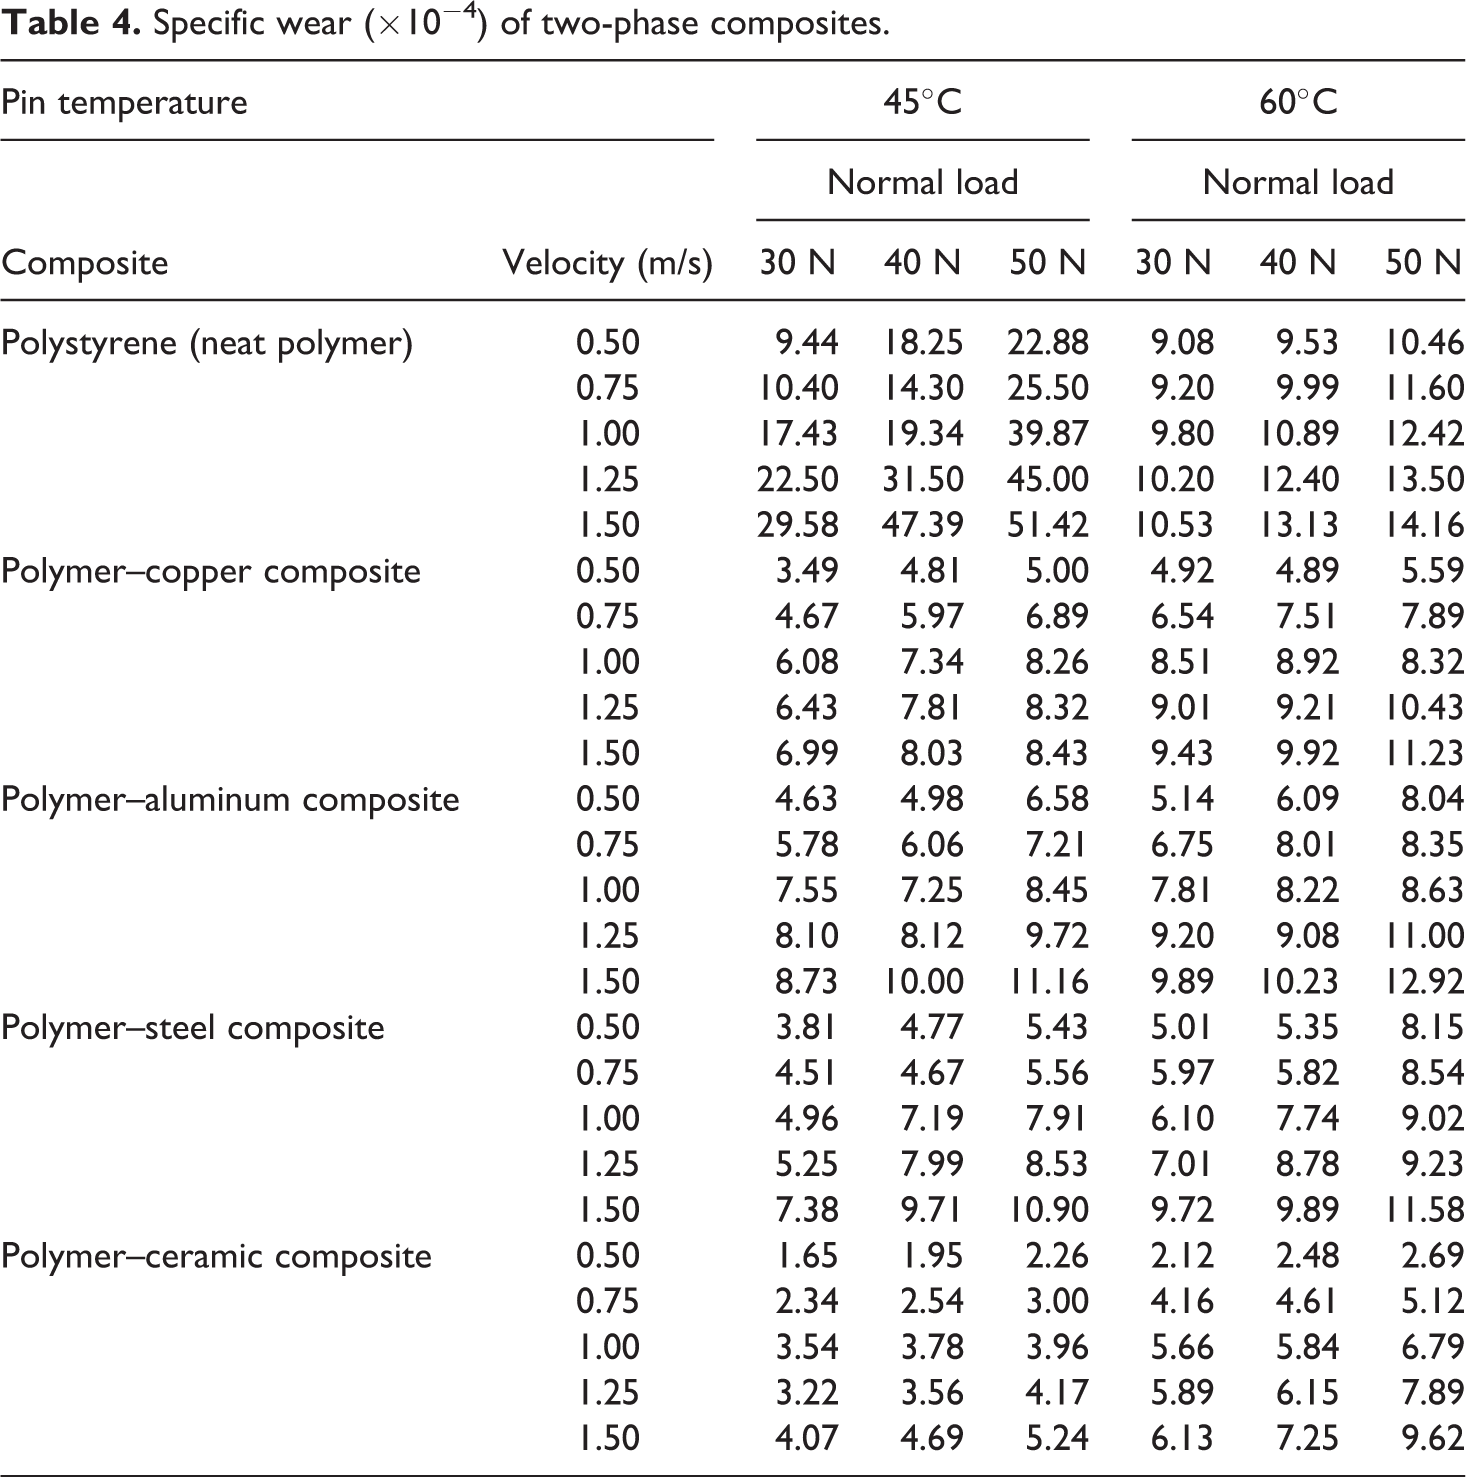
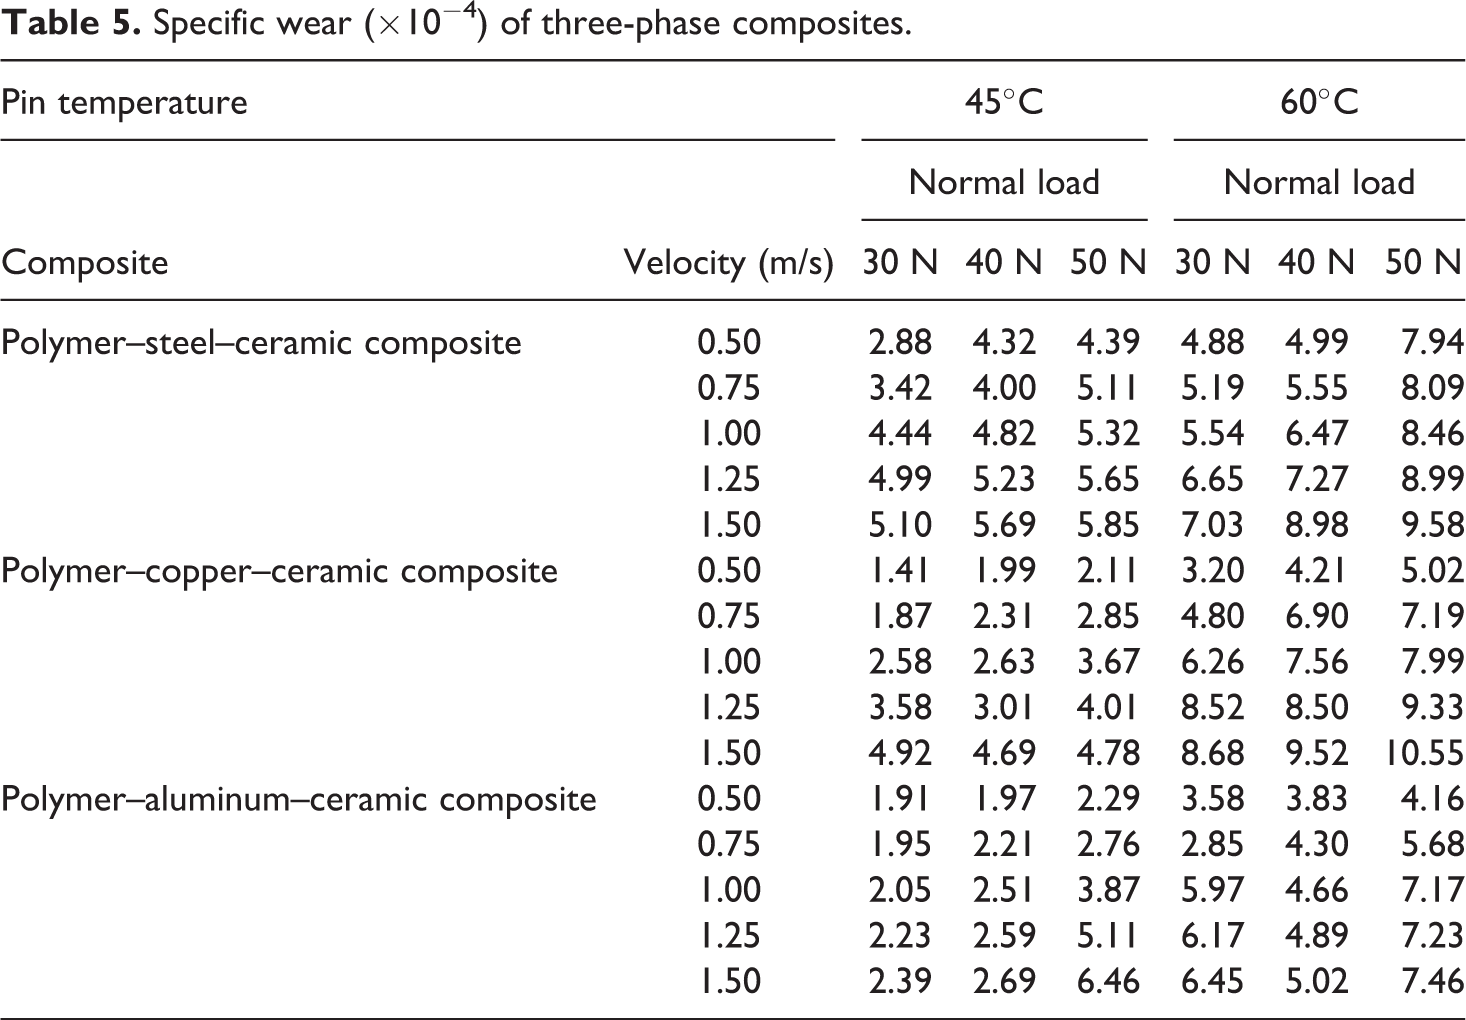
The specific wear (wear coefficient; ×10−4 mm3/Nm) was computed as ratio of volume loss to product of sliding distance and normal load. Tables 4 and 5 show the specific wear of all composites and neat polymer.
Specific wear (×10− 4 ) of two-phase composites.
Specific wear (×10− 4 ) of three-phase composites.
Two-phase composites
The specific wear of polymer copper composite exhibited increase in specific wear from 45 to 60°C. It increased from 8.42 × 10⁻⁴ mm3/Nm at 45°C to 11.23 × 10⁻⁴ mm3/Nm at 60°C. The average relative increase in wear rate in the polymer–copper composite from ambient to 45°C is three fold and from 45 to 60°C it increased by 50%. The specific wear of polymer–aluminum composite is less than that of polymer–copper composite. It exhibited wear rates higher than polymer–steel and polymer–ceramic composites. The composite also exhibited increase in specific wear from ambient to 60°C. The specific wear of polymer–steel composite is less than that of polymer–copper and polymer–aluminum composites. The polymer–steel exhibited wear rates higher than the polymer–ceramic composite. The composite also exhibited increase in specific wear from 45 to 60°C. It increased from 10.897 × 10⁻⁴ mm3/Nm at 45°C to 11.582 × 10⁻⁴ mm3/Nm at 60°C. The specific wear of polymer–steel composite increased on an average of 25% with increase in temperature from 45 to 60°C. The polymer–ceramic composite exhibited the least wear rates compared to other composites. The composite exhibited increase in specific wear from 5.23 × 10⁻⁴ mm3/Nm to 9.62 × 10⁻⁴ mm3/Nm with increase from 45 to 60°C.
The average specific wear of polystyrene, two- and three-phase composites at all loads and velocities for ambient and temperatures above ambient temperatures show that the wear rate variation is non-linear from ambient to 60°C (Figure 3). The slope of specific wear from ambient to 45°C is more than the slope from 45 to 60°C. The decrease of specific wear from 45 to 60°C is similar in polystyrene and the composites.
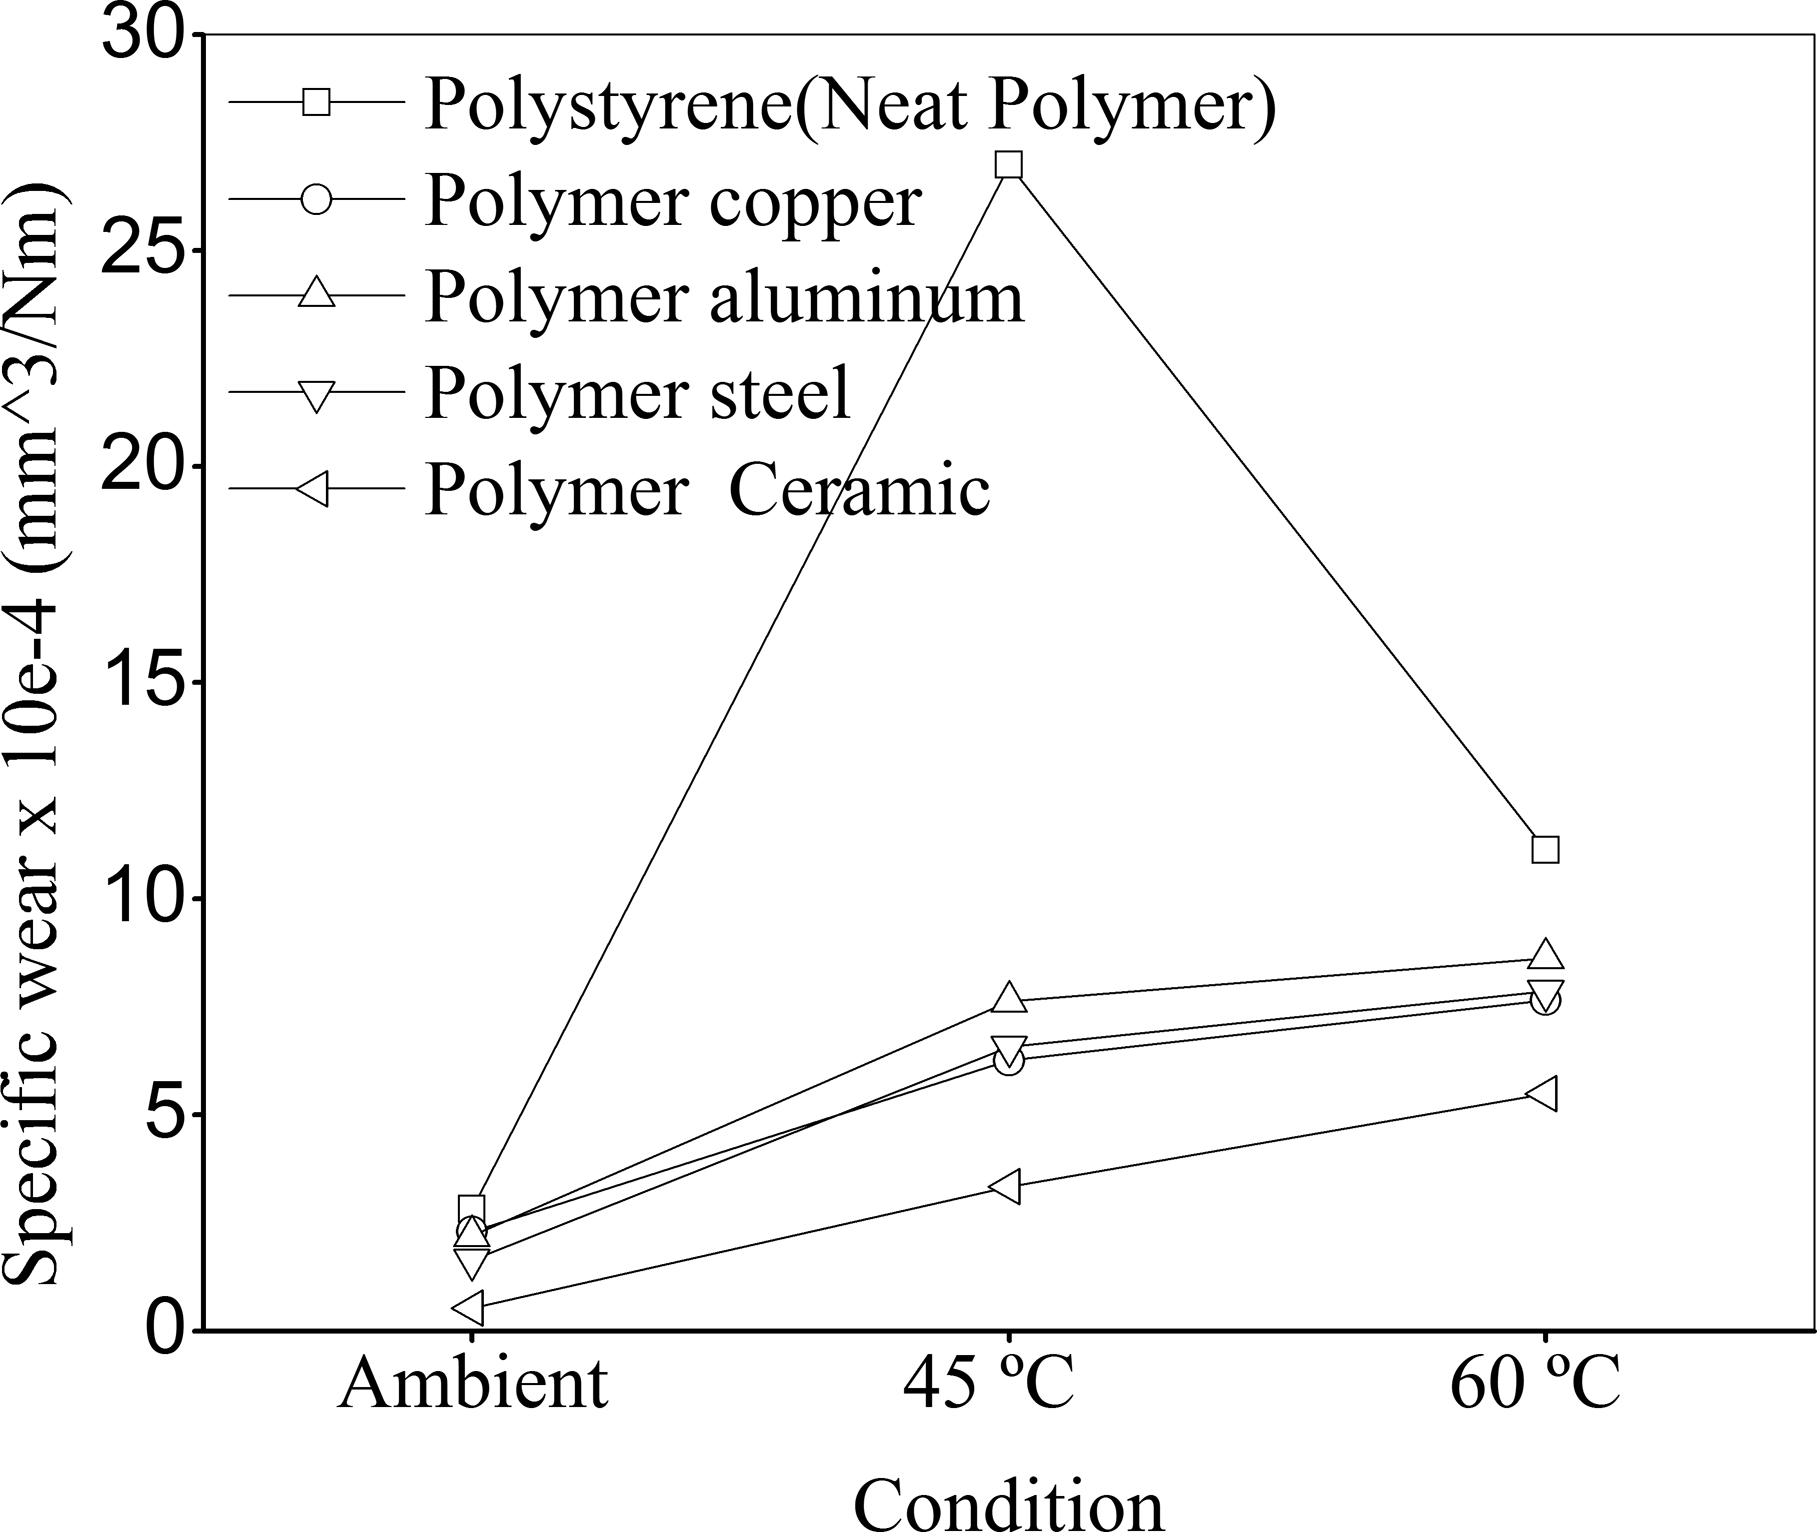
Variation of specific wear as a function of temperature for two-phase composites.
Addition of fillers such as copper, aluminum, or steel powder into polystyrene increases the heat conduction, while addition of ceramic filler increases the friction coefficient and wear resistance. The properties of the filler are critical to the wear behavior of the composite. The mechanism of wear depends on thermal conductivity, specific heat, hardness, density, and the operating conditions such as load, velocity, contact pressure, and so on. Specific heat relates to the ability of a material to store heat, whereas the thermal conductivity is related to the ability of a material to conduct energy through the material. The operating conditions being same, the properties of the filler/composite assist in the analysis of wear of composites. The thermal conductivity of the copper powder is the largest followed by aluminum, steel, and ceramic has the least value. The specific heat of the ceramic is the largest followed by aluminum, steel, and copper has the least value. The hardness of the ceramic is the largest followed by steel, copper, and aluminum.
Three-phase composites
The average relative increase in the wear rate of the polymer copper–ceramic composite from ambient to 45°C is by double and from 45 to 60°C by an average of 1.2 times to that at 45°C. The specific wear at polymer aluminum–ceramic composite at 50 N and 1.5 m/s velocity also exhibited increase in specific wear from 45 to 60°C. It increased from 5.8549 × 10⁻⁴ mm3/Nm at 45°C to 9.58084 × 10⁻⁴ mm3/Nm at 60°C. The increase in wear rate of polymer steel–ceramic composite at 60°C is by 50% of that at 45°C. The specific wear of polymer steel–ceramic composite exhibited increase in specific wear from 45 to 60°C. It increased to 6.46237 × 10⁻⁴ mm3/Nm at 45°C and from 45 to 60°C it increased to 7.4552 × 10⁻⁴ mm3/Nm. From 45 to 60°C, on an average, the wear rate increases by onefold. The specific wear of all composites increased with increase in load and velocity. It is seen that the specific wear increases almost linearly from ambient to elevated temperature of 60°C.
In polymer copper–ceramic composite, the higher thermal conductivity of copper powder allows larger amount of heat to pass through the pin and the temperatures measured along the pin will be higher than the other three-phase composites. Although the ceramic particles tend to prevent wear, larger heat transfer by the copper powder and smaller specific heat of the copper softens up the subsurface and leads to a smaller friction coefficient and reduces the effect of ceramic powder. Hardness of copper powder also does not help the cause. This increases specific wear. At temperatures of 45 and 60°C, the wear rate increases due to increased bulk temperature of the pin. At elevated temperatures, the thermal degradation of the polymer at the interface, which would normally lead to the formation of a transfer film, is disrupted by the fillers and results in increased wear.
In polymer aluminum–ceramic composite the smaller rate of increase in specific wear as a function of velocity in the polymer aluminum–ceramic composite may be associated with the medium value of thermal conductivity and high specific heat of aluminum powder. 14 The high specific heat of aluminum and ceramic powders, good wear resistance of ceramic powder (alumina), and moderate to inferior thermal conductivities of aluminum and alumina powders lead to the reduction in the wear. Thus, the metal and ceramic particles being held in position, the friction coefficient is expected to be higher leading to increased energy consumption at a given specific wear. The specific wear of polymer aluminum–ceramic composite being almost equal to that of polymer–ceramic composite, it is suggested for applications where heat conduction coupled with wear resistance is the requirement.
The polymer steel–ceramic composite exhibited a higher coefficient of friction as compared to polymer copper–ceramic and polymer aluminum–ceramic composite. The observations, higher friction coefficient and increased specific wear in the case of three-phase steel composite, may be explained by the reduced heat transfer through the pin because of lesser thermal conductivity and increased specific wear due to lower specific heat than aluminum. Due to the bulk heating of the pin, the specific wear increases.
The steel–ceramic composite shows higher wear in comparison to polymer aluminum–ceramic composite. The heat transfer rate through the pin would slightly reduce due to reduced thermal conductivity as the temperatures measured along the pin axis are less than both copper and aluminum. Lower specific heat of the steel powder results in increased specific wear. The specific wear is less than that of polymer copper–ceramic composite. This may be due to reduced heat transfer and subsequent reduction in softening of the matrix.
Comparison of two-phase and three-phase composites
The friction coefficient of three-phase composites is higher than their corresponding two-phase polystyrene metal composites but less than polystyrene ceramic composites. The ceramic content reduces thermal conductivity and increases the specific heat, and due to higher hardness of the ceramic, the friction of the three-phase composites increase. This reduces the wear rate. Also, increase in average track width with increase in temperature of the pin from 45 to 60°C at all operating conditions is an indication of increased wear.
With increase in temperatures from 45 to 60°C, the melt and flow increases as shown in Figure 4(a). Similarly, at a given condition (45°C), the variation in the structure of the same class of composites is shown in Figure 4(b).
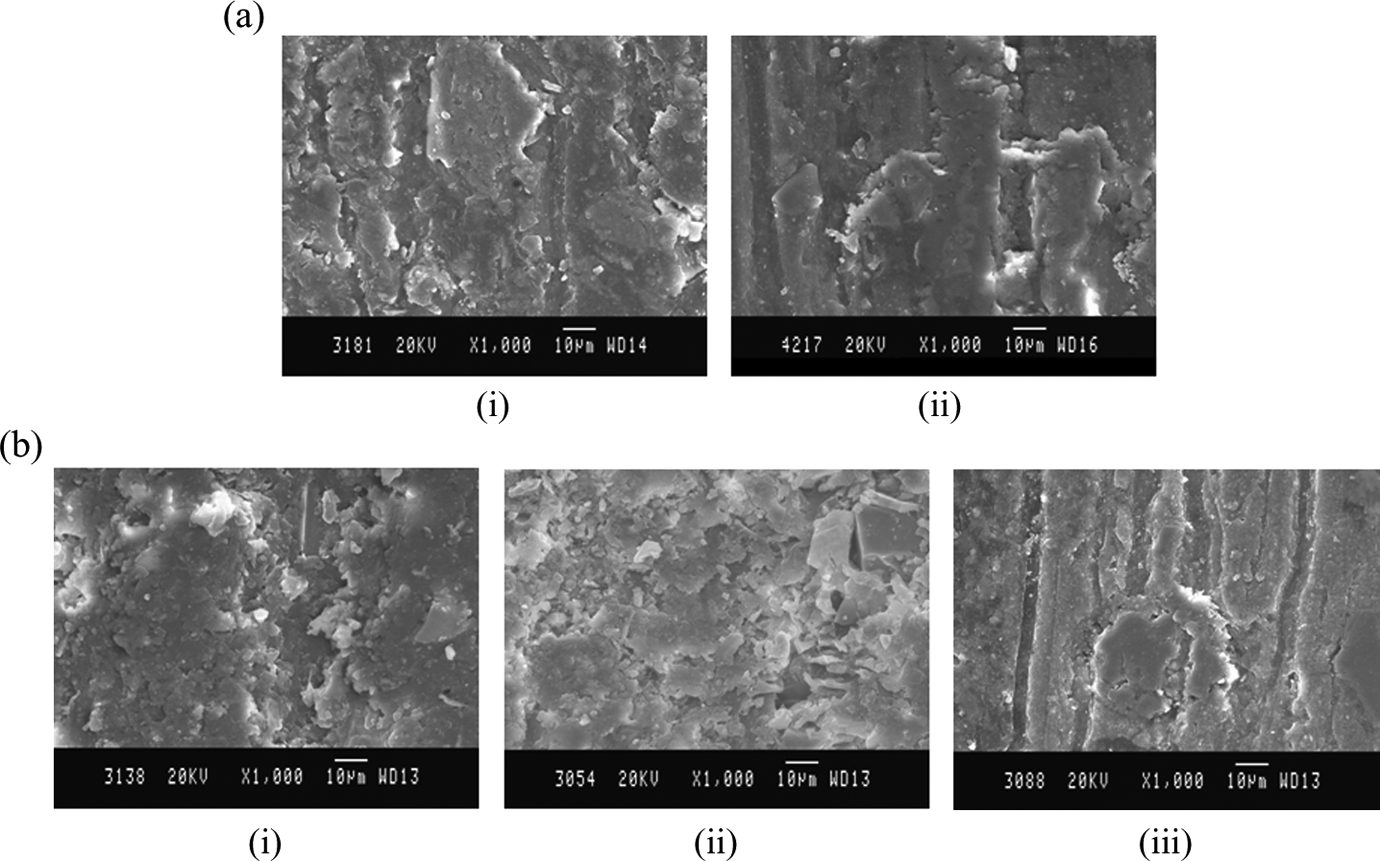
(a) Micrographs with increase in temperature for polymer copper-ceramic composite at (i) 45°C (ii) 60°C pin temperature. (b) Micrographs with change in composition from 50% aluminum to 0% aluminum powder at 45°C pin temperature with (i) 50% aluminum reinforcement (ii) 25% aluminum reinforcement (iii) 0% reinforcement.
Comparison with sliding wear phenomenon in composites with hard particle additions
The decrease of friction coefficient and increase of specific wear with normal load, decrease of friction coefficient with velocity was reported in PTFE matrix with copper fillers. 7 But contrary to their result, the friction coefficient increased with increase in velocity in the present investigations. It is hypothesized that, with increase in velocity, the contact area reduces 11 leading to increased friction.
Additions of SiC into epoxy matrix are found to reduce wear and increase friction has been reported in. 15 This has increased friction coefficient and reduced wear. Similar observations have been made in the present work where in hard alumina particles have been used in the fabrication of two-phase and three-phase-composites.
In the aluminum/SiC metal matrix composite, 16 it is reported that increased pressure on the pin increased the wear rate and decreased the near surface temperatures. Decreased near surface temperatures are due to the lower thermal conductivity of the SiC particles. Similarly in our investigations, the subsurface temperatures recede with reduction in thermal conductivity of the metal and ceramic fillers.
The tribological results on neat PEEK with fiber and graphite-filled PEEK at both ambient and elevated temperatures 10 are found to be similar to our observation. The friction coefficient decreased with increase in bulk temperature of the pin and the specific wear increased with temperature.
The observations on the evolution of temperature along the pin axis in aluminum–silicon alloys, 17 that is, increase in interface temperature (close to the interface) along the pin axis at given load and velocity is similar to that observed in the present case.
Conclusions
The friction coefficient of both two-phase and three-phase composites decrease with increase in pin temperature from ambient to 60°C. Between two-phase and three-phase composites, the friction coefficient of three-phase composites is slightly higher than that of two-phase composites due to addition of ceramic filler. The specific wear increases with increase in pin temperature for all composites except neat polymer. Addition of fillers reduces the specific wear and increases the friction coefficient of both two-phase and three-phase composites. Between two-phase and three-phase composites, the specific wear of three-phase composites is slightly smaller than that of two-phase composites due to addition of ceramic filler. Addition of ceramic fillers reduces the specific wear, whereas the addition of metal fillers increases the specific wear (in comparison to ceramic filler) due to increased heat transfer through the pin. The thermal conductivity, specific heat, and density of the fillers have a role to play in the wear behavior of the composites. The dominant property which would affect the wear behavior of the composite needs further study.
Footnotes
Declaration of Conflicting Interests
The author(s) declared no potential conflicts of interest with respect to the research, authorship, and/or publication of this article.
Funding
The author(s) received no financial support for the research, authorship, and/or publication of this article.