
Abstract
This work focused on the utilization of waste fly ash (FA) as filler in the reinforcement of chlorinated styrene–butadiene rubber (CSBR) with reference to their processing characteristics, morphological, thermal, and mechanical properties, solvent resistance, and electrical resistivity measurements. Rheometric properties such as optimum cure time and scorch time decreases with increase in filler content, whereas maximum torque increases up to 30 phr for FA particles. An appreciable increase in glass transition temperature has been observed from differential scanning calorimetric study. The mechanical properties such as tensile and tear strength, modulus, hardness, compression set, and heat buildup increases, whereas elongation at break and resilience decreases with loading of filler. The observed variation in mechanical properties has been supported by the fractography of the composites obtained by scanning electron microscopy. Variation in the bound rubber formation in CSBR/FA composite has been studied. The bound rubber content decreases with increasing extraction temperature, and its activation energy is also calculated from the Arrhenius plot. The electrical properties such as alternating current conductivity, dielectric constant, and dissipation factor are higher than that of CSBR, and the values increase with increase in the content of FA in the composites.
Keywords
Introduction
Filled elastomers are important class of composite materials for engineering applications because of their unique mechanical properties such as elastic behavior at very large deformation, energy absorbing capability, and so on. 1,2 A wide variety of particulate fillers are used in rubber industry to improve and modify the physical properties of elastomeric materials. The addition of filler usually leads to increase in modulus and significant abrasion and tear resistance. Although the mechanisms of reinforcement are not fully understood, there is a general agreement about the basic process contributing to the stress–strain behavior of the filled vulcanizate. 3 –7
In the recent past, price escalations combined with the sporadic and possible future shortage of resins and petroleum feedstock have hinted at an urgent need for more economical utilization of fillers. Many types of fillers are used for the enhancement of mechanical properties. Carbon black is the most widely used filler in rubber industries due to its higher surface area and particulate nature, which imparts high reinforcing ability. 8 But, nowadays, more attention is being paid to nonblack mineral fillers like silica, 9 clay, 10 and mica 11 due to high prices and monotonous color of carbon black. In search of reducing cost of composite, new materials are being considered to replace totally or partially the conventional ones as a simple economical measure or to impart some desirable properties. 12 –15
Many attempts have been made to use silica from the natural resources as alternative reinforcing filler in natural and synthetic rubbers because of cost savings, good mechanical properties, better dimensional stability, and environmental issue. Silica has a number of hydroxyl groups on the surface, which results in strong filler interaction and absorption of polar materials by hydrogen bonding. 16 Since intermolecular hydrogen bonding between hydroxyl groups on the surface of silica is very strong, it can form tight aggregates. 17,18 The way to avoid aggregation is to improve the compatibility between silica and rubber in order to reduce the silica migration. Hence, hydrated silica imparts better physical properties to polar synthetic rubbers than it does not to nonpolar rubbers like natural rubber, styrene–butadiene rubber (SBR), and so on and is used to produce colored articles that require high strength properties. 19
The environmental problem due to fly ash (FA) is a major concern these days. Due to thermal electricity generating plants, its production is very huge in India. There are many conventional ways such as using the produced FA in construction and agricultural sectors to reduce environmental pollution. 20,21 But these methods utilize FA in a very low percentage of production; the remainder is being disposed in landfills causing serious environmental problems. 22,23 Due to environmental regulations, new ways of utilizing FA have to be explored in order to safeguard the environment and provide useful ways for its disposal. Since FA and chlorinated SBR (CSBR) are polar, good filler rubber adhesion would be expected. This article therefore aims at investigating the feasibility of using waste FA as filler in CSBR matrix with reference to their cure characteristics, mechanical properties, and thermal, morphology, and electrical properties. The reinforcing nature of the filler is determined from swelling studies. The variation in bound rubber content of FA-filled CSBR and the effect of temperature with the filler content ratio are evaluated.
Experimental
Methods
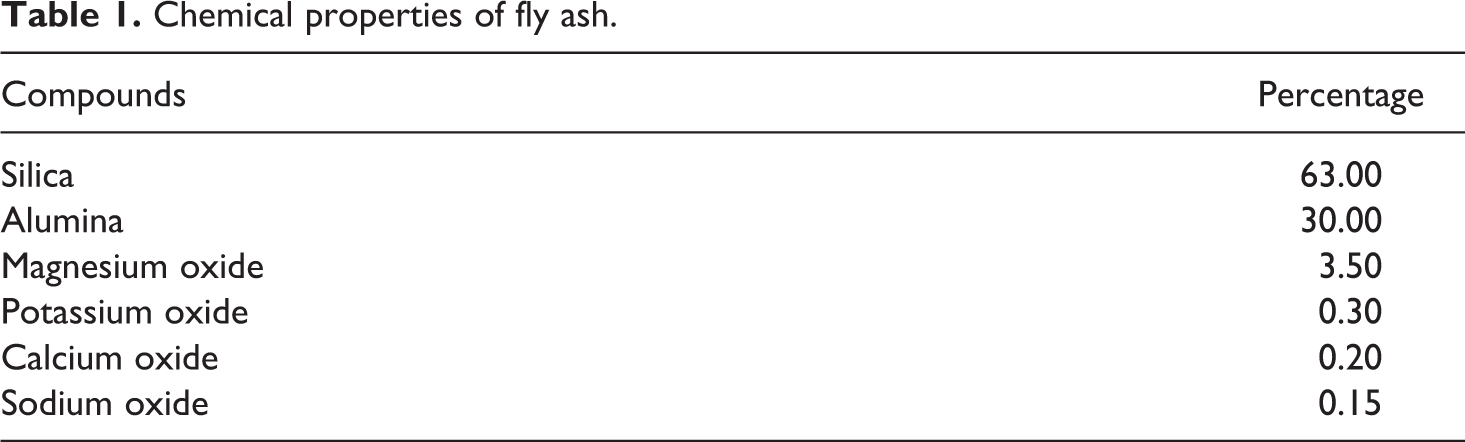
CSBR with 10% chlorine content was prepared in situ from chloroform and aqueous caustic soda using phase transfer catalysis. 24 FA having particle size ranging from 0.5 to 5 μm is procured from Thermal Power Station (Bhusaval, Maharashtra, India). Table 1 shows the chemical property of FA. Compounding ingredients such as zinc oxide, stearic acid, N-cyclohexyl-2-benzothiazole sulfenamide, 2,2,4-trimethyl-1,2-dihydroquinoline, tetramethylthiuram disulfide, and sulfur are of commercial grade obtained from local rubber chemical suppliers. CSBR composites are prepared by adding various amounts (10, 20, 30, 40, and 50 phr) of FA in a two-roll mixing mill and the basic formulation used in the study is given in Table 2.
Chemical properties of fly ash.
Recipe for FA-filled CSBR.
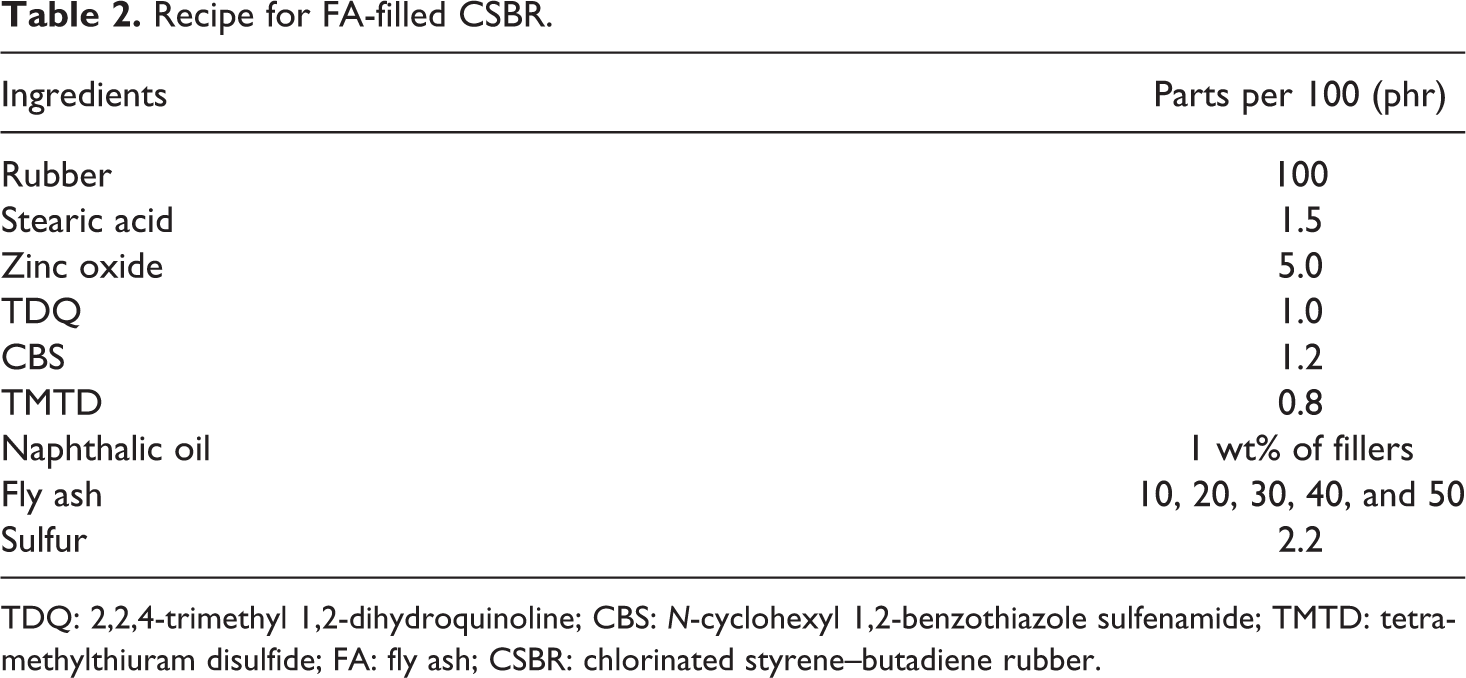
TDQ: 2,2,4-trimethyl 1,2-dihydroquinoline; CBS: N-cyclohexyl 1,2-benzothiazole sulfenamide; TMTD: tetramethylthiuram disulfide; FA: fly ash; CSBR: chlorinated styrene–butadiene rubber.
Characterization
Rheometric properties are studied using a moving die rheometer (MDR 2000, Alpha Technologies Japan) according to ASTM D 2084-93 at 150°C. Cure rate index (CRI) is measured according to the relevant ASTM standards. The samples are vulcanized to their respective cure time in a hydraulic press at 150°C and a pressure of 6.7 MPa on the mold. The different physical properties of the vulcanized samples are analyzed as per the relevant ASTM standard and details are given in Table 3. The volume fraction (V r) and cross-link density of the rubber composites are estimated from swelling measurements. 25,26
Details of the analysis of vulcanized composites.
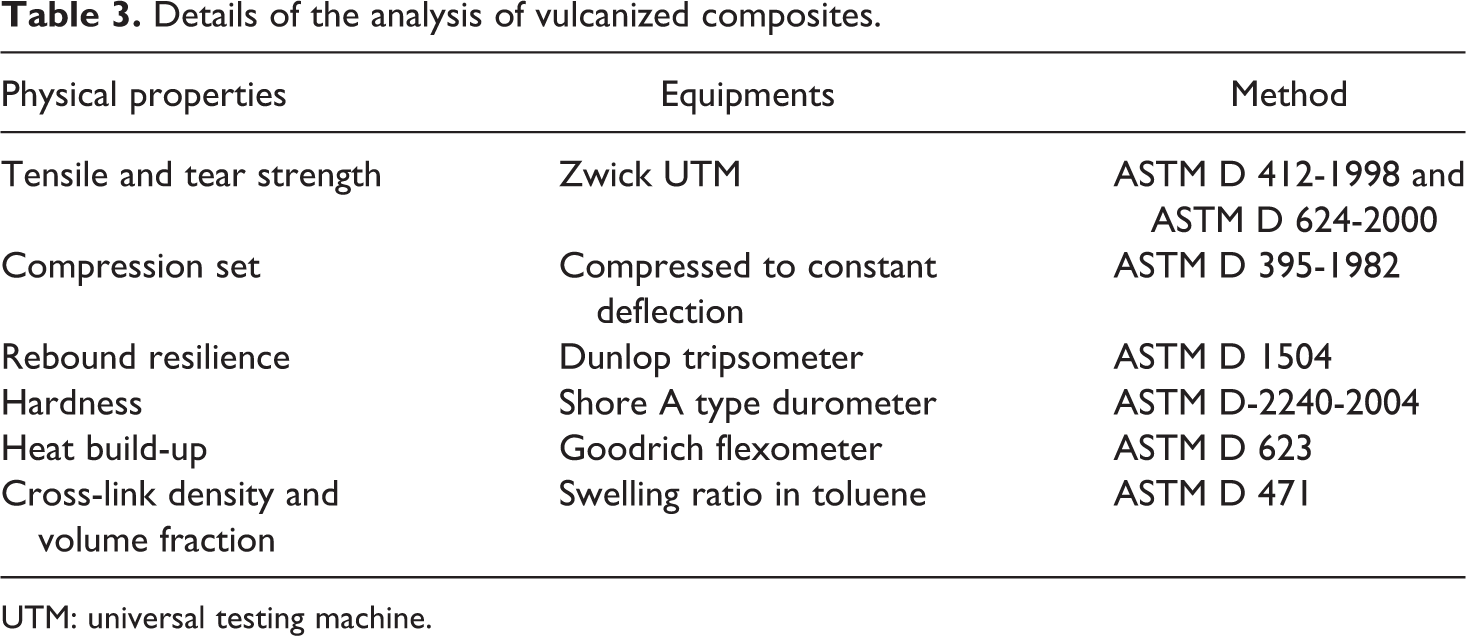
UTM: universal testing machine.
Surface morphology
Studies on the morphology of tensile fractured surfaces of the composite are carried out using variable pressure field-emission scanning electron microscopy (FESEM; model SU 6000, Hitachi, Tokyo, Japan). The fractured end of the specimen is sputter coated with a thin layer of gold to avoid electrostatic charging during the SEM analysis.
Differential scanning calorimetry
The changes in glass transition temperature (T g) of the composites are noticed using differential scanning calorimetric (DSC) thermal analyzer (Perkin–Elmer, Waltham, Massachusetts, USA). For the DSC analysis, about 5 mg of the samples are heated from −80 oC to 40oC under nitrogen atmosphere with a programmed heating rate of 10°C min−1.
Bound rubber content
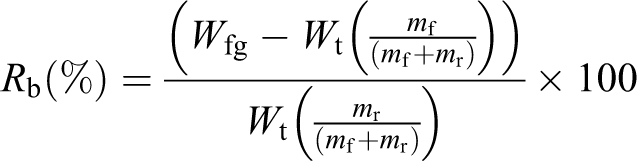
The bound rubber is determined by extracting the unbound material such as ingredients and free rubber with toluene for 7 days and in n-heptane for 1 day and drying for 2 days at room temperature. The experiments are performed at 30, 50, 70, and 90°C using conventional oven. Weights of the sample before and after extraction are measured, and bound rubber content is calculated using the following equation.
Conductivity studies
Alternating current (AC) electrical resistivity of the samples is measured using a fully automated inductance–capacitance–resistance meter (Hewlett–Packard, USA) in the frequency range of 100–106 Hz at room temperature. The composites are pressed to form pellets of 10 mm diameter and 2–2.5 mm thickness by applying pressure of 90 MPa in hydraulic press.
Results and discussion
Rheometric properties
The rheometric characteristics and thus processability of composites have been studied from the rheometer, and the parameters are shown in Table 4. The maximum torque from the rheometer is a measure of cross-link density and the stiffness of the polymer matrix. It is observed that the composite with 30 phr FA shows higher torque value than 40–50 phr FA-filled CSBR. This is due to the strong interfacial and intertubular adhesion between the filler and the polymer. In other words, the interfacial interaction between the aluminol and silanol groups on the surface of FA with the polar group of polymer matrix would reduce the mobility of macromolecular chain of polymer and subsequently increased the stiffness and modulus of composites. 27 Minimum torque value is observed for the unfilled sample, which has minimum reinforcement effect due to the free movement of the polymer chains. The variation in optimum cure time value with filler loading is given in Table 4. As the filler content increases, the optimum cure time value decreases due to the formation of conductive chain between the FA particle and CSBR. 28 Another interesting observation is that the extent of cure or Δ torque value is intense for 30 phr loading of FA and is due to the polar–polar interaction between the filler and the polymer leading to homogeneous mixing of filler in the polymer matrix. The CRI is increased with increase in filler loading, which indicates that the FA particles increase the rate of curing of FA/CSBR composite. At higher loading (50 phr FA), a deactivation of the cure process is observed due to an increase in the CRI values, resulting in a poor interfacial interaction between rubber and the filler confirming the tendency of the filled compounds to form filler agglomerates. This factor is explained with the help of SEM analysis.
Processing characteristics of fly asFA-filled CSBR composites.
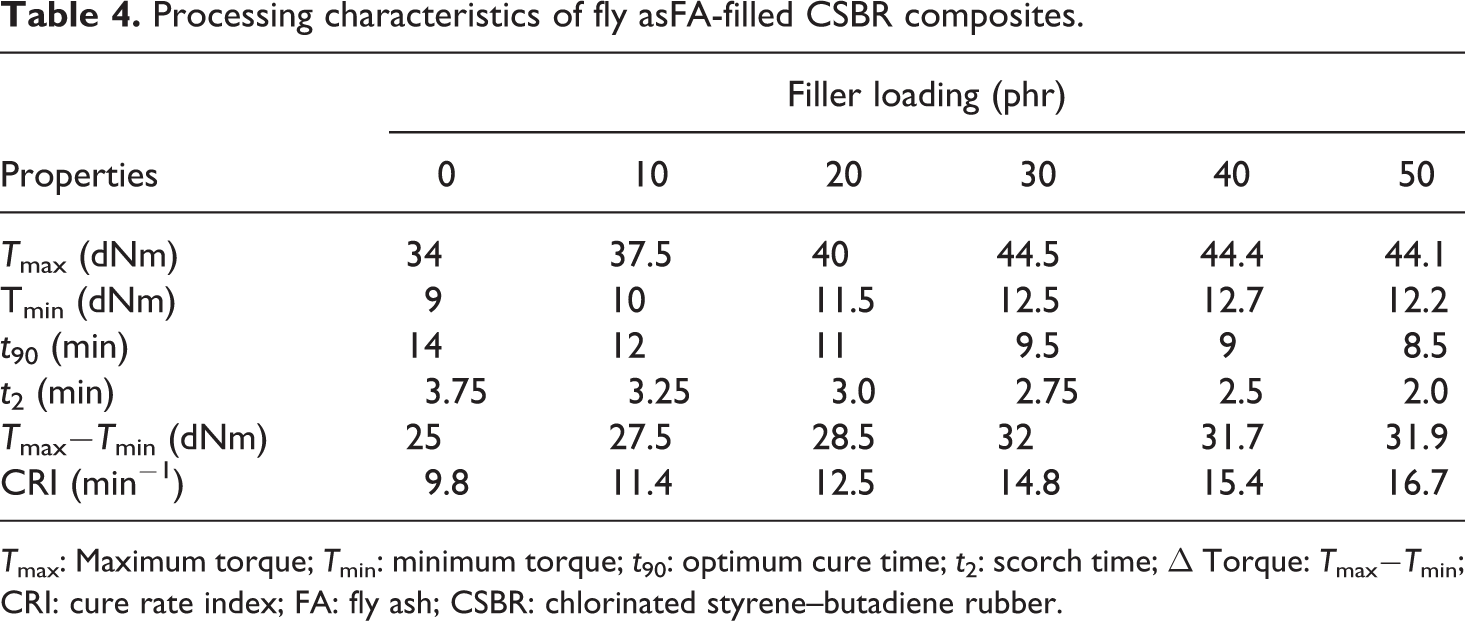
T max: Maximum torque; T min: minimum torque; t 90: optimum cure time; t 2: scorch time; Δ Torque: T max−T min; CRI: cure rate index; FA: fly ash; CSBR: chlorinated styrene–butadiene rubber.
Mechanical properties
Interaction of FA on mechanical properties of CSBR composite is presented in Table 5. Tensile strength deserves a prominent place among the mechanical properties of composite, since the product having high tensile strength seems to perform well in daily service. It can be seen from Table 5 that the tensile strength of the samples increases up to a filler content of 30 phr followed by a decrease at still higher loading. The initial increase in tensile strength is due to the good filler–rubber interaction as a result of better filler dispersion in the rubber matrix. Strong rubber–filler interaction would increase the effectiveness of the stress transferred from rubber matrix to filler particles that ultimately result in the uniform dispersion of filler in polymer matrix. However, the reduction in strength after 30 phr filler loading is due to the agglomeration of particles that leads to highest viscosity of the composite which can be proven later by SEM studies. After the threshold value, the reinforcing nature of the filler gets counteracted and is finally dominated by a dilution factor. Modulus value is increased with increase in concentration of FA up to 30 phr, thereafter the value is slightly decreasing. The increased modulus is an evidence of a strong interaction between the CSBR and FA particles, which result from the improved adhesion of the macromolecular chain and the silanol group of FA. Tear strength is an important property that contributes toward resistance to crack growth. As the dosage of filler in polymer increases beyond a certain limit, the composite tends to tear during production as well as in service. Table 5 shows the effect of FA on the tear strength of CSBR vulcanizates. Beyond 30 phr of FA content in CSBR, the tear value decreases. This may be attributed to the increasing agglomeration tendency of FA particles in polymer matrix resulting in the inferior reinforcing effect and weak interaction of FA with CSBR. Elongation at break of CSBR composites with various loading of FA are given in Table 5. Addition of FA in the polymer reduces the elongation at break of the composite. Reduced elongation at break is considered as criteria for higher filler reinforcement. 29 The decrease in elongation at break also due to the attractive forces between the filler and rubber leads to the formation of cross-linked network structure that restricts the free mobility of the polymer chain and thus increases the resistance to stretching upon the application of strain. Hardness (Table 5) of material is a complex property that indirectly depends on the dosage of filler and the mechanical properties. Hardness of vulcanizate is usually expected to increase by the use of fillers. 30 Compression set values of FA/CSBR composites are given in Table 5. Normally nonreinforcing filler is expected to show lower compression set values as compared to reinforcing filler. In the present study, the set values are increased with increase in loading of filler particle (up to 30 phr), which is due to the better interfacial interaction between polar groups of filler and the polar part of CSBR. Heat buildup of an elastomer results from the internal friction between the polymer and filler that increases with increase in the loading of fillers. Rebound resilience values obtained using a Dunlop tripsometer (Alfatek Services, Trivandrum, Kerala, India) are presented in Table 5. The gum vulcanizate exhibits high resilience compared with FA-filled CSBR. Also, the resilience decreases with increase in the concentration of filler; this is expected since the addition of fillers in polymer normally reduces the resilience. It is proved from the theory of rubber technology that reinforcement increases the hardness of the samples while resilience decreases.
Mechanical properties of CSBR/FA composites.
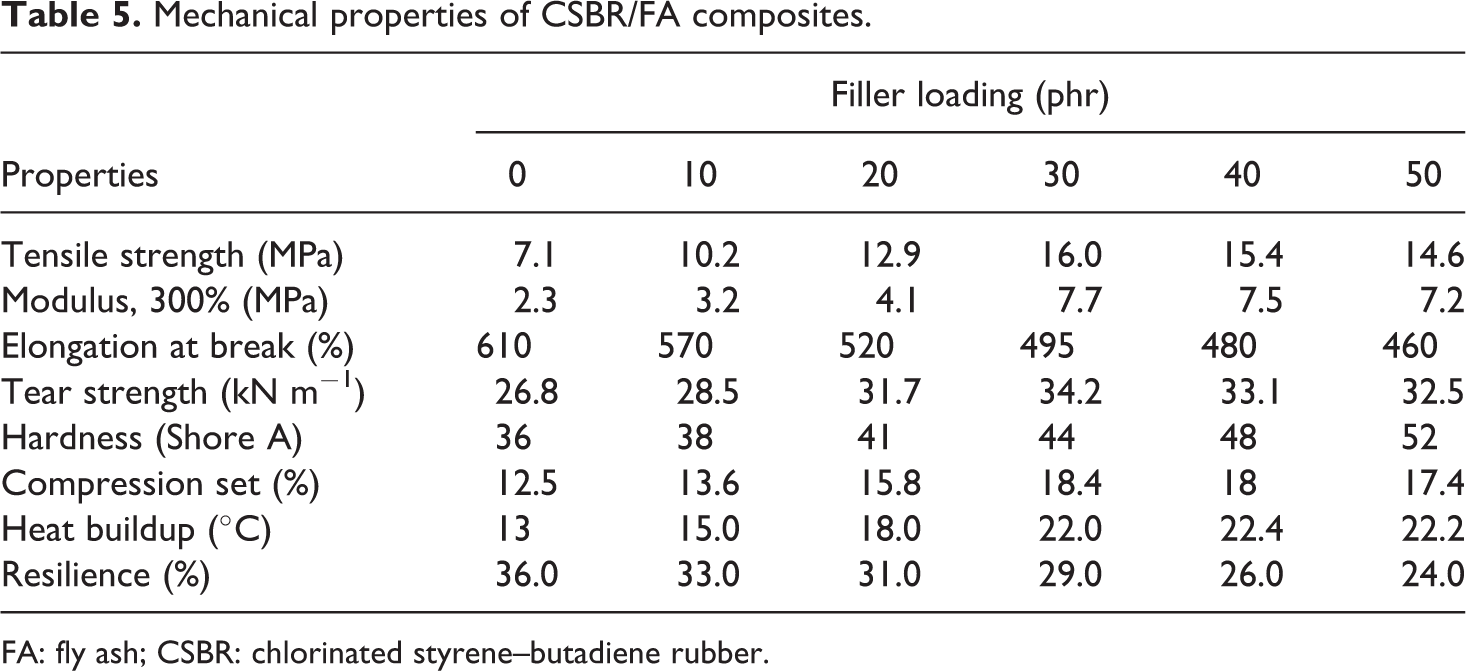
FA: fly ash; CSBR: chlorinated styrene–butadiene rubber.
Scanning electron microscopy
Figure 1 shows SEM images of the dispersion of different dosage of fillers in CSBR. In the case of lower concentration of FA, there is some unequal distribution of fillers on the fracture surface of the composites, which suggests that the interfacial interaction between the FA and polymer is weak. The fractured surface of the composite becomes uniform with increasing the dosage of filler (30 phr), indicating that the filler is uniformly distributed in the rubber matrix (Figure 1(c)). Owing to the reduction in interfacial tension in this composition, there is also an improved polymer–filler interaction and more uniform distribution of FA in polar CSBR. These results are also in good agreement with mechanical properties of the composite. As the concentration of filler increases to 50 phr, surface of the composite becomes coarser indicating that the resistance of composite to external force is bigger, which leads to greater stress concentration (Figure 1(d)) resulting in the agglomeration of the FA particles.
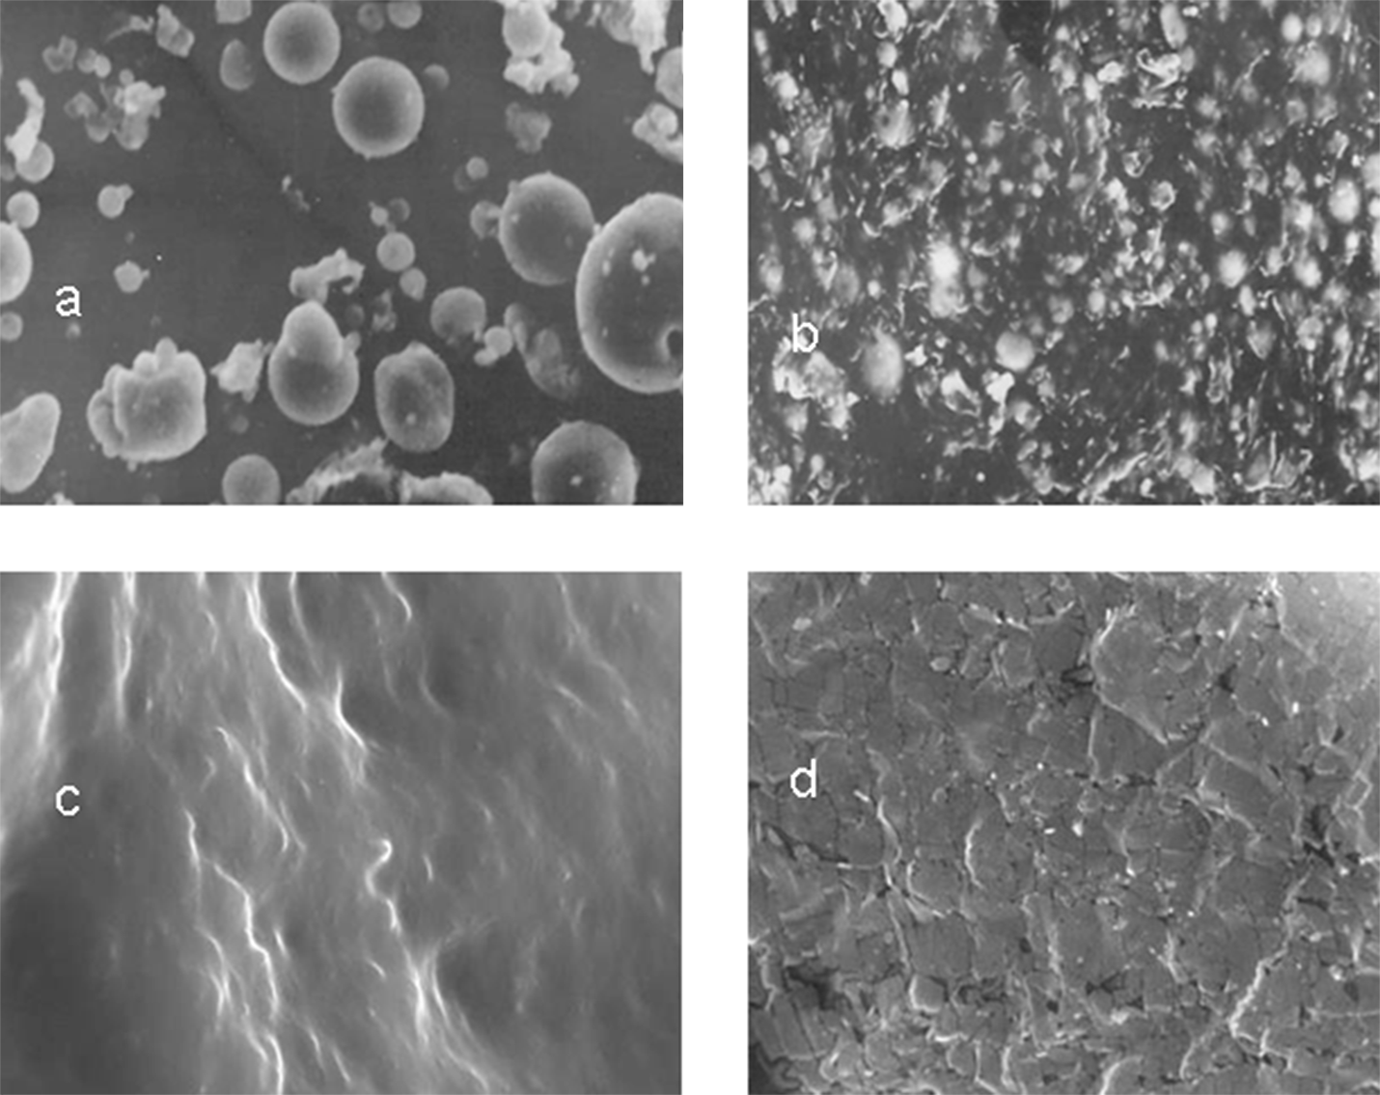
Scanning electron micrographs of (a) FA, (b) 10 phr, (c) 30 phr, and (d) 50 phr of FA-filled CSBR composites. FA: fly ash; CSBR: chlorinated styrene–butadiene rubber.
Differential scanning calorimetry
The influence of filler content on the T g of FA-filled CSBR is depicted in Figure 2. CSBR shows two thermal transitions: one at −53°C corresponding to the T g of SBR and another at −35.1°C corresponding to the T g of chlorinated unit of SBR. 31 It can be seen that T g of CSBR increases from −35.1 to −33.6°C by adding 20 phr of FA particles. As the loading of filler increases further (40 phr), the T g of the rubber increases to −32.5°C. The increase in T g of polymer composite may be due to the restriction of polymer chain mobility as a result of the interaction between filler and CSBR. T g of a polymer composite depends on the segmental motion of polymer chain, size of the filler, and the interaction between the polymer and filler interface. 32 Increment in T g shows better polymer filler interaction in the composites.
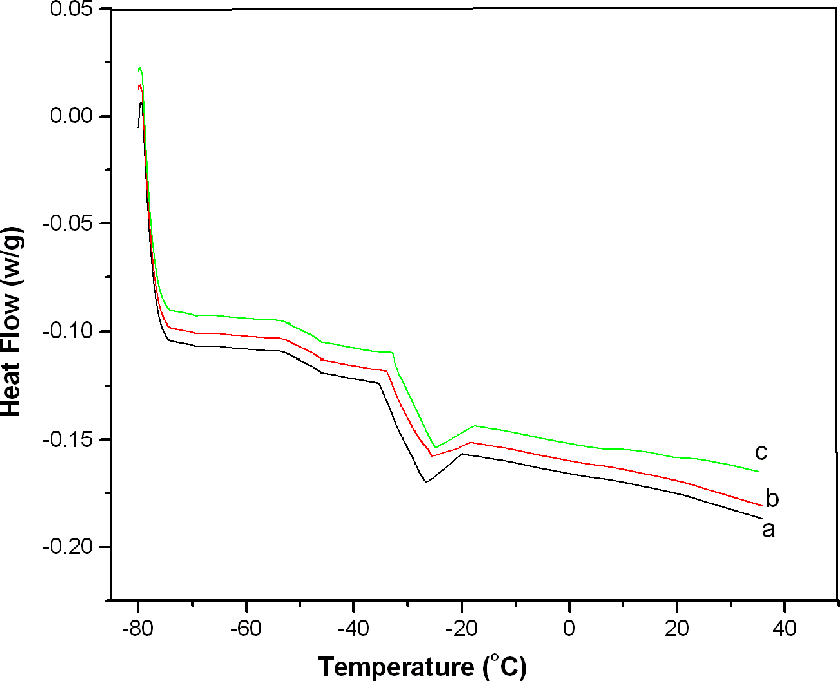
DSC thermograms of (a) CSBR, (b) 20 phr, and (c) 40 phr FA-filled CSBR. FA: fly ash; CSBR: chlorinated styrene–butadiene rubber; DSC: differential scanning calorimetry.
Calculation of cross-link density from swelling behavior
The cross-link density values obtained from swelling data for CSBR/FA composites are given in Table 6. The value of V r is found to be increased with increase in concentration of FA up to 30 phr loading; this is because of the restriction of swelling that causes an increase in V r. It should be noted that studies on equilibrium swelling of filled rubber vulcanizate are usually conducted, assuming that the presence of filler does not alter the polymer–solvent interaction considerably. 33 It can be seen from Table 6 that the cross-link density is found to be maximum in 30 phr FA containing CSBR and this is in good agreement with SEM and mechanical properties.
Cross-link density from swelling studies and E a for the bound rubber content of FA/CSBR composite.
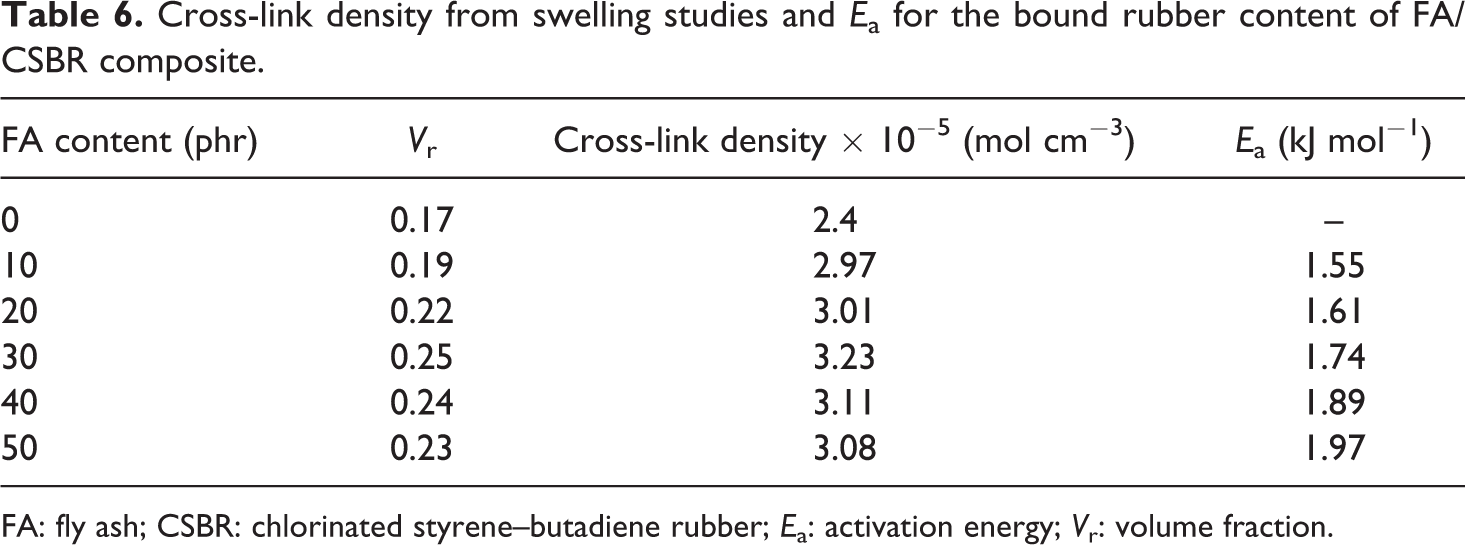
FA: fly ash; CSBR: chlorinated styrene–butadiene rubber; E a: activation energy; V r: volume fraction.
Bound rubber
Bound rubber content of the FA-filled CSBR compounds with various loading of filler is given in Figure 3. It is evident from the figure that the bound rubber content increases with increase in concentration of filler, whereas the value decreases with increase in temperature. For a given elastomer, the amount of bound rubber at constant filler content depends on various factors such as surface area, structure, and surface activity of filler state at the level of mixing and storage maturation of the composite. 34 The chemical structure and macromolecular characteristics of rubber are also important parameters affecting bound rubber content. In the present study, good interfacial interaction between FA and polymer through polar interaction is the key factor for the increase in bound rubber content. The notable decrease in bound rubber content with increase in temperature may be due to the low binding energy of the loosely bound rubber.
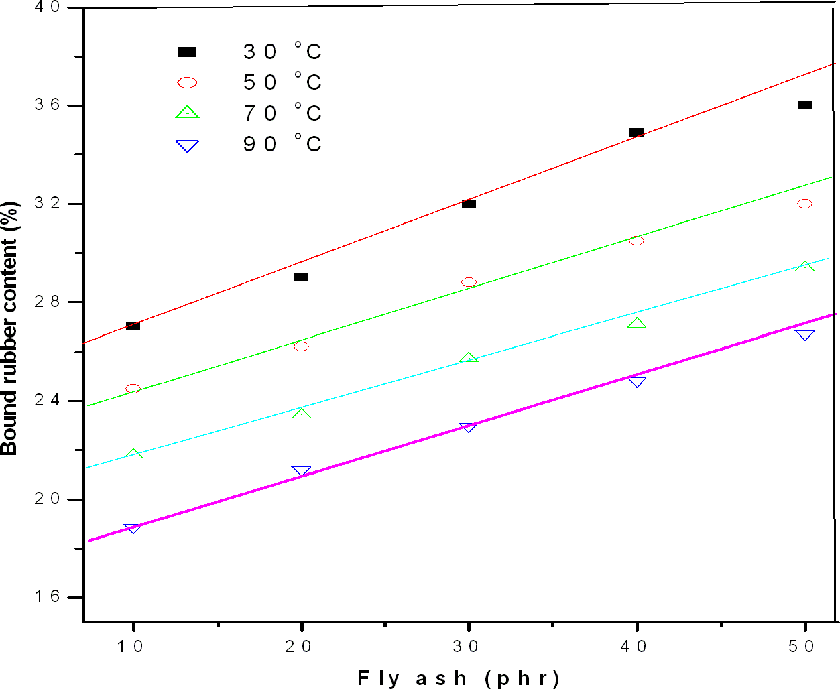
Variation in bound rubber content of FA/CSBR composites. FA: fly ash; CSBR: chlorinated styrene–butadiene rubber.
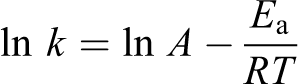
The bound rubber content is measured by extracting the unbound rubber with a good solvent. The extraction rate increases with increase in temperature, and it can be plotted using the following Arrhenius equation
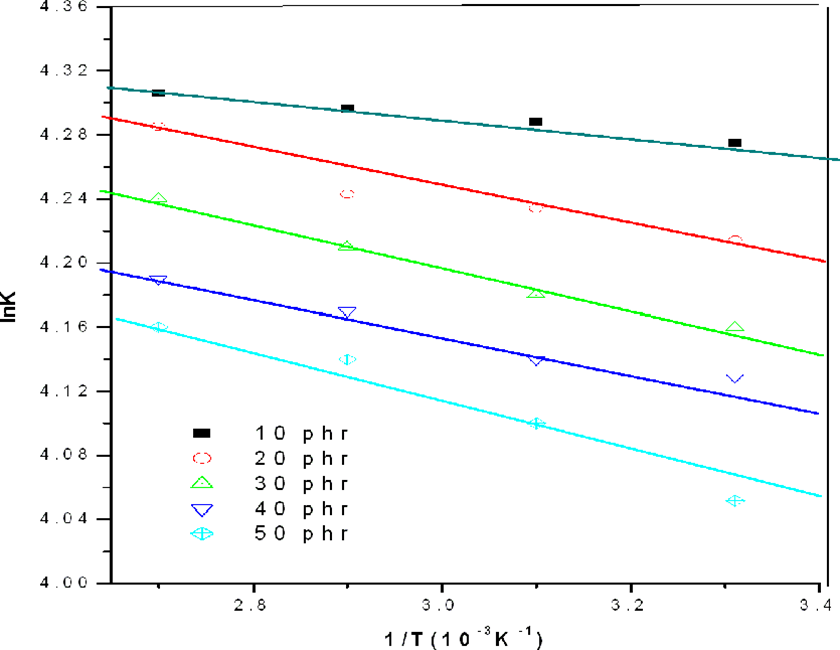
Arrhenius plots for the extraction of the unbound and loosely bound rubber of FA-filled CSBR composites. FA: fly ash; CSBR: chlorinated styrene–butadiene rubber.
Conductivity studies
AC electrical conductivity
Figure 5 depicts the AC electrical conductivity of FA-filled CSBR composite at different frequencies. It is evident from the figure that AC conductivity of all the composites is significantly higher than the parent polymer. It is found that conductivity increases not only with increase in frequency but also with the dosage of FA in the polymer. Furthermore, almost all the composites show similar behavior up to 104 Hz, namely, there is not much variation in the conductivity with frequency during this range. The total conductivity of the composite depends on the microscopic and macroscopic conductivities. The microscopic conductivity depends upon the interaction of molecules, chain entanglements, and so on, whereas the macroscopic conductivity depends on the homogeneities in the composites and orientation of microparticles in the polymer composites. An optimal dosage of 30 phr FA-filled CSBR showed higher conductivity due to homogeneous distribution of filler particles in polymer matrix. The presence of such uniformity in the composites helps to acquire a granular shape, which leads to proper dispersion and localization of filler in the polymer matrix. When the concentration of FA in the polymer increased above 30 phr, the inhomogeneities of the composite becomes more pronounced (as evident from SEM) due to the weak interaction between the polymer and filler that leads to relatively lower conductivity. The dosage of FA after which there is no significant change in conductivity irrespective of further addition of filler is called percolation limit/threshold of composite.
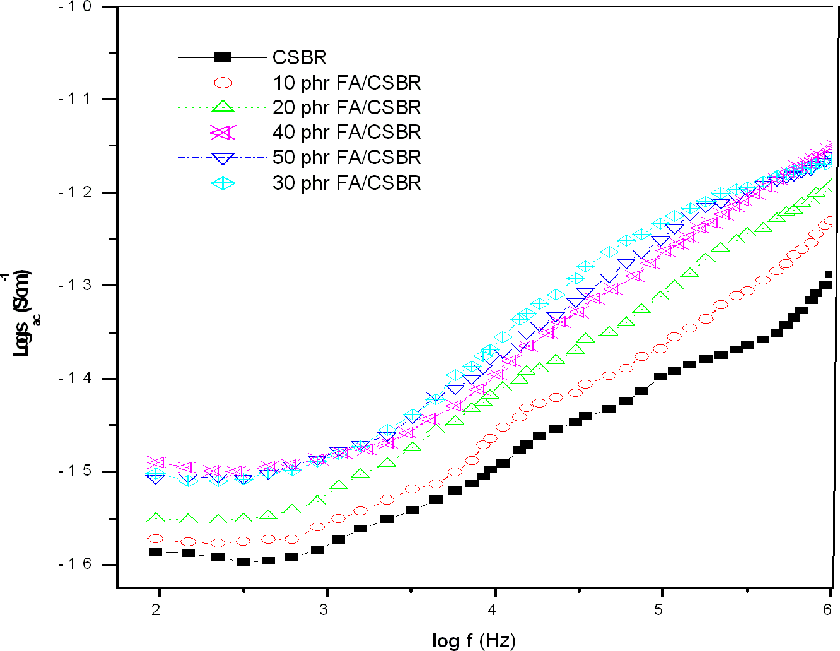
The conductivity of CSBR with various dosages of FA particles at different frequencies. FA: fly ash; CSBR: chlorinated styrene–butadiene rubber.
Dielectric constant
Figure 6 shows the variation in dielectric constant (ε r) with frequency at room temperature for CSBR and FA/CSBR composite. From the figure it can be seen that the real part of dielectric constant continuously decreases rapidly with increasing frequency and as frequency increases ε r attains constant value. CSBR shows the low value of dielectric constant than the composite. The polar–polar interaction between the polymer chain and FA gives a local displacement of electrons, which induces polarization in the polymer composite. Microstructured FA act as a carrier-dominated dielectric that shows frequency dispersion due to space–charge polarization. So, the addition of polar filler-like FA enables the polymeric system to be more polarizable, which can cause a change of positive and negative space charge distribution at the interfaces. 35 If subjected to an electric field, these space charge moves and gets trapped at the interface components of a multiphase material that leads to the formation of large number of dipole moments. At low frequencies, the dipoles have sufficient time to align with the field before it changes direction and the dielectric constant is high. At high frequencies, the dipoles do not have sufficient time to align before the field changes direction and hence the dielectric values are lower. 36 Dielectric constant is higher for 30 phr of loading due to the increased interfacial polarization and formation of conductive network of polymer composite.
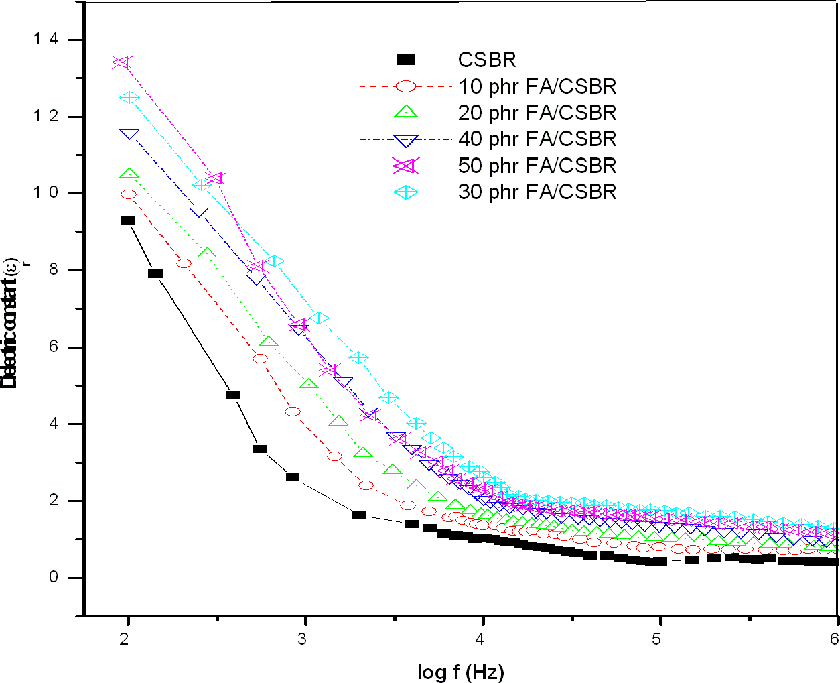
Frequency dependence of dielectric constant of CSBR with different content of FA. FA: fly ash; CSBR: chlorinated styrene–butadiene rubber.
Dielectric loss
Dependence of dielectric loss is a function of frequency ranging from 100–106 Hz at room temperature for the CSBR and its composite is plotted in Figure 7. It can reveal that the dielectric loss also decreases steeply as frequency increases. It is interesting to note that higher dielectric loss value is observed for 30 phr of FA-filled CSBR, which may be due to increased interfacial interaction between the filler and the polymer leading to surface domain depolarization. The uniform distribution of conducting particles in the polymer leads to maximum space charge polarization and thus a greater contribution to the dielectric loss values. 37
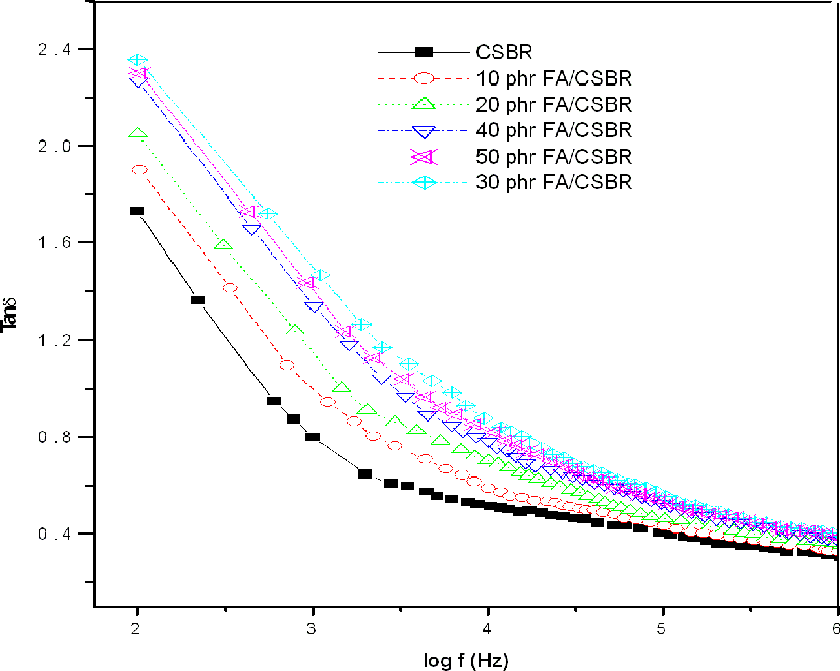
Dielectric loss versus frequency plot for CSBR and FA/CSBR composites. FA: fly ash; CSBR: chlorinated styrene–butadiene rubber.
Conclusions
The cure characteristics, glass transition behavior, mechanical properties, morphology of fractured surfaces, cross-link density, bound rubber content, and the electrical properties of FA-filled CSBR have been studied. Cure characteristics of CSBR composites showed that there is a reduction in optimum cure time with loading of fillers, while the rheometric torque and CRI increased with increase in concentration of fillers. DSC analysis showed that the T g of CSBR increased with increase in content of filler particles in the polymer. At optimal dosages of 30 phr FA in CSBR showed higher modulus, tensile and tear strength, and elongation at break, indicating better distribution of filler in rubber matrix. SEM images revealed that sample with 30 phr of FA showed better dispersion of filler in the polymer system. The improvement in mechanical properties is supported by data on the increased content of cross-links in these samples obtained from swelling measurements. The bound rubber content is increased not only with the temperature but also with concentration of FA in CSBR. E a of the filled compounds also increased with increase in FA content. The AC conductivity, dielectric constant, and loss factor of samples increased with increase in FA loading (30 phr). Increase in the values of dielectric behavior may be due to the increased interfacial interaction between the filler and the polymer.
Footnotes
Funding
This research received no specific grant from any funding agency in the public, commercial, or not-for-profit sectors.