
Abstract
The rheological and electrical percolation threshold of single-walled carbon nanotube (SWNT)-reinforced thermoplastic elastomer based on polypropylene/ethylene–propylene–diene monomer (PP/EPDM; 80/20) nanocomposite was investigated by melt-mixing process. The rheological properties revealed that the addition of SWNT increased the shear stress and shear viscosity. Both PP/EPDM and its nanocomposites exhibited non-Newtonian behavior. It was also found that the materials experience a fluid–solid transition at 0.5 wt% SWNT. The steady shear behaviors and die swell decreased with increasing temperature. The maximum flow activation energy corresponding to the minimum die swell was also observed. The scanning electron microscopic morphology of the PP/EPDM/SWNT nanocomposites showed that the EPDM particles were dispersed through PP and the size of dispersed phase decreased with the introduction of SWNT to 0.5 wt%. The electrical percolation threshold was formed at approximately 1 wt% of SWNT. In addition, difference between electrical and rheological percolation thresholds was observed due to the nanotube–nanotube distance after the formation of the percolating network.
Keywords
Introduction
In recent years, polymer nanocomposites reinforced with carbon nanotubes (CNTs) have gained enormous attraction due to their mechanical, thermal, and electrical properties. 1 The electrical conductivity of polymer nanocomposites was improved significantly by the addition of a small amount of CNTs as nanofiller because of their extremely high aspect ratio compared to conventional particles, such as carbon black. 2 Polymer composites containing CNTs are used in applications such as dissipating electrostatic charge or shielding devices from electromagnetic radiation. 3 The CNTs content showed a critical value, known as the percolation threshold, in blends with electroconductive nanofillers that transitioned from electrical insulators to conductors to form conductive network, correlating with improved optical dispersion via electron transport. 4 The rheological behaviors of molten nanocomposites were very crucial in determining the final application of the material, implying that a method for directly evaluating dispersion in nanocomposites was required to reveal the percolation structures. 5 Melt apparent shear viscosity is an important characteristic for flow properties of polymeric materials. The study of melt apparent shear viscosity of filled polymer systems is helpful to reveal the flow mechanism and establish better processing conditions. 6 The dispersion state of the CNTs in a polymer melt was also affected by the blend method and processing conditions. For example, a small amount of CNT was sufficient to form a network at high temperatures due to the low viscosity of the polymer matrix. 7 The die swell of polymer melt is one of the important aspects in the plastics industry. The swell is commonly observed in many polymer processing techniques such as capillary/slit type process, fiber spinning, extrusion, and so on. 8 As the polymer exits from a die, its cross-sectional area is almost larger than that of the die. The ratio of the extruder diameter De to the die diameter D is called die swell. Die swell must be controlled to achieve accurate part dimensions in applications that require close tolerance. There are many factors, such as temperature, molecular weight, pressure, shear rate, and reinforcements, that affect die swell. 9 The die swell originates from elastic nature of polymer fluids and is qualitatively explained as the release of liquid elastic energy stored in die flow, that is, after a rapid restructuring, the flow type of the liquid at the die exit. 10
Thermoplastic elastomers with polypropylene/ethylene–propylene–diene monomer (PP/EPDM) have gained considerable attention due to their rubbery properties, thermoplasticity, and relatively easy preparation. 11 In thermoplastic elastomer compositions, when the PP content is very high (the hardest grade, which contains over 80 wt% of PP), the material shows properties like an impact-toughened PP (elastomer-modified thermoplastics). On the other hand, when the PP content was less than 30 wt%, the material behaves like a thermosetting rubber (another extreme, softest or rubbery grade). Thus, various PP/EPDM compounds can be prepared for suitable end-use applications by changing the PP and EPDM composition. 12 PP is popular because of its well-balanced physical and mechanical properties and easy processability at a relatively low cost. 13 Studies on the various methods of PP toughening have revealed that the most effective and convenient method was blending. PP toughening can be classified into nonelastomer toughening and elastomer toughening, or a combination of the two. PP toughening by rubber, particularly EPDM, was found to be highly effective. However, the addition of the elastomeric phase increased the toughness but concurrently decreased PP properties, such as rigidity and hardness. Nanoparticle toughness can be used to generate network superstructures in blends and compensate for the reduction in stiffness. Thus, a major issue for some applications has been finding an optimum balance of stiffness and toughness. 14,15 The reinforcement/toughening contribution of CNTs in polymer matrices depends on dispersion uniformity and efficient interfacial adhesion between the nanotubes and polymer matrix to transfer the mechanical load from the matrix to the nanotubes. 16,17 This load relied on the effective interfacial stress transfer at the polymer–nanotube interface, which was often dependent on the polymer. 18 However, the entanglement of CNTs produced by the synthesis and the resultant strong intermolecular van der Waals interactions, as well as their high surface area and high aspect ratio, often produced significant agglomeration that hindered the transfer of stress from the matrix to CNTs. 19,20 Thus, the dispersion of conducting CNTs in polymers and the interaction between polymer melts and CNTs also played an important role in the morphology, as discussed in terms of the surface tension of polymers. 21 In nonpolar PP and EPDM, highly dispersed CNTs were difficult to achieve; thus, we used maleic acid anhydride-modified PP as a compatibilizer for nanocomposite preparation. 14,22 –24
In this study, the rheological behavior of the SWNT-reinforced thermoplastic elastomer with PP/EPDM nanocomposites were investigated in terms of shear stress, shear viscosity, flow activation energy, temperature, and die swell using capillary rheometry. The electrical conductivity of the nanocomposites was investigated using an electrical conductivity measurement. In addition, the morphology and mechanical properties of these nanocomposites were also studied. In the present study, a PP grafted with maleic anhydride (PP-g-MA) and SWNTs were consistently applied.
Experimental
Materials
PP was used as a matrix, and EPDM was used as a minor phase. SWNT and PP-g-MA were used as a filler and compatibilizer. All the products and their relevant properties are listed in Table 1.
Characteristics of the materials.
PP: polypropylene; EPDM: ethylene–propylene–diene monomer; SWNT: single-walled carbon nanotube; PP-g-MA: polypropylene-grafted maleic anhydride; MFI: melt flow index.
Preparation of nanocomposites
PP/EPDM and its nanocomposites were prepared with various SWNT contents as listed in Table 2. The samples were prepared by an internal mixer (type HBI SYS 90) at 190°C and a rotor speed of 60 r min−1. The nanocomposites were prepared by feeding the rubber into the molten PP and stirring the resultant mixture for 3 min. PP-g-MA and SWNTs were then charged into the mixer, and the mixture was stirred for 3 and 6 min, respectively. The longest time spent mixing was approximately 15 min. Then, the mixture was discharged. Sheets were prepared in the shape of square platues by compression molding under a pressure of approximately 10 MPa at 190°C for 5 min using a hydraulic press. Finally, the sheets were cooled at room temperature.
PP/EPDM/SWNT nanocompositions.
PP: polypropylene; EPDM: ethylene–propylene–diene monomer; SWNT: single-walled carbon nanotube; PP-g-MA: polypropylene-grafted maleic anhydride; MA: maleic anhydride.
Characterization
The rheological behavior of PP/EPDM and its nanocomposites were measured by an Instron 3211 capillary rheometer (D
barrel = 0.9525 cm) using dies with a circular cross section and a length-to-diameter ratio (L/D) of 30.16 (L = 38 mm, D = 1.26 mm). The entire barrel and capillary assembly were electrically heated with a microprocessor-based temperature controller. The capillary studies were performed at 200 and 220°C. The rate of shear variation was tuned by changing the speed of the plunger (0.2, 0.6, 2, 6, and 20 cm min−1). According to equations (1) and (2), volumetric flow rate measurements at various pressures and a constant temperature (200 or 220°C) were used to calculate the apparent shear stress 

where ΔP is the pressure difference between the entrance and exit of the capillary, D and L are diameter and length of the capillary, respectively. Q is the volumetric flow rate measured in cubic centimeter per second.
The apparent shear stress was taken as the true shear stress 
where n′ is the slope of the 
The flow behavior index, n, and the consistency index, k, were calculated using the power law model (equation (5)). In addition, the viscosity is calculated using equation (6).
25


The activation energy (E) of the melt flow was calculated for all the specimens using the Arrhenius–Frenkel–Eyring equation to evaluate the temperature dependence of the viscosity. Based on the Arrhenius assumption, the value of E can be assessed by the temperature dependence of viscosity using the following equation
25
:
where η 1 and η 2 are the viscosities at temperatures T 1 and T 2, respectively. R is the gas constant (8.315 J gmol−1 K−1).
The die swell (B) is calculated using the following equation
25

where D e and D are the diameter of extruder and the die, respectively.
Scanning electron microscopy (SEM) was performed on a Cambridge S360 SEM (Cambridge) to examine the fracture surface morphology of PP/EPDM/SWNT nanocomposites. Scanning electron micrographs of cryogenically fractured surfaces of specimens were collected. The samples were fractured in the direction perpendicular to the flow direction of liquid nitrogen. The fracture surface of PP/EPDM/SWNT nanocompoites was etched by n-heptane for 24 h at room temperature, to remove the EPDM phase.
The electrical conductivities of PP/EPDM and its 1-mm-thick nanocomposites sheets were measured in accordance with ASTM D257 using a Tara S cm−1, CEAST Co., (Italy) at 500 V. The sample surfaces in contact with the electrodes were coated with silver paint.
Tensile testing was preformed according to ISO 527-1, and a TCS 2000 COTECH tensile tester (Taiwan) was employed. The tensile modulus, tensile strength, and elongation at break were measured at a constant crosshead speed of 50 mm min−1. A computer was connected to the COTECH load cell and the data acquisition program recorded the force measured by the load cell. Five specimens were tested and the average was recorded.
Results and discussion
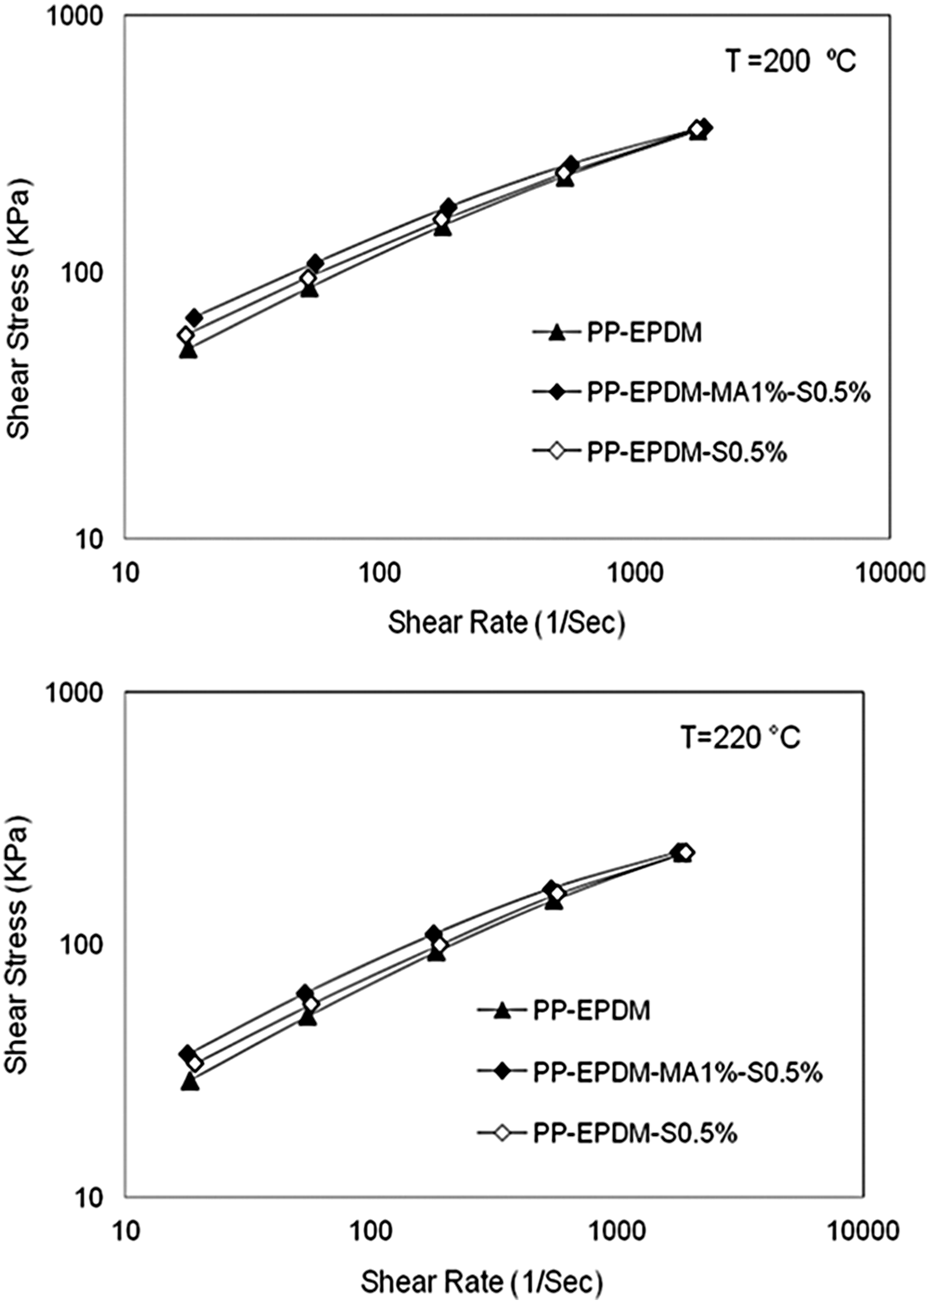
Figures 1 and 2 show the shear rate dependency of the shear stress and shear viscosity for PP/EPDM reinforced with SWNT at 200 and 220°C. The shear rates examined, between 10 and 1950s−1, covers the shear experienced during most polymer processing techniques. It was observed that both PP/EPDM and its nanocomposites displayed non-Newtonian behavior throughout the range of shear rates. The shear stress and shear viscosity were increased by the stiffening effect of the nanotubes, which was particularly significant at a concentration of SWNTs equal to 0.5 wt%, whereas this effect was not noticeable by increasing the SWNT to 5 wt%. Adding 0.5 wt% of SWNT caused a sudden change in the shear viscosity and shear stress; this was due to the physical interaction between the SWNT and the matrix, which restricted the matrix chains’ mobility, thereby increasing the viscosity, responsible for the behavior of the material transition from liquid to solid form. 26 –28 Similar observations have been reported for nanofiller/plastic/rubber nanocomposites, with PP/EPDM. 29 –31
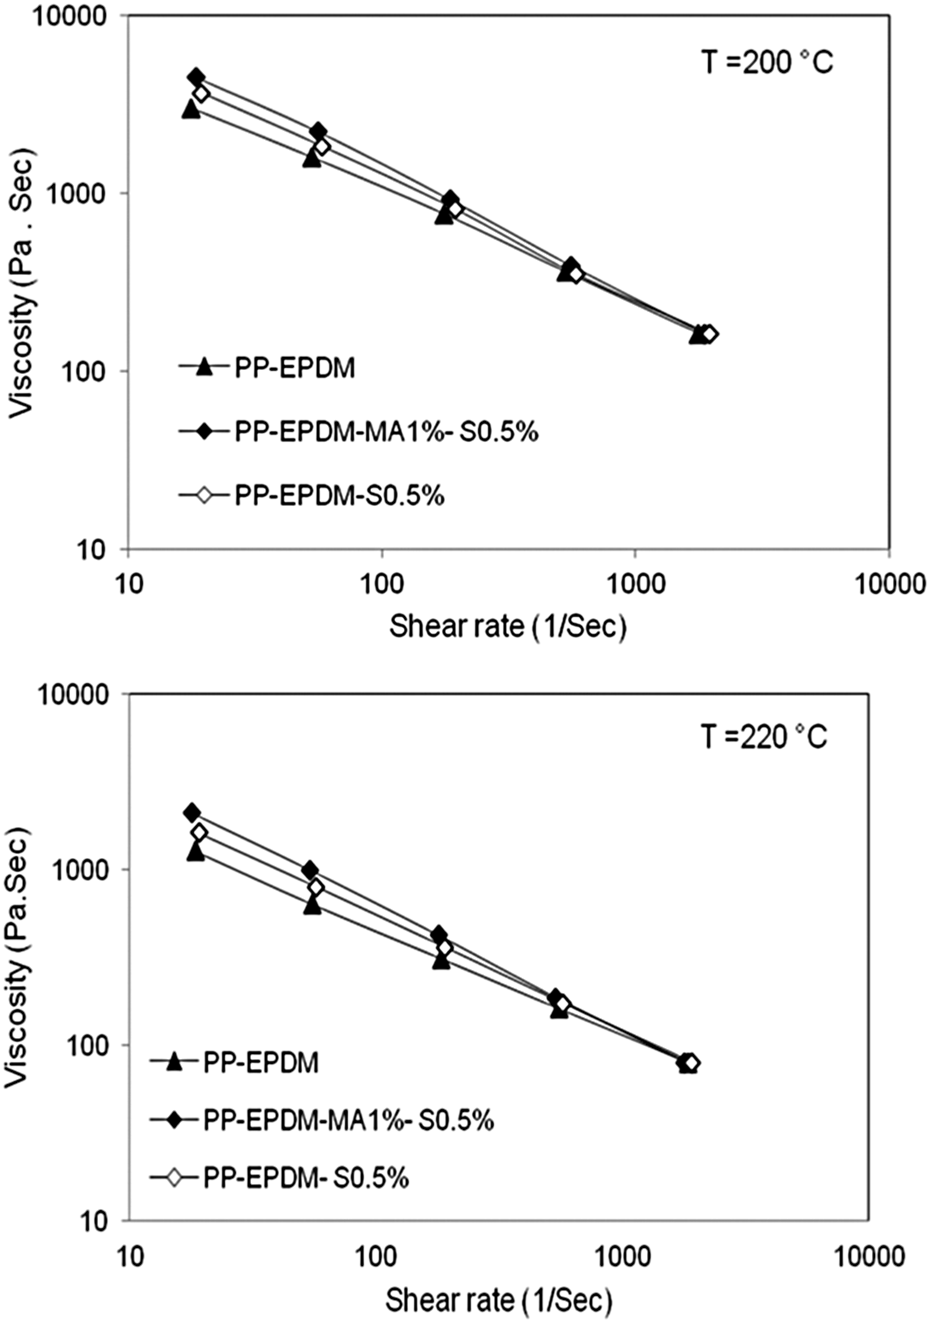
It was also observed from Figure 2 that the PP/EPDM/SWNT nanocomposites used in this study exhibited the shear thinning behavior, where shear viscosity decreased with an increase in shear rate. This decrease was typical of polymer melts, a result of the disentanglement process and the increase in the average end-to-end distance in the polymeric chains due to shearing, which was an indication of pseudoplastic fluid behavior. 32 The viscosity of the nanocomposites was close to that of the PP/EPDM at higher shear rate. This was due to increasing shear rates that reduced the internal entanglement of PP/EPDM. As a consequence of this nature, the physical interaction between the PP/EPDM macromolecules and the nanotubes decreased, thus causing an increase in the destruction rate of the network junction to a value higher than the creation rate. 18,33,34 Figure 3 shows the effect of SWNT contents on the nanocomposites viscosity for three different shear rates at 200 and 220°C. At a low shear rate of 19s−1, the melt viscosity increased with the addition of SWNT, which was particularly significant to 0.5 wt%, whereas the melt viscosity showed no more marked effect by increasing SWNT content and shear rate. It was also observed that with an increase in temperature, the shear viscosity decreased at all the shear rates, particularly at low shear rate of 19s−1. Therefore, it can be concluded that at low shear rate, the viscosity of matrix melt was high and the friction force between PP/EPDM macromolecules and SWNT increased by increasing SWNT to 0.5 wt%, indicating the formation of SWNT network structure, while at higher shear rates, PP/EPDM and its nanocomposites showed better processability by increasing the temperature and the melt viscosity was less sensitive to the addition of SWNT.
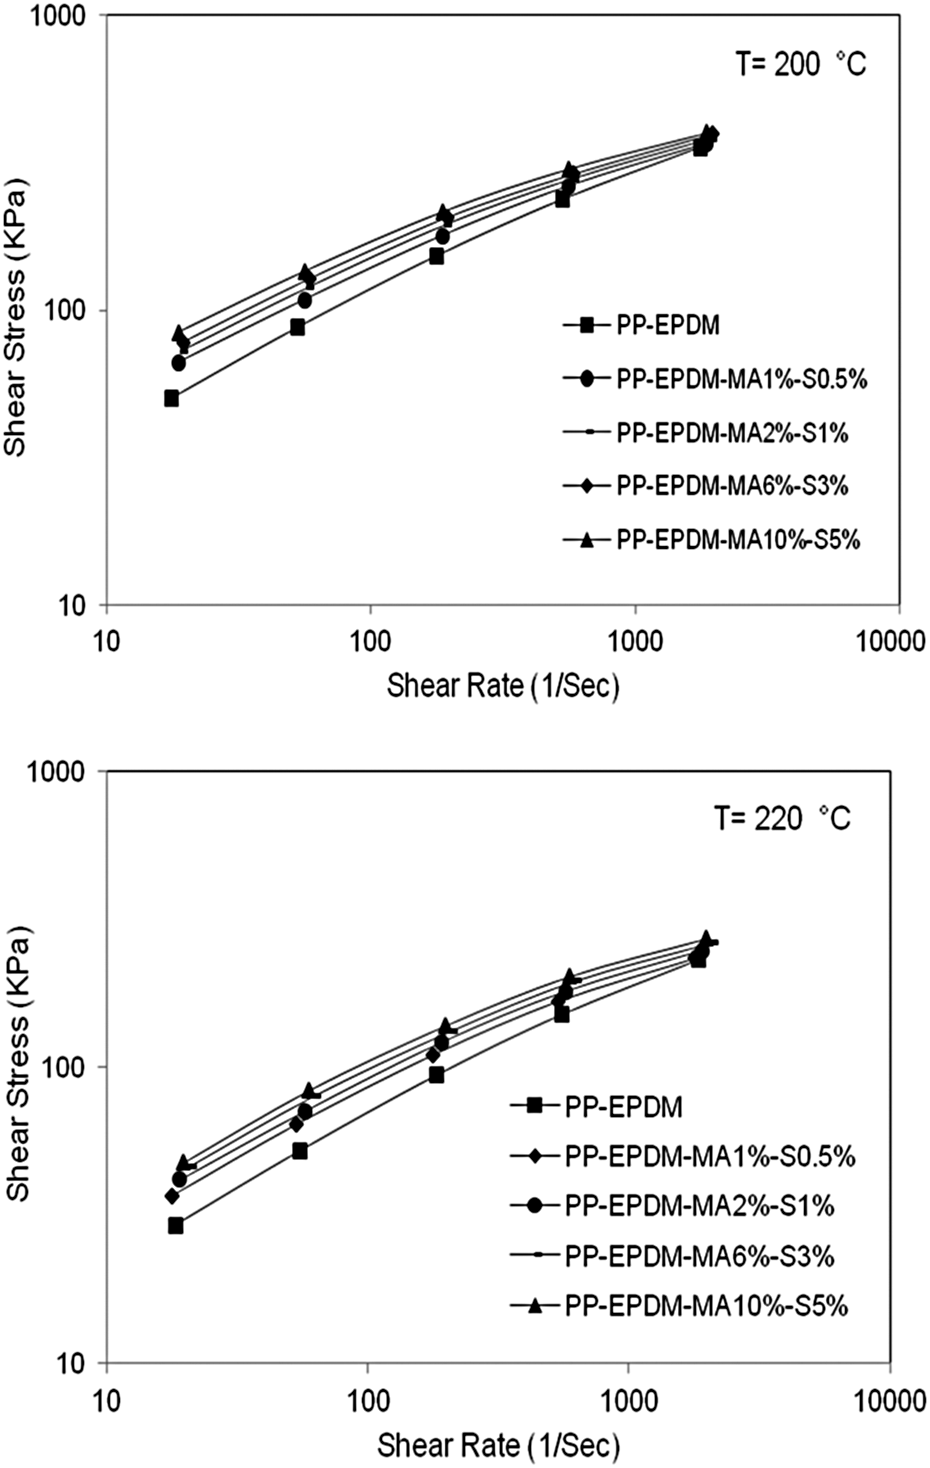
Shear stress versus shear rate of PP/EPDM and its nanocomposites at 200 and 220°C. PP: polypropylene; EPDM: ethylene–propylene–diene monomer.
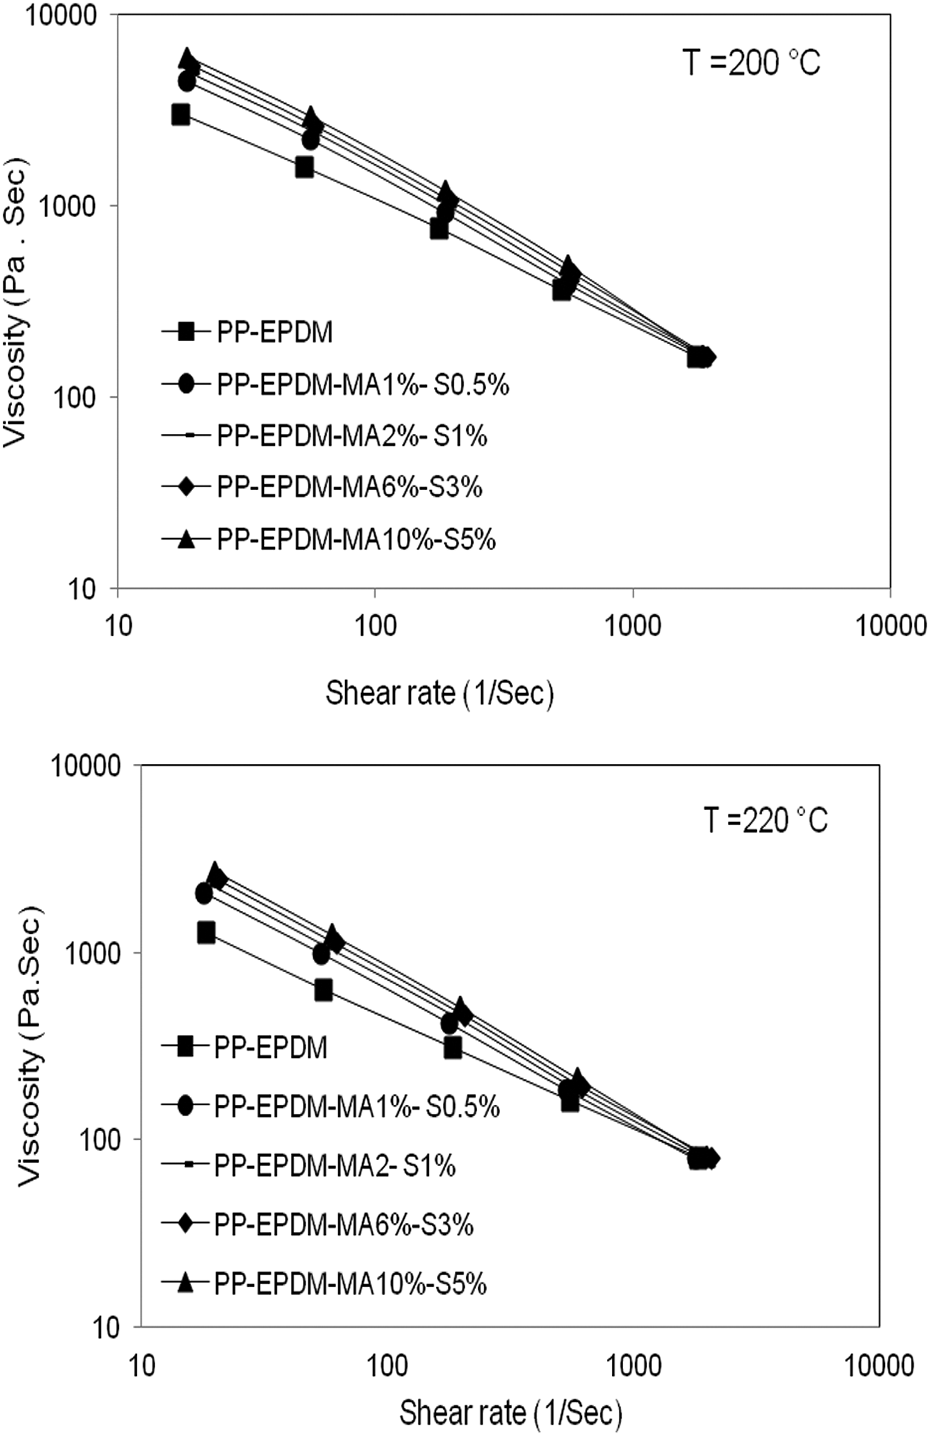
Shear viscosity versus shear rate of PP/EPDM and its nanocomposites at 200 and 220°C. PP: polypropylene; EPDM: ethylene–propylene–diene monomer.
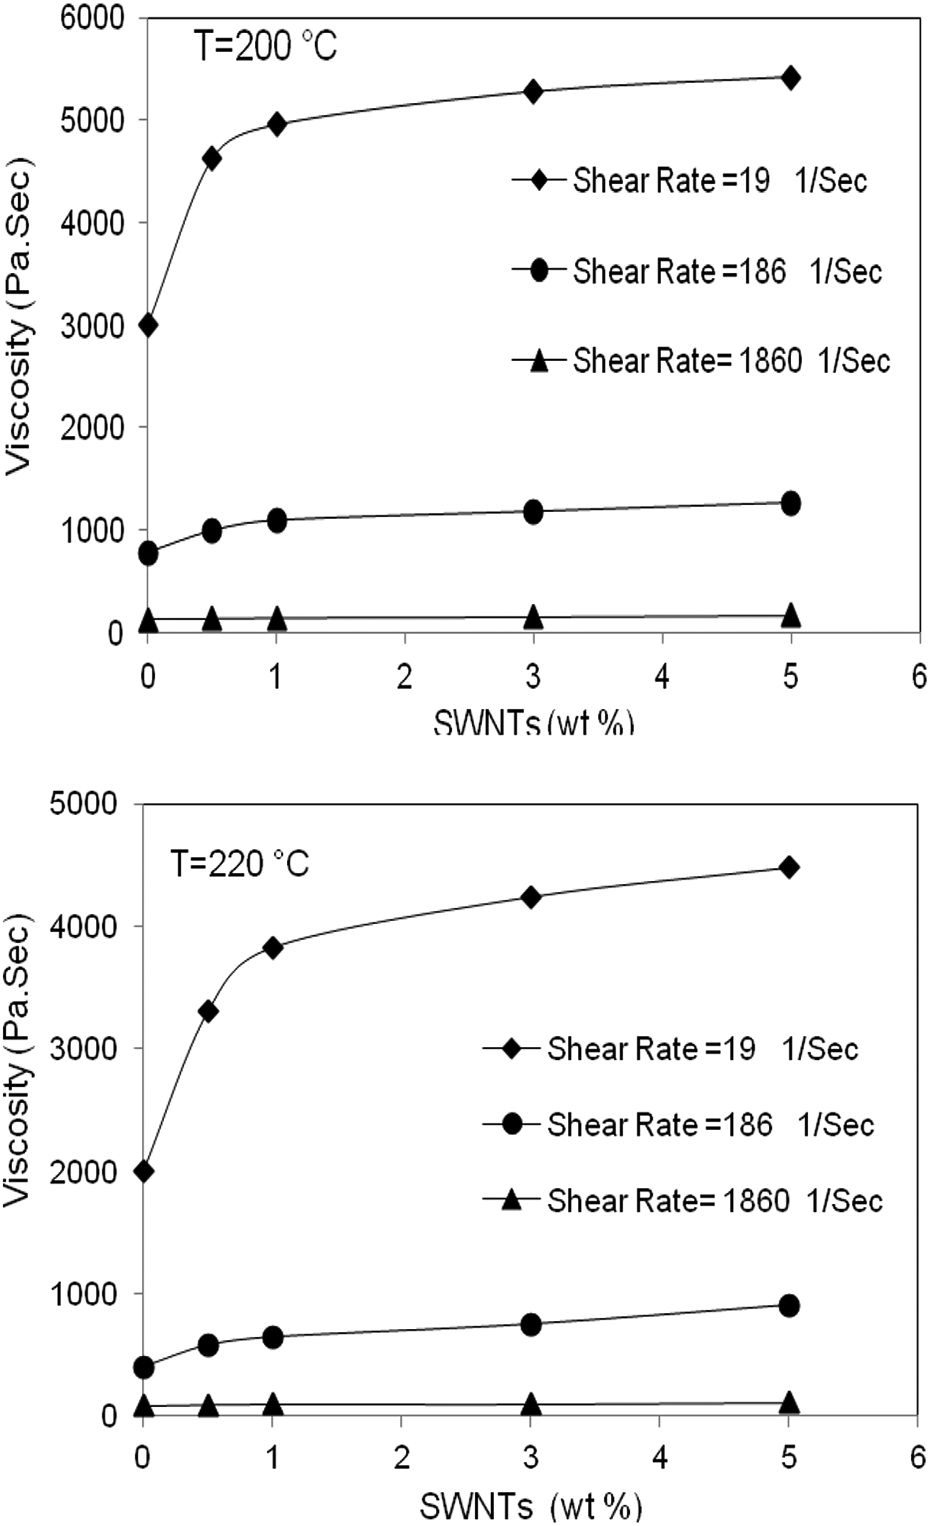
Viscosity versus single-walled carbon nanotube contents at 200 and 220°C.
It was also found that the shear stress and shear viscosity of the compatibilized PP/EPDM/SWNT nanocomposites were greater than the uncompatibilized PP/EPDM/SWNT nanocomposites containing 0.5 wt% of SWNT, as shown in Figures 4 and 5 at 200 and 220°C. It was believed that the compatibilizer chains restrict the mobility of the matrix chains and form a network structure between SWNT in the matrix.
Shear stress versus shear rate of compatibilized (filled symbols) and uncompatibilized (empty symbols) PP/EPDM/SWNT nanocomposites containing 0.5 wt% SWNT at 200 and 220°C. PP: polypropylene; EPDM: ethylene–propylene–diene monomer; SWNT: single-walled carbon nanotube.
Shear viscosity versus shear rate of compatibilized (filled symbols) and uncompatibilized (empty symbols) PP/EPDM/SWNT nanocomposites containing 0.5 wt% SWNT at 200 and 220°C. PP: polypropylene; EPDM: ethylene–propylene–diene monomer; SWNT: single-walled carbon nanotube.
Figure 6 shows the comparison of the influence of temperature on the shear viscosity and shear stress of PP/EPDM/SWNT nanocomposites containing 0.5 wt% of SWNTs at 200 and 220°C. The shear viscosity and shear stress decreased by increasing the temperature from 200 to 220°C. This behavior was due to the increase in the energy of macromolecular thermal motion with an increase in temperature, causing more holes to appear in the melts and the macromolecular flow resistance and interaction force between macromolecules to decrease. 33,35 Table 3 presents the values of k and n of the PP/EPDM reinforced with SWNT at 200 and 220°C. The values of n were lower than those at unity, indicating the pseudoplastic characteristic of the sample melts. The shear thinning exponent, n, decreased with increasing SWNT content while increased with the rise in temperature, showing Newtonian characteristics. 29,36 This behavior has also been observed by decreasing the shear viscosity with regard to the shear rate. The differences in the values of n for various samples, as shown in Table 3, imply differences in the ease of flow in these samples. Comparison of results presented in Table 3 showed that greater values of k and n were observed for the compatibilized PP/EPDM/SWNT nanocomposites than that of the uncompatibilized PP/EPDM/SWNT nanocomposites containing 0.5 wt% SWNT; it was believed that the PP-g-MA made the polymer more viscous due to an increased amount of interaction. Thus, the compatibilized nanocomposites behaved in a more pseudoplastic manner. 37
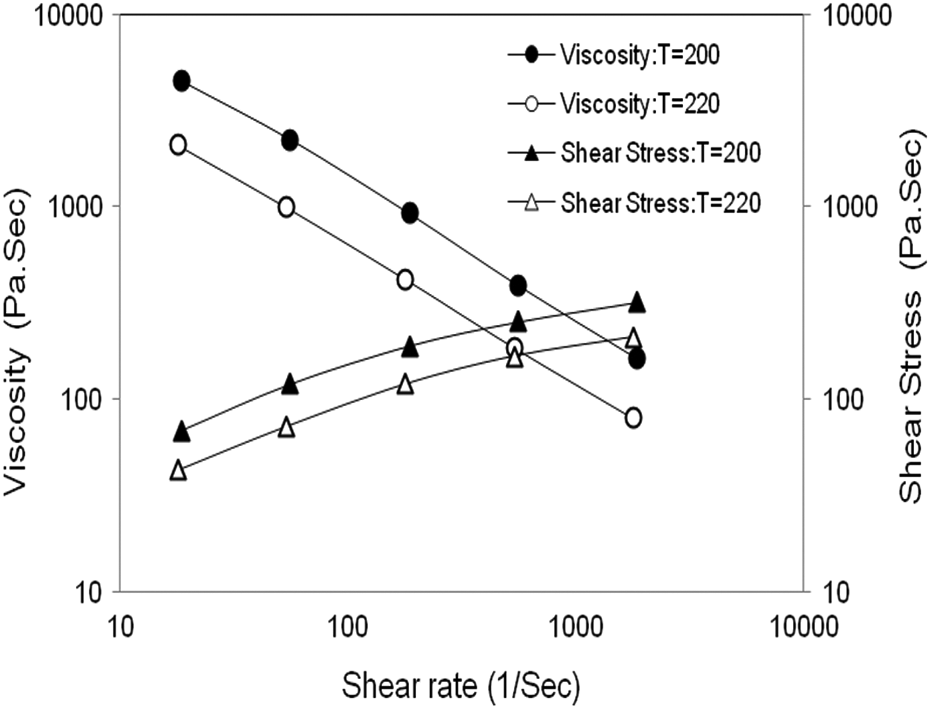
Influence of temperature on the shear stress and shear viscosity of PP/EPDM/SWNT nanocomposites containing 0.5 wt% SWNT. PP: polypropylene; EPDM: ethylene–propylene–diene monomer; SWNT: single-walled carbon nanotube.
n and k values of PP/EPDM and its nanocomposites.
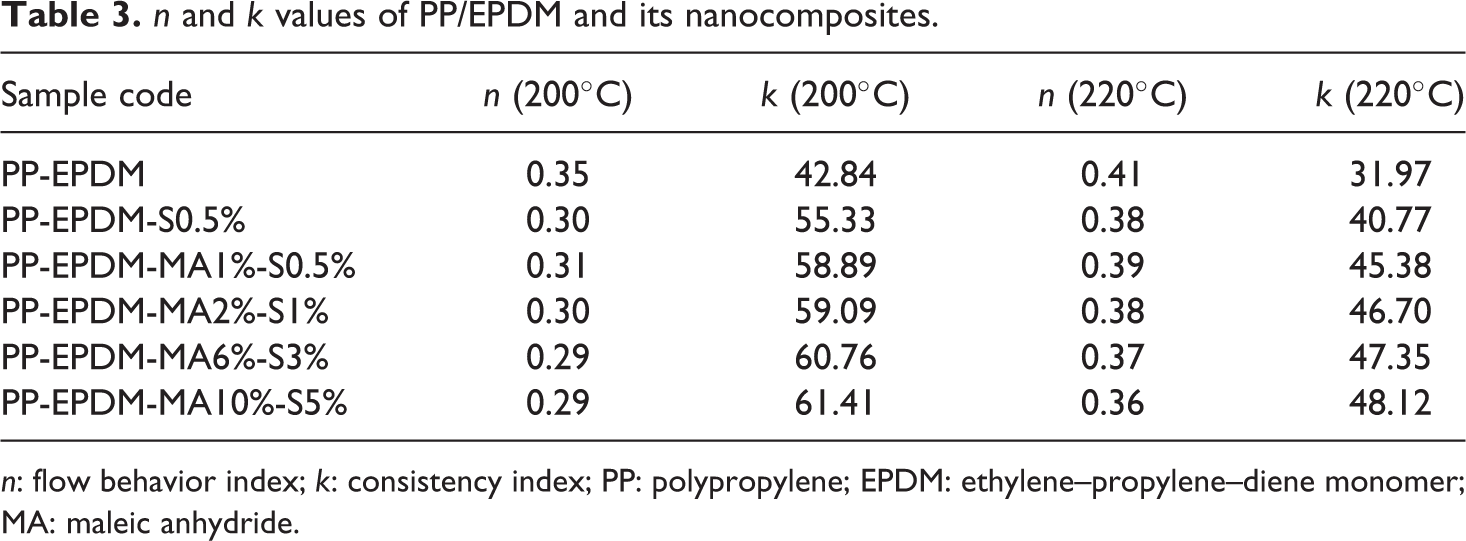
n: flow behavior index; k: consistency index; PP: polypropylene; EPDM: ethylene–propylene–diene monomer; MA: maleic anhydride.
Figures 7 and 8 showed the flow activation energy and die swell of the PP/EPDM reinforced with SWNT for three different shear rates. The activation energy for viscous flow decreased with increasing shear rate as shearing reduced the number of entanglement coupling point, leading to the decline of interaction between chains segment, while the die swell increased with increasing shear rates. This was because of the elastic recovery of macromolecular chains that spent a shorter time in capillary and hence the die swell was greater at higher shear rates. 32,38 Also, the die swell decreased by increasing the temperature; this effect was supported by the influence of temperature on steady shear behavior, thus causing less elastic recovery of macromolecular chains. 32,33,38
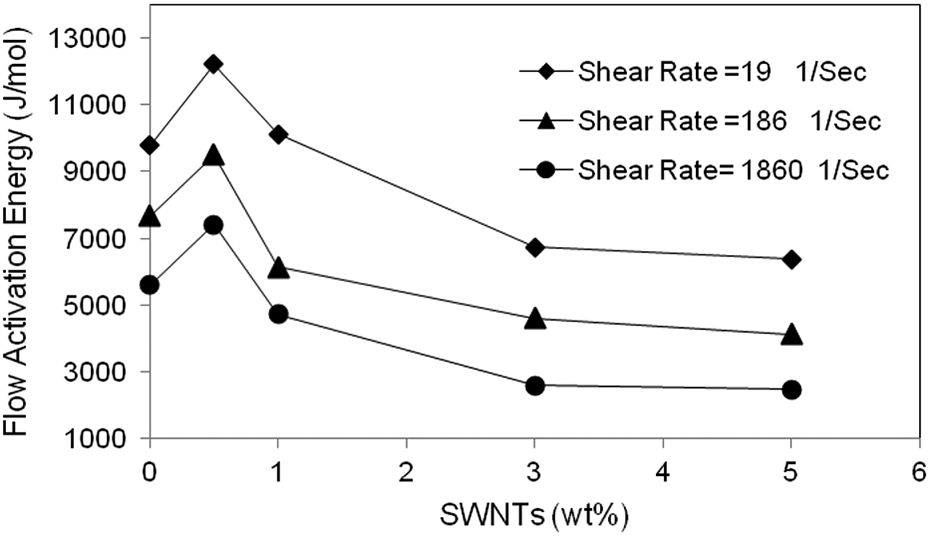
Activation energy of flow versus single-walled carbon nanotube contents.
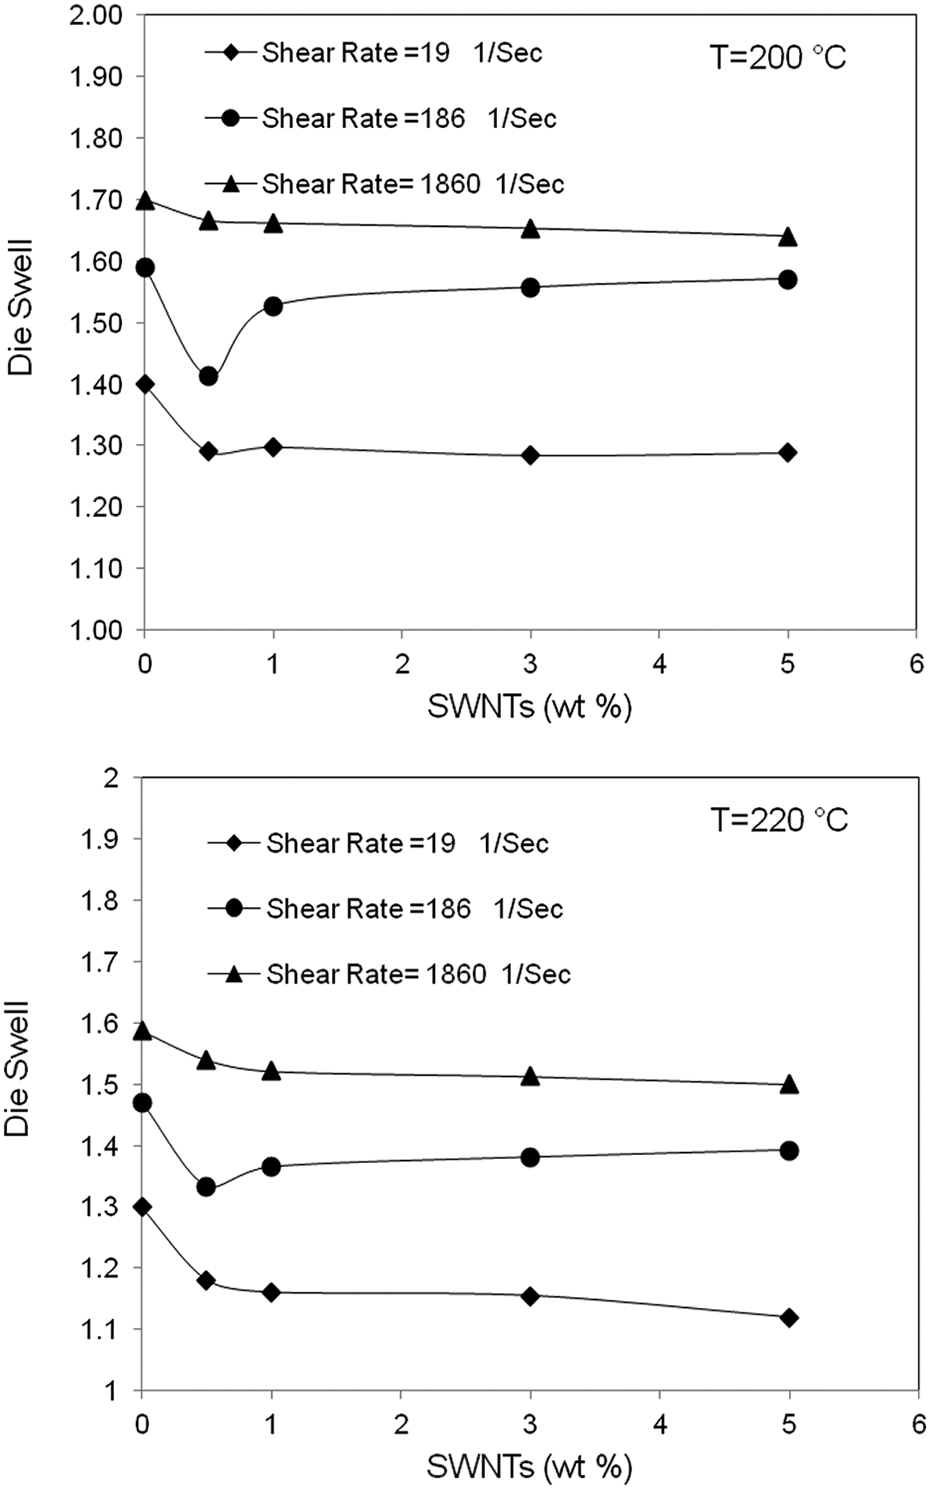
The die swell versus single-walled carbon nanotube contents at 200 and 220°C.
It is interesting to note that the addition of 0.5 wt% SWNT causes a large energetic barrier for the segmental motions of polymer chains in the confined space, which is responsible for the improvement of the flow activation energy. 36,37 Also, the addition of 0.5 wt% SWNT causes the formation of physical interaction between the SWNT and the matrix, leading to increased chain entanglement, which resisted the polymer chain to return to its previous shape, thereby resulting in less recoverability that is reflected due to lower die swelling. 39,40 In contrast, further SWNT contents produced a negative effect, that is, it showed a decrease in the flow activation energy due to aggregate formation by increasing SWNT, leading to a decrease in the interaction between the chain segments. 28,32 Similarly, the declined die swell effect was not noticeable when increasing the SWNT content. Therefore, it can be concluded from flow activation energy and die swell that the maximum flow activation energy corresponded to the minimum die swell, implying the best interaction between SWNT and matrix. As shown in Figure 9, this effect is more remarkable at 0.5 wt% SWNT content. 38,40,41
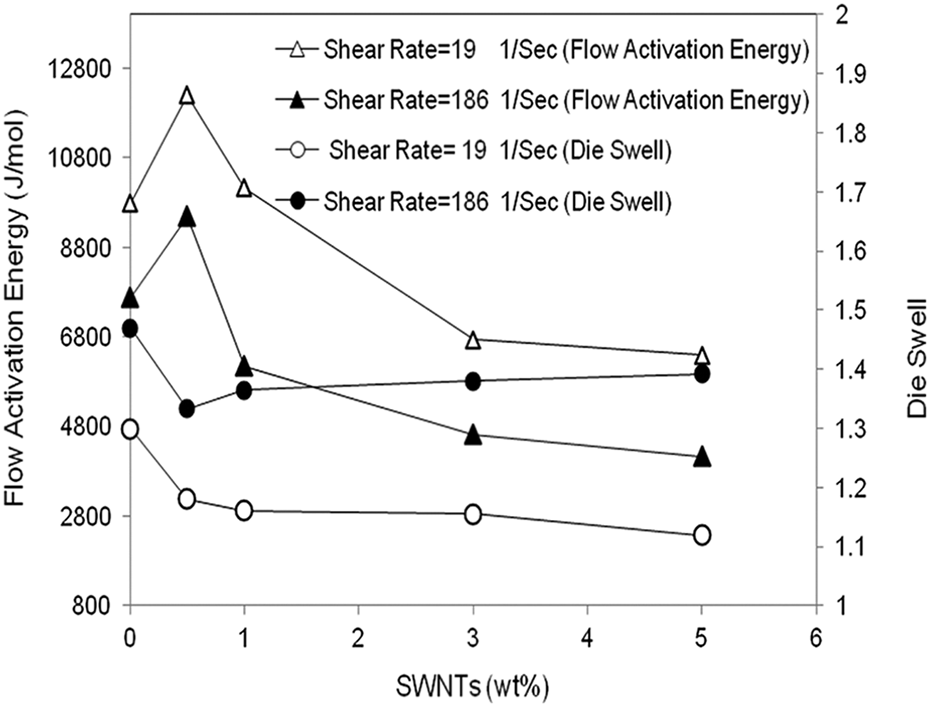
The flow activation energy and die swell versus single-walled carbon nanotube contents.
To get a better insight of the SWNT dispersion, the morphology of the PP/EPDM/SWNT nanocomposites in the presence of PP-g-MA with different SWNT contents was investigated using SEM, as shown in Figure 10. The dark holes observable in the scanning electron micrographs represented rubber droplets that had been removed by solvent. It was observed that when 0.5 wt% SWNT was added, EPDM particles are more finely dispersed in the PP matrix due to interfacial adhesion between PP and EPDM, which was strengthened by the bridge effect of SWNT in the interface. 42,43 This effect was not considerable by increasing SWNT content up to 5 wt%. It may be related to the increase in the viscosity ratio of EPDM and PP phases by increasing the SWNT content, causing the droplet break-up process to become more difficult and a heterogeneous dispersed phase distribution was formed, which indicated that the interfacial adhesion was very weak. 43,44 This behavior has also been observed by rheological studies.
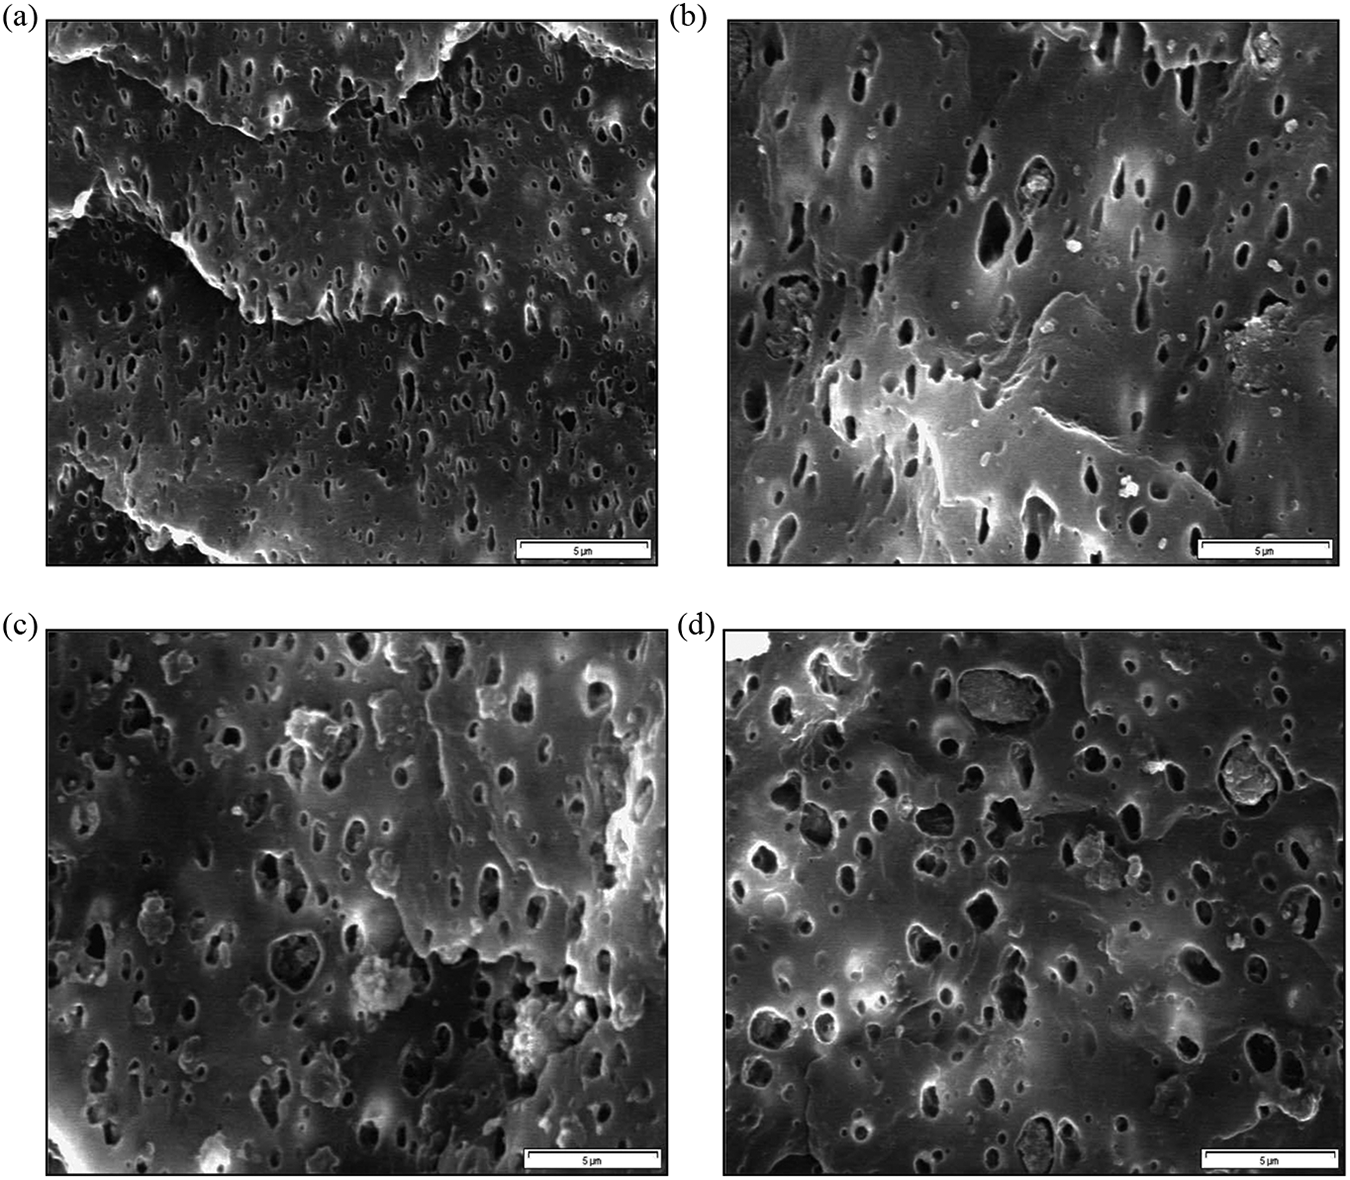
Scanning electron micrographs of PP/EPDM/SWNT nanocomposites: (a) 0.5 wt% SWNT; (b)1 wt% SWNT; (c)3 wt% SWNT; and (d)5 wt% SWNT. PP: polypropylene; EPDM: ethylene–propylene–diene monomer; SWNT: single-walled carbon nanotube.
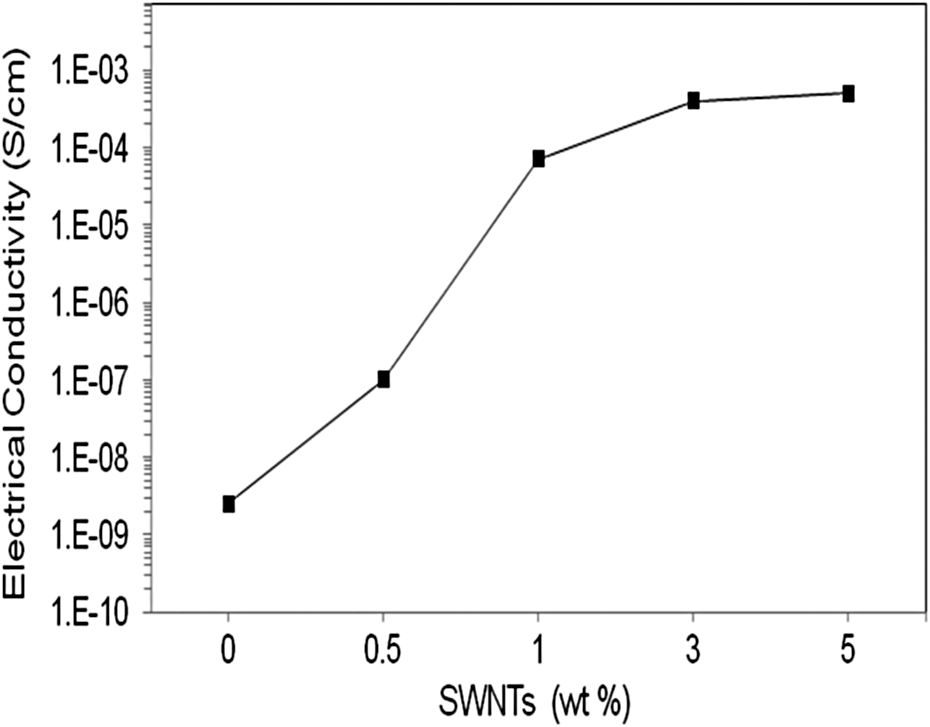
Figure 11 shows the electrical conductivity of PP/EPDM and its nanocomposites with different SWNT contents. The electrical conductivity of the PP/EPDM is improved by the reinforcing effect of the SWNT. As can be seen from Figure 11, when 0.5 wt% SWNT was added, the nanocomposite was still an isolator. However, with an increase in the SWNT content up to 1 wt%, there was a sharp increase in conductivity. This change in electrical conductivity was the result of uniform dispersion of SWNTs in the matrix, forming a network structure of SWNTs, which can be regarded as an electrical percolation threshold. As a result, high percentage of the electrons could flow through the sample due to the nanotube–nanotube interactions through surface contact (or tunneling) and percolation conductive channels. 45,46 This effect was not noticeable due to a decrease in the nanotube–nanotube distance with increasing SWNT content up to 5 wt%. 45 –50 Besides, difference between the electrical and rheological percolation threshold was also observed. Zhang et al. 50 explained that this phenomenon is due to the result of different tube–tube distances required for electrical and rheological percolations. Assuming that the electron-hopping mechanism applies to the electrical conductivity of nanotube/polymer composites, the required tube–tube distance must be less than 5 nm for the composites to be electrically conductive. However, if the nanotube–nanotube distance is comparable to the diameter of the polymer chains’ random coils, which is generally greater than 10 nm, the nanotube network can effectively restrain polymer motion, which is the main factor determining the rheological percolation threshold. As a consequence of it, the electrical percolation threshold for a given CNT/polymer system requires higher loading level of CNTs than the rheological percolation threshold. 51,52 Therefore, from the rheological and electrical results, the rheological and electrical percolation threshold occurred at 0.5 and 1 wt% SWNT, respectively.
Electrical conductivity versus single-walled carbon nanotube contents.
In a further characterization of these materials, tensile properties for PP/EPDM and its nanocomposites have been obtained and were reported in Table 4. Based on the fact that mechanical properties of PP/EPDM/SWNT nanocomposites are dependent on their morphology, 11 one can see that the tensile modulus of samples increased significantly by 59.8% with increasing SWNT content to 5 wt%. Due to the fact that the incorporation of SWNT gave rise to a more rigid material, a marked increase in the viscosity ratio of PP/EPDM was reflected. But, the elongation at break as an indicator for toughness of materials was decreased with an addition of SWNT content to 5 wt%. To reconfirm the interaction of filler and matrix, tensile strength test was also carried out. 12 The results showed that the tensile strength reached to the maximum at 0.5 wt% SWNT by 21.81%, compared with PP/EPDM, due to the better dispersion and interaction of SWNT and the matrix. 24,26,43 Then, it decreased by 7% with increasing SWNT to 5 wt%. This was due to the inability of SWNT to support stresses transferred from matrix. 20,44 It was also found that the improvement in mechanical properties of the compatibilized PP/EPDM/SWNT nanocomposites was greater than that of the uncompatibilized PP/EPDM/SWNT nanocomposites containing 0.5 wt% SWNT content, as reported in Table 4, indicating that PP-g-MA promoted the network structure of SWNT in the matrix. Hence, from these results, the mechanical percolation threshold was at 0.5 wt%.
Mechanical properties of PP/EPDM/SWNT nanocomposites.
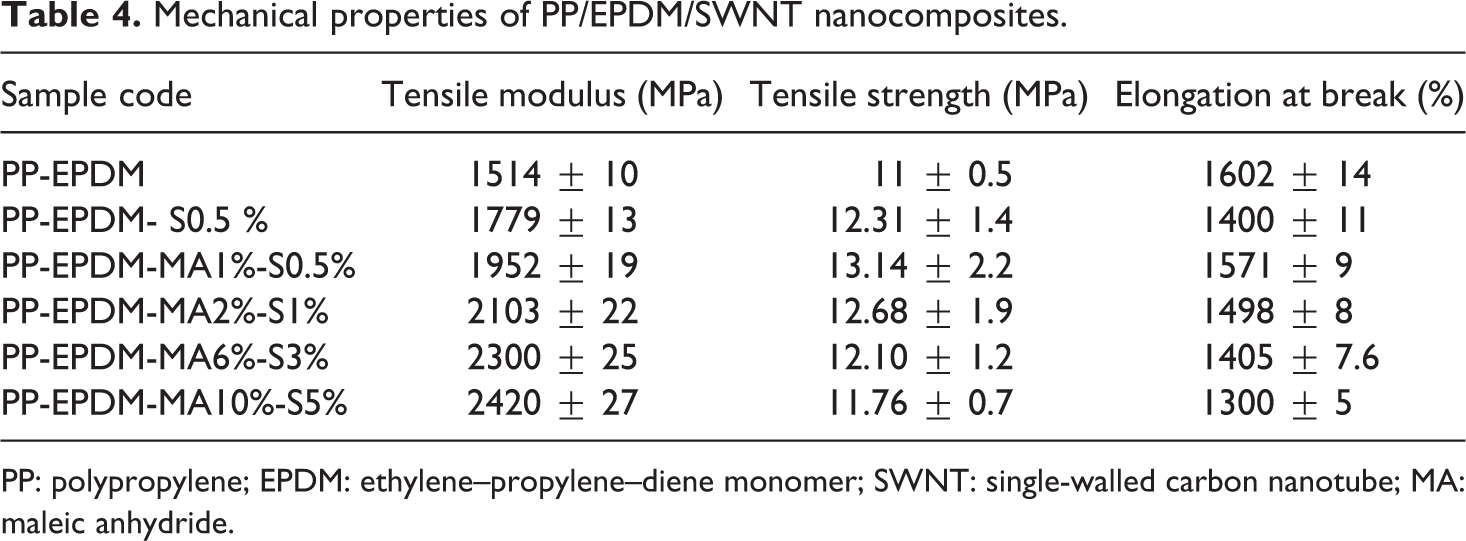
PP: polypropylene; EPDM: ethylene–propylene–diene monomer; SWNT: single-walled carbon nanotube; MA: maleic anhydride.
Conclusion
Study on the electrical and rheological percolation threshold of SWNT-reinforced thermoplastic elastomer with PP/EPDM was investigated via the melt mixing process. The rheological studies revealed that for all compositions, the shear viscosity decreased with increasing shear rate, which was the shear thinning behavior, following the power law equation. The addition of SWNT as reinforcement increased the shear stress and shear viscosity. Increasing the temperature from 200 to 220°C resulted in the improvement of the nanocomposites effects, showing decrease in steady shear rheological behavior and die swelling. It was also found that the maximum flow activation energy corresponds to the minimum die swell, implying the best interaction between SWNT and matrix, and this effect is more appreciable at 0.5 wt% SWNT content. The rheological behaviors were very sensitive to the obtained morphology, which showed that the physical interaction between the SWNT and the matrix led to a significance increase in viscosity of the nanocomposites. The addition of the SWNT improved the tensile modulus of samples, which is responsible for increasing the viscosity ratio of PP/EPDM. In addition, difference between the rheological and electrical percolation thresholds was also found. This difference was attributed to the different mechanisms of reaching the percolation thresholds. Therefore, it can be concluded from these results that the rheological and electrical percolation threshold occurred at 0.5 and 1 wt% SWNT content, respectively.
Footnotes
Funding
This research received no specific grant from any funding agency in the public, commercial, or not-for-profit sectors.