
Abstract
The thermomechanical properties of Graphene Nanoplatelets (GNPs)/low-density polyethylene (LDPE) composites were investigated and characterised to understand the effect of nanoscaled reinforcement in the thermoplastic matrix. Results show that the presence of the filler does not produce a change in the microscopic structure of the polymer. However, on a macroscopic scale, graphene platelets limit the mobility of the polymer chains, resulting in an increase in stiffness and in some cases, strength of the composite. Orientation of Graphene Nanoplatelets in the LDPE matrix was evaluated by testing composites made with two different manufacturing techniques (compression moulding and blown extrusion). A comparison between experimental data and predictions using the Halpin–Tsai model shows that the orientation of the nanoplatelets due to the extrusion process leads to better mechanical properties than those obtained with the randomly oriented graphene resulting from the compression moulding technique.
Introduction
The past 30 years have seen increasingly rapid advances in the composites technology, because of the possibility to ‘tailor’ the properties of the material to the needs of different customers.
Recent developments in the field of nanotechnology have led to renewed interest in a particular class of materials known as polymer nanocomposites, in which nanoscale filler materials are added to a polymeric matrix in order to enhance mechanical and physical properties. Several studies have proved that when one of the dimensions of the filler is in the range of 10−9 m, the resulting polymer-based nanocomposite exhibits unique physical, chemical and mechanical properties, compared with composites reinforced with the same quantity of microparticles. 1
The difference between conventional reinforcements and the nanoscale fillers can be explained by the reduction in the nanoparticles’ dimensions, which increases the surface in contact with the polymeric matrix, generating the so-called ‘nanoeffects’ within the composite structure. 2 –4 From a structural point of view, a nanocomposite can be defined as a material in which one of its components has at least one nanometric dimension, which therefore we can distinguish into three different categories: (a) zero-dimensional (metal and ceramic nanoparticles), (b) mono-dimensional (carbon nanotubes (CNTs) and inorganic nanowires) and (c) bi-dimensional (nanoclays and graphene). Nanoclays are nanoparticles based mostly on alumina and silica organised in a layered structure in which each layer consists of a sequence of tetrahedral and octahedral nanometric sheets. Because of their dimensions, when embedded within a polymeric matrix, these bi-dimensional nanofillers are able to improve the overall properties of the system, improving mechanical, thermal and chemical properties.
Graphite also shows a similar planar structure; however, since natural graphite (NG) is not reinforcing in nature, a high temperature heat treatment is used to modify it to expanded graphite, resulting in a swollen material characterised by low density and high temperature resistance. The low cohesion of this high porous structure allows it to be partially disaggregated by the application of an intensive sonication treatment, leading to the formation of graphene nanoplatelets, which are characterised by excellent mechanical and physical properties.
The thickness of graphene nanoplatelets can vary from several to dozens of nanometres, while the other two dimensions are in the micron scale, resulting in a unique aspect ratio and high specific surface area (2630–2965 m2/g for completely exfoliated graphene sheets 5 ).
Compared with nanoclays, graphene nanoplatelets exhibit lower mass density and due to the sp2-hybridised carbon atom bonds plus the absence of electron scattering phenomena, they show a high electrical and thermal conductivity. Moreover, each graphene layer has a number of unusual characteristics, for example, its molecular structure is not permeable to very small molecules such as H2 or noble gas, 6 and it shields electromagnetic waves (ultraviolet, visible, infrared and microwaves) and so on.
In addition, the mechanical properties are impressive, with a reported Young’s modulus of 1 TPa. 7 Another important advantage that makes graphene nanoplatelets particularly interesting for structural applications is the relatively simple process required for mass production. Indeed, unlike traditional graphitic nanoreinforcements (CNT and carbon nanofibre) that require complex and expensive processes, such as chemical vapour deposition and laser vaporisation, 8,9 nanoplatelets can be produced from NG through simple techniques. 10,11
This project is aimed towards the design, manufacturing and characterisation of a polymer nanocomposite embedding graphene nanoplatelets (GNP) within a low-density polyethylene (LDPE) matrix. LDPE is a cheap, easily recyclable, engineered thermoplastic that is largely used for packaging applications, and it was chosen as the matrix material because of the possibility to also use the resulting composite as a structural material once its mechanical properties are improved.
To analyse the morphology of the composites, scanning electron microscopy (SEM), transmission electron microscopy (TEM) and x-ray diffraction (XRD) analyses were conducted in order to determine the dimensions of the nanofiller, and mechanical and thermal properties were evaluated with several tests on nanocomposite films. Samples were obtained using different manufacturing processes in order to analyse the orientation effect of the nanoreinforcements.
Material preparation
A composite material based on graphene nanoplatelets embedded into a LDPE matrix was produced by dispersing large aggregates of graphene into the molten polymer using a micro extruder. Graphene aggregates were obtained by breaking up small pieces of the fragile ‘graphene sponge’ structure, which results from the drying of a concentrated colloidal suspension (about 33 g/l) of graphene in acetone. These colloidal graphene suspensions were prepared by exfoliation of expanded graphite using ultrasound. Either a powerful sonication bath or sonication tip can be used, but in order to achieve a complete exfoliation, the expanded graphite must be slowly added to the colloidal suspension during the sonication treatment. The expanded graphite was obtained through the fast heating of mildly oxidised graphite (expandable graphite). Specifically, expandable graphite flakes were placed into a steel crucible covered by a metallic mesh and allowed to expand in air by applying a strong thermal shock; a muffle furnace set at about 800°C was used for the expansion process using a heating time of 4 min. The obtained expanded graphite was dispersed in octane (Aldrich, 98%, Sigma-Aldrich Company Ltd., Gillingham, UK) by gradually adding it to the liquid phase; intensive sonication was applied to this liquid phase using a tip sonicator (Hielshier, 1000W, Hielscher Ultrasonics GmbH - UP100H) in order to achieve a complete exfoliation of the expanded graphite, resulting in a silvery-grey colloidal suspension. This concentrated (paste) suspension was allowed to air dry at room temperature for 24 h in order to obtain the fragile graphite sponge, which was subsequently broken into the small grains required for the nanocomposite preparation.
Samples were obtained using two different manufacturing techniques: compression moulding (Figure 1(a)) and blown extrusion (Figure 1(b)), in order to investigate how the mechanical properties are affected by the orientation of the GNPs within the polymeric matrix.
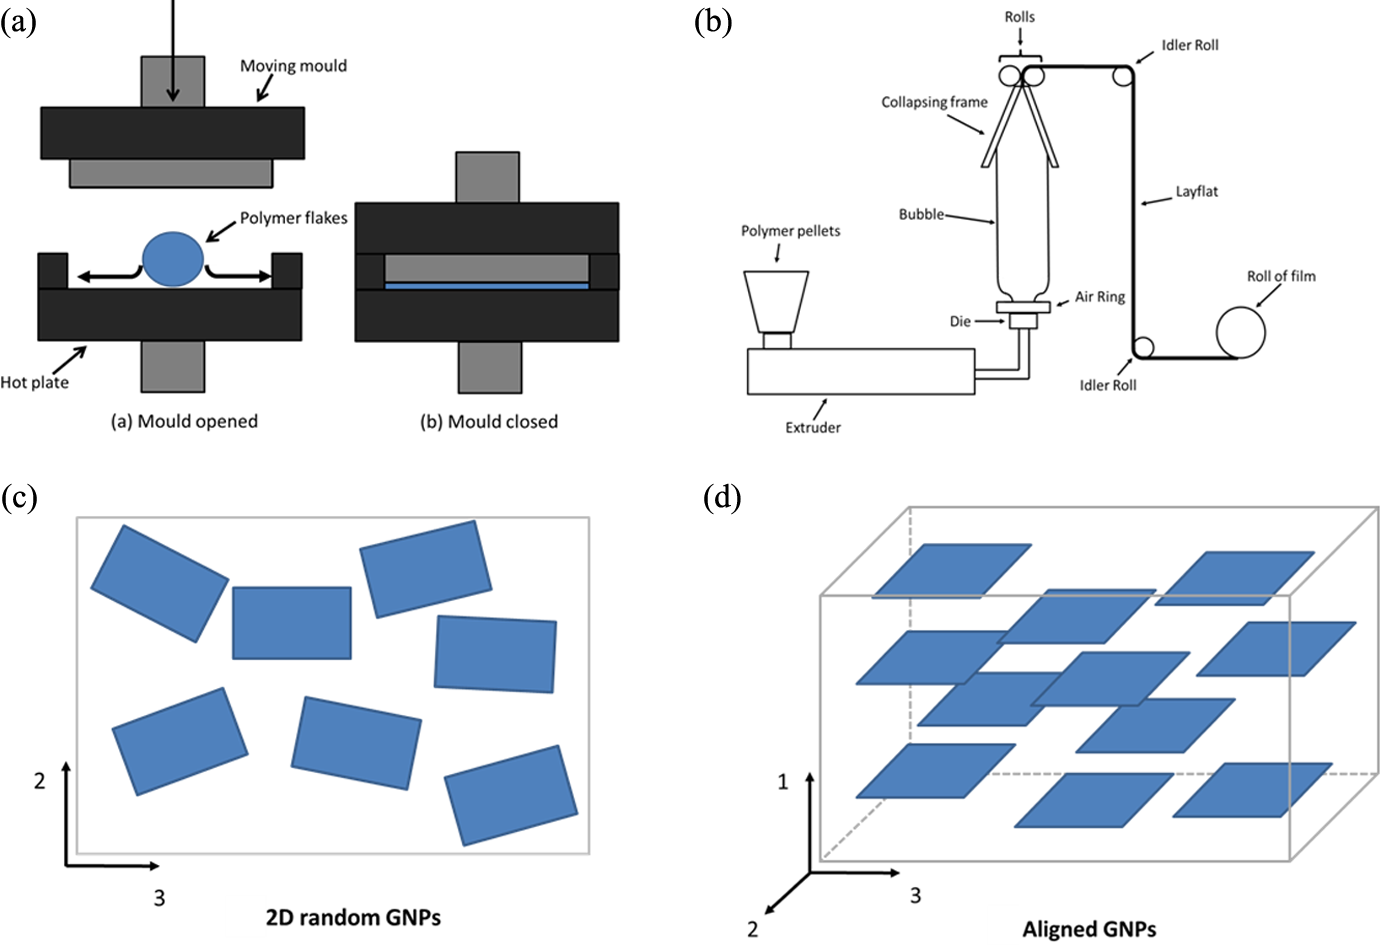
Schematic representation of (a) compression moulding process; (b) blown extrusion process; (c) randomly in-plane oriented nanoparticles and (d) three-dimensional nanoparticles.
Because of the irregularity of the nanoplatelets, their orientation inside the LDPE is strongly influenced by the manufacturing process, resulting in a two-dimensional random distribution for the compression moulding (Figure 1(c)) and in a more aligned three-dimensional orientation for the blown-extruded samples (Figure 1(d)). As a consequence, samples obtained with blown extrusion will present a higher level of anisotropy in comparison with the samples manufactured by compression moulding.
Results and discussion
Figure 2(a) shows the microstructure of expandable graphite flakes (i.e. graphite intercalated by sulphuric acid molecules) before and after the thermal shock treatment. As can be seen, a worm-like structure is produced at the end of the expansion process because of the gas produced by the following reaction: C + H2SO4 = CO2 + H2O + SO2. The solid phase produced at the end of the sonication and drying process consists of GNPs with a thickness of 20 nm and a length of 1 μm (Figure 2(b)).
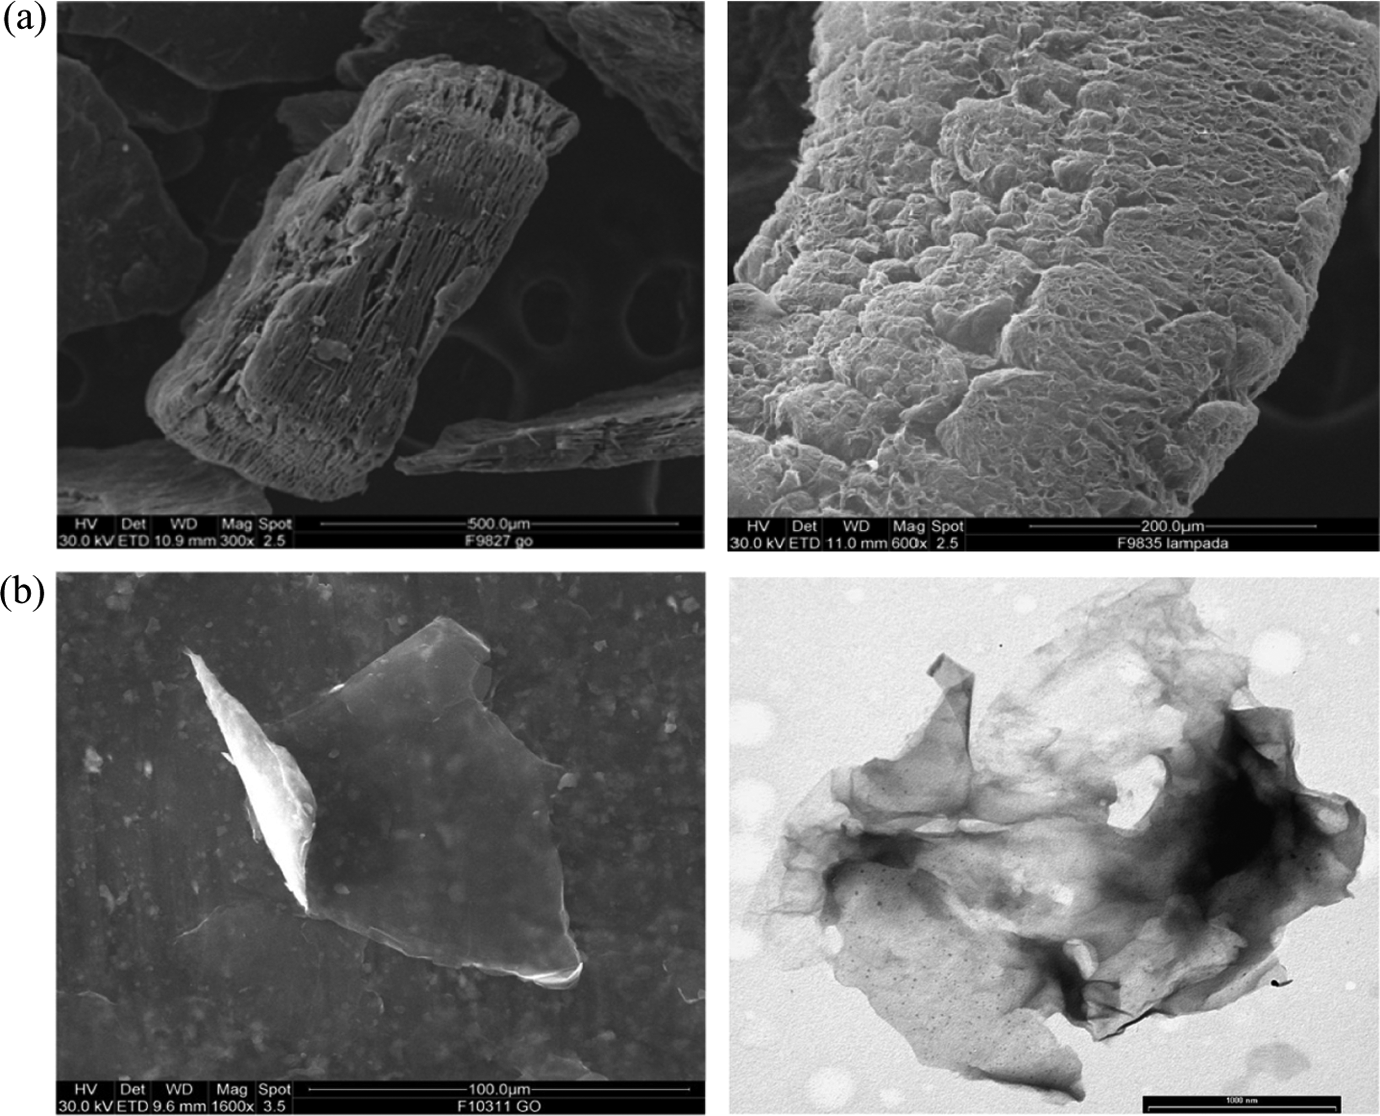
Scanning electron micrograph of (a) the expandable graphite flake (left side) and expanded graphite filament (right side) and (b) GNP after the drying process.
XRD analysis
In order to analyse the structure of the nanocomposites, XRD was conducted using CuKα radiation with a wavelength of 1.5406 Å.
The analysis clearly provides some evidence that a significant exfoliation process has taken place during the material processing stage. In fact, the very intensive diffraction peak present in the diffraction pattern of graphite and generated by the (002) planes (see Figure 3(a)) almost completely disappeared in the final composite material. Visibly, the diffractogram shown in Figure 3(b) contains, in addition to the two main peaks of the LDPE crystallites (which are placed over the diffuse-alone generated by the amorphous fraction of the polymer) at 21.26° and 23.61°, only a low intensity peak at 26.27° corresponding to the (002) planes of graphene nanoplatelets present in the sample,10,12 –14 which increases with the percentage of GNPs within the polymer matrix (Figure 3(c)). A TEM image of thin slices of film cross-section confirms the presence of the nanoplatelets having a thickness of about 14 nm (see Figure 3(d)). The obtained XRD diffractogram also proves the presence of an extended iso-orientation of these graphite nanoplatelets in the nanocomposite film, because the (002) peak is the only clearly visible signal of the GNP diffraction pattern, which is visible in the nanocomposite diffractogram.
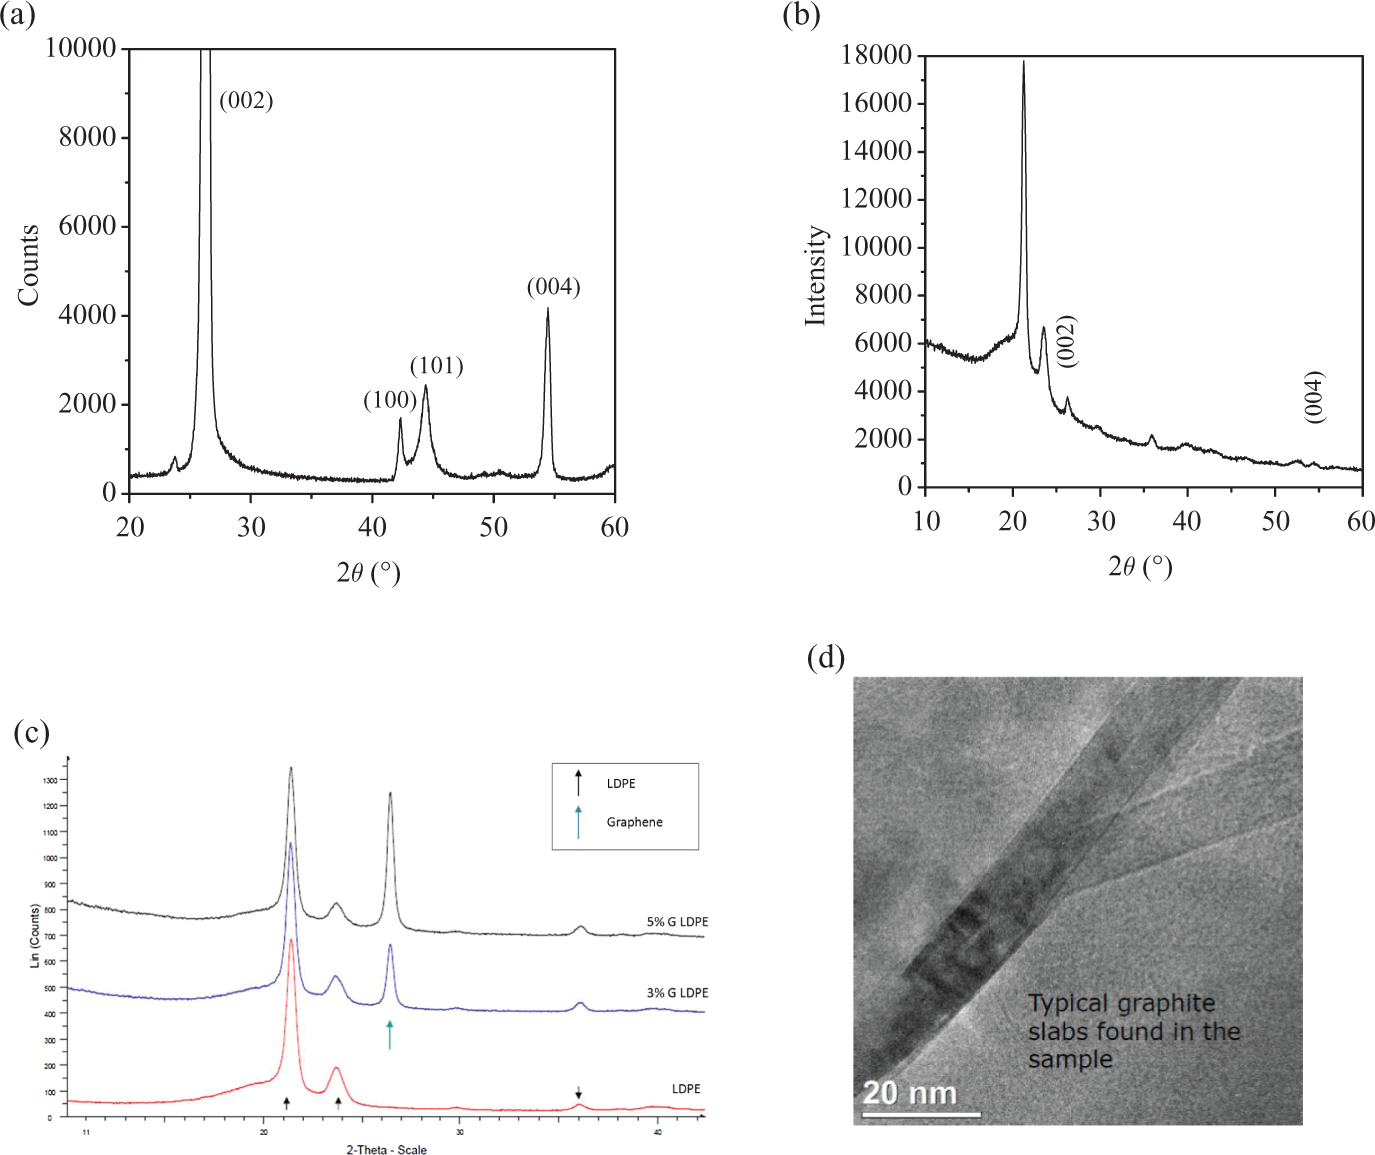
X-Ray diffraction of graphite (a), LDPE/GNP composites (b) and effect of GNP concentration (c). (d) The typical microstructure of the LDPE/GNP composite. LDPE: low-density polyethylene.
Thermal analysis
Mechanical properties of a polymer-based composite are strongly dependent on the amount of crystalline phase of the matrix; therefore, since LDPE is a semi-crystalline material, it is important to establish whether the degree of crystallinity is affected by the presence of graphene nanoplatelets. Therefore, differential scanning calorimetric (DSC) analyses were conducted on pure LDPE, and a comparison was made with composites with increasing filler content. Samples weighing 8 mg were cooled down to 25°C and then heated up to 120°C at a rate of 10°C/min under a nitrogen atmosphere to eliminate the thermal history of the sample. Figure 4 illustrates the thermograms of LDPE and LDPE/GNP composites, showing the same patterns for all the curves, with melting peaks at a temperature of 109–110°C. The degree of crystallinity for all the samples was calculated using the equation W c DSC = ΔH f/ΔH°, where ΔH f was estimated by integrating the melting peak for each sample and ΔH° is the reference heat of fusion (293 J g−1) for polyethylene with 100% crystallinity grade. 15
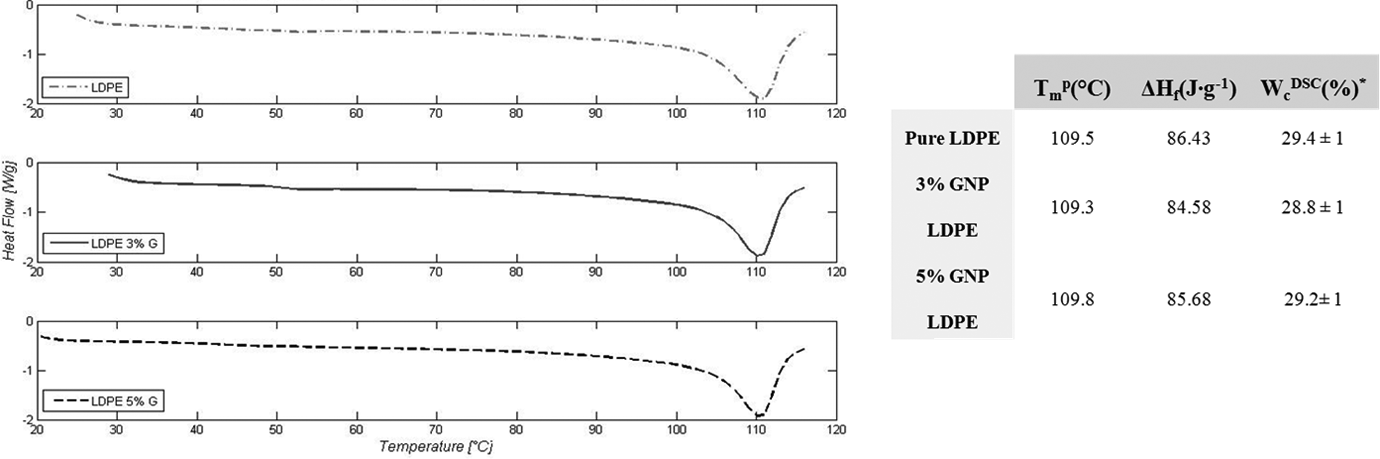
Differential scanning calorimetry thermograms and results for LDPE and LDPE/GNP nanocomposites. LDPE: low-density polyethylene.
By analysing the results, it is possible to conclude that the inclusion of GNPs within the LDPE matrix does not affect the mass percentage of crystallinity of the polymer, therefore, the variation in the mechanical properties of the composite cannot be attributed to a microscopic modification of the polymer structure, but is related to the macroscopic reinforcement effect, due to the presence of the nanoscaled filler. Similar results are reported in the literature for CNT/polymer and graphene/poly(vinyl alcohol) nanocomposites. 16,17
Dynamic mechanical analysis: Frequency sweep
The dynamic behaviour of the composite was investigated with dynamic mechanical analysis (DMA) tests conducted on LDPE specimens with an increasing amount of GNPs. Samples were tested in tensile mode at room temperature (25°C) at multiple frequencies, between 10−2 and 101 Hz. In order to test all the samples within the viscoelastic range, tests were conducted with a strain of 0.1%.
Data obtained from the test are summarised in Figures 5 and 6, and they represent the behaviour of storage modulus, loss modulus and tan δ for pure LDPE and LDPE with 3 and 5 wt% nanoplatelet concentrations. The data show an increase in the general trend of the storage modulus as the frequency increases and an enhancement of its absolute value with increasing nanoplatelets content (Figure 5(a)). The shift between the curves of LDPE and LDPE3%G is approximately 15%. A similar increment was observed when increasing the nanofiller content from 3 to 5 wt%. The behaviour of storage modulus can be explained by two different mechanisms. First, the mobility of the polymer chains is restricted by the interaction between the polymer matrix and the GNPs due to their large surface area, resulting in a stiffened interphase. Second, increasing the percentage of nanofiller within the polymer, GNPs form a mechanically stable network inside the matrix and the high storage modulus of polymer/GNP contributes to the increase in the modulus of the composite. 18
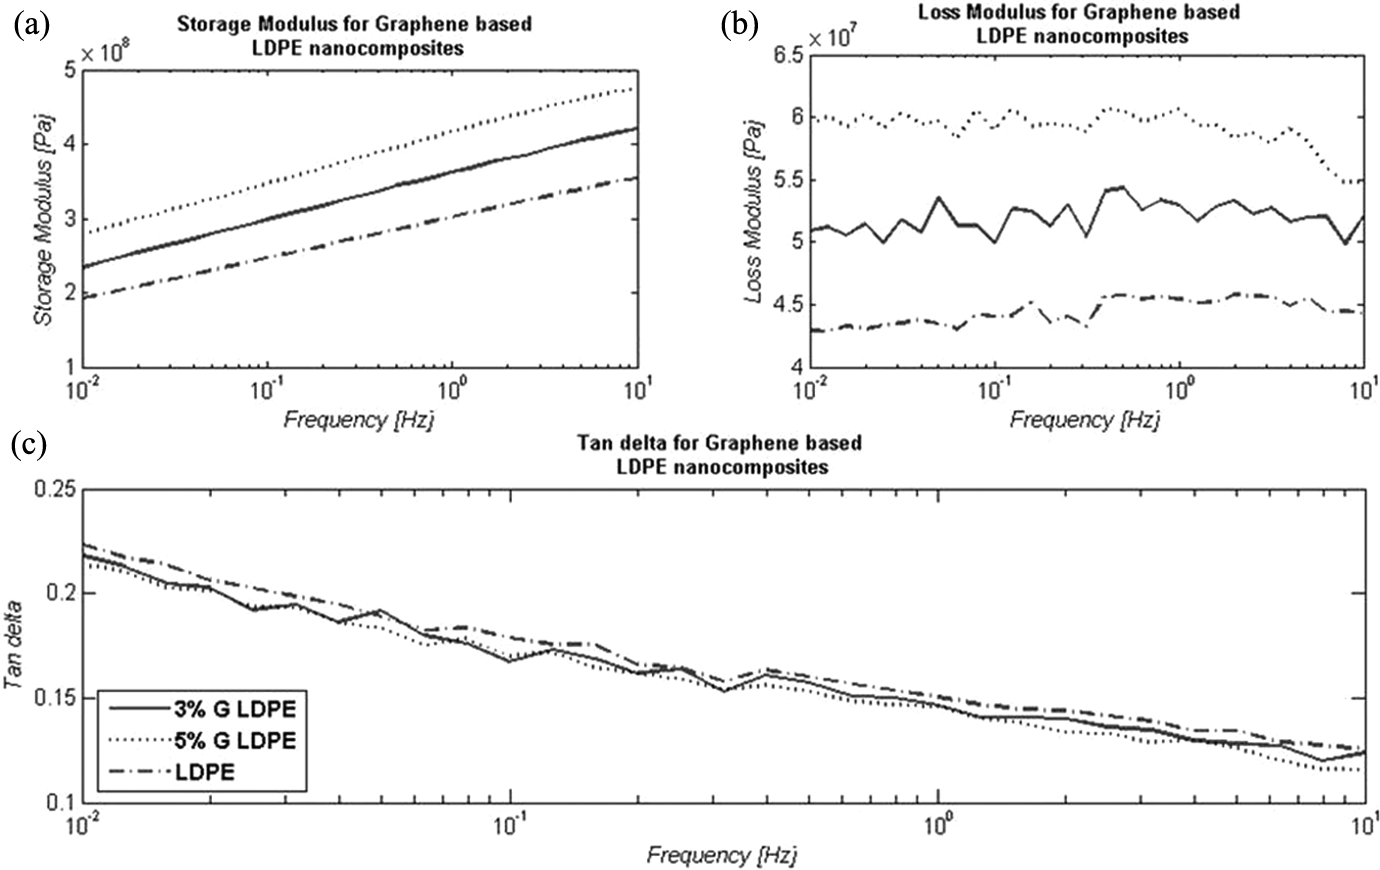
Dynamic mechanical analysis frequency sweep curves of LDPE/GNP composites: (a) storage modulus, (b) loss modulus and (c) tan δ. LDPE: low-density polyethylene.
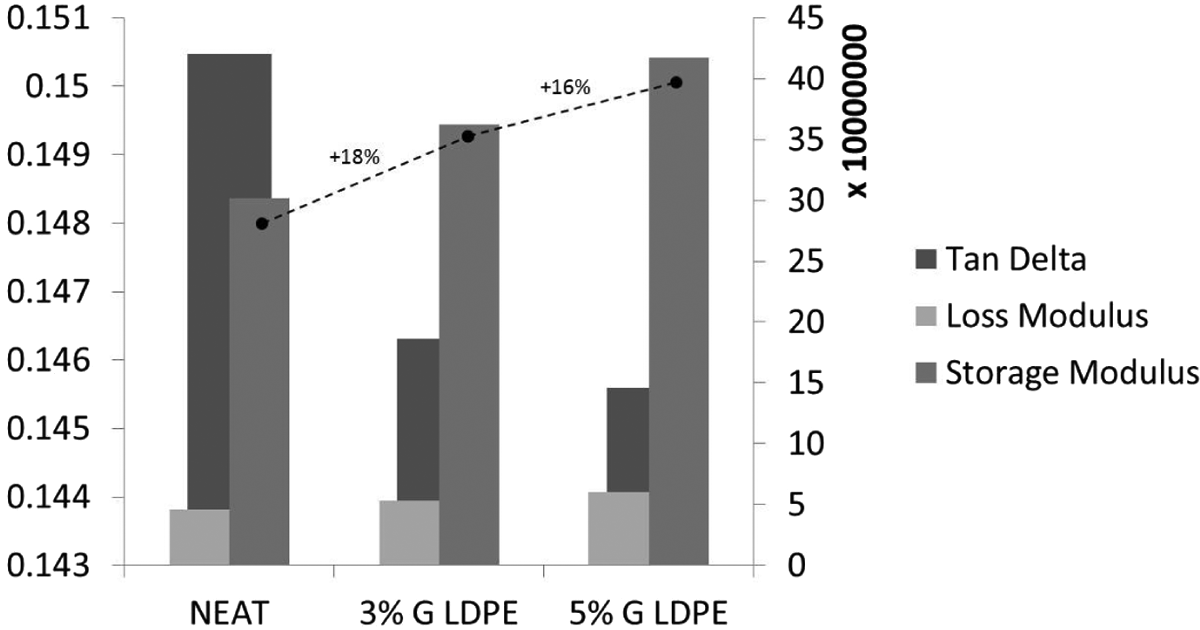
Storage modulus, loss modulus and tan δ results at 1 Hz for LDPE and LDPE/GNP composites. LDPE: low-density polyethylene.
The behaviour of loss modulus versus frequency is shown in Figure 5(b), and the general trend seems to be unaffected by the increase in frequency. However, as the amount of nanoreinforcement within the polymer grows, it leads to higher absolute values of loss modulus, which is increased by 16% for a 3 wt% GNP concentration and 14% for a 5 wt% concentration. Another important parameter in characterising the mechanical properties of a composite is the mechanical damping (tan δ) shown in Figure 5(c). Results show an overall reduction in damping as frequency is increased (which has been reported for LDPE in previous works 19 ), and a slight decrease in tan δ passing from LDPE (0.150) to LDPE5%G (0.145) is recorded. Because tan δ is obtained by the ratio of loss modulus (proportional to the energy dissipated during each cycle) to storage modulus (proportional to the total amount of energy that is stored during each cycle), such behaviour is consistent with the other results obtained and it confirms the increase in brittleness of the GNP-based LDPE nanocomposites.
Mechanical analysis: Tensile test
To investigate the mechanical performance of the LDPE/GNP composites, samples were tested using an Instron 3369 Tensile test Machine (Instron – Division of ITW Ltd). The cross head speed was set at 100 mm/min in accordance with EN ISO 527-1:1996.
Compression moulding samples
Figure 7(a) shows some representative stress–strain curves of LDPE and LDPE/GNP composites, manufactured using the compression moulding technique with an increase in the percentage of nanoreinforcement (3 and 5 wt%). The inlets in the stress–strain figures show the variation in the slopes for all the samples. As a consequence of the pressure applied, GNPs are orientated randomly in plane, leading to an in-plane isotropy. It can be seen that LDPE with a GNP loading of 3 wt% shows a 15% increase in Young’s modulus going from 301 MPa of the pure LDPE to 347 MPa. By increasing the GNP content to 5 wt%, the elastic modulus is increased by an additional 16%, reaching 407 MPa. However, as the nanofiller content is increased, maximum strain dramatically decreases from 5.8 to 0.33, while a slight decrease in maximum stress (from 16 to 12 MPa) was also observed. The presence of the GNPs within the LDPE matrix strongly affects the ductility of the polymer, shifting the stress–strain curves to a more brittle behaviour. As shown in Figure 7(b), after yielding, while LDPE is capable of withstanding much greater extension (up to 600%) by activating necking and cold-drawing mechanisms, GNP-based composites exhibit a very small plastic region (covering strains of 20–30%) resulting in an almost brittle fracture immediately after the yield point (Figure 7(c)). The reason for this modification may be attributed to the reduced polymer mobility due to the presence of graphene sheets. Indeed, the large aspect ratio of the filler and the interaction with the LDPE matrix can obstruct the reciprocal chains’ movements, resulting in a more brittle material. 20 Moreover, the reduction in tensile strength could be explained by the presence of relatively large inhomogeneities (graphite agglomerates) within the LDPE matrix that lead to structural imperfections and that can generate premature cracks. 21,22
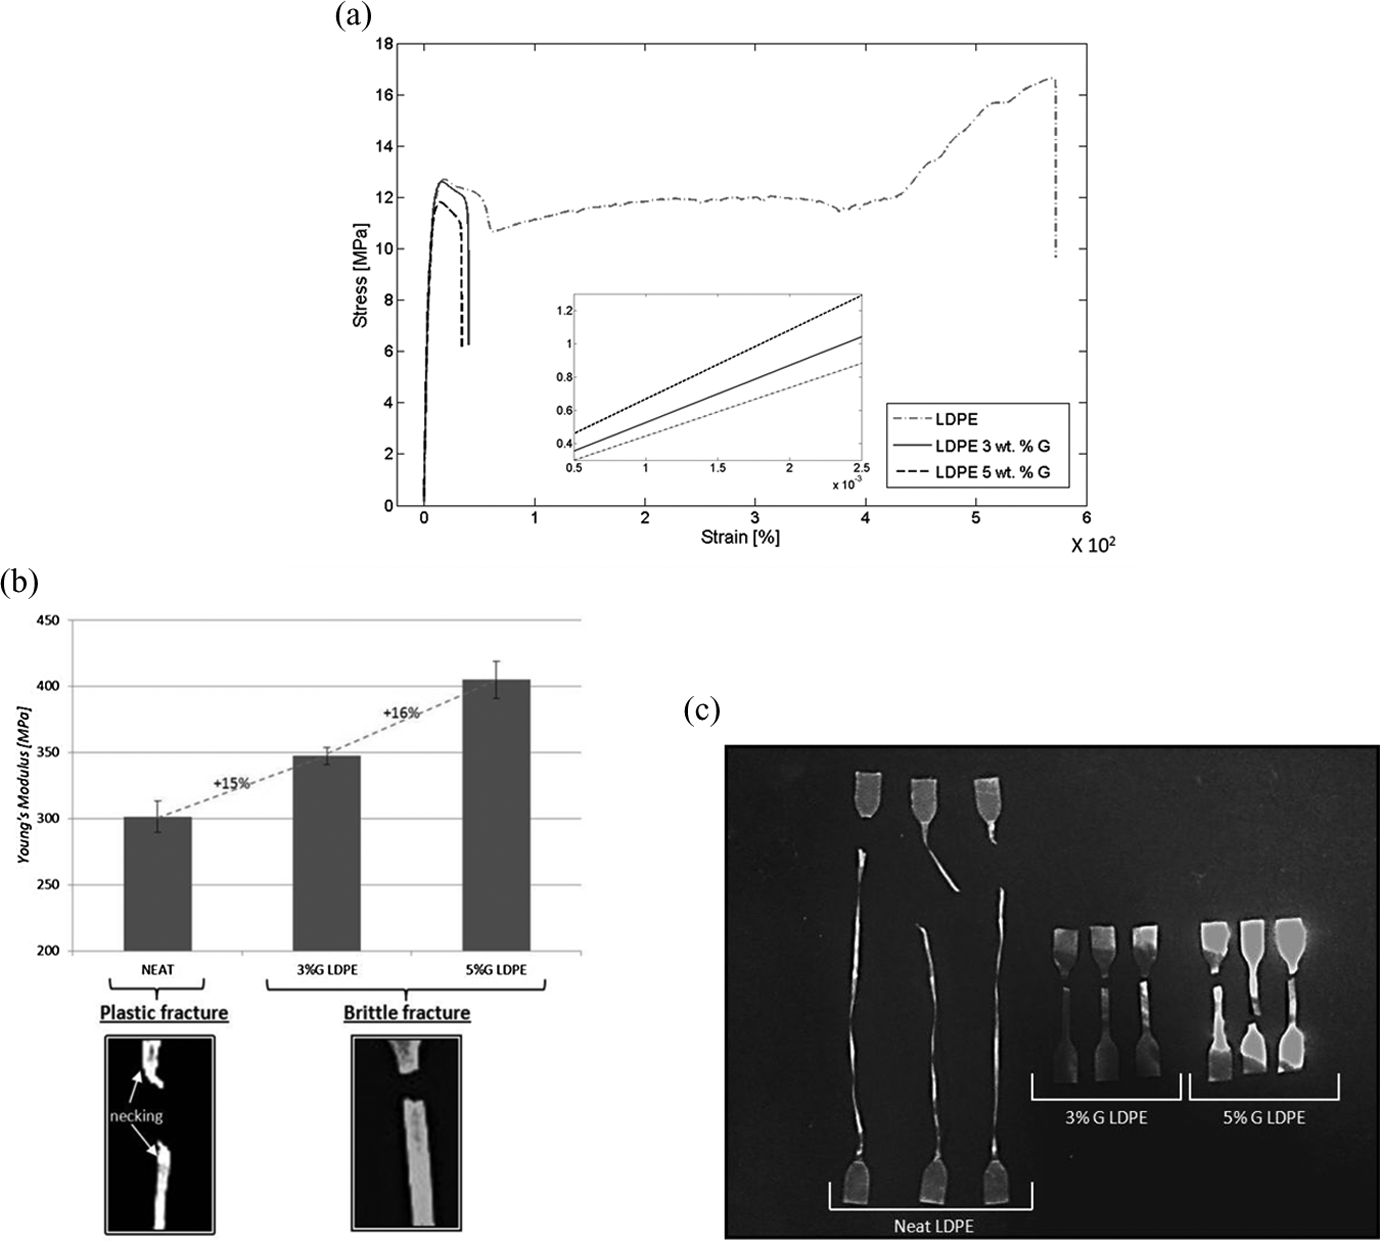
(a) Stress–strain curves of neat LDPE and composites with increasing content of GNP. The inlet shows the slopes of the curves. (b) Relation between Young’s modulus increase and change in fracture mode of LDPE and LDPE/GNP composites; (c) LDPE and LDPE/GNP composite samples after tensile test. LDPE: low-density polyethylene.
Blown extrusion samples
As explained in Material preparation section, blown extrusion process leads to composite films characterised by a high grade of anisotropy. Because the material is stretched after the insufflations of air, GNPs will be orientated in the direction of the flow, resulting in a material that is characterised by different mechanical properties in the machine direction (MD) and in transverse direction (TD). The first series of tests were carried out on unreinforced LDPE, and are shown in Figure 8(a). As it is possible to observe from the differences in the stress–strain curves, LDPE shows a behaviour that is very similar to the one observed for the compression-moulded samples in TD; however, the maximum strain reached is only 300%, while it was almost twice this value for the unreinforced LDPE. The orientation effect of the polymeric chains is clearly shown in the curve relative to the MD samples, where LDPE acts more like a brittle material, reaching higher values of tensile strength but a lower maximum strain. Similar results were reported by Guichon et al. 23 Another important consideration regarding the Young’s modulus value is that the properties are only slightly changed in the TD and MD (180 MPa for TD and 185 MPa for MD), meaning that the orientation of the chains affects principally the necking and recrystallisation phases and not the elasticity of the polymer. In Figure 8(b), the stress–strain curves of nanoreinforced LDPE with 5 wt% GNPs in both MD and TD are shown. As for pure LDPE, it is possible to observe the effect produced by the orientation of the graphene nanoplatelets. In the TD, a brittleness similar to that of a compression-moulded nanocomposite is observed, while in the MD, the orientation of GNPs leads to higher tensile strength (increasing from 15 to 23 MPa) and also higher strain (increasing from 0.7 to 1.1). Young’s modulus dependence on the orientation is more pronounced in the case of the composite than for the neat polymer, increasing from 430 to 477 MPa. This behaviour can be explained on the basis of the presence of oriented GNPs that affect the elastic behaviour of the composite, increasing its stiffness. Figure 9(a) and (b) illustrates the stress–strain curves comparison of neat LDPE and GNP composites for blown-extruded film in TD and MD. The Young’s modulus is increased for both TD (from 180 to 425 MPa) and MD (from 187 to 477 MPa; see Figure 10), while the maximum strain is reduced by 75% for TD and by 10% for MD. However, regarding maximum stress, for TD samples the doping of GNPs within the LDPE matrix leads to an increase in tensile strength of 30%, while for MD samples, it was almost constant (a small reduction is recorded, which falls within the bounds of intrinsic experimental error).
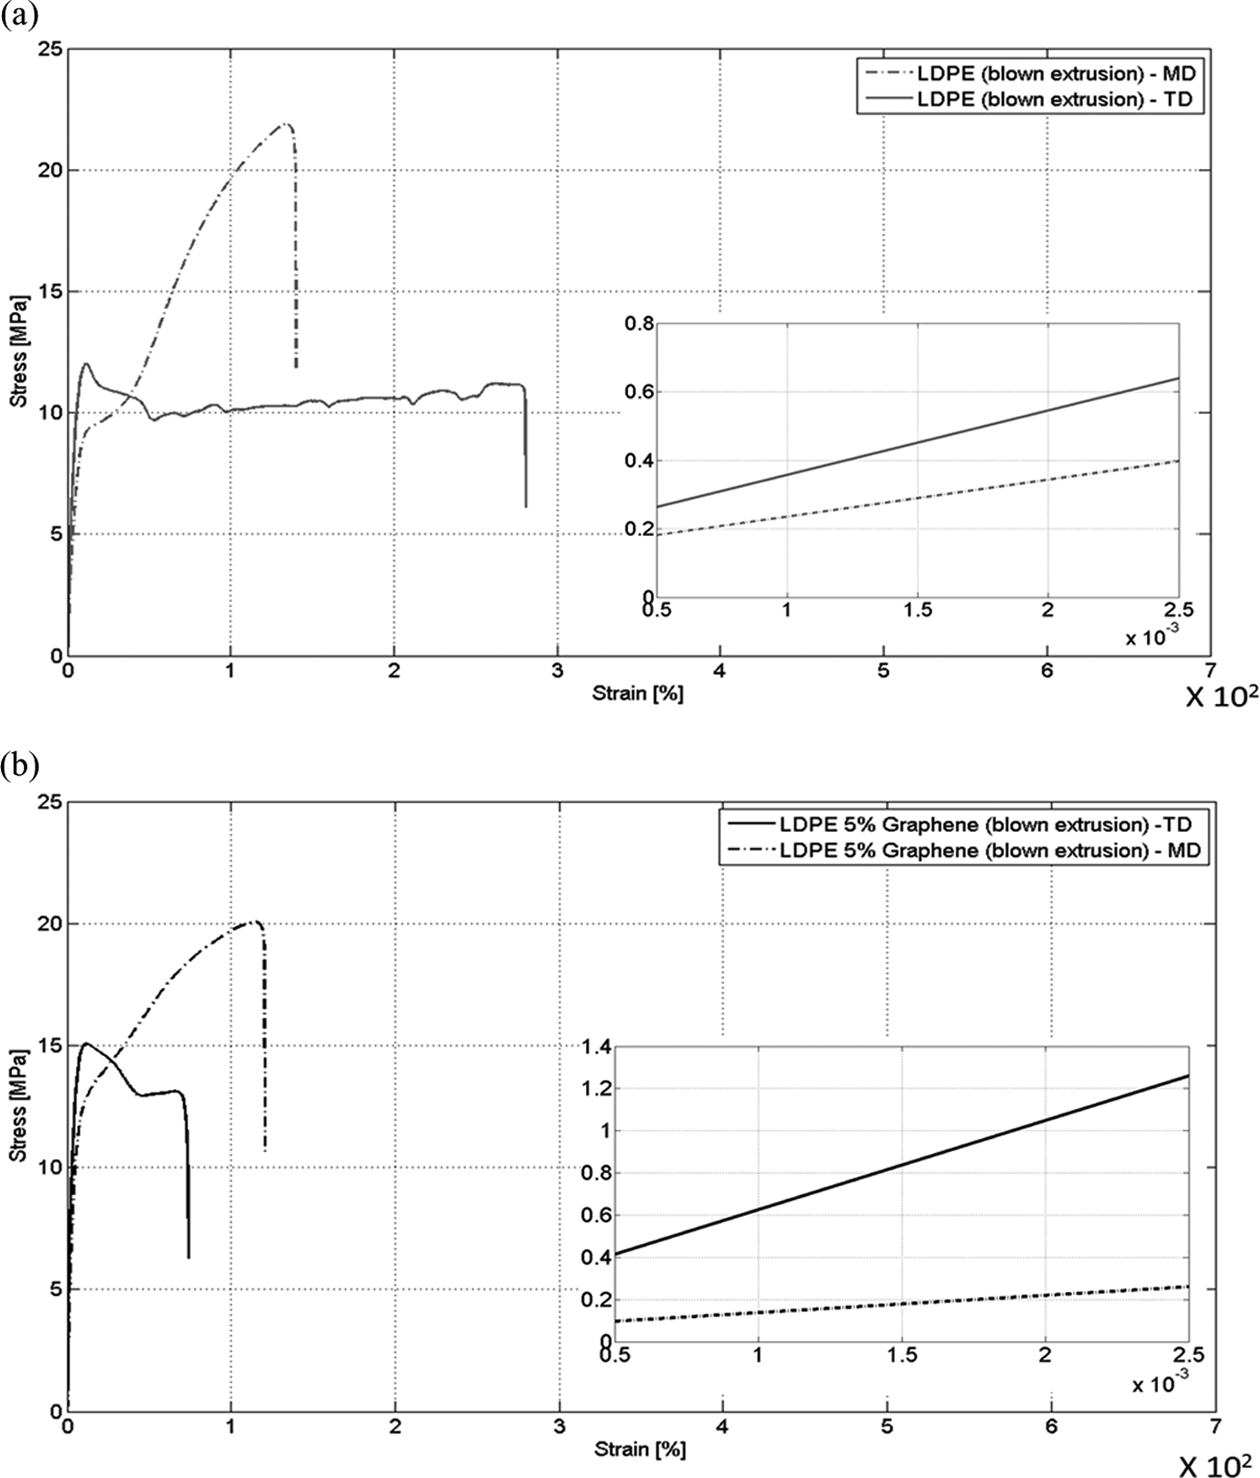
Stress–strain curves of (a) neat LDPE in blown extrusion process; (b) LDPE/GNP composites in blown extrusion process. The inlets show the slopes of the curves. LDPE: low-density polyethylene.
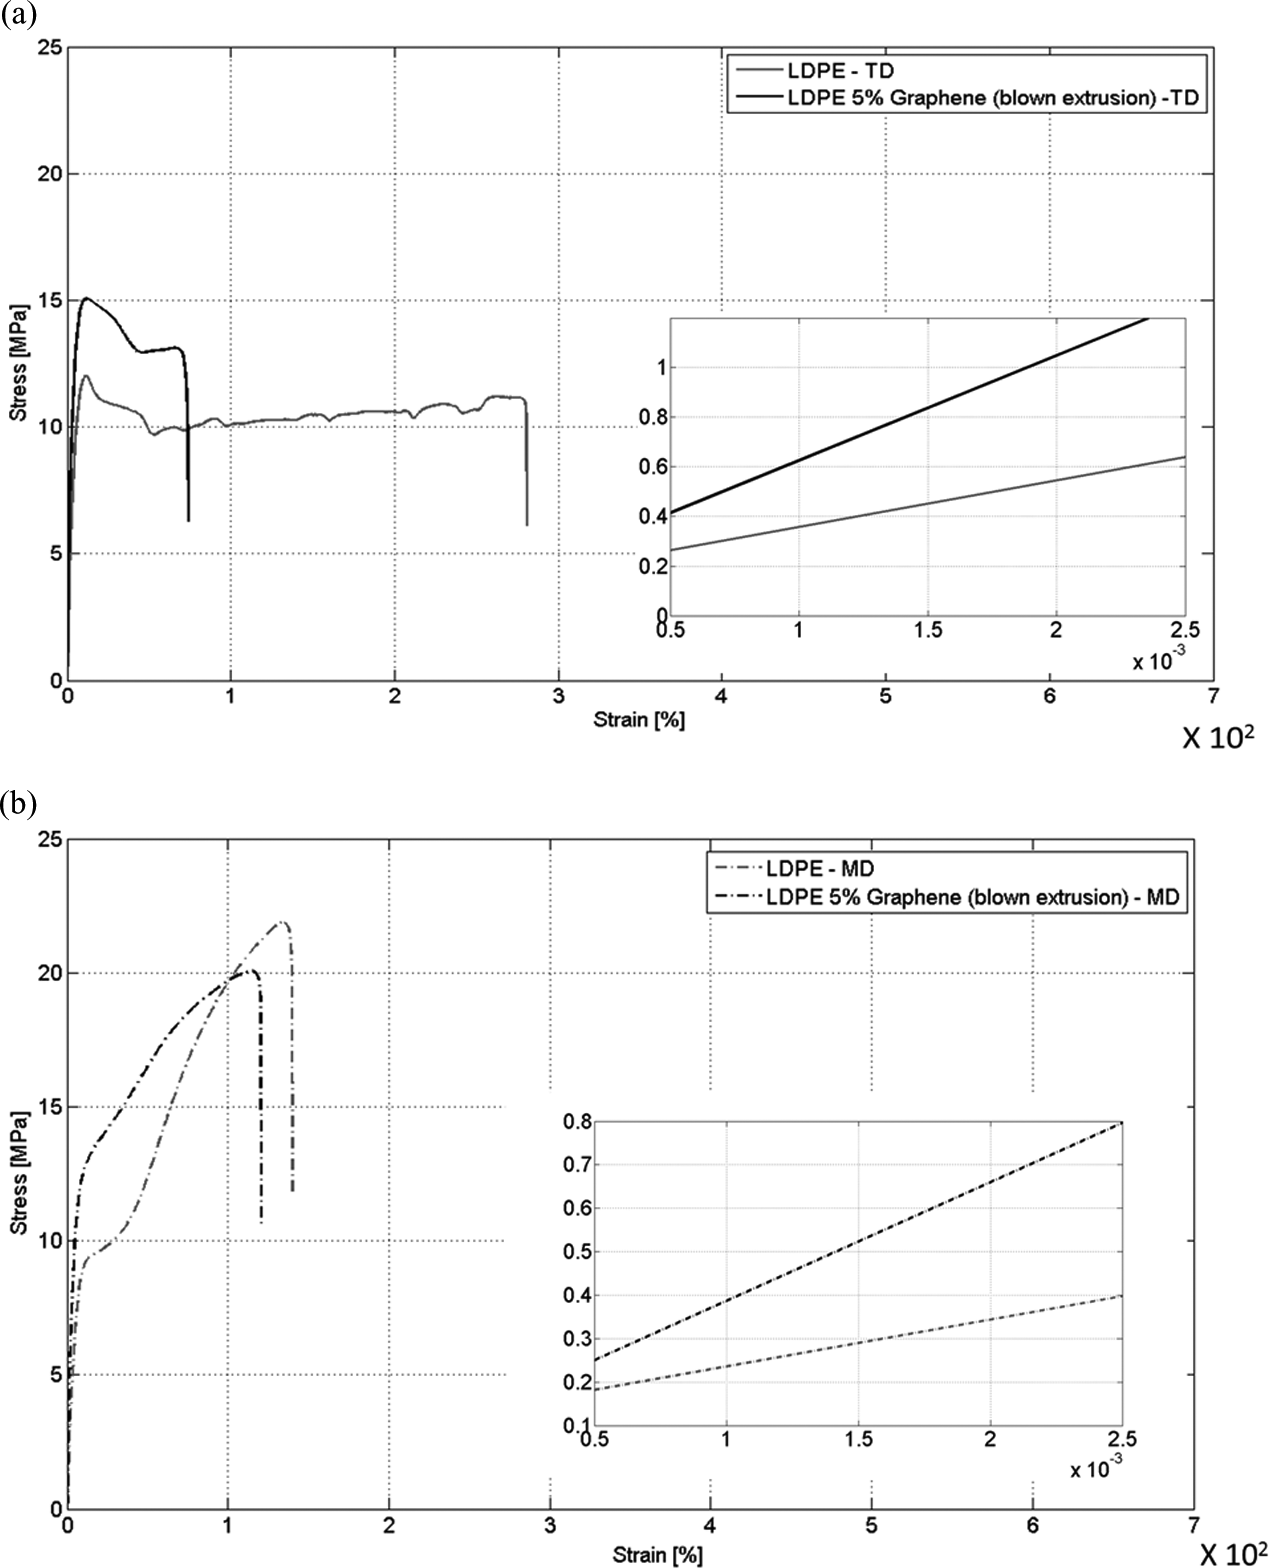
Comparison between stress–strain curves of LDPE/GNP composites and pure LDPE in transverse direction (a) and machine direction (b). The inlets show the slopes of the curves. LDPE: low-density polyethylene.
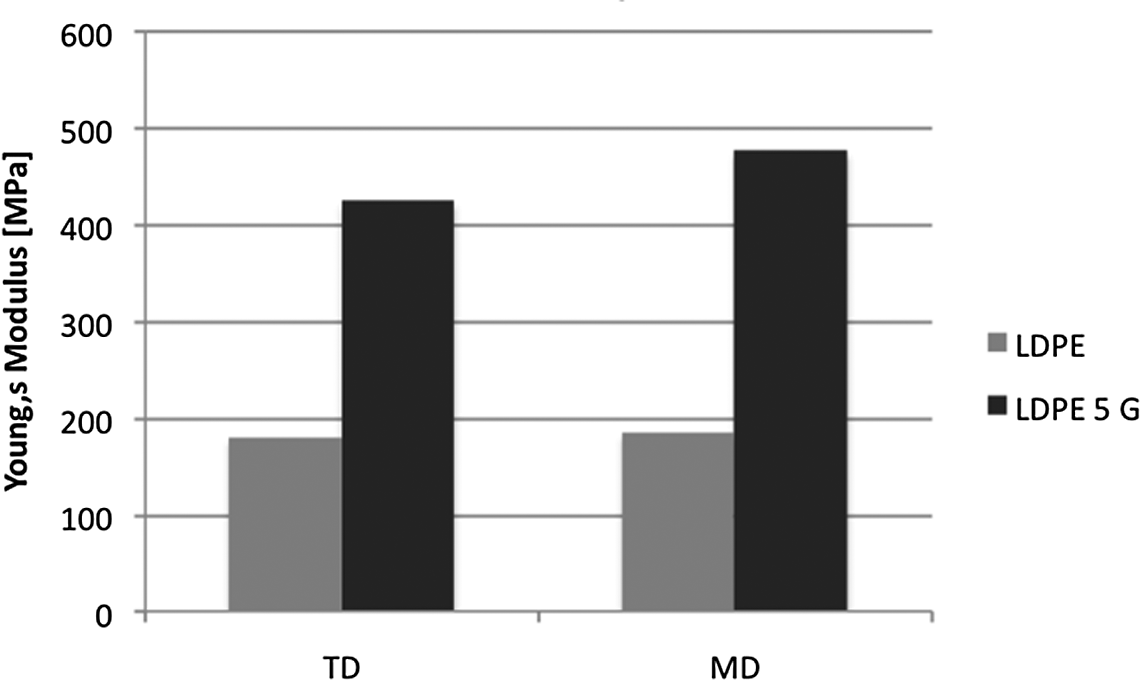
Increase in Young’s modulus of LDPE/GNP in both transverse and machine directions. LDPE: low-density polyethylene.
Halpin–Tsai Young’s modulus evaluation model
The Halpin–Tsai model is widely used to predict the elastic modulus of both unidirectional and randomly distributed nanofiller-reinforced polymers.
17,24,25 Considering the compression-moulded LDPE/GNP samples, the Halpin–Tsai equation is written as
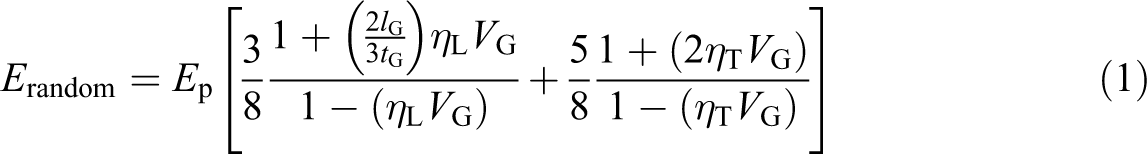
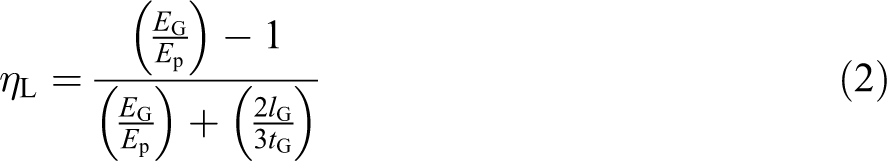
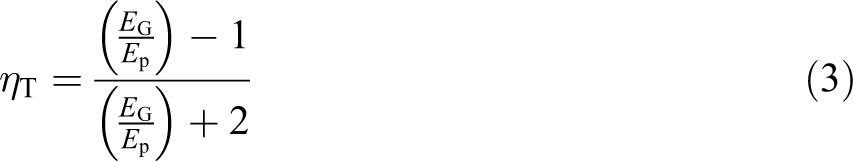
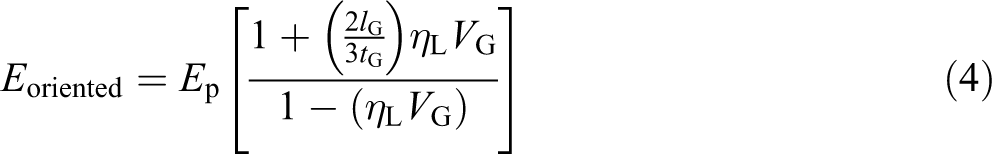
where E is the Young’s modulus of the composite with randomly oriented nanofillers, E p and E g are the tensile moduli of LDPE (obtained from the tensile test) and graphene (∼1 TPa), l G, t G and V G are, respectively, the length of one GNP (∼1 μm), its thickness (∼20 nm) and the volume fraction of the nanoreinforcement, which is calculated from the weight fraction.
The results in Figure 11(a) illustrate how the experimental data match the theoretical model. For blown-extruded samples, GNPs are oriented in the flow direction, therefore, the Halpin–Tsai equation becomes:
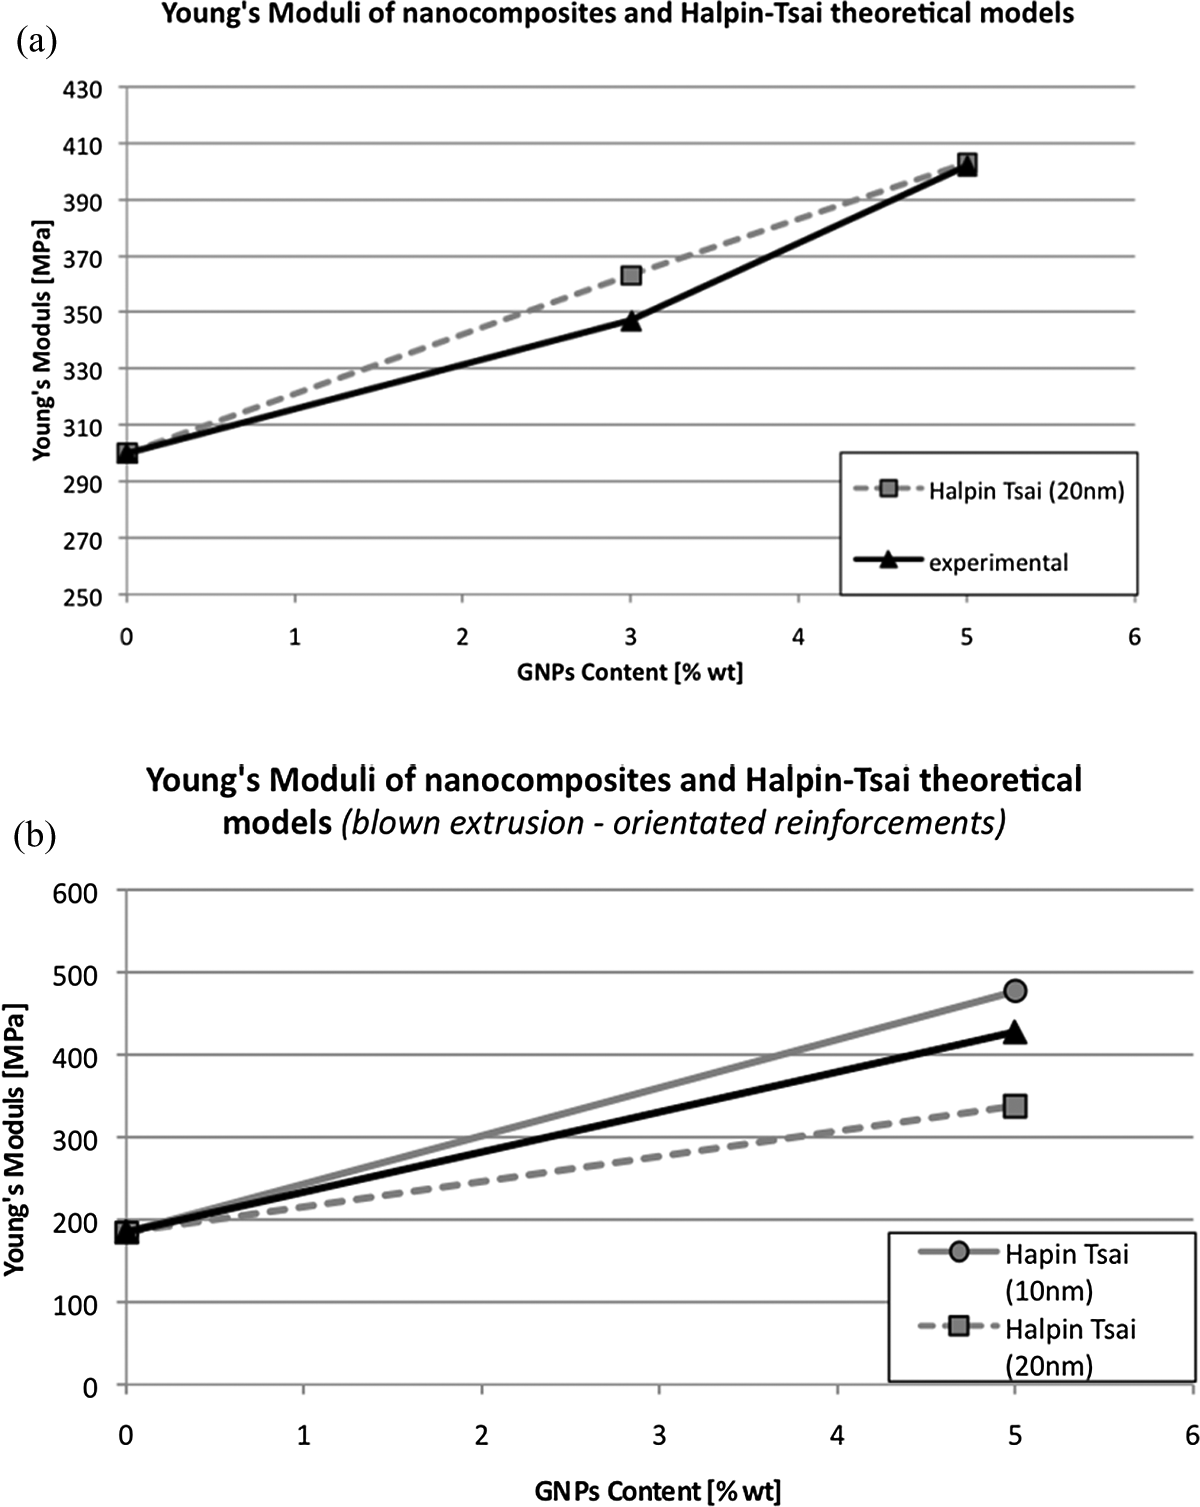
Comparison between Halpin–Tsai modulus evaluation model and experimental data for (a) compression-moulded LDPE/GNP composites and (b) blown-extruded LDPE/GNP composites. LDPE: low-density polyethylene.
Figure 11(b) shows the comparison between the theoretical model and the experimental data for the blown-extruded LDPE/GNP composites. As it can be seen from the curves, the experimental value of Young’s modulus for the composites is higher than that predicted by the Halpin–Tsai equation by almost 50%. One possible explanation for this difference could be due to the dimensions of the nanoplatelets after the manufacturing process. During the extrusion process, GNPs are strongly stretched in the MD; therefore, as the different graphene layers are bonded together only by weak van der Waals forces, this stretching effect could lead to a thinning of the graphene nanoplatelets. This thickness reduction is confirmed by the matching of the experimental data with the 10 nm thickness theoretical curve.
Conclusion
Graphene nanoplatelets-reinforced LDPE composites were prepared by incorporating dried nanoplatelets obtained by exfoliation of expanded graphite within a LDPE matrix. The thickness of GNP was evaluated by SEM analysis, and an average value of 20 nm and a length of ∼1 μm were found. XRD analysis was carried out to evaluate the presence of GNPs within the composites and the results confirm the semi-crystalline structure of LDPE with the detected peak at ∼26.5° related to the distance between the different layers of graphene nanoplatelets. The amplitude of this peak increases with the percentage of GNPs within the polymeric matrix. Thermograms obtained by DSC analysis were analysed in order to fully understand the effect of GNPs on the microscopic structure of the LDPE and the results show that the inclusion of the nanofillers does not affect the mass percentage crystallinity of the polymer. As a consequence, the variation in the mechanical properties of the nanocomposite cannot be attributed to a microscopic modification of the polymer structure, but only to the macroscopic reinforcement effect caused by the presence of the nanoscaled filler. DMA data show an increase in both storage and loss modulus. For compression-moulded samples, an increase in the tensile modulus of ∼30% for a 3 wt% GNP and of 36% for a 5 wt% of GNP is reported. Moreover, the stress–strain curve of the composites exhibits a very small plastic region resulting in an almost brittle fracture in comparison with the pure LDPE, due to the presence of large graphite agglomerates. Blown-extruded samples exhibited a high level of anisotropy due to the stretching of LDPE and GNPs during the manufacturing process. For both MD and TD samples, the presence of GNPs leads to a larger increase in the tensile modulus (∼135% in TD and ∼160% in MD), resulting in more brittle behaviour of the TD samples. Tensile strength is increased by almost 30% in TD, while it stays constant for the MD samples. This effect can be attributed to the LDPE’s ability to activate necking and cold-drawing mechanisms resulting in recrystallisation. Results obtained by tensile tests were compared with the Halpin–Tsai model showing good matches for samples obtained with compression moulding (in-plane randomly oriented nanofillers), while the experimental data curve of blown extruded samples (highly oriented nanoplatelets) presented slightly higher values than the theoretical model. This result can be explained by a reduction in the thickness of GNPs within the polymeric matrix due to the strong orientation acquired during the extrusion process.
Footnotes
Acknowledgements
The authors would like to acknowledge Dr Simon Pickering and Diego Colombara, University of Bath, for their valuable suggestions during this work.
Funding
This research received no specific grant from any funding agency in the public, commercial or not-for-profit sectors.