
Abstract
The thermal decomposition behavior of poly(ether imide) (PEI)/carbon fiber composites used in aeronautical field was studied using thermogravimetric analysis in an inert atmosphere, at several heating rates between 2 and 10°C min−1. The activation energies (E a) were determined by Flynn–Wall–Ozawa (FWO) and Kissinger methods, and the preexponential factor (A) was calculated by the FWO method. The obtained data were used in order to predict the thermal lifetime of the material under the established temperature range and 5% mass loss criterion. Overall, the results represented PEI’s good thermal stability. Furthermore, it was concluded that the material can be safely applied for aeronautical use.
Introduction
In the last few decades, some aromatic thermoplastic polymers have been introduced to prepare new low-density and high-performance materials to be used for structural applications. Since these polymers can be subjected to high temperatures during processing or repair, often more than 300°C, good thermal stability as well as the retention of physical properties at high temperatures is required. 1 Among those polymers is the poly(ether imide) (PEI), a high-performance amorphous thermoplastic that presents high thermal stability, with a T g of around 215°C, and remarkable modulus of elasticity and tensile strength values. 2 , 3 The aromatic imide units of PEI’s chain provide the higher thermal stability, while the flexible ether linkages provide good processability. 4
PEI/carbon fiber composite offers outstanding toughness and high heat resistance. The material is inherently flame resistant, leading to low smoke emission. Nowadays, PEI/carbon fiber composite is qualified for both structural and interior applications, by Airbus and Boeing companies, presenting continuous service temperature of 200°C. 5
Thermal stability studies of polymers are a matter of great interest due to the technical and commercial importance of these materials, with the kinetic analysis of thermal degradation playing an important role in such studies. 6 , 7 Concerning kinetic analysis, both isothermal and nonisothermal methods are applied using mainly differential scanning calorimetry and thermogravimetric analysis (TGA). However, the isothermal measurements are rather time consuming and difficult to bring the sample to the required temperature without any decomposition. The nonisothermal or the dynamic method developed by Flynn and Wall is, therefore, the most widely used, as it requires less time to perform the experiments and also overcomes the shortcoming of an isothermal method. 8 The dynamic method assumes a first-order kinetics, which is generally applied for most polymers. When their early stages of decomposition are considered the thermal behavior resembles the first-order kinetics. 8 , 9
Kinetic analysis of the nonisothermal data leads to values of activation energy that can be used to predict the thermal lifetime of polymeric materials. 10 This approach is important to ensure service performance, especially for critical applications such as aerospace and defense. 8 Using proper kinetic expressions and through extrapolation of the results, the service life estimation of a material can be fairly accurate. 8–11
Thus, in order to know the degradation kinetics of the PEI matrix, under a nitrogen atmosphere at different heating rates, the thermal decomposition of the PEI/carbon fiber composite was studied by TGA. The kinetic analysis data were obtained by applying Flynn–Wall–Ozawa (FWO) 12 and Kissinger 13 methods. Finally, the lifetime of the studied material was predicted using the kinetic parameters obtained.
Experimental
Materials
PEI/carbon fiber composite plates were obtained from TenCate Advanced Composite Company (Nijverdal, The Netherlands) with dimensions of 450 mm × 450 mm and 2.0 mm thickness. According to the supplier, the PEI matrix has a T g around 215°C and T m around 300°C. The laminate presents the PEI matrix content by weight of 42% and by volume of 50%. The chemical structure of PEI is shown in Figure 1.
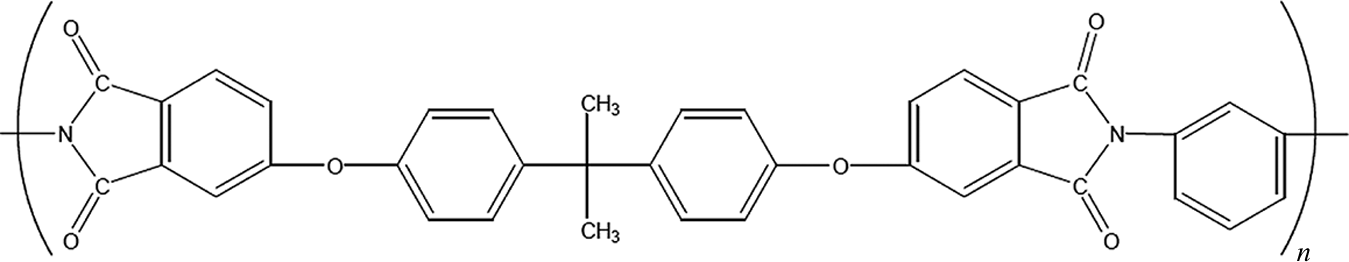
Chemical structure of poly(ether imide).
Thermal analysis
TGA was performed on a SII Exstar 6000 equipment, (Seiko Instruments Inc.), series TG/DTA 6200, under a nitrogen atmosphere (flux of 100 mL min−1), in the temperature range of 25 to 1000°C. Dynamic experiments were carried out at heating rates of 2, 4, 6, 8 and 10°C min−1, using samples of about 5 mg. The variation in weight was calculated by equation (1).

where m is the actual mass, m i is the initial mass and m f the final mass.
Kinetics analysis
The method suggested by Kissinger and the method suggested independently by Flynn and Wall and by Ozawa (FWO method) were applied for the evaluation of the dependence of the activation energy on the conversion degree.
The rate of a thermal reaction depends on the extent of conversion, temperature, and time. The degree of conversion (α) is defined as the ratio (m
i − m)/(m
i − m
f). For each process, the reaction rate is a function of conversion, f(α), and must be determined from the experimental data.
14
The dependence of α on temperature is described by equation (2):

where k(T) is the rate constant and f(α) is the reaction model. Depending on the reaction mechanism, the reaction model may take various forms.
14
The temperature dependence of the rate constant is expressed in terms of the Arrhenius model (equation (3)):

where T is the temperature, R is the gas constant, A is the preexponential factor, and E a is the activation energy.
Associating equation (3) with equation (2), the following equation (4) can be obtained:

Under nonisothermal conditions, in which the samples are subjected to a heating rate (β), β = dT/dt, the time dependency can be eliminated as expressed in equation (5):

FWO method
The thermal degradation kinetics, based on the FWO method, require at least three different heating rates.
8
Considering α = E
a/RT, equation (5) can be rearranged into equation (6):

FWO method uses Doyle’s approximation
15
of the temperature integral. This method is based on equation (7):

Thus, the plot ln β vs. (1/T), obtained from TGA curves recorded at several heating rates, should form a straight line whose slope allows evaluation of the activation energy, for different conversion levels ranging from 5 to 25%,
6
,
15
as shown in equation (8):

Kissinger
In Kissinger’s method, it is assumed that the temperature of maximum deflection in differential thermal analysis is also the temperature at which the reaction rate is a maximum.
16
The maximum rate occurs when the derivative of equation (5) is zero. Kissinger’s method considers the maximum temperatures (T
m) of the first derivative weight loss curves. Therefore, equation (5) is differentiated with respect to T and the resulting expression set to zero.
16
Upon rearranging the expression, equation (9) is derived:

Thus, the activation energy can be determined from a plot of ln(β/T 2 m) against 1/T m.
Lifetime estimation
The lifetime of the samples can be calculated, at a constant conversion degree, using equation (10):

where t f is the estimated time to failure; T f is the failure temperature; a is a tabulated value that depends on E a at the failure temperature T f. 8
Results and discussion
Thermal analysis
Thermogravimetry is the most widely used technique to characterize the thermal decomposition of polymers, it requires a small sample, and the entire process can be completed in a few hours. 14 The thermal stability of PEI/carbon fiber composites was evaluated by dynamic TGA under nitrogen, at five different heating rates 2, 4, 6, 8 and 10°C min−1. Figure 2(a) and (b) shows the TGA and the differential weight loss (differential thermogravimetric (DTG)) curves, respectively. According to the obtained results from TGA, the material analyzed presents good thermostability, since the degradation process starts at temperatures higher than 450°C. Similar curves were obtained for all heating rates, with a shift to a higher temperature with the increase in the heating rate, the percentage weight loss also varied, from 21 to 25%, with a remaining residue of 75 to 79%. As during decomposition, under an inert atmosphere, carbon fibers are relatively stable; and the resulting polymer residue varied from 17 to 21% mass loss.
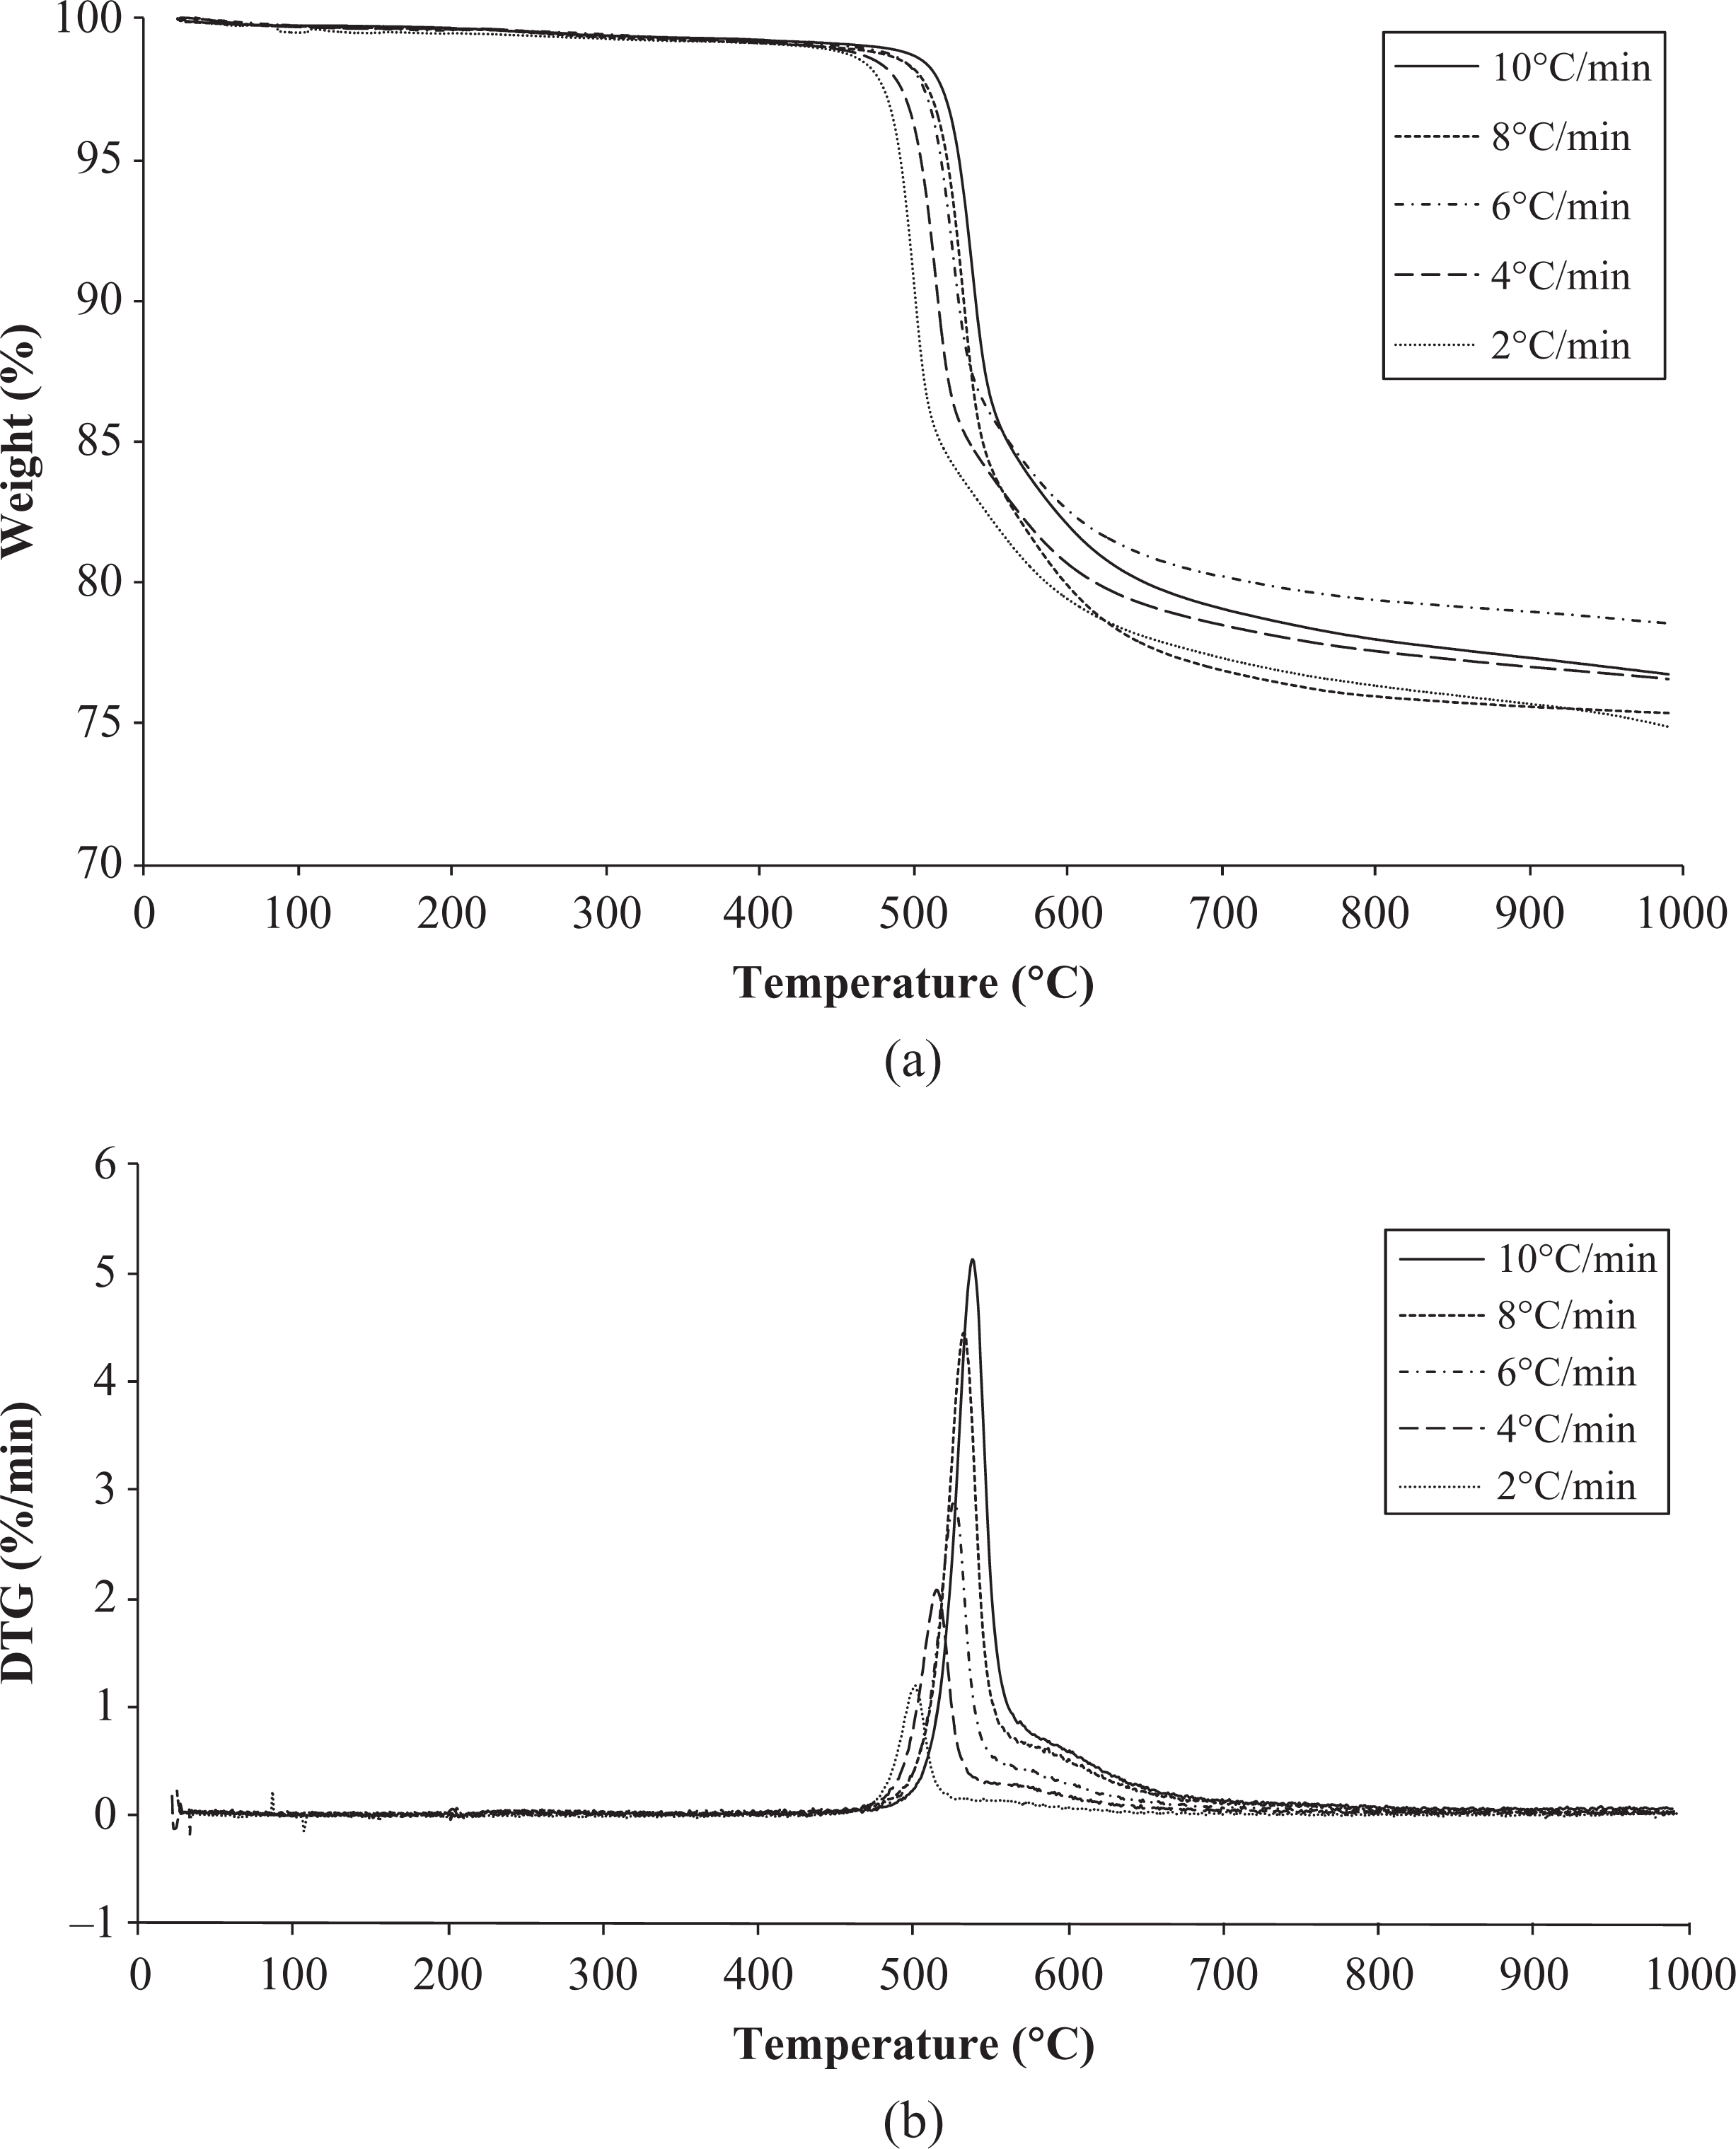
TGA (a) and DTG (b) curves of PEI/carbon fiber in nitrogen atmosphere at five different heating rates. TGA: thermogravimetric analysis; DTG: differential thermogravimetric; PEI: poly (ether imide).
Moreover, the TGA and DTG curves (Figure 2(a) and (b)) suggest that PEI undergoes two-step degradation. In a pyrolysis study on PEI by TGA/mass spectrometry in an inert atmosphere, 17 it is reported that the scission of the imide group (Figure 1) seems to play an important role in a two-stage pyrolysis process. The main pyrogram of around 540°C (first step) owes to the formation of carbon dioxide (CO2) and other predominant pyrolysates, such as phenol, benzene, and aniline. 17 At the second step, above 560°C, the partially carbonized structure undergoes further pyrolysis, with the remaining imide group formed to give CO2 as the major product along with benzene and benzonitrile, as pyrolysates. 17 In the present work, the main degradation step is the evaluated thermogram portion, from 450 to 550°C.
Kinetics analysis
The TGA curves (Figure 2(a)), at different heating rates, were applied to calculate the activation energies using the FWO method. In Figure 3, log β as a function of 1000/T is plotted at different degrees of conversion, varying from 5 to 12.5% with intervals of 2.5%. As can be observed from this figure, the results show parallel linear straight lines fitted to the experiment that validates the model.
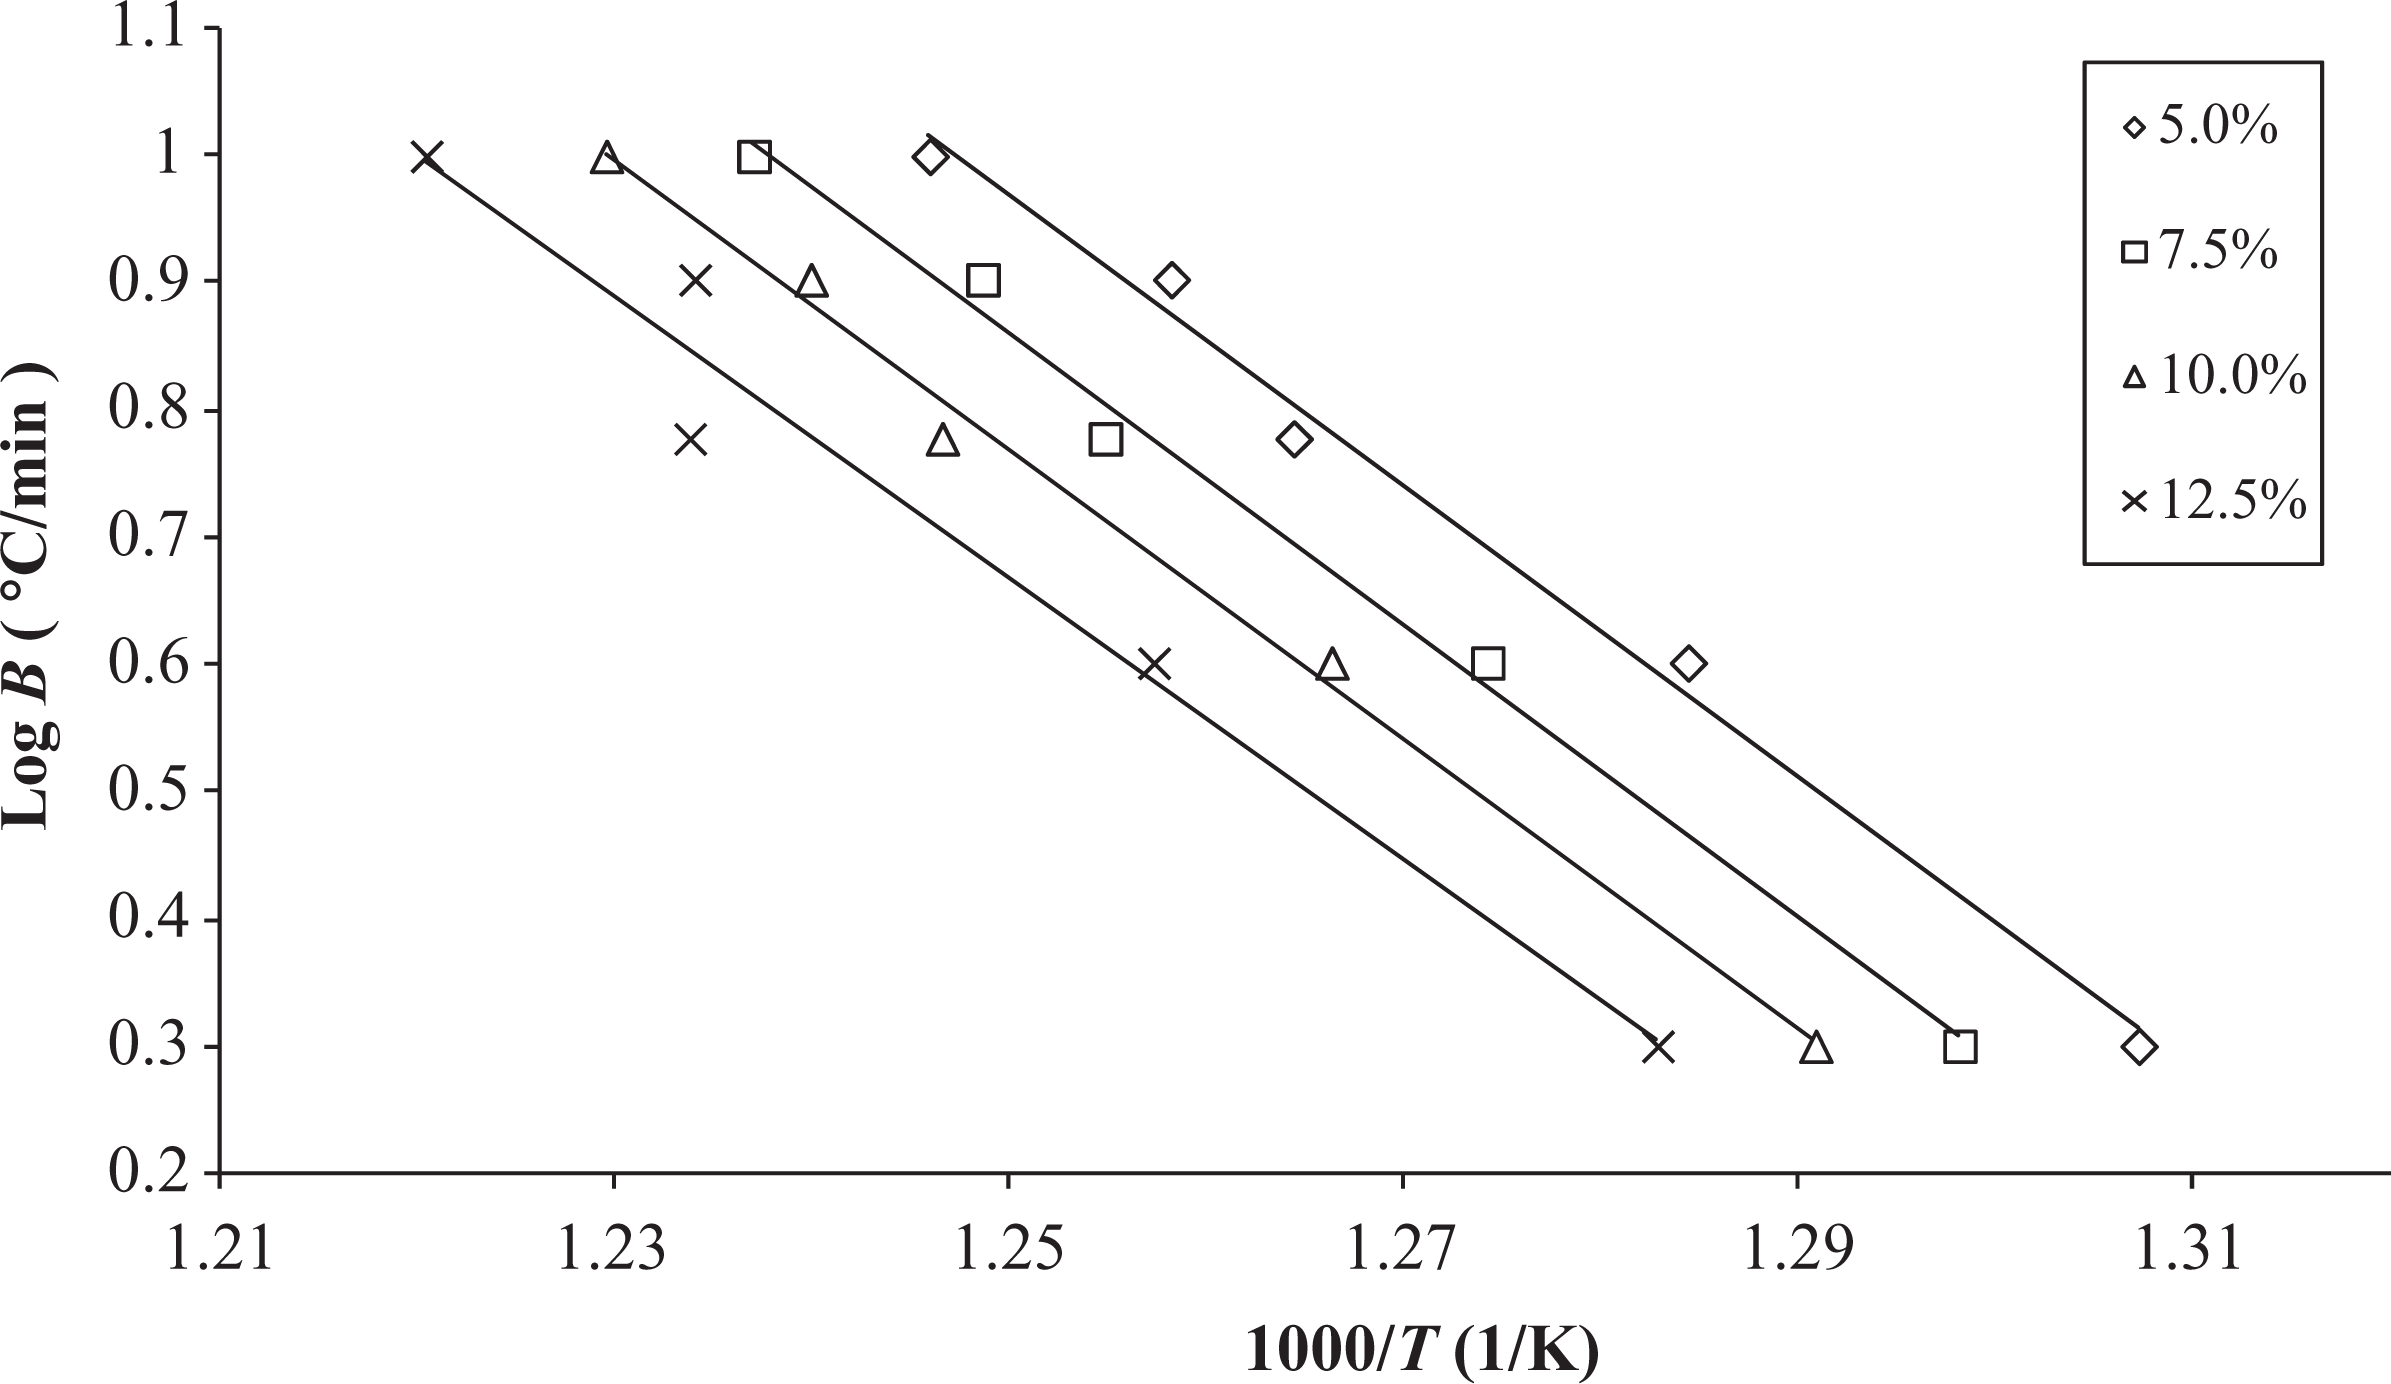
FWO plots obtained from TGA curves at different degrees of conversion. TGA: thermogravimetric analysis; FWO: Flynn–Wall–Ozawa.
The activation energy (E a) and the preexponential factor (A), calculated from the curves in Figure 3, are shown in Table 1. According to these results, the activation energy increases upto 7.5% conversion followed by a gradual decrease. This behavior can be better visualized in Figure 4, which plots the E a versus the conversion degrees (α). The plots indicate that at nearly 10% conversion, the thermal degradation process is facilitated; thereby, the energy necessary to break the primary bonds of the PEI’s polymeric chain is reduced after this conversion. Consequently, the greatest value of activation energy was obtained for 7.5% conversion (E a = 206.25 kJ mol−1), which is the main barrier to the degradation process.
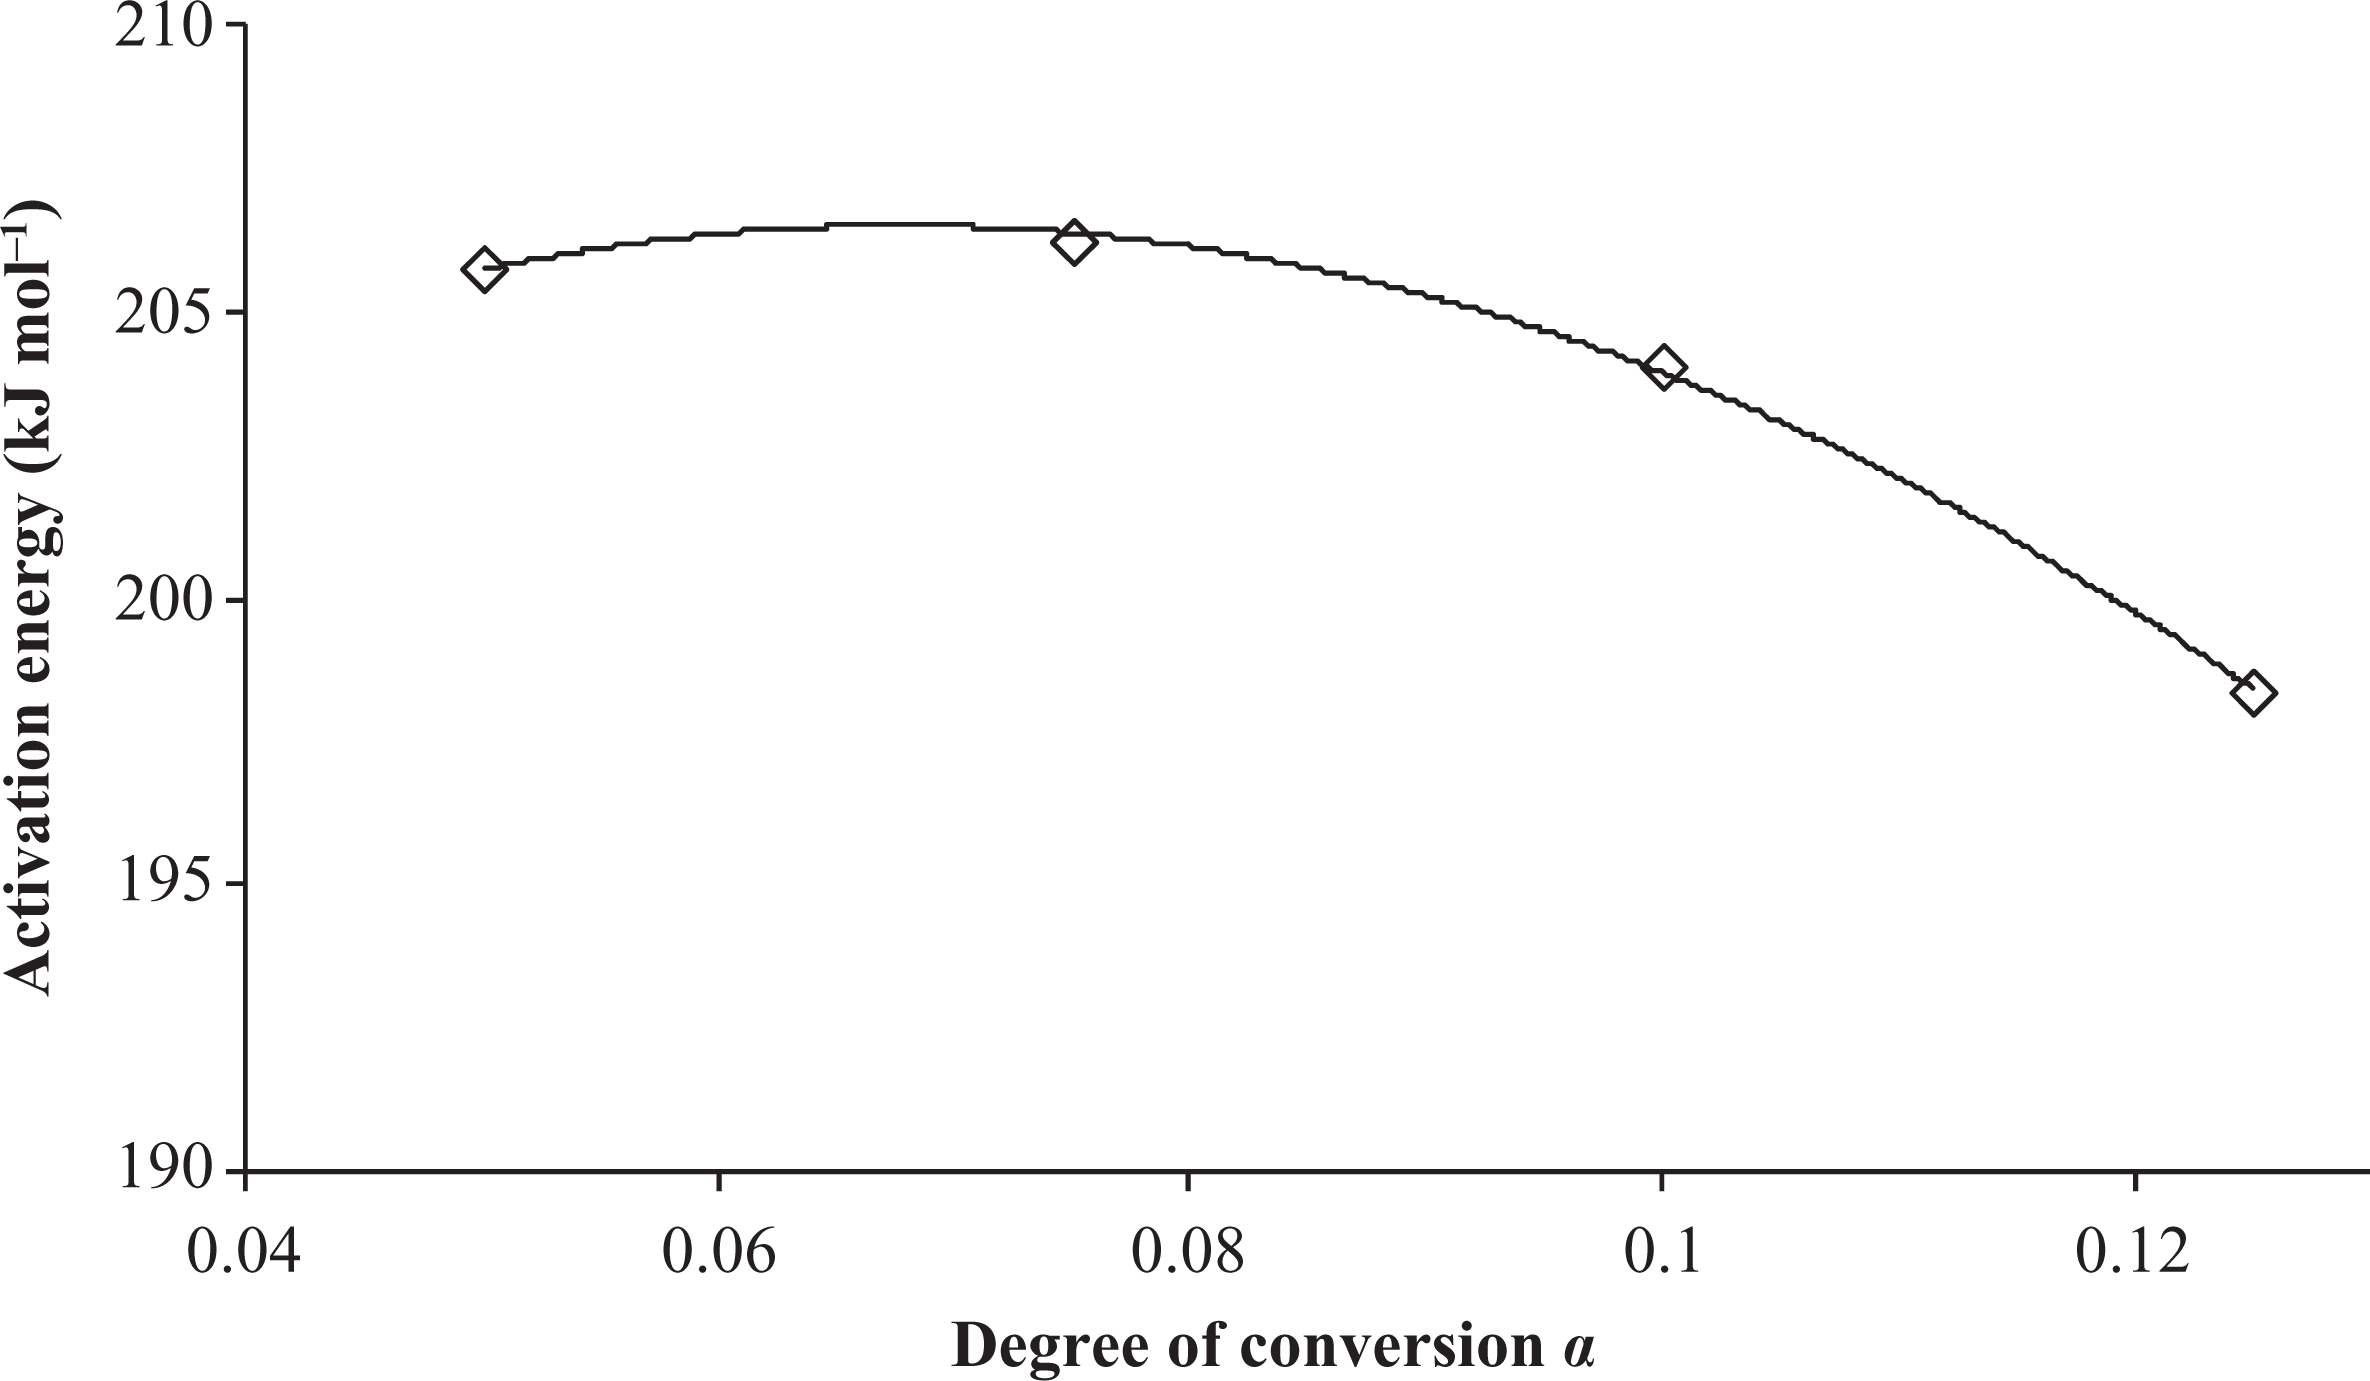
The variation in activation energy estimated by the FWO method with the conversion degree. FWO: Flynn–Wall–Ozawa.
Determination of E a and A by the FWO method.
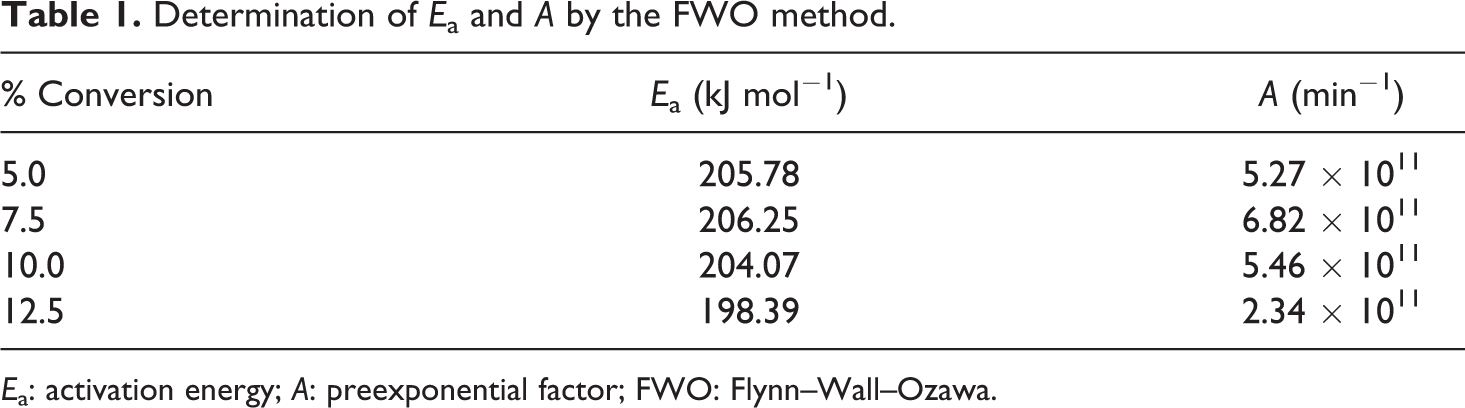
E a: activation energy; A: preexponential factor; FWO: Flynn–Wall–Ozawa.
The preexponential factor (A), on the other hand, indicates the collision frequency among the molecules, therefore, the availability of chemical groups for thermal degradation. Thus, at the beginning of the degradation, there were probably a few groups available for reaction, which increased along with the decomposition reactions and the scission of the polymer chain, leading to an increase in the A value. A similar observation to E a values can be obtained for A, since the greatest value was found for 7.5% conversion. However, at 12.5% conversion, a remarkable reduction is observed, achieving a value of A smaller than half of the one obtained at 5% conversion.
The Kissinger method was also applied in order to calculate the activation energy. The E a value was obtained by the slope of the linear relationship ln(β/T 2 max) versus 1/T max (Figure 5), as described before. The result obtained in this case was E a = 206.74 kJ mol−1. Therefore, this second method is in agreement with the first one applied, whereas the obtained value is very close with greatest E a value, at 7.5% conversion (E a = 206.25 kJ mol−1).
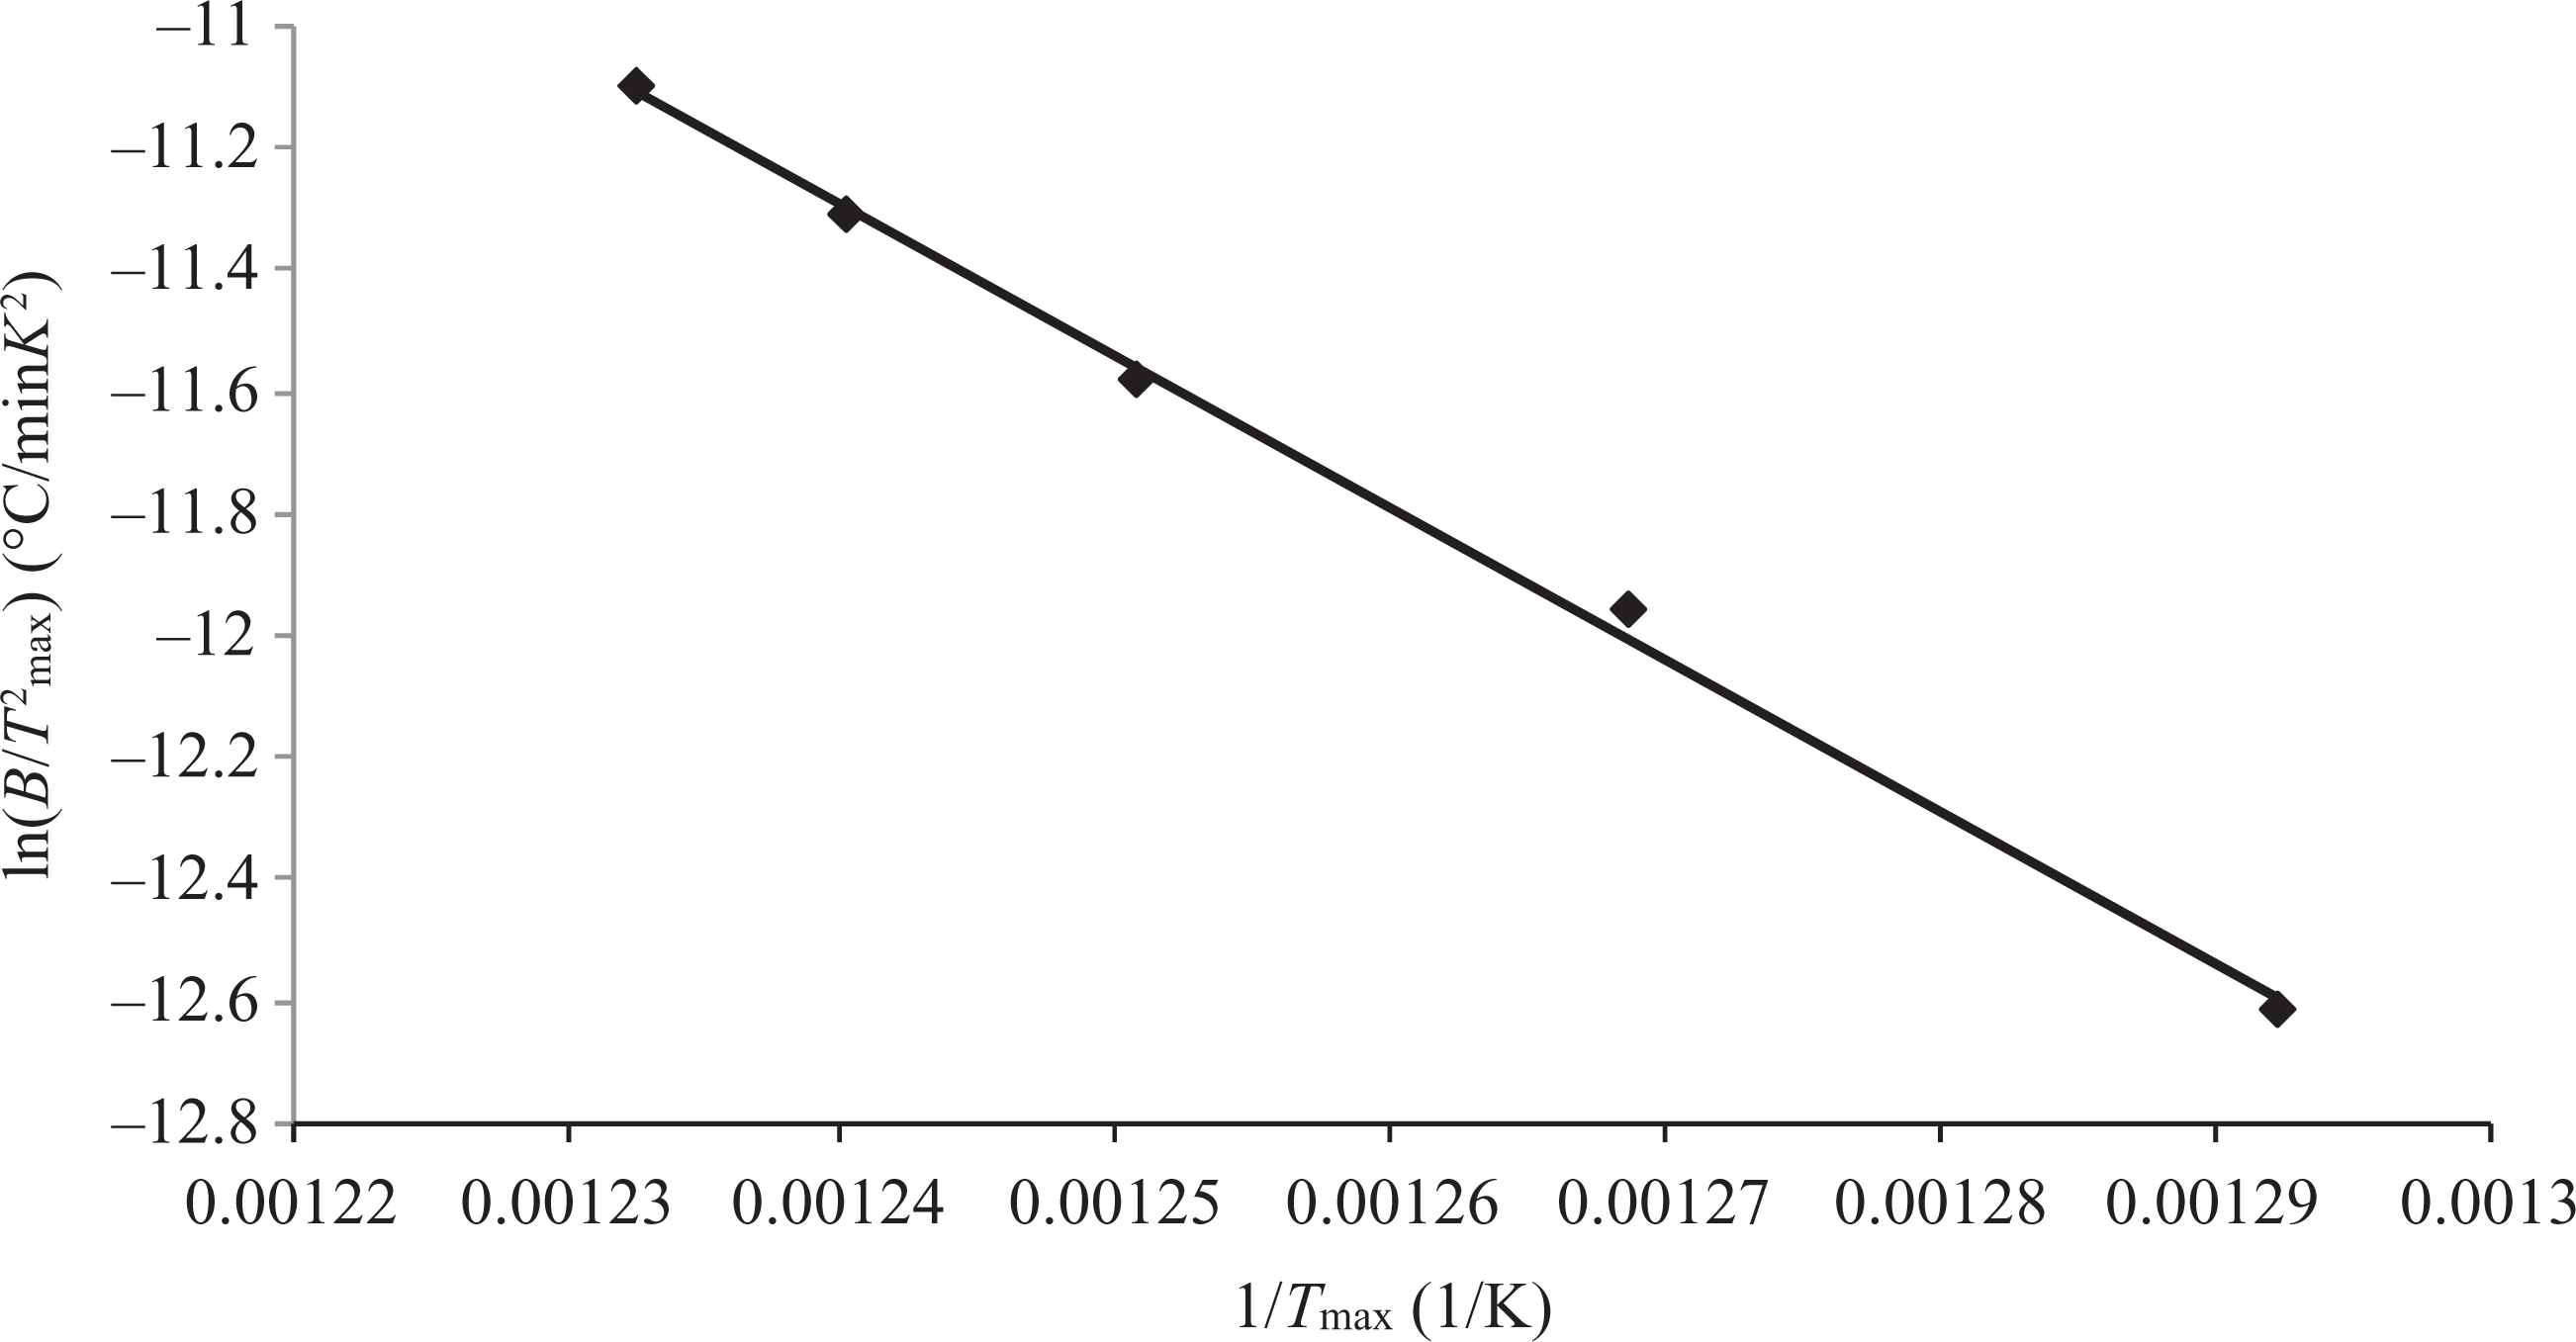
Kissinger plots obtained from DTG curves. DTG: differential thermogravimetric.
Lifetime estimation
Lifetime prediction is a valuable approach to prevent premature failure of materials under service. The results of the kinetic analysis can be used for thermal lifetime prediction, taking the mass loss as a degradation criterion. In the present study, the lifetime has been considered when the sample had experienced a 5% weight loss or is at its 5% conversion in the thermogravimetry experiments. The lifetime for a temperature range from room temperature to 1000°C is plotted in Figure 6.
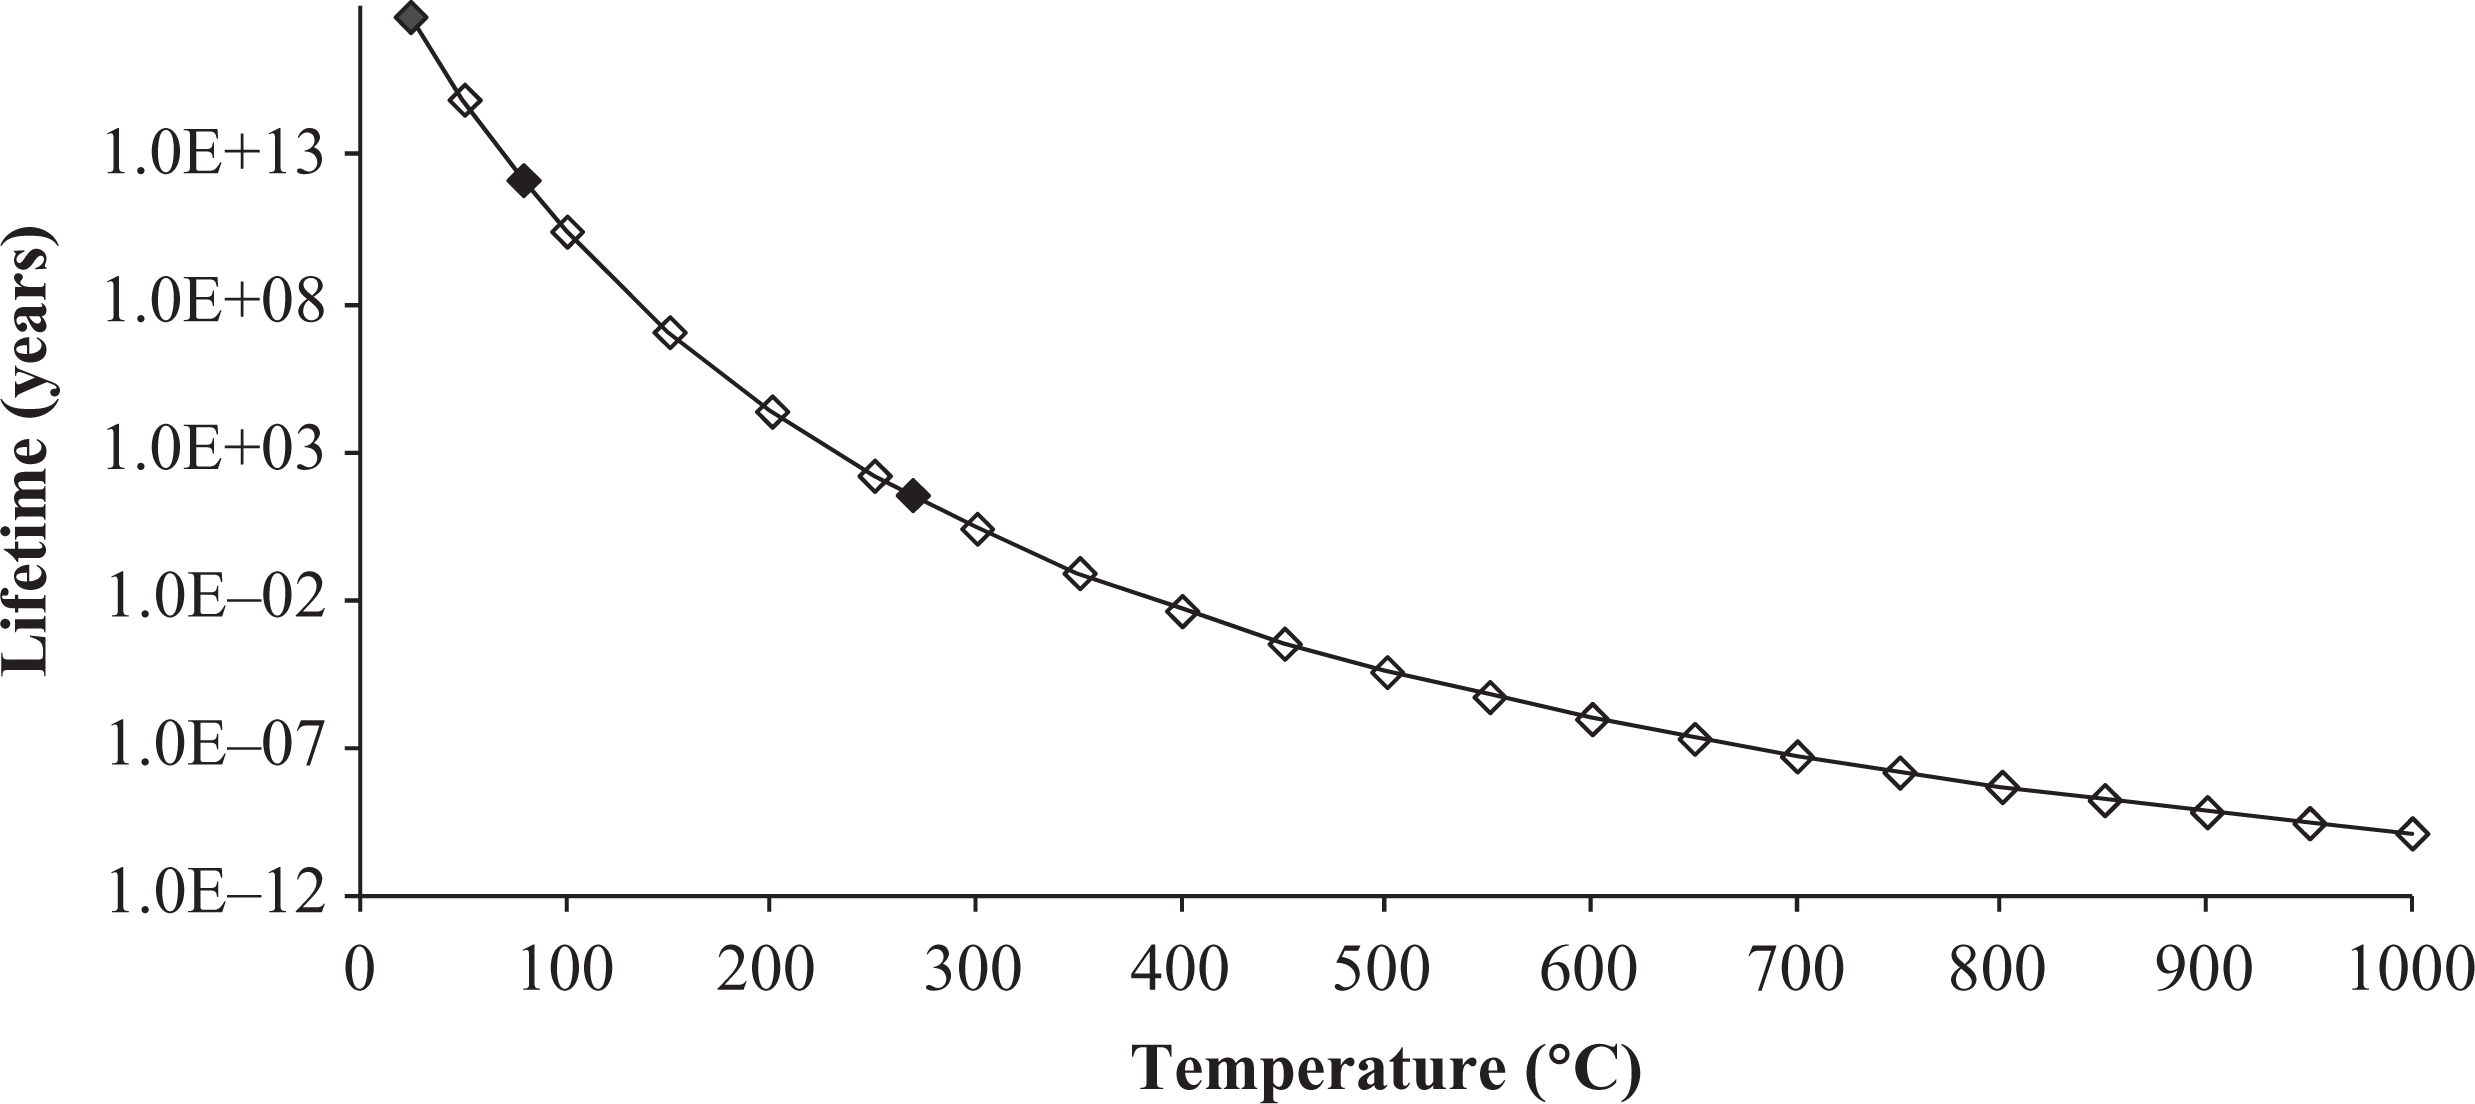
Variation in PEI/carbon fiber laminate lifetime with temperature. PEI: poly(ether imide).
A lifetime of 5.3 × 10¹⁷ years is observed for PEI/carbon fiber composite kept constant at room temperature (Figure 6). If the highest service temperature of a commercial aircraft is considered (approximately 80°C), the lifetime is reduced to 1.3 × 10¹² years, which is still very high. However, it is important to emphasize that these estimations were made based on the thermal decomposition curves obtained in an inert atmosphere, without taking into consideration the weather and the mechanical loadings. Therefore, although the results represent the excellent thermal stability of the material studied, they may present variation when compared with a PEI/carbon fiber component lifetime.
Conclusion
The present characterization by TGA enabled conclusions regarding thermal stability, kinetics analysis, and lifetime prediction of PEI/carbon fiber composites. TGA curves showed the high thermal stability of the material analyzed with the main decomposition occurring between 450 and 550°C. Flynn–Wall–Ozawa and Kissinger methods revealed good agreement on the determination of the activation energy. The thermal lifetime values of the investigated material were evaluated. Regarding the thermal behavior, it was concluded that the laminates can be safely applied in the aeronautical field, since it resists longer than required at the maximum temperature of use.
Footnotes
Acknowledgement
The authors are grateful to TenCate Company for supplying the material.
Funding
This work was financially supported by CNPq and FAPESP.