
Abstract
Nanocomposites containing nano-calcium carbonate (nano-CaCO3) in the range of 0.25–1.5% (w/w) were prepared via in situ polymerization of urethane methacrylate pre-polymer derived from poly(ethylene glycol) (PEG 400), polymeric diphenylmethane diisocyanate and 2-hydroxyethyl methacrylate. Incorporation of nano-CaCO3 into poly (urethane methacrylate) matrix was confirmed by Fourier transform infrared spectroscopy and wide-angle x-ray diffraction studies. Density studies indicated that nanocomposites containing 0.75 wt% nano-CaCO3 had more condensed microstructure. Tensile strength, abrasion resistance, heat deflection temperature and shore hardness of nanocomposites were found to be higher than that of pristine polymer. Impact strength decreased with an increase in the nano-CaCO3 content. Thermal studies indicated single-step degradation under a nitrogen atmosphere. Scanning electron microscopy studies confirmed the uniform distribution of nano-CaCO3 at lower loading of nano-CaCO3 and microcracking occurred during wearing.
Keywords
Introduction
Poly(urethane methacrylate) (PUMA) finds application in many sectors, such as coatings, printing inks, paints, adhesives, stereolithographic and dental restorative materials. 1 –4 Different types of fillers were used to improve mechanical, optical and thermal properties of PUMA nanocomposites. Such nanocomposites were made by different types of methods, such as in situ polymerization, 5 solution blending 6 and so on. Functionalized zinc sulphide was incorporated into the PUMA matrix to improve the refractive index of the film. 7 Nanosilica was used for lowering shrinkage 8 and improving the wear resistance of PUMA. 9 Silane-grafted, ion-exchangeable organo-clays were used in photocurable urethane acrylates. 10 Improved fatigue resistance was observed by the reinforcement of glass fibre in the PUMA matrix. 11 Graphite was incorporated to improve the electrical conductivity of PUMA. 12 Nano-titanium dioxide, 13,14 nano-zirconium oxide, 14 nano-zinc oxide, 15 nanogold and nanosilver 16 were used to prepare PUMA nanocomposites.
Calcium carbonate (CaCO3) has been widely used in industries because of its easy availability, low cost, non-toxicity and non-abrasiveness. In the oil industry, CaCO3 is used in drilling fluids for filter cake-sealing and also in increasing the density of drilling fluids in order to control the down hole pressure. CaCO3 is used to maintain alkaline pH and to offset the acidic properties of the disinfectant agent. Finely ground CaCO3 is an essential ingredient in the microporous film used in diapers and is used as a filler in paper because it is cheaper than wood fibre.
Different types 17 –19 and sizes 20 of CaCO3 were widely used in polymers to improve their mechanical and thermal properties. Polymers such as CaCO3-filled polyethylene, 21 –24 polypropylene, 25,26 acrylonitrile–butadiene–styrene, 20,27 butadiene rubber, 28 poly(methyl methacrylate), 29 –32 poly(ester amide), 33 polyurethane, 34 –36 polystyrene, 37,38 polycarbonate 39 and epoxy 40,41 have been reported in the literature. CaCO3 was also used in biopolymers, such as poly(lactic acid), 17,18 polycaprolactum, 42 chitosan 19 and gluten, 43 for tissue engineering applications. Polymer–nano-CaCO3 nanocomposites exhibit enhanced optical clarity and reduced haze in comparison with conventional microCaCO3-filled polymers, which encourages their usage for packaging and optical applications. The nanocomposites can possess excellent mechanical properties at fairly low-filler loadings, which indeed barely exceed 10% in weight. On the contrary, their microCaCO3-filled counterparts for appliance applications usually have loading levels ranging from 15 to 50% in weight leading inevitably to heavier products. Lightness is another interesting aspect of polymer–nano-CaCO3 nanocomposites.
To the best of our knowledge no work was reported with nano-CaCO3 in the PUMA matrix. With these things in mind, PUMA–nano-CaCO3 nanocomposites were prepared by in situ polymerization and characterized using various techniques, such as Fourier transform infrared spectroscopy (FT-IR), x-ray diffraction (XRD), scanning electron microscopy (SEM) and thermogravimetric analysis (TGA). The primary objective was to study the effect of the nano-CaCO3 content on the properties of PUMA.
Experimental
Materials
Poly(ethylene glycol) (PEG 400) was procured from Qualigen Fine Chemicals (Mumbai, India). Polymeric diphenylmethane diisocyanate (PMDI) (molecular weight of 273.6 g/mol, isocyanate (NCO) content of 30.7%) was generously given by Manali Petrochemicals Ltd (Chennai, India). 2-Hydroxyethyl methacrylate (HEMA) and stannous octoate were procured from Sigma Aldrich (Saint Louis, Missouri, USA). Methyl methacrylate (MMA) was obtained from SD fine chemicals (Mumbai, India). 2,2′-Azobisisobutyronitrile (AIBN, Spectrochem, Mumbai, Maharashtra, India) was recrystallized twice from chloroform. The commercial nano-CaCO3 (average particle size of 65 nm) was provided by Reena Organics India Pvt. Ltd (Chennai, India). All other chemicals were used as received.
Preparation of pre-polymer and nanocomposites
Urethane methacrylate (UMA) pre-polymer was prepared by reacting 55 mmol of PEG 400 (22 g) with 110 mmol of PMDI (30.1 g) and 110 mmol of HEMA (14.32 g). PEG 400, HEMA, MMA (20 g) and stannous octoate (0.1 ml) were taken in a 500-ml three-necked round-bottomed flask fitted with a mechanical stirrer. MMA was used as a reactive diluent. The reaction mixture was cooled using ice cubes, and PMDI was added dropwise for about 3 h. The reaction scheme is shown in Figure 1. After the completion of PMDI addition, the reaction was carried out at ambient temperature. The reaction was monitored by following the disappearance of the isocyanate peak at 2250 cm− 1 using FT-IR spectroscopy. Reaction was completed in about 48 h.
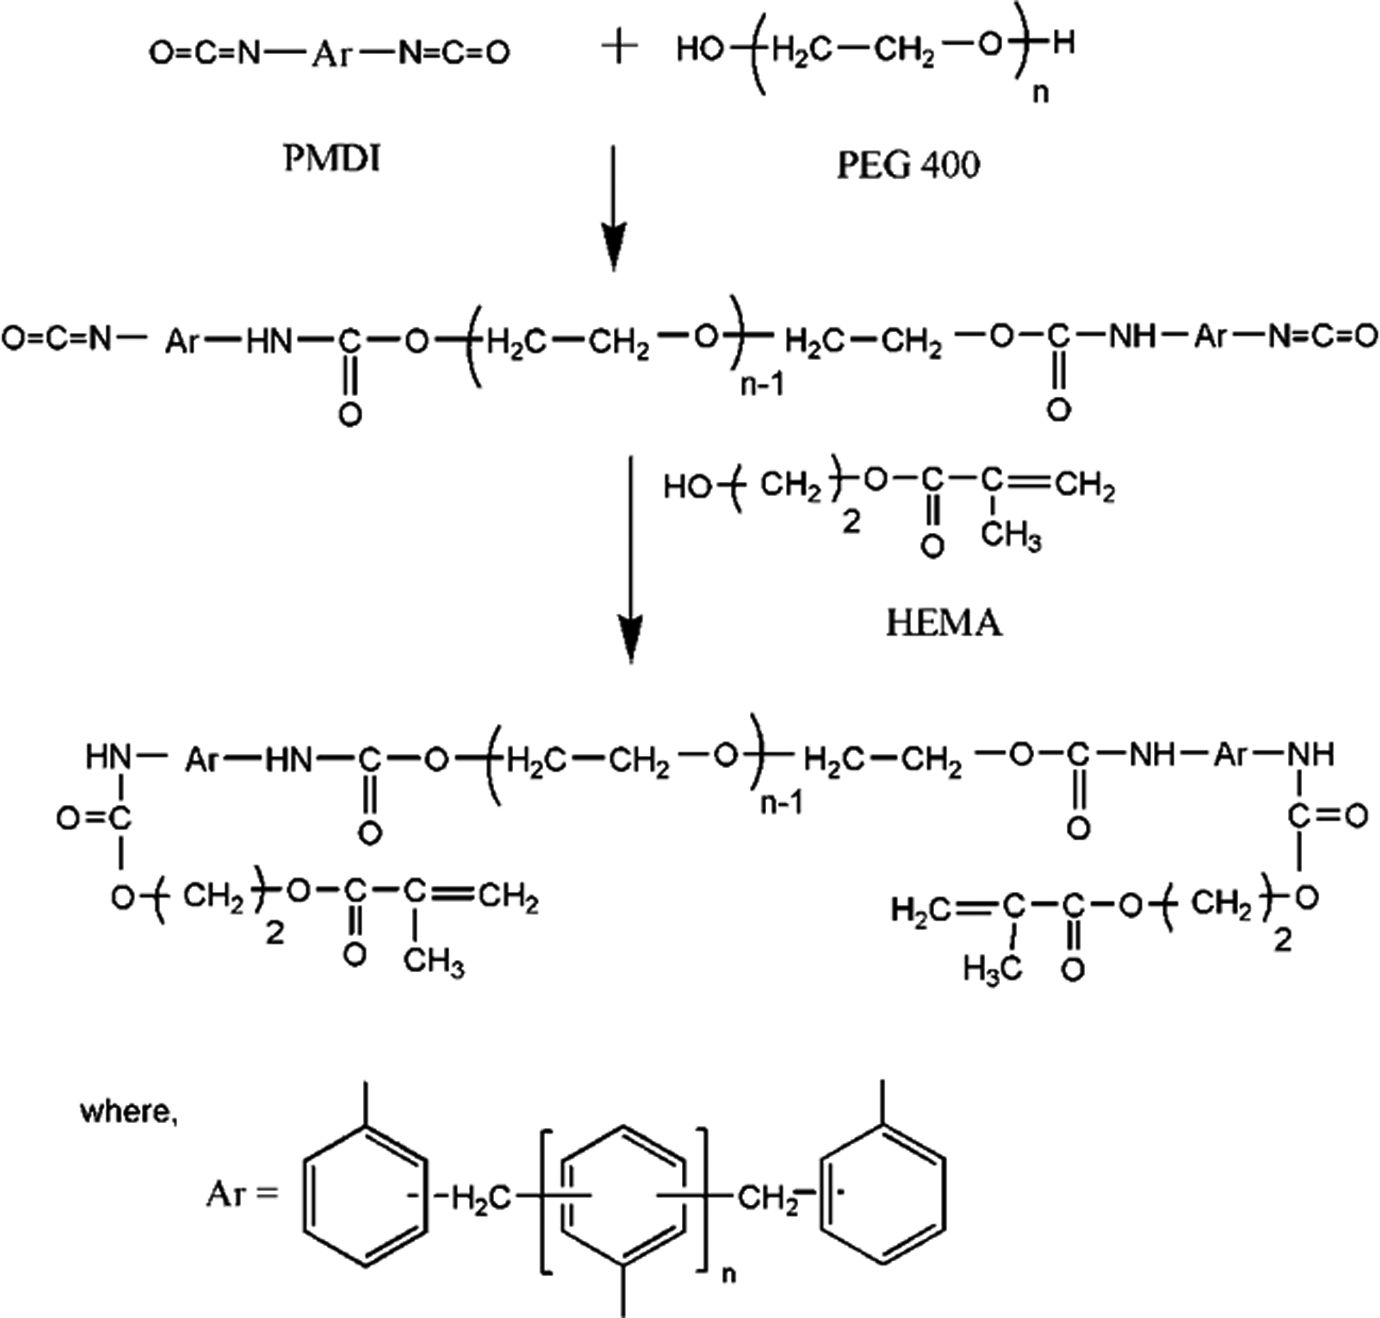
Synthetic route for PUMA. PUMA: poly(urethane methacrylate).
The above procedure was followed for the preparation of PUMA–CaCO3 nanocomposites. Initially, nano-CaCO3 was dispersed in MMA for 30 min at room temperature using an ultrasonicator. Frequency and amplitude used were 33 ± 3 kHz and 100%, respectively. Various nanocomposites were made by changing the nano-CaCO3 content to 0.25, 0.50, 0.75, 1.00 and 1.50 wt%.
Curing studies
AIBN (15.72 g of MMA containing AIBN (1% w/w)) was added to the prepared pre-polymer. The ratio of pre-polymer and MMA was in the range of 70:30 (by weight) and kept constant in all the nanocomposites. The reaction mixture was then degassed under vacuum for 15 min. The resulting mixture was poured into a glass mould having a dimension of 310 × 220 mm, and the thickness of the sheet was controlled using 3 mm gasket. Glass mould was kept at 60°C in a water bath for 24 h. Post-curing was carried out at 80°C for 2 h in an air oven. A similar procedure was followed for making nanocomposite sheets.
Testing and characterization
FT-IR spectra were recorded at room temperature using a Thermo Scientific Nicolet 6700 FT-IR spectrometer (Thermo Nicolet Limited, Cambridge, UK) on a diamond disc in the range of 4000–400 cm−1 . Rheological property was determined using a Thermo Scientific (Haake Mars) Rotational Rheometer (Thermo Fisher Scientific Inc., Waltham, Massachusetts, USA) at room temperature. Percentage transmittance of the nanocomposites was tested as per ASTM (American Society for Testing and Materials) D1003 using a Spherical Haze meter (EEL 57D) (Rycobel group, Deerlijk, Belgium). Chemical resistance tests were carried out as per ASTM D543. Water absorption was measured as per ASTM D570. The densities of the nanocomposites were determined as per ASTM D729 using Mettler Toledo instrument (Mettler-Toledo India Private Limited, Mumbai, India). Wide-angle x-ray diffraction measurements of sheets were carried out using an x-ray diffractor unit (Shimadzu Lab XRD-6000, Shimadzu Corporation, Chiyoda-ku, Tokyo, Japan) with Cu Kα radiation (40 kV, 30 mA) at a wavelength of 1.54 Å. Morphology of the nanocomposites was investigated using a Carl Ziess SMT (EVO MA15) (Carl Zeiss Limited, Oberkochen, Germany) scanning electron microscope with high tension voltage of 20 kV. The samples were conditioned for 1 h and sputter coated with gold before imaging.
Dumbbell-shaped tensile specimens with a dimension of 165 × 12.7 × 3 mm were tested using Universal Testing Machine (UTM, AG-IS Shimadzu Lab, 50 kN, Shimadzu Corporation Chiyoda-ku, Tokyo, Japan) as per ASTM D638. A crosshead speed of 50 mm/min and a gauge length of 50 mm were used for the tensile test. Rectangular bar of 125 × 12.4 × 3 mm dimension was used for the flexural test using UTM (Instron 3382, 100 kN, Grove City, Pennsylvania, USA) in accordance with ASTM D790. Three-point bending mode was used. A crosshead speed of 5 mm/min and a span length of 100 mm were used for carrying out the test. According to ASTM D256, the impact test was carried out using the impactometer 6545 (CEAST, Pianezza, Italy). Rectangular bar specimen of 63.5 × 12.7 × 3 mm dimension with a V-notch depth of 2.54 mm and a notch angle of 45° was used for the determination of impact strength. Five samples were tested and the average was taken for tensile, flexural and impact properties.
Shore D hardness was measured as per ASTM D2240 using a durometer. Abrasion resistance was determined as per ASTM D1044 using Calibrase CS10F wheel and 1 kg load and is reported as weight loss in milligram per 1000 cycles. Heat deflection temperature (HDT) was measured as per ASTM D648 with a sample dimension of 127 × 13 × 3 mm using Davenport instrument (Bognor Regis, West Sussex, UK) under flexural load in the edgewise position. Thermal stability of nanocomposites in the temperature range of 50–650°C was evaluated using a Perkin Elmer Pyris 7 TGA (Waltham, Massachusetts, USA) at a heating rate of 10°C/min in a nitrogen atmosphere.
Results and discussion
The dispersion of the nanofiller in the polymer matrix depends on the processing conditions. Several approaches were examined by Delozier et al. for nanocomposites. 5 According to their findings, the best results were obtained using an in situ polymerization technique. We used this technique to prepare PUMA–nano-CaCO3 sheets. Bulk viscosity of UMA pre-polymer was found to be 15.4 cPs at 25°C. The bulk viscosity of UMA depends on structure, molecular weight of pre-polymer and the nature and content of the diluent. Low value indicated that the pre-polymer was moderately viscous, and it was in the workable range for making sheets. Shear viscosity as a function of shear rate was measured by a rotational rheometer at room temperature. Pre-polymer showed an increase in the viscosity as the shear rate was increased. This in turn refers to shear thickening behaviour.
Cured sheets ranged from transparent to translucent depending upon the nano-CaCO3 content. Sample code details and percentage transmittance of nanocomposites are tabulated in Table 1. Increase in the nano-CaCO3 content in PUMA decreases the transmittance due to the absorption and scattering of light by nano-CaCO3.
Transmittance and percentage water absorption data of nanocomposites.
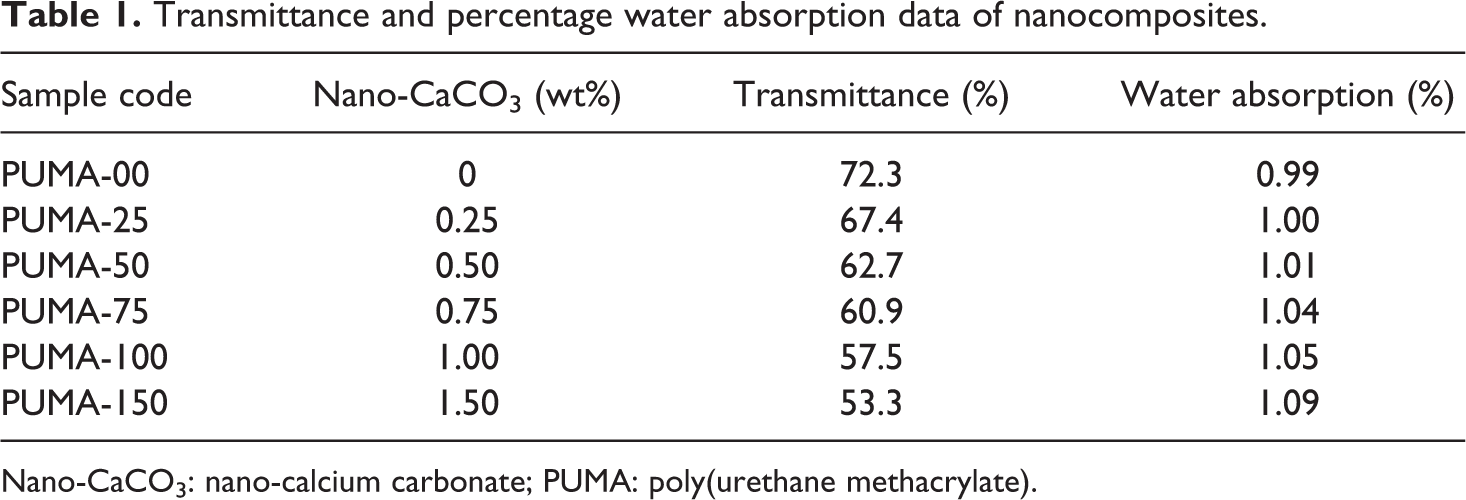
Nano-CaCO3: nano-calcium carbonate; PUMA: poly(urethane methacrylate).
Characterization of PUMA–nano-CaCO3 composites
Fourier transform infrared spectroscopy
The FT-IR spectrum of pre-polymer indicated the absence of isocyanate (2250 cm−1
) and hydroxyl (broad band 3100–3450 cm−1) peaks, which confirmed that the reaction was complete. NH stretching at 3325 cm−1 indicated the formation of urethane linkage. The absence of ν
C=C at 1635 cm−1 in the FT-IR spectrum of PUMA-00 indicated that the polymerization had taken place (Figure 2(a)). In PUMA-75, FT-IR peaks at 1450 and 872 cm−1 were assigned to carbonate (CO3
2−) of nano-CaCO3 particles (Figure 2(b)). Specific absorption peak of
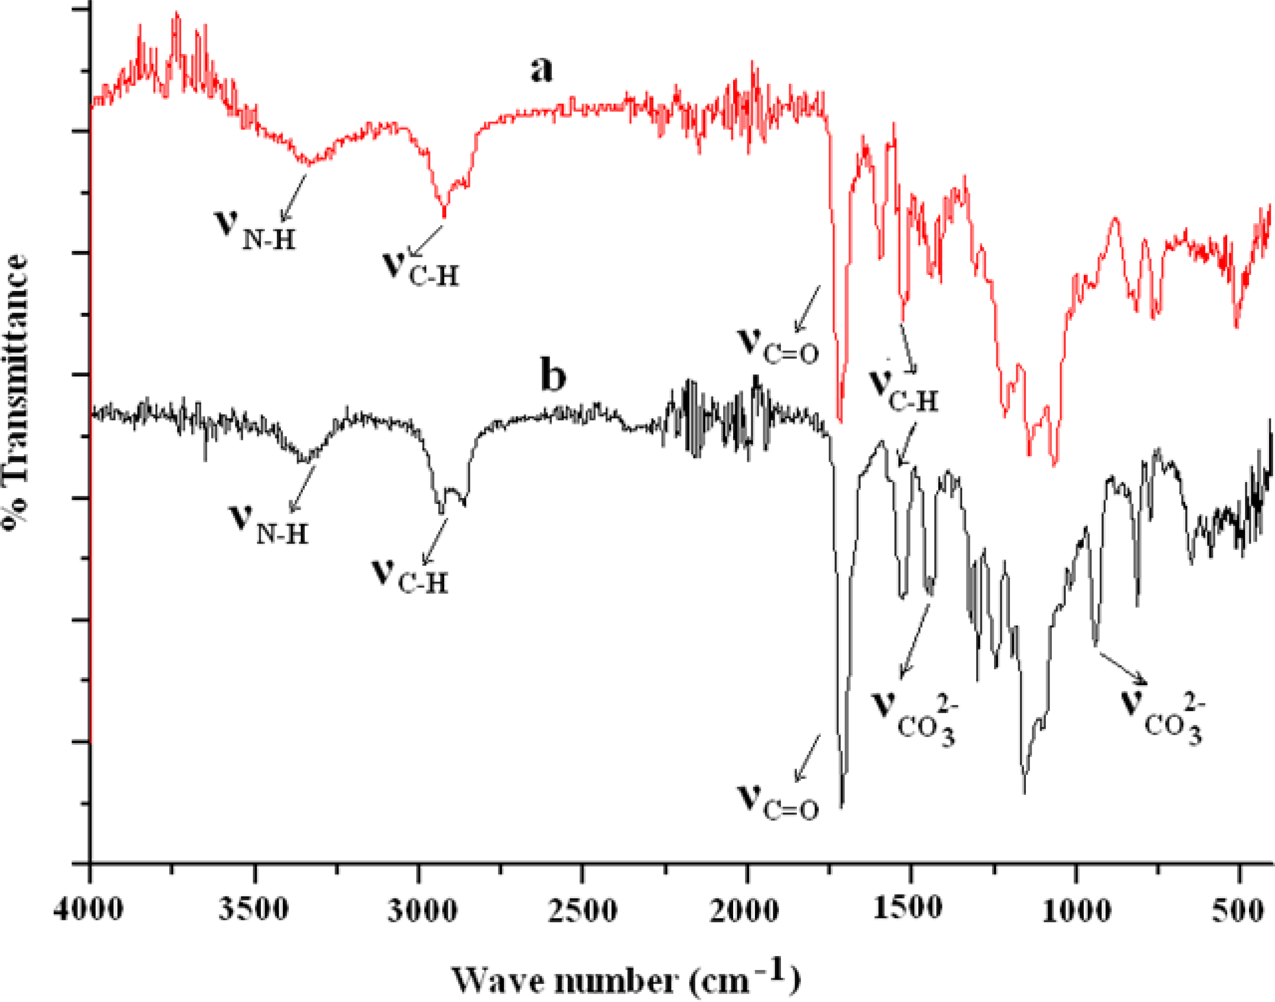
FT-IR spectra of (a) PUMA-00 and (b) PUMA-75. PUMA: poly(urethane methacrylate); FT-IR: Fourier transform infrared spectroscopy.
Water absorption
After taking the initial weight of nanocomposite sheet samples, they were immersed in double-distilled water for 24 h at ambient temperature. The water absorption values of the nanocomposites are shown in Table 1. Water absorption of the nanocomposites increased linearly from 0.9 to 1.08% with respect to nano-CaCO3 loading. The increase in water absorption was attributed to the hydrophilic nature of the nano-CaCO3 present in the PUMA matrix.
Chemical resistance
Chemical resistance test was carried out for 100 h at ambient temperature. PUMA and nanocomposite samples were found to swell in solvents such as N-methyl-2-pyrrolidone, dimethyl sulfoxide, dimethylformamide, chloroform, tetrahydrofuran, toluene, hexane and so on, which suggest that they were cross-linked. They were also found to be chemically resistant to acids and bases such as 10% (v/v) sulphuric acid, 10% (v/v) nitric acid, 10% (v/v) hydrochloric acid and 10% (v/v) sodium hydroxide.
Density
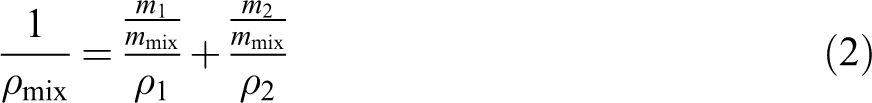
The density of nanocomposites reflects tightness of microstructure, which can be determined by the specific volume (ν). Under ideal state, the density of the nanocomposites (ν mix) can be calculated with the following equation
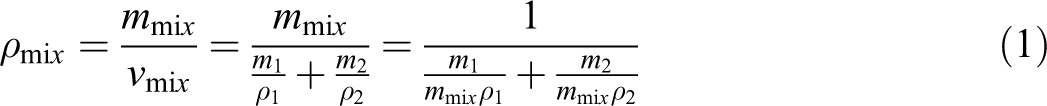
Simplified form of this equation is as follows
The specific volume of the nanocomposites (ν mix) is based on the density and the content of the nanofiller in the nanocomposites.
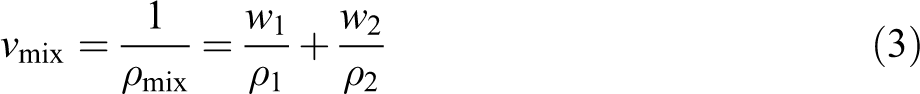
where, ρ 1 and w 1 are the density and weight fraction of PUMA, respectively; ρ 2 and w 2 are the density and weight fraction of nano-CaCO3, respectively.
Densification of nanocomposites can be calculated using the following equation

where, ν is calculated from density, which is measured by Archimedes’ principle.
Table 2 represents the density values of the PUMA–nano-CaCO3 nanocomposites. Density of the nanocomposites increased with an increase in the nano-CaCO3 content because nano-CaCO3 was more denser (g/cc) than PUMA. The density differences between the theoretical and experimental values (Δv) are shown in Table 2. Smaller Δv value indicated that the structure of the nanocomposites is more condense. For the PUMA-25 and PUMA-50 nanocomposites, the Δv value exhibited positive number indicating a loose microstructure of the nanocomposites. In PUMA-75, the Δv value is below zero (Δv < 0), revealing that it reached the more condensed form. When more nano-CaCO3 is added, the negative Δv value is recovered, due to the formation of cavity in the PUMA–nano-CaCO3 aggregation. 38
Specific volume of nanocomposites.
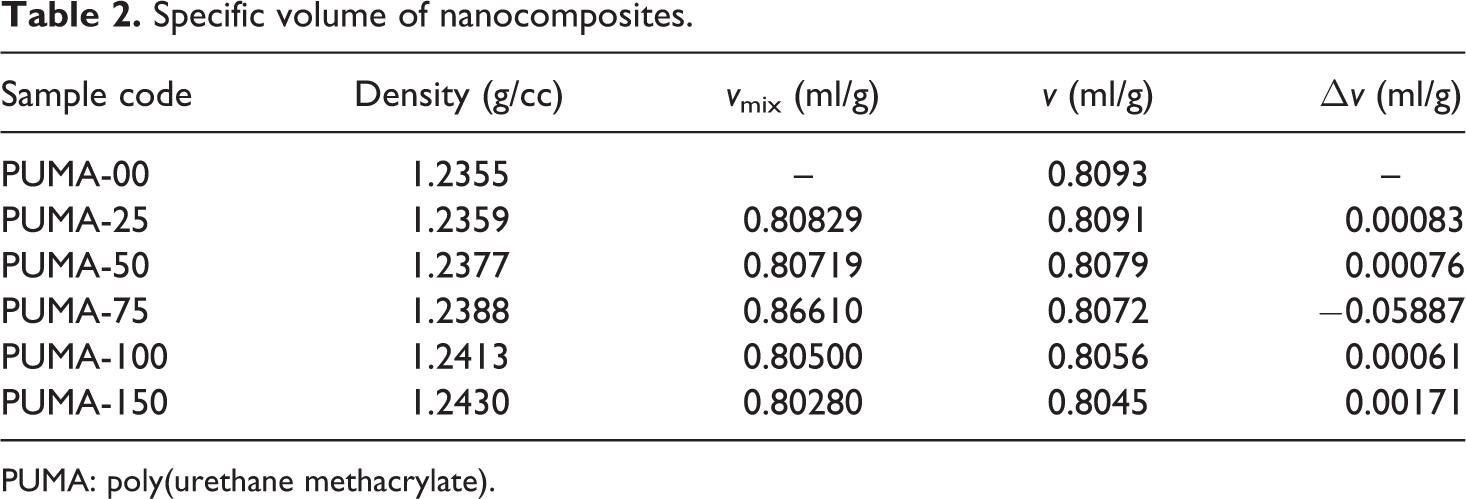
PUMA: poly(urethane methacrylate).
Hardness
Shore-D hardness values are tabulated in Table 5. Hardness values increased with an increase in the nanofiller content, due to the increase in the rigidity of nanocomposites, arising from the nano-CaCO3. Hardness of PUMA-75 showed the maximum hardness value. The maximum hardness value at 0.75 wt% was attributed to the tightness. Increase in the nanofiller content greater than 0.75 wt% had no effect on the hardness values. This could be due to the agglomeration of nano-CaCO3 at higher concentration.
X-ray diffraction
Figure 3 represents the XRD pattern of PUMA-00 and PUMA-75. Pristine polymer exhibited amorphous state, which was indicated by a broad peak at about 20° (Figure 3(a)). The peak at 29.4° in PUMA-75 was due to nano-CaCO3, which confirmed that the nano-CaCO3 was incorporated into the PUMA matrix (Figure 3(b)). The primary peak that appeared at 29.4° confirmed that CaCO3 is of calcite type. The absence of peak at 2θ = 26.2° and 38.9°, respectively, suggested that nano-CaCO3 is not of aragonite and vaterite type. 45
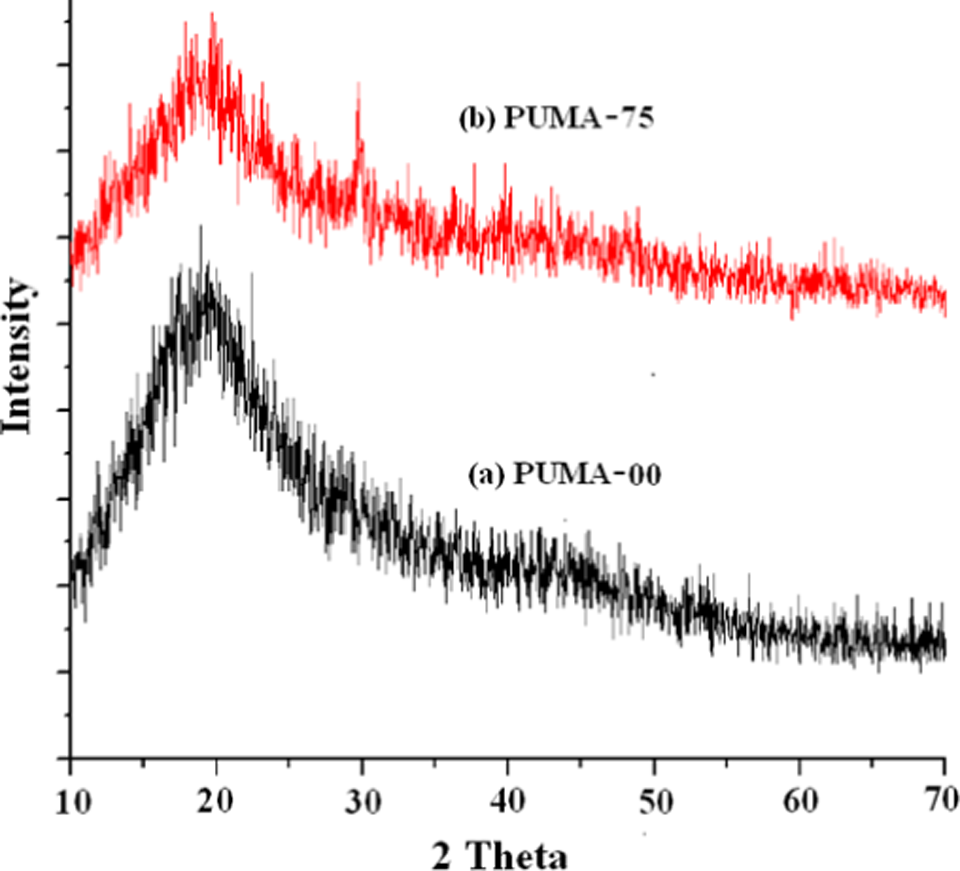
XRD patterns of (a) PUMA-00 and (b) PUMA-75. PUMA: poly(urethane methacrylate); XRD: x-ray diffraction.
Mechanical properties of PUMA–nano-CaCO3 composites
The mechanical properties of the nanocomposites depend to a greater extent upon the uniform distribution of nanofiller in the matrix and interfacial morphology, such as interfacial structure and interfacial adhesion between filler and matrix, as well as stress distribution. Tensile stress–strain curves (Figure 4) indicated that the tensile stress increased with an increase in strain and fracture phenomenon that occurred in all nanocomposites before reaching the yield state. This indicated that the nanocomposites are strong–hard materials and their tensile failure belonged to brittle fracture. Low molecular weight of PEG and the presence of aromatic rings in diisocyanate accounted for the absence of yield state due to the rigidity introduced by aromatic rings.
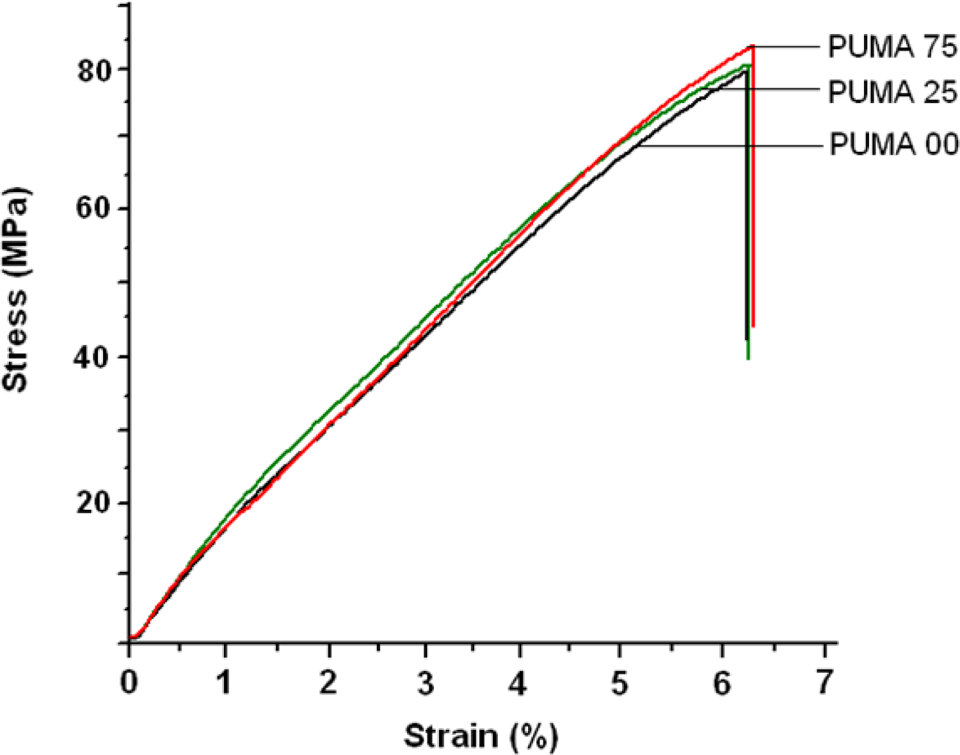
Stress–strain curves of PUMA-00, PUMA-25 and PUMA-75. PUMA: poly(urethane methacrylate).
Tensile strength and modulus
Tensile strength, tensile modulus and elongation at break values are tabulated in Table 3. Tensile strength of nanocomposite samples was marginally higher than pristine material. Tensile strength increased with the incorporation of nano-CaCO3 into PUMA matrix. Introduction of 0.25, 0.50, 0.75, 1.00 and 1.50 wt% of nano-CaCO3 into PUMA matrix enhanced the tensile strength by 1.7, 3.0, 4.0, 4.0 and 3.0%, respectively. Interaction between nano-CaCO3 particles and polymer matrix significantly affects the tensile strength. Marginal increase in tensile strength indicated that the interaction between nano-CaCO3 particles and polymer matrix is not strong. The nano-CaCO3 content had no appreciable effect on elongation. Tensile modulus of the nanocomposite sample decreased with increasing nano-CaCO3 content except PUMA-150. Tensile modulus in PUMA-150 increased by 27% when compared with PUMA-00 due to the stiffening effect of nano-CaCO3.
Tensile properties of nanocomposites.
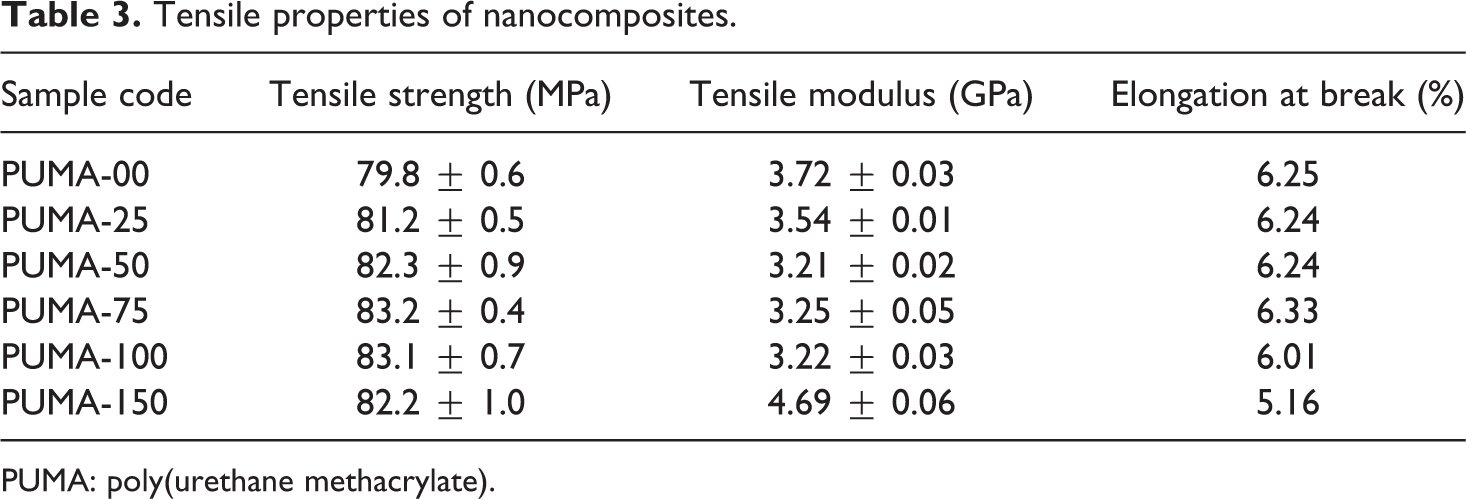
PUMA: poly(urethane methacrylate).
Flexural strength and modulus
The effect of nano-CaCO3 content on flexural strength and flexural modulus values are given in Table 4. Flexural modulus is an important parameter for measuring the flexural stiffness of materials. The incorporation of the nano-CaCO3 increased both flexural strength and modulus. For 0.25, 0.50 and 0.75 wt% loading of nano-CaCO3 content, flexural strength increased marginally by 3.3, 7.3 and 10.3%, respectively, but decreased substantially for 1.00 and 1.50 wt% loading of nano-CaCO3 by 17.5 and 25.8%, respectively, with respect to PUMA-00. Nano-CaCO3 acts as a stress concentration point. As a result, they were able to take more load, leading to better flexural strength. Up to 0.75 wt% of nano-CaCO3 content, the results of flexural strength were found to be higher than PUMA-00. Beyond 0.75 wt% of nano-CaCO3 content, the results were found to be lesser than that of PUMA-00. This behaviour was attributed to the fact that at higher volume of nano-CaCO3 and the interfacial surface area between nano-CaCO3 and matrix had been decreased. Hence agglomeration occurred, which has caused the lesser adhesion between nano-CaCO3 and polymer matrix. Flexural modulus was found to be higher than PUMA-00. For 0.25, 0.50, 0.75, 1.00 and 1.50 wt% of nano-CaCO3 content, flexural modulus increased by 2.0, 3.5, 6.1, 4.9 and 3.8%, respectively. This behaviour was due to the rigidity and reinforcing effect of nano-CaCO3.
Flexural properties and impact strength values of nanocomposites.
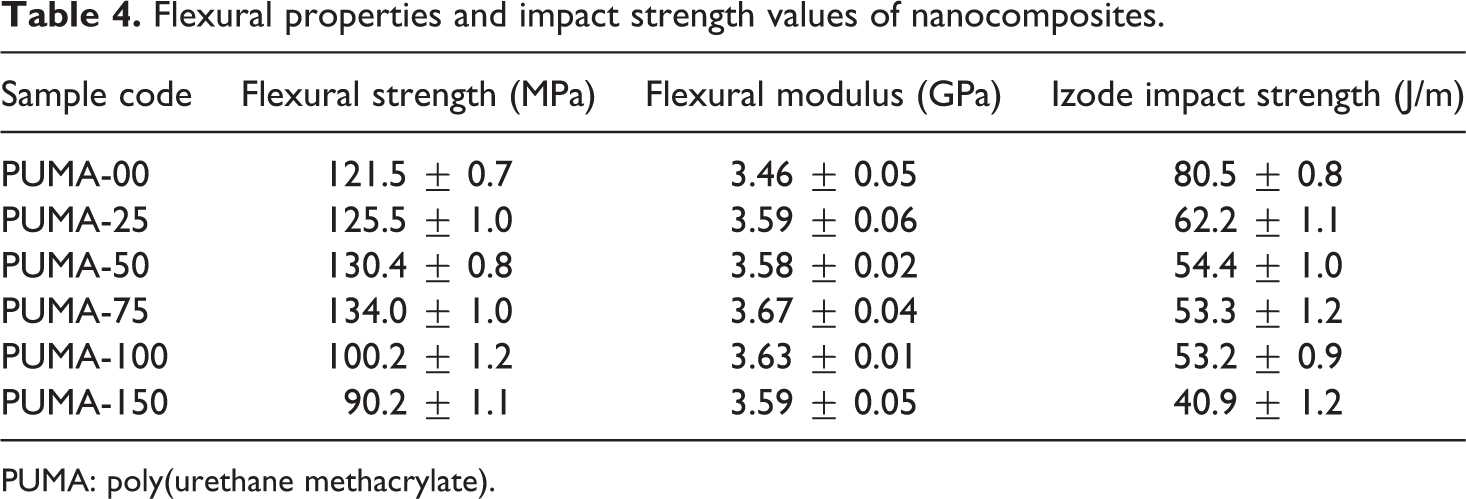
PUMA: poly(urethane methacrylate).
Impact strength
Effect of nano-CaCO3 on the impact strength of nanocomposites is given in Table 4. Toughness of a material is indicated by the value of its impact strength. Higher the values better the impact strength. Nano-CaCO3 loading decreased the impact strength from 80.5 to 40.9 J/m, which indicated that brittleness increased and toughness decreased in the PUMA matrix. Interaction between nano-CaCO3 particles and PUMA matrix was weak and nano-sized particles cannot induce shear yielding of the polymer matrix. As a result, nano-CaCO3 could not toughen the PUMA matrix.
Abrasion resistance
Abrasion resistance values of PUMA and nanocomposites are tabulated in Table 5. The progressive removal of material from its surface as a result of mechanical action of rubbing, scraping or erosion is defined as abrasion resistance. Increase in the nano-CaCO3 content decreased the weight loss indicating that the abrasion resistance increased. The improvement in abrasion resistance indicated that the nano-CaCO3 supports part of the applied load, which in turn reduces the penetration into the polymer. PUMA-75 showed maximum abrasion resistance. This was attributed to the presence of condensed microstructure. Both PUMA-100 and PUMA-150 show minimum abrasion resistance than PUMA-75, because of agglomeration of nano-CaCO3 in the polymer matrix.
Hardness, HDT and abrasion values of nanocomposites.
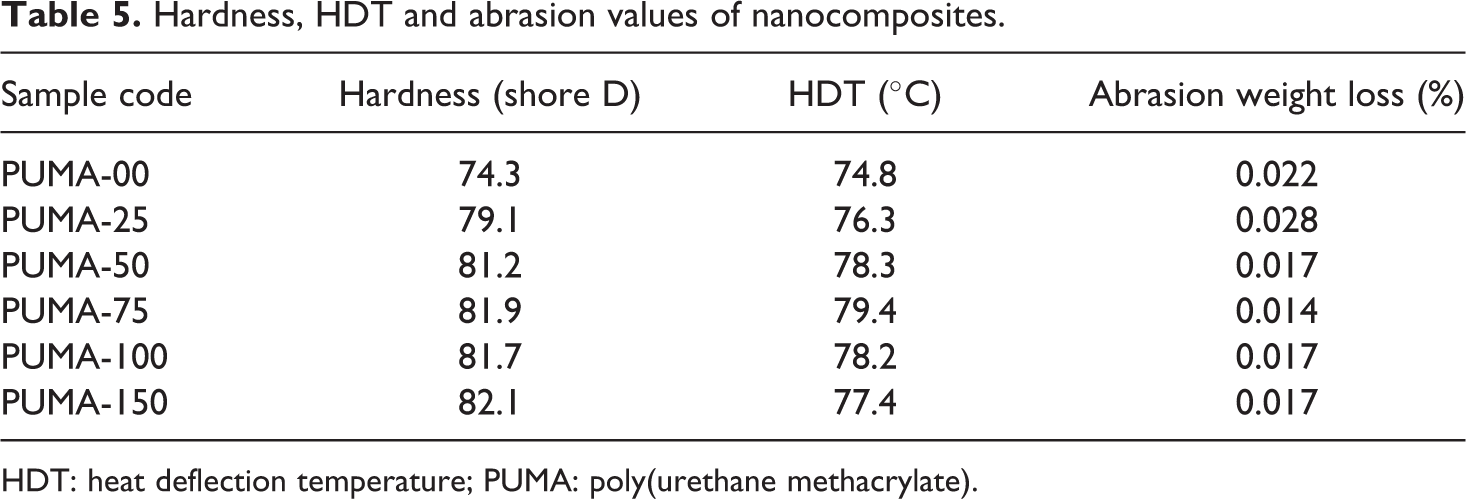
HDT: heat deflection temperature; PUMA: poly(urethane methacrylate).
Scanning electron microscopy
In order to understand the details of the wear mechanism operating on each nanocomposite material, SEM was used to probe the morphology of the worn surface (Figure 5). Abrasion occurs mainly by three mechanisms: microploughing, microcutting and microcracking.
46
Scanning electron micrograph indicates the type of wear mechanism occurred. Surface fatigue was found to be more in PUMA-00, whereas it was less in PUMA-75.
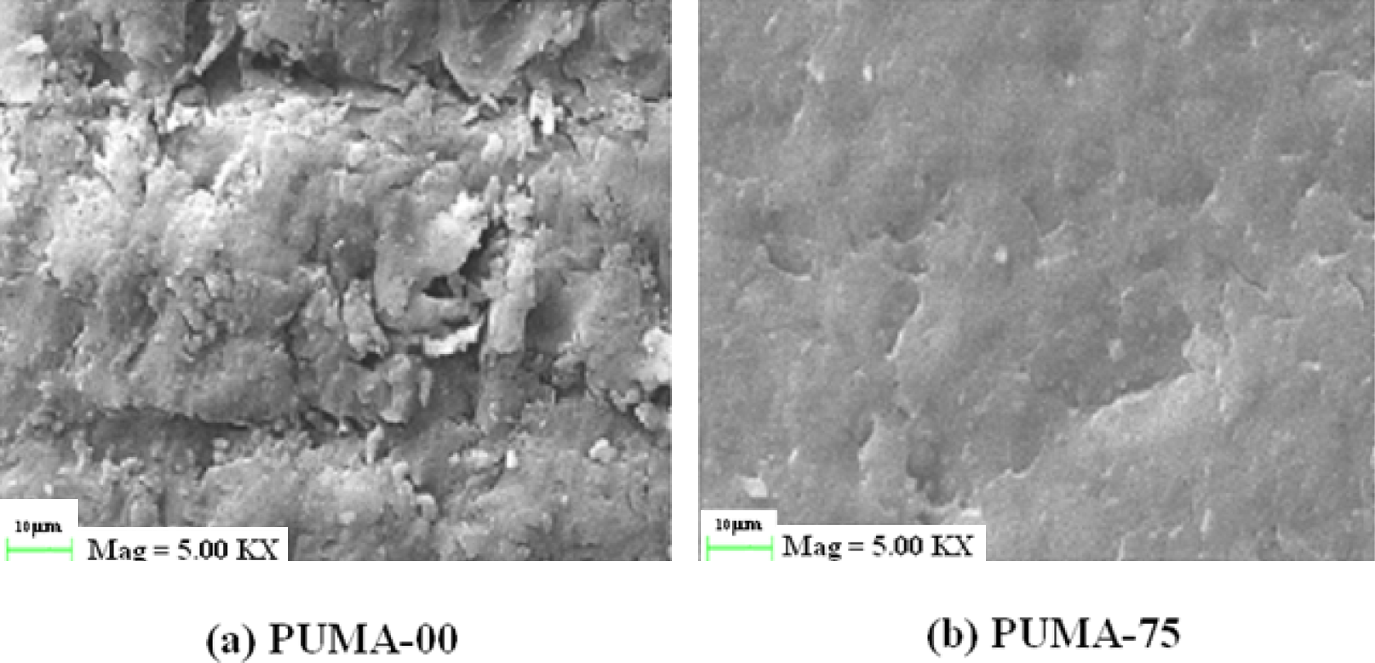
Scanning electron micrographs of abraded (a) PUMA-00 and (b) PUMA-75. PUMA: poly(urethane methacrylate).
Surface morphology of nanocomposites was characterized by SEM. Scanning electron micrographs of the fractured surface of PUMA and nanocomposites are shown in Figure 6. The PUMA surface was found to be very smooth. PUMA–nano-CaCO3 micrograph confirmed the uniform distribution of nanofiller up to 0.75 wt%. Agglomeration was observed in 1.0 and 1.5 wt% of nanofiller loading. This agglomeration reflected the mechanical properties of nanocomposites.
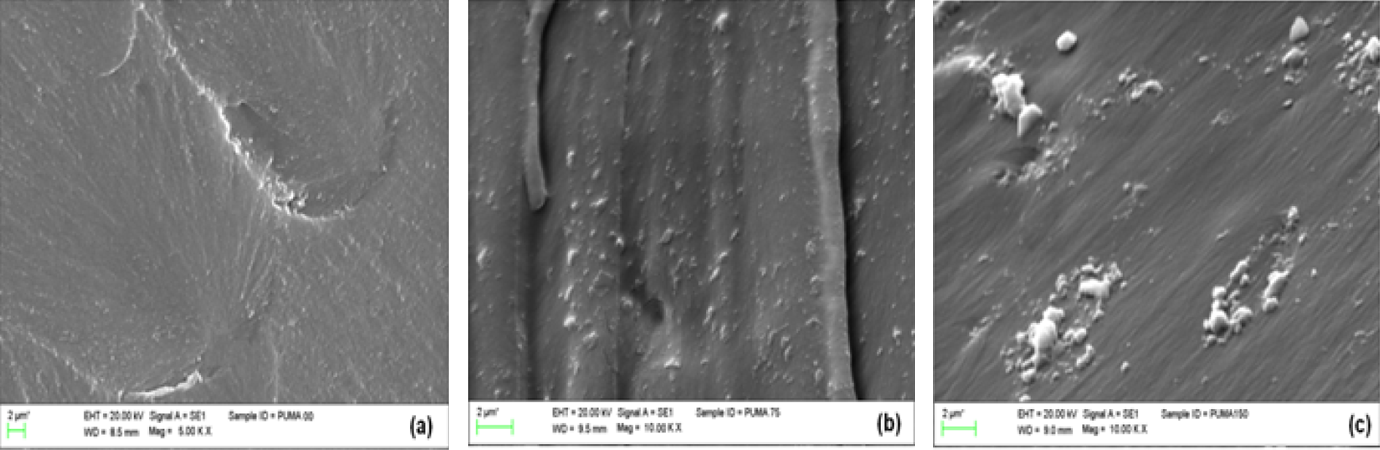
Scanning electron micrographs of fractured surface of (a) PUMA-00 (b) PUMA-75 and (c) PUMA-150. PUMA: poly(urethane methacrylate).
Heat deflection temperature
The short-term thermal performance of the material was characterized by HDT and values are tabulated in Table 5. HDT values increased with an increase in nano-CaCO3 up to 0.75 wt%. It indicates that the dimensional stability of PUMA increased with nano-CaCO3 loading. Both 1.00 and 1.50 wt% loading of nano-CaCO3 decreased the values of HDT when compared with 0.75 wt%, but the values are higher than PUMA-00. When the nano-CaCO3 content reached 0.75 wt%, HDT attained maximum value. This was attributed to more condensed microstructure as determined from density studies.
Thermal stability
Thermal stability of the nanocomposites was evaluated in a nitrogen atmosphere using TGA. All the nanocomposites had good thermal stability with mass loss by TGA beginning at 300°C. Nanocomposites showed single-step degradation in a nitrogen atmosphere (Figure 7). The 10, 50 and 85% weight loss and percentage residue values at 670°C of PUMA and nanocomposites are tabulated in Table 6. Based on the weight loss data, one can conclude that the thermal stability of the nanocomposites was higher than that of the pristine polymer, indicating that nanofiller enhanced the thermal stability. Residue increased with an increase in the nano-CaCO3 content.
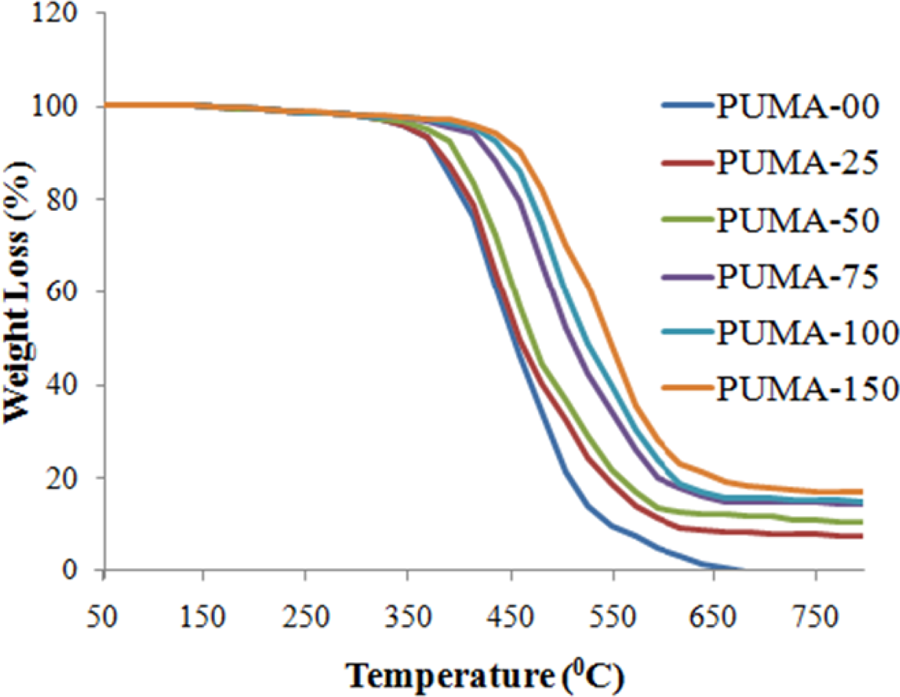
Thermogram of PUMA and nanocomposites. PUMA: poly(urethane methacrylate).
TGA data of nanocomposites.
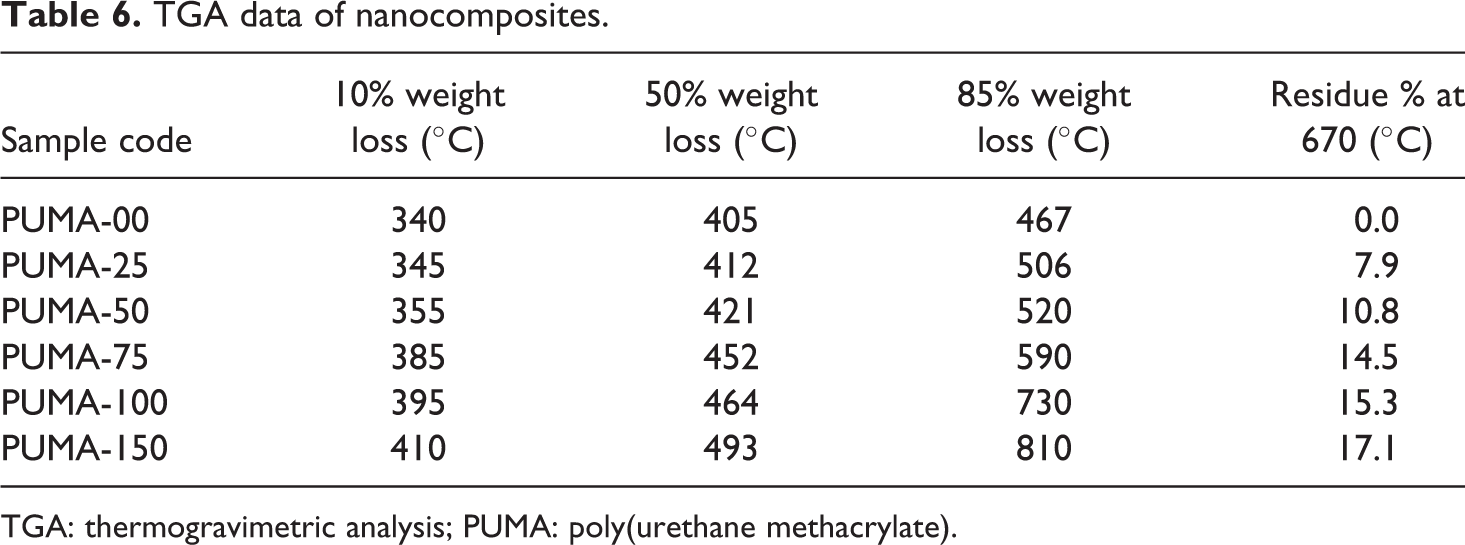
TGA: thermogravimetric analysis; PUMA: poly(urethane methacrylate).
Conclusions
PUMA–nano-CaCO3 composites were successfully prepared by an in situ polymerization method.
FT-IR and XRD studies confirmed the incorporation of nano-CaCO3. Density and water absorption of the nanocomposites increased with an increase in the nanofiller content. Shear thickening was observed for pre-polymer. Tensile strength, HDT, abrasion resistance, shore hardness and thermal stability of the nanocomposites were found to be higher than that of PUMA-00. Flexural strength, flexural modulus, shore hardness, HDT and abrasion resistance of nanocomposites containing 0.75 wt% of nano-CaCO3 were found to be higher than the remaining compositions. This was attributed to the condensed microstructure. Scanning electron microscopic image confirmed the better abrasion resistance for the nanocomposites when compared with PUMA-00 and microcracking occurred during wearing.
Footnotes
Funding
This research received no specific grant from any funding agency in the public, commercial or not-for-profit sectors.