
Abstract
Neat poly(trimethylene terephthalate) (PTT) and PTT/modified organoclay nanocomposite with various amounts of clay were synthesized by a two-step procedure. Terephthalic acid (TPA) was reacted with 1,3-propanediol (1,3-PDO) in the esterification step. Then, polycondensation reaction resulted in the formation of PTT in the presence of tetra buthyl titanate (Ti(OC4H9)4) as a catalyst. Commercially available organoclay (Cloisite 30B) was modified using 3-aminopropyltriethoxysilane via a silylation reaction. Thermal stability of modified clay was studied by means of thermal gravimetric analysis (TGA) that showed 10% less weight loss than Cloisite 30B. PTT/organoclay nanocomposites with 0.5, 1 and 2 wt% of modified organoclay were prepared by in situ polymerization. Synthesized polyesters were characterized by Fourier-transform infrared spectroscopy and proton-nuclear magnetic resonance spectroscopy (1H-NMR). Number average molecular weights were determined by 1H-NMR and a new Mark–Houwink equation is reported for highly pure dichloroacetic acid as solvent at 25°C. Polymer’s morphology was examined with x-ray diffraction and transmission electron microscopy. It was observed that clay layers were not accumulated. Thermal properties and crystallization behavior were investigated by differential scanning calorimetry and TGA. Crystallization temperature (T c) of nanocomposites increased about 6°C compared to neat PTT that reflects greater overall crystallization. Modified Averami Equation was used to describe crystallization kinetics and crystal size was studied using polarized optical microscopy. It was observed that crystal size reduces with nanoclay content. PTT mostly is used as polymeric fiber. Hence, dyeability of neat PTT and nanocomposites was investigated using a spectrophotometer. About 32% increase in color uptake was determined.
Introduction
Poly(trimethylene terephthalate) (PTT) is an aromatic polyester that could be produced via reaction of 1,3-propanediol (1,3-PDO) and terephthalic acid (TPA). In this polymer, phenyl groups act as hard segments and methylene groups act as soft segments. 1 PTT synthesis was first reported by Whinfield and Dickson in 1941. 2,3 Since, PTT has been applied in many applications such as fiber and film productions and in injection molding due to its good tensile behavior, elastic recovery, and dyeability. PTT fibers are a suitable alternative for their group mate poly(ethylene terephthalate) because of good resiliency and softness (similar to nylon fibers) as well as the chemical stability and stain resistance. Hence, PTT is an ideal candidate for use in applications such as carpets and other textile fibers. 4
Polymer nanocomposites have absorbed a great deal of attraction as an interesting method to manipulate polymer properties and broaden their application, using nanoscale reinforcements in comparison to particle-filled microcomposites. 5 –7 Clays are the most applied filler in nanocomposite, due to their intercalatable-layered structure. 8 –10 Montmorillonite (MMT), hectorite, and saponite are commonly used clays. Exfoliated and intercalated morphologies are two possible ideal polymer-layered silicate structures. In general, exfoliated structure causes greater property enhancements than intercalated one. Better compatibility between clay and polymer could be achieved by chemical modification of clay. 11 For example, the hydrated cations on the interlayer could be substituted with cationic surfactants such as alkylammonium. Lower surface energy could be achieved when an organophilic ion is exchanged; hence, more compatibility is reached with polymer. 7 Solution mixing, melt mixing, sol–gel, and in situ polymerization are the various methods to prepare polymer–clay nanocomposites. 10 –16
The in situ polymerization method was conducted via swelling organoclay by monomers, followed by a reaction step. Chain growth within the clay galleries increases clay exfoliation and forms nanocomposite. In situ interlayer polymerization is a highly attractive technique due to its versatility and compatibility with various reactive monomers, which could be a valuable process for commercial production. 17 –19 In the preparation of PTT nanocomposites, high temperature of around 265°C is required for successful in situ polymerization. In the higher temperature, decomposition occurs and interface between filler and polymer matrix is effectively altered. 20 –22 Hence, clay layers turn hydrophilic and overall physical properties of the final nanocomposite will be reduced. Some researchers have studied the preparation of thermally stable organoclays. 23
Low thermal stability of commercial ammonium ion–modified clays is a major drawback of its use in in situ polymerization. Therefore, the thermal stability of organoclays has been improved using some modifiers such as phosphonium, 24,25 imidazolium, 26 pyridinium, 27 and ionic liquid, 28 in order to be used at high temperatures. However, these materials are not as good as ammonium tallow salts, in expanding clay interlayer and improving compatibility with polymers. More improvement in clay thermal stability is reachable with grafting organosilane compounds on the edge of clay sheets. 29 –32
In this research, neat PTT was synthesized in a laboratory scale reactor. Suitable recipe was reported to reach moderately high intrinsic viscosity (IV). Then, Cloisite 30B, a commercial organoclay, was modified by 3-aminopropyltriethoxysilane (APS) via a silylation reaction. Consequently, PTT/organoclay nanocomposites were prepared by in situ polymerization. Three levels of modified clay percentage were added that are 0.5, 1 and 2 wt%. Structure and thermal stability of modified Cloisite 30B and synthesized polymers were studied by means of Fourier-transform infrared spectroscopy (FTIR), proton-nuclear magnetic resonance spectroscopy (1H-NMR), x-ray diffraction (XRD), transmission electron microscopy (TEM), differential scanning calorimetry (DSC), and thermogravimetric analysis (TGA). Mark–Houwink constants for the dichloroacetic acid, as solvent, were calculated by determining the molecular weight of neat PTTs using 1H-NMR. The crystallization mechanism was studied using the modified Avrami equation. Crystal morphologies of the samples were observed by polarized optical microscopy (POM). Dye uptake of neat PTT and the nanocomposites was investigated using the Samaron Yellow 6GSL 200 (CI Disperse Yellow 114) Clariant (Muttenz, Switzerland) dye and spectrophotometer. To the best of our knowledge, there was no report on PTT nanocomposite dyeing.
Experimental section
Materials
TPA was supplied by Shahid Toundgoyan Petrochemical Complex (Mahshar, Iran) and 1,3-PDO, tetrabutyl titanate and APS were purchased from Merck & Co. (Darmstadt, Germany). (Gonzales, Texas, USA) Cloisite 30B organoclay, as an intercalant, was purchased from Southern Clay Products, Inc. (Gonzales, Texas, USA) Cloisite 30B is commercial nanoclay that was obtained by modifying MMT with bis(2-hydoxyethyl) methyl hydrogenated tallow ammonium chloride (MT2EtOH) by the supplier. Highly pure dichloroacetic acid as the solvent of IV measurement and trifluoroacetic acid, as the solvent for 1H-NMR analysis, were purchased from Merck Co. and Scharlau Co. (Sentmenat, Spain), respectively. All chemicals were used as received.
Setup
A homemade laboratory-scale reactor was set up to produce polyesters and their nanocomposites. Figure 1 shows schematic of the set-up. This set-up consists of a 1-L stainless steel reactor, a condenser, and a vacuum pump. The reactor was heated with an electrical heater (1500 W) and cooled by air flow. Ceramic-type insulation covered the reactor. The reactor could be heated up to 350°C. Required pressure was applied by a nitrogen flow. Moreover, the produced water, as an esterification by-product, was carried over by nitrogen flow. A stainless steel condenser was mounted in order to return the 1,3-PDO into the reactor. Condenser temperature was maintained at 160°C. Water vapor was cooled, gathered, and weighed on a regular basis (every 15 min) as an indication of reaction extension. During the polycondensation step, vacuum was vital to extract 1,3-PDO, as a by-product and increase the molecular weight of polymer. Required vacuum was supplied by a vacuum pump. Two chilled traps at −30°C, in series, were used to prevent the entry of organic materials into the vacuum pump. All data acquisition and control tasks were performed with a home-written Visual C#.net code via an I/O card model USB-4711A from AdvanTech, Milpitas, California, USA. An injection system was devised to add catalyst and nanoparticles during polycondensation.
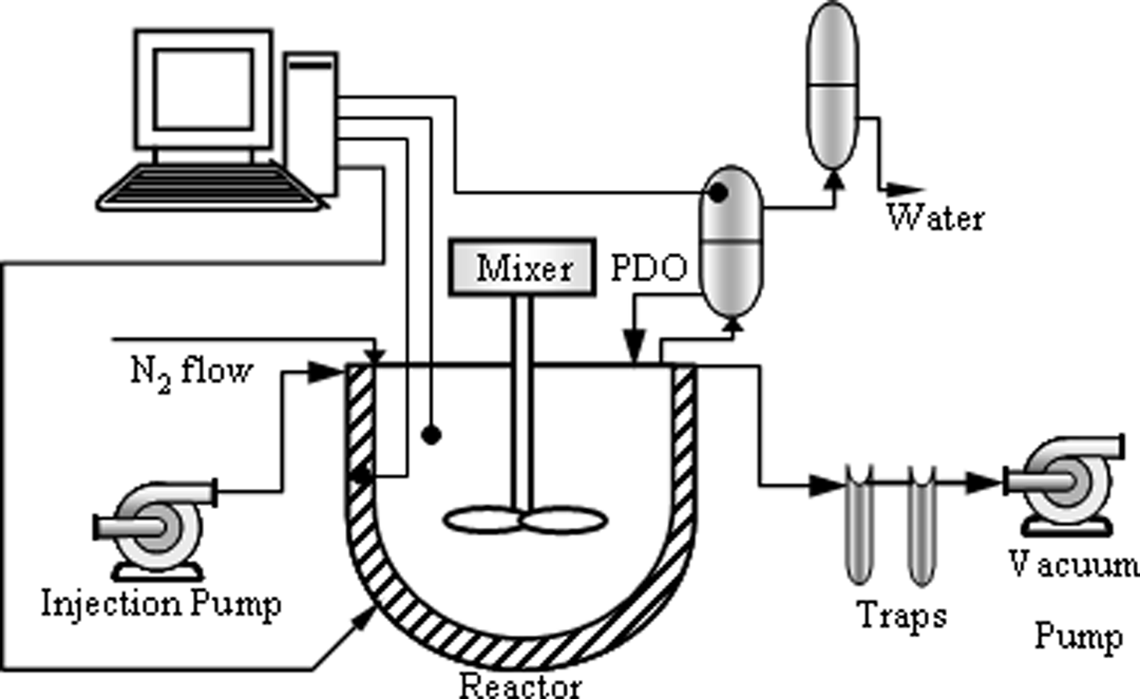
Schematic of the set up.
Synthesis of PTT
Neat PTT was synthesized under various conditions. Table 1 lists conditions of each test. Run number PTT-4 had suitable temperature and pressure as it has the highest molecular weight among all runs. 1,3-PDO and TPA with a hydroxyl group/acid group molar ratio of 1.7 were mixed and homogenized before charging into the reactor. The overall weight of the material was 650 g. The paste was mixed for 30 min at 90°C under 4.5 bar of nitrogen pressure. The temperature was then increased gradually to 230°C. The esterification step was performed until no more water was collected. In the beginning of the polycondensation step, catalyst (5 × 10⁻⁴ mol catalyst/mol TPA) was injected into the reactive mixture. Then, temperature was raised to 260°C, and the vacuum was applied as much as possible. 1,3-PDO, by-product of the polycondensation, was removed by the vacuum pump. This step was continued for 3 h. Finally, pressure was increased to atmospheric pressure, and all materials were evacuated by nitrogen pressure.
Different conditions of synthesizing neat PTT.
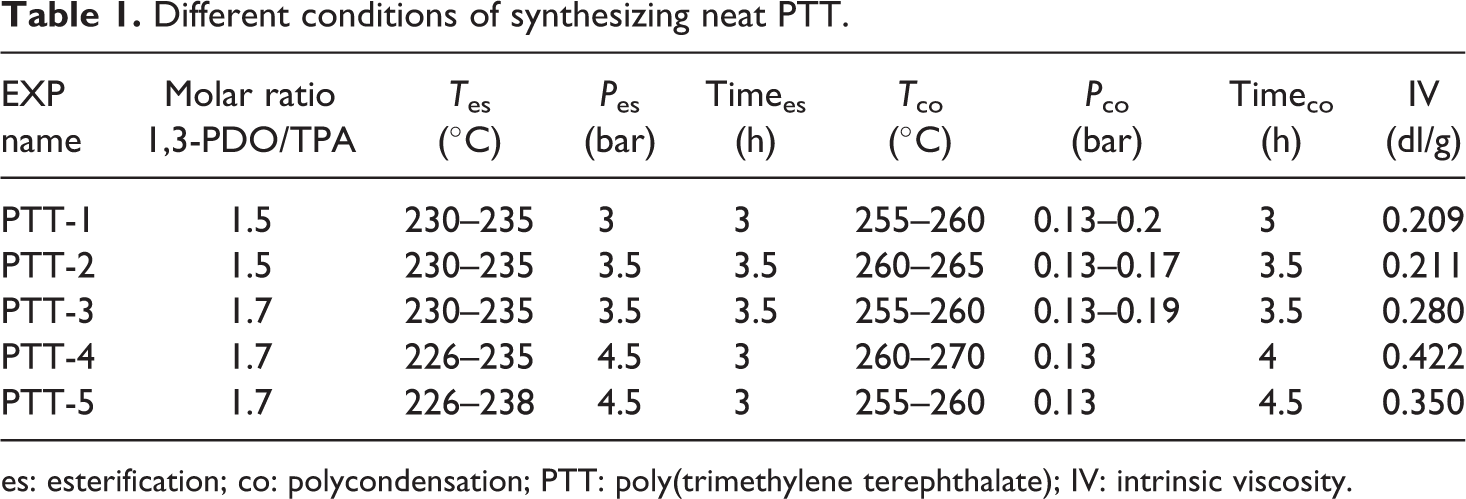
es: esterification; co: polycondensation; PTT: poly(trimethylene terephthalate); IV: intrinsic viscosity.
Modification of Cloisite 30B
First, Cloisite 30B was dried in a vacuum oven overnight at 60°C. About 1 g of Cloisite 30B was added into solution of APS and ethanol. One gram of APS was added to ethanol and total volume was increased to 25 mL. The mixture was refluxed for 6 hours with constant stirring. Product was washed thoroughly by ethanol/water solution to remove excessive silane-coupling agent, then dried at 60°C for 24 h. The modified organoclay was designated as 30B-APS.
Synthesis of PTT/30B-APS nanocomposites
Recipe of PTT/30B-APS nanocomposites synthesis was similar to recipe of PTT-4 (see Table 1). Synthesis was performed in the presence of 0.5, 1 and 2 wt% of 30B-APS that was added with the catalyst.
Samples dyeing
Sample films of 0.75 mm thickness were prepared by hot pressing. Each sample film was pressed for 5 min at a pressure of 70 bar and a temperature of 220°C. Then, the mold was cooled to 50°C using cold water.
Sample films were dyed separately using Samaron Yellow 6GSL 200 (CI Disperse Yellow 114) supplied by Clariant (Muttenz, Switzerland). Dyeing was started at room temperature. The temperature of dye bath was increased at a rate of 2°C/min up to 100°C. Samples were kept at this temperature for 45 min. Finally, the dyed samples were rinsed with tap water and air-dried.
Measurements and characterizations
IV of the polyesters were measured using a 1C Ubbelohde viscometer (Schott AG, Mainz, Germany) and polyester solution in highly pure dichloroacetic acid at 25 ± 0.1°C. IV results are given in Table 1. 1H-NMR spectra were recorded on a Bruker Avance (Fällanden, Switzerland) spectrometer operated at 500 MHz and 25°C. Samples were dissolved in solution of CDCl3/TFA (50/50, w/w); the spectra were internally referenced to tetramethylsilane. Sixty milligram was dissolved in 0.8 mL of the aforementioned solution and was used for 1H-NMR spectroscopy. Infrared spectra were obtained on a Nexus 670 spectrophotometer purchased from Nicolet Co. (Waltham, MA, USA) at room temperature. A total of 1–2 mg of the polyesters was mixed with 100–200 mg of KBr to produce samples for FTIR. XRD profiles were recorded using an X’Pert MPD model (tube voltage: 40 kV and tube current: 30 mA) with a monochromatic Co-Kα radiation (λ = 1.789 Å). Samples were scanned from 2θ = 2° to 10° at a scanning rate of 1°/min using a reflection mode. TEM images of samples were taken using EM10C, Carl Zeiss Co. (Oberkochen, Germany) with a 60 kV acceleration voltage. The samples were cryomicrotomed into ultrathin slices of about 100 nm with a diamond knife. A Mettler–Toledo (Columbus, OH, USA) 822e DSC (calibrated with indium) was used to study thermal behavior. DSC curves were obtained from 10–15 mg of samples at heating and cooling rates of 10°C/min, under nitrogen atmosphere. TGA was performed under a nitrogen atmosphere using a TA Instruments PL-TGA model, Polymer Laboratory Co., Church Stretton, UK to measure the thermal stability of the organoclays, polyester and nanocomposites. The samples were heated at a rate of 10°C/min. The reflectance of the dyed samples was measured in the visible range (360–750 nm) by a Colour-Eye 7000A spectrophotometer made by Gretag Macbeth (Grand Rapids, Michigan, USA). The color coordinates were obtained under illuminant D65 and 10° standard observer. Crystalline morphologies of PTT and PTT/30B-APS nanocomposites were examined with a Leica model DMRX (Linkam, Surrey, UK) polarized optical microscope. A thin piece of samples was sandwiched between two glass plates, compressed at 260°C for 5 min to ensure the complete melting of crystallites and then annealed for 30 min.
Result and discussions
Characterization of PTT
FTIR spectrum of PTT is shown in Figure 2. The peaks at 2973 and 2901 cm−1 are related to asymmetric and symmetric stretching vibration of methylene groups, respectively. The peak at 1465 cm−1 represents special vibration of methylene groups. The peak at 1717 cm−1 is attributed to stretching vibration of the C=O group, while the peak at 726 cm−1 is related to interfacial swinging vibration of three methylene groups. The peaks at 1270 cm−1 and 1506 cm−1 represent stretching vibration of C–O in the carboxyl group and characteristic adsorption of the phenyl group.
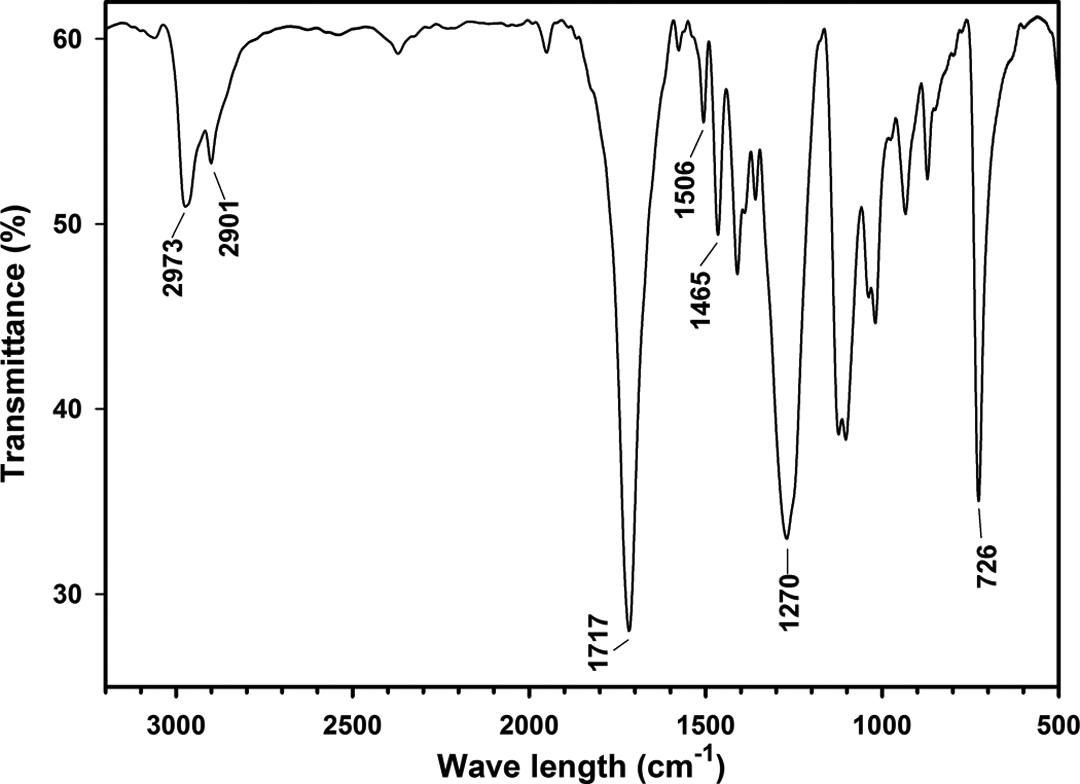
FTIR spectrum of PTT. FTIR: Fourier-transform infrared; PTT: poly(trimethylene terephthalate).
1H-NMR spectrum of PTT shows three characteristic peaks that represent three kinds of proton, as seen in Figure 3. The peaks, located at 2.4 ppm and 4.6 ppm, correspond to protons of the middle and end methylene group, respectively. The peak at 8.1 ppm corresponds to aromatic proton in the PTT chain. Moreover, the ratio of these three peak areas is 1:2:2. In 1H-NMR, the area of each peak is proportional to the number of proton of the related group. Hence, it was concluded that the spectrum belongs to PTT. These results are comparable with the reported results. 33
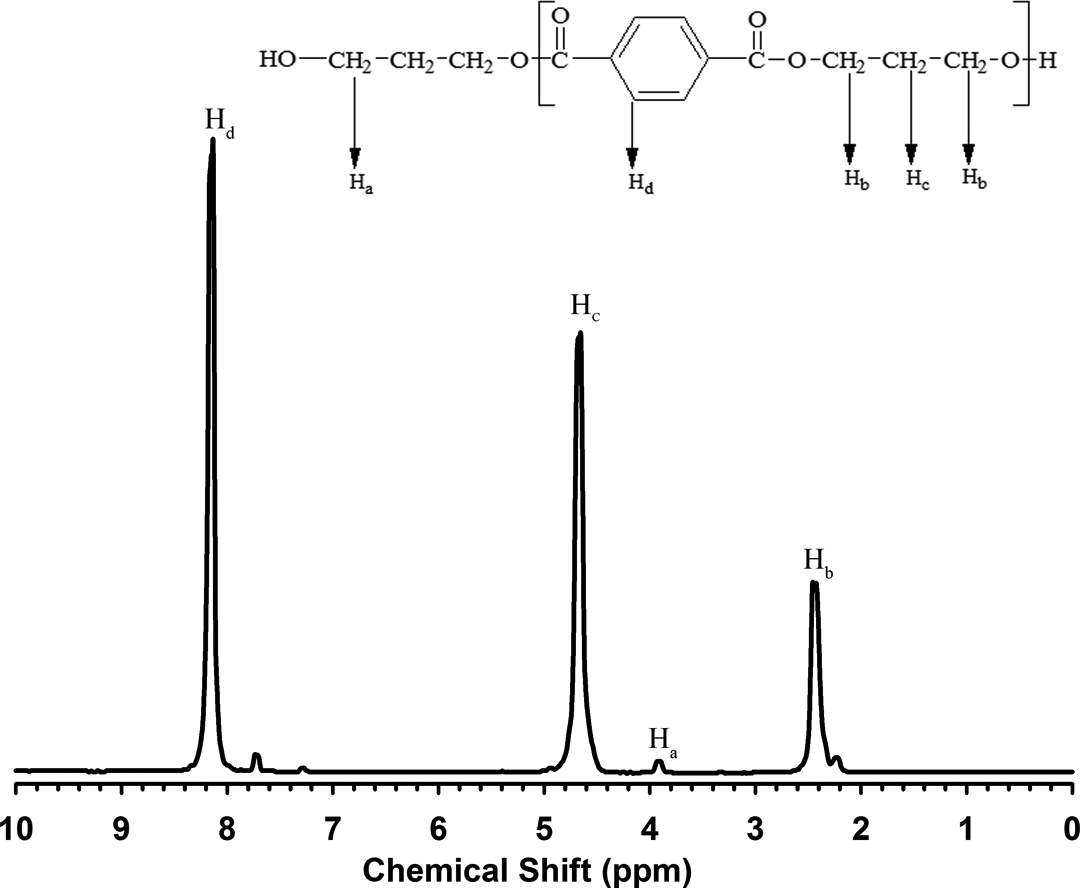
1H-NMR spectrum of PTT. 1H-NMR: proton-nuclear magnetic resonance spectroscopy; PTT: poly(trimethylene terephthalate).
Molecular weight measurement
Molecular weights were determined using 1H-NMR spectroscopy results. The number of repeating units was calculated based on the following equation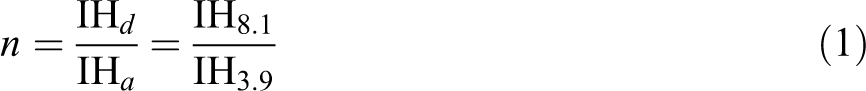
where IH
d
is the area under aromatic protons peak and IH
a
is the area under the methylenic protons adjacent to the chain end hydroxyl group. Then, molecular weight was determined by the product of the number of the repeating unit in its molecular weight (206 g mol−1). Table 2 shows the corresponding data and molecular weights. Hence, it is possible to compute constants of the well-known Mark–Houwink equation
Mark–Houwink constants for PTT and different solvents are available,
34
but these constants have not been reported for PTT in dichloroacetic acid (at 25°C). Mark–Houwink constants were calculated by linear regression (see Figure 4) as follows
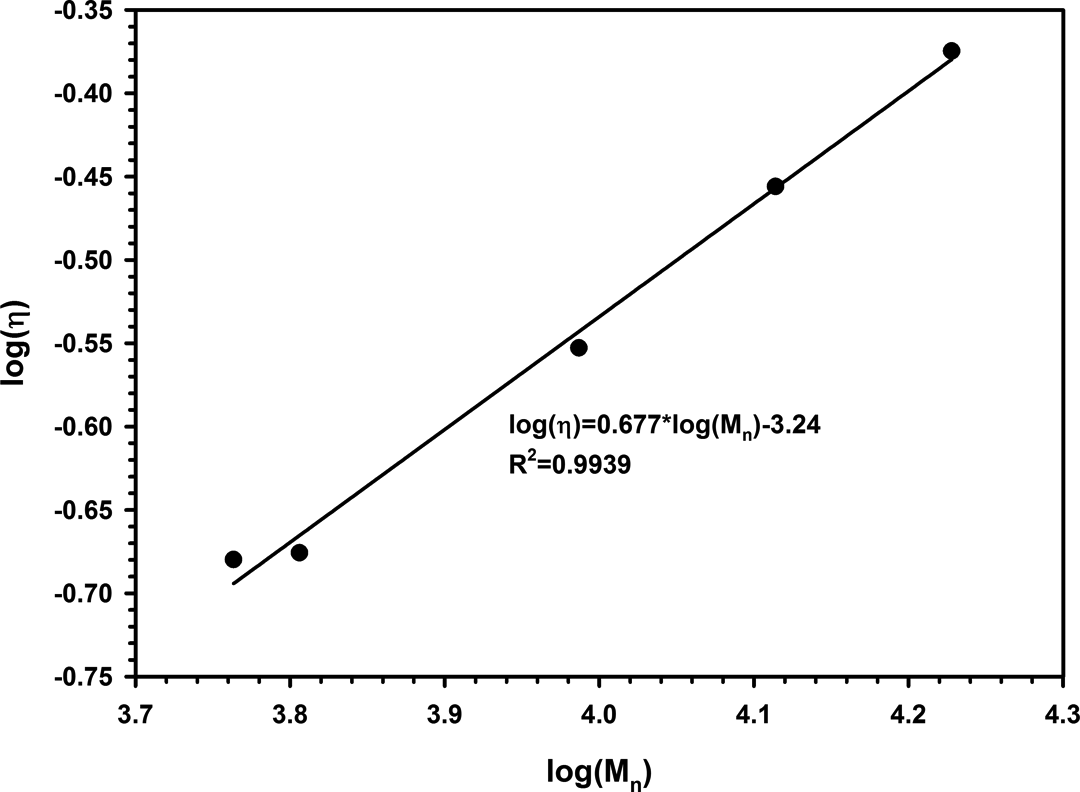
Linear regression of intrinsic viscosities and molecular weights of synthesized PTT for finding Mark-Houwink constants. PTT: poly(trimethylene terephthalate).
Investigation of PTT's molecular weight.
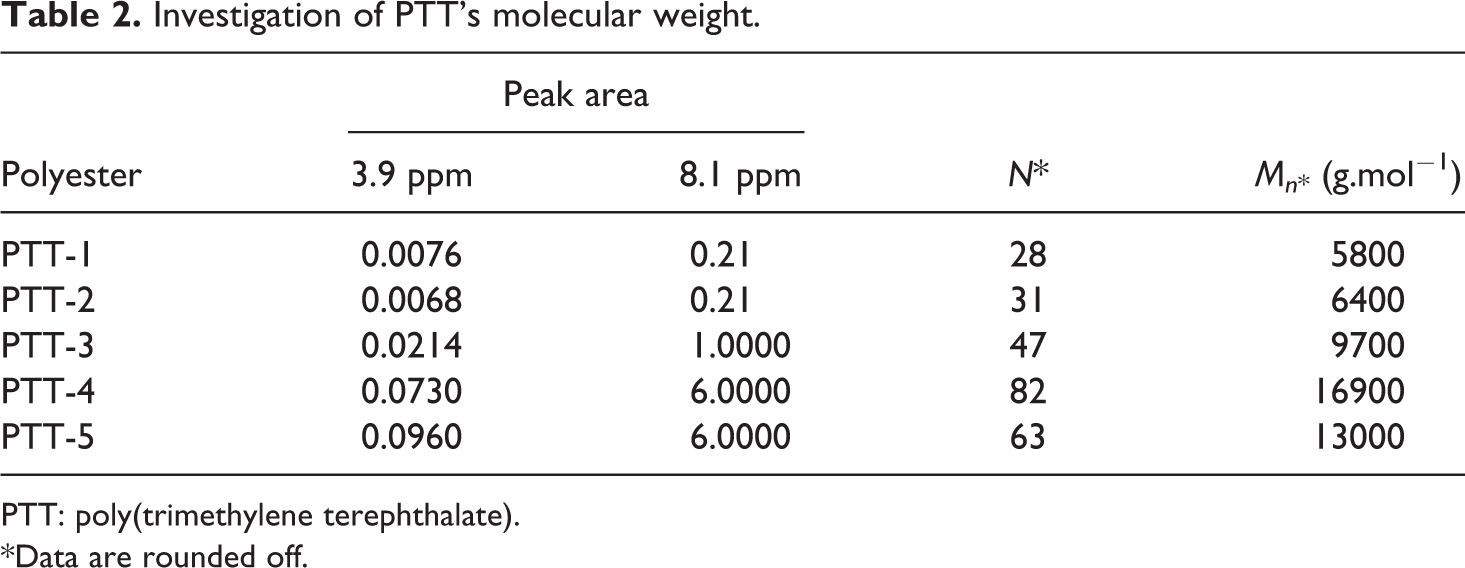
PTT: poly(trimethylene terephthalate).
*Data are rounded off.
Characterization and properties of 30B-APS
The FTIR spectra of Cloisite 30B and 30B-APS are shown in Figure 5. The peak at 3647 cm−1 for Cloisite 30B corresponds to hydroxyl stretching that is bonded to aluminum and magnesium in clay. The peaks at 3400 and 1650 cm−1 represent OH stretching and bending vibrations of adsorbed water. The broad peak in the range 1200 to 1000 cm−1 with maximum at 1045 cm−1 is due to Si–O in plane stretching. The strong peaks at 2927 and 2853 cm−1 for –CH stretching and at 1470 cm−1 for –CH2 bending vibration in Cloisite 30B indicate the intercalation of alkyl ammonium ions between silicate layers. The relative peak intensity (I 3400/I 1045) of Cloisite 30B is larger than that of 30B-APS. Therefore, it is concluded that hydroxyl groups of the Cloisite 30B reacted with APS through silylation reaction which resulted in the reduction of hydroxyl group content. In other words, the grafting of APS on Cloisite 30B was mainly carried out through the reactions between organosilane and hydroxyl groups in the hydrogenated tallow ammonium ions. These results are comparable with the reported results. 35
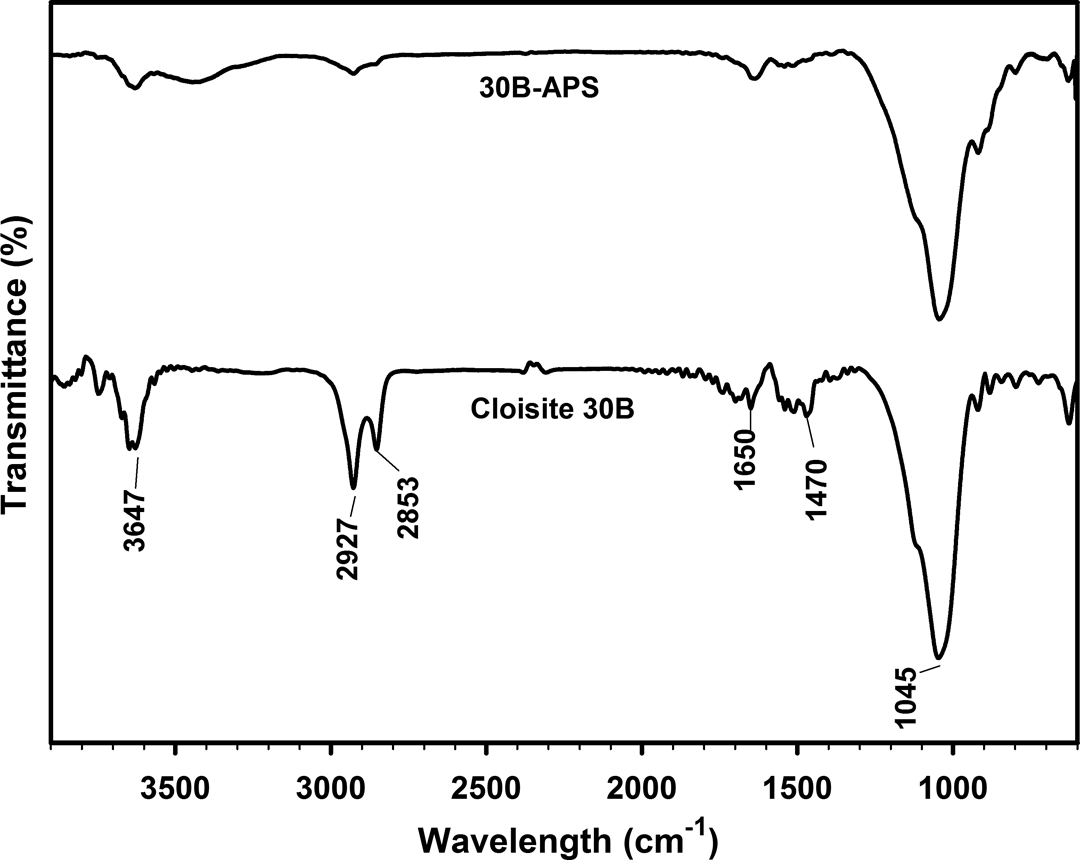
FTIR spectrum of Cloisite 30B and 30B-APS. FTIR: Fourier-transform infrared.
Figure 6 shows the XRD patterns of Cloisite 30B before and after modification. Basal spacing for Cloisite 30B was 18.3Å. After silylation reaction, the basal spacing was increased to 25.2 and 34.5Å. The increase in the basal spacing of 30B-APS indicates that APS was intercalated into clay intergalleries. Cloisite 30B has two hydroxyl groups in its molecular structure. Therefore, reaction of organosilane with hydroxyl groups could increase layer spacing.
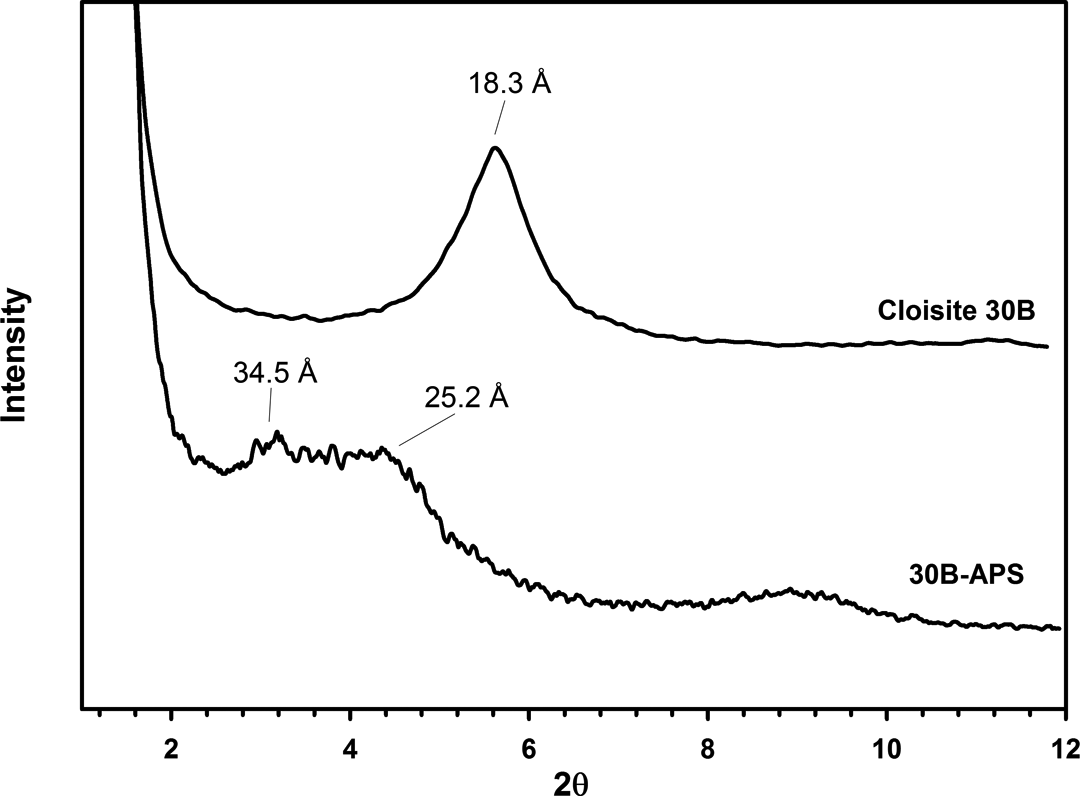
XRD patterns of Cloisite 30B and 30B-APS. XRD: x-ray diffraction.
Thermal stability of 30B-APS was investigated using thermo gravimetric analysis. Figure 7(a) displays the TGA thermograms of both modified and unmodified clays. Thermal decomposition of the ammonium surfactants was most likely responsible for the large drop in weight of 16% between 250 and 600°C for Cloisite 30B. About 6% weight loss was also observed for 30B-APS at the same range of temperatures because of combined decomposition of ammonium ions and organosilanes. DTG (Derivative Thermogravimetric Analysis) spectra are also shown in Figure 7(b). In general, the exothermic peaks in the DTG, involving weight loss, increase from 273 and 365°C for Cloisite 30B to 299 and 402°C for 30B-APS. Therefore, modifying Cloisite 30B with APS enhanced thermal stability. Isothermal TGA was conducted over 3 h in order to study the thermal stability of modified clay over the long time close to polycondensation process time. Figure 8(a) and (b) shows the results of isothermal TGA and DTG, respectively. Figure 8(c) represents the temperature profile vs. time of this test. It is observed that weight decrease is not significant. Therefore, modified clay is thermally stable enough during the synthesis process.
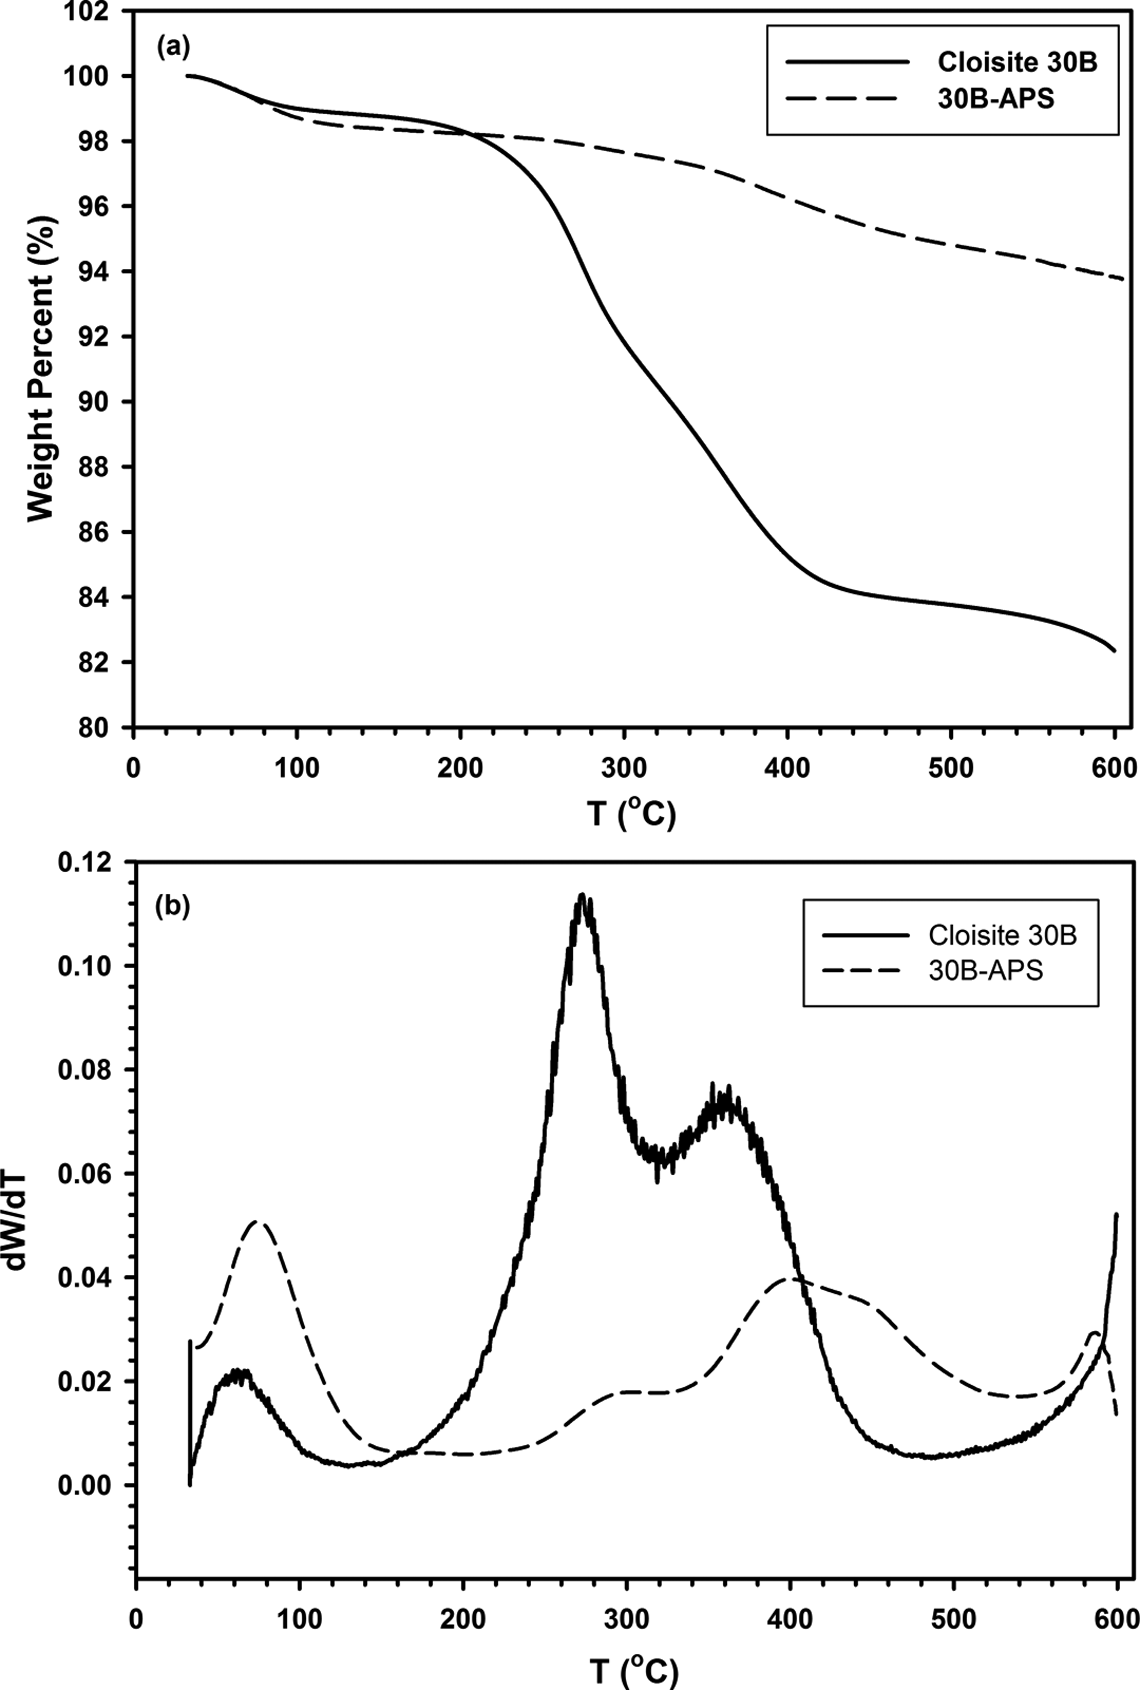
a) TGA and b) DTG (Derivative Thermogravimetric Analysis) curves of Cloisite 30B and 30B-APS. TGA: thermal gravimetric analysis.
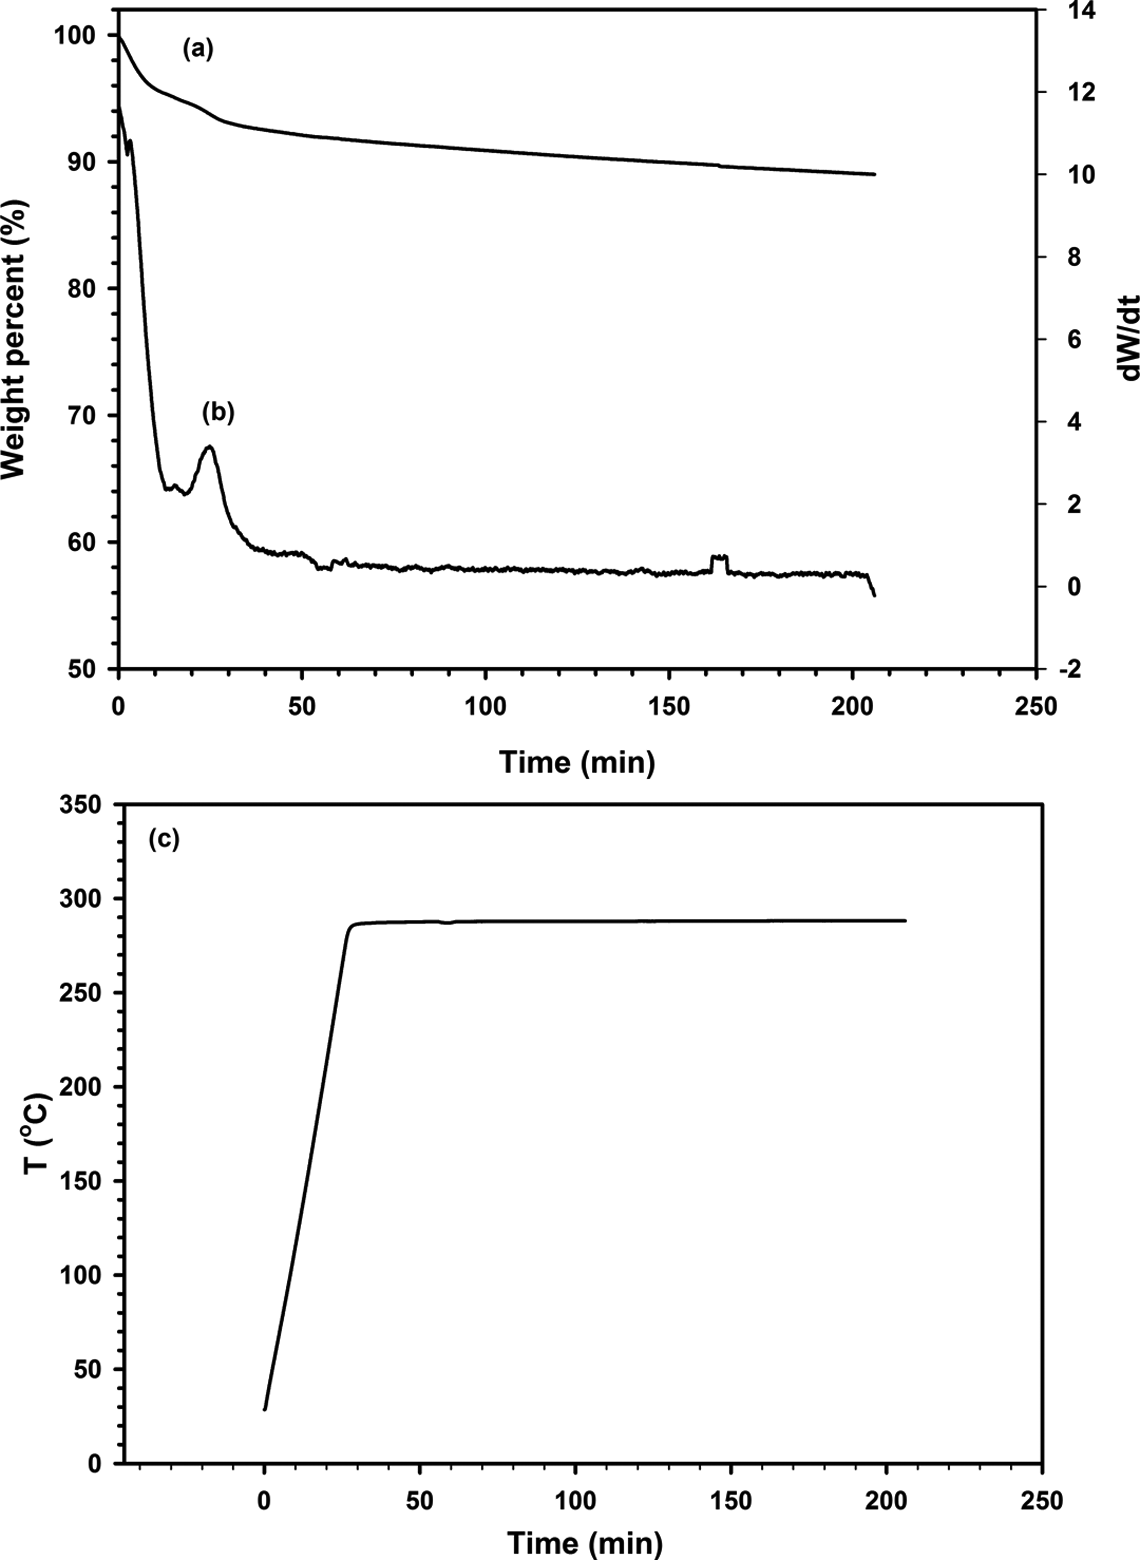
Isothermal (a) TGA, (b) DTG (Derivative Thermogravimetric Analysis) of Cloisite 30B modified APS and (c) temperature profile vs. time. TGA: thermal gravimetric analysis.
PTT/30B-APS nanocomposites morphology
Figure 9 shows XRD patterns for neat PTT and PTT/30B-APS nanocomposites. In all cases, curves show no peak in the range of 2θ = 2.97–4.07 (compared to that in Figure 6 for 30B-APS). Hence, there is a good dispersion of organoclay in PTT.
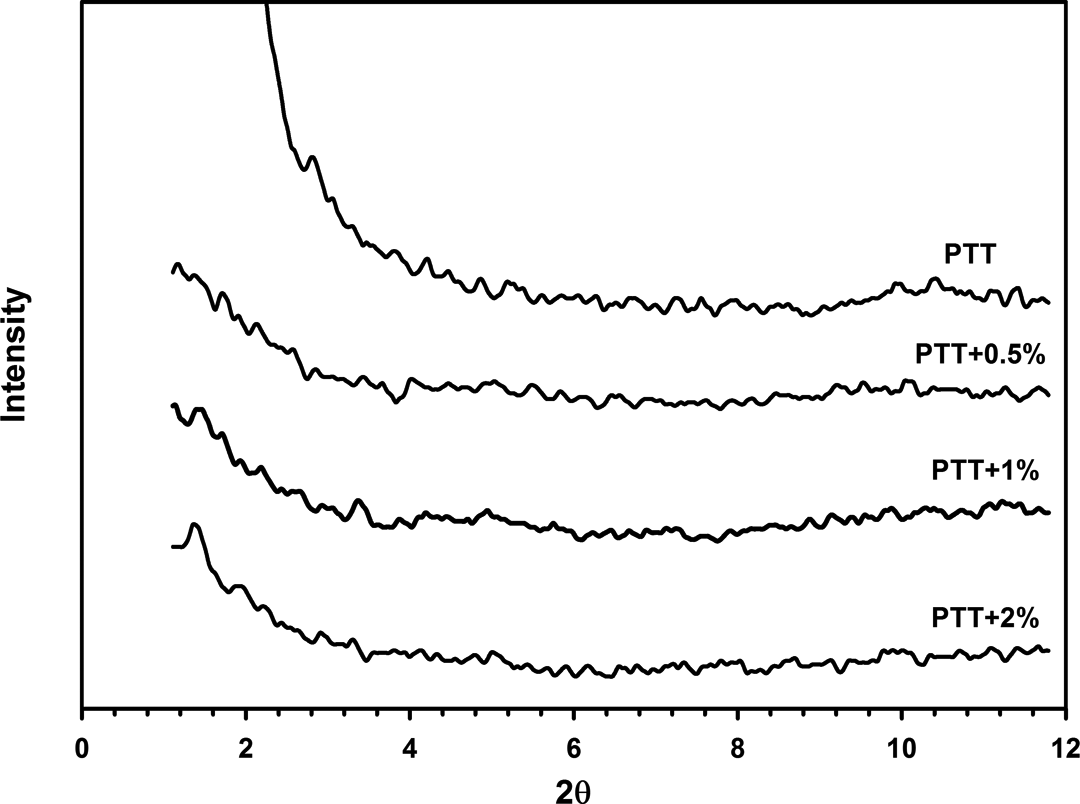
XRD patterns of neat PTT and PTT/30B-APS nanocomposites. XRD: x-ray diffraction.
Further investigation was performed by TEM in order to study the achievement of exfoliation of organoclay in PTT. TEM photograph for PTT/30B-APS nanocomposite containing 2 wt% organoclay is shown in Figure 10. The dark lines are the clay layers and the white or light gray regions are polymer. TEM studies confirm the result that was obtained using XRD. Hence, it is concluded that exfoliation of nanoclay was reached during the course of in situ polymerization.
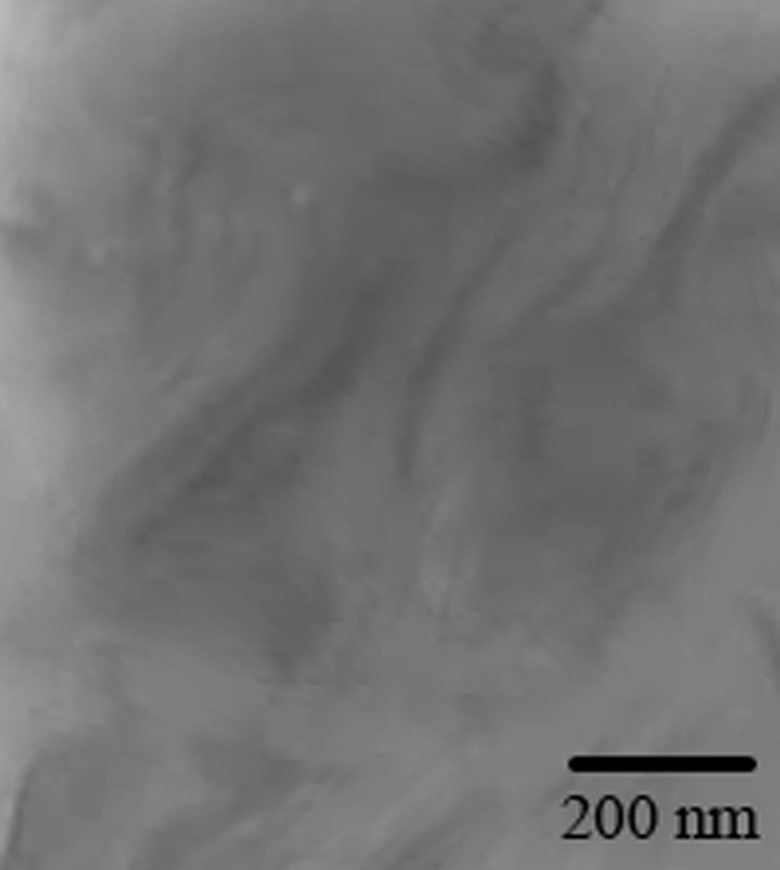
TEM photograghs of PTT/30B-APS nanocomposites. TEM: transmission electron microscope.
Thermal properties
Figures 11 and 12 show the thermogram of cooling and heating of samples. Related data are given in Table 3. DSC cooling curves show that the Tc of PTT/30B-APS nanocomposites are higher than the Tc of PTT. This increase in crystallization temperature indicates that nanosilicate is an effective nucleating agent. Changes in crystallization peak width (▵Tc ) and ▵Hc are related to the overall crystallization rate and degree of crystallization, respectively. 11 The ▵Tc values for nanocomposites that are 11–17°C, were narrower than that of neat PTT (30°C), and 2 wt% exhibited the narrowest one. Crystallization rate is defined as heat of crystallization divided by time from onset up to completion of crystallization (▵Hc /time). As seen in Table 3, the values of ▵Hc /time for nanocomposites are higher than that of neat PTT (2.8 J/g s). In other words, the crystallization rates for the nanocomposites are more than that of PTT.
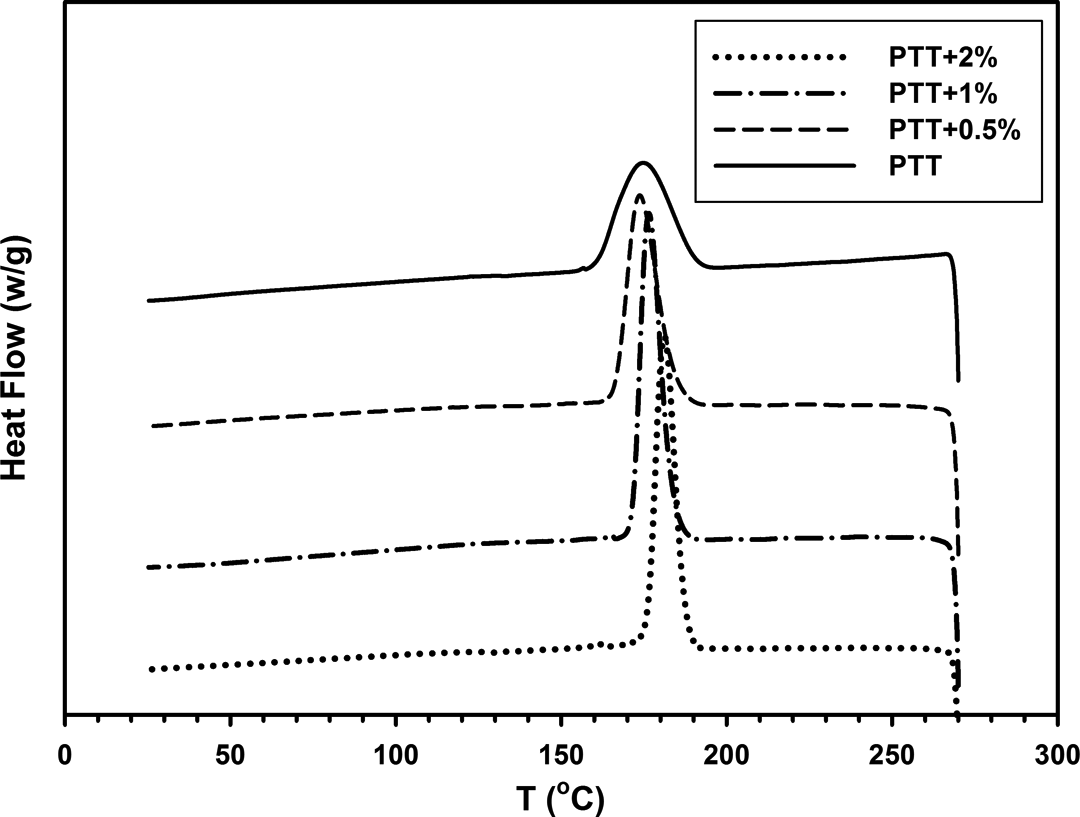
DSC cooling thermogram of neat PTT and PTT/30B-APS nanocomposites. DSC: differential scanning calorimetry.
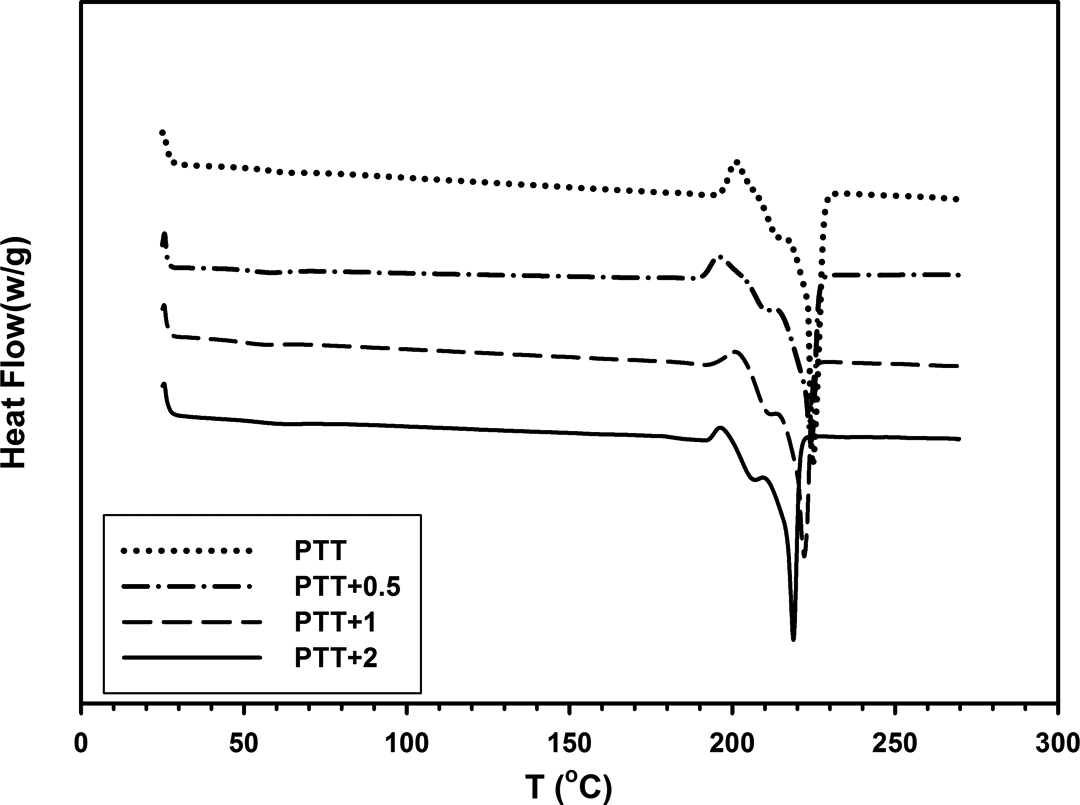
DSC heating thermogram of neat PTT and PTT/30B-APS nanocomposites. DSC: differential scanning calorimetry.
DSC data of neat PTT and PTT/30B-APS nanocomposites
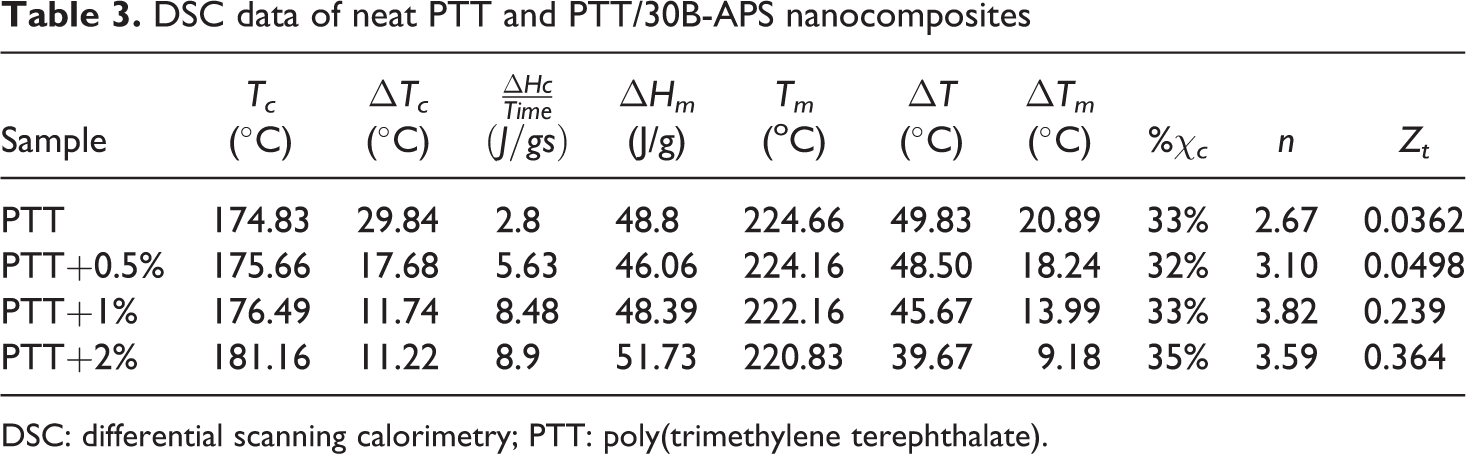
DSC: differential scanning calorimetry; PTT: poly(trimethylene terephthalate).
In cooling, Tc reflects the overall crystallization rate because of the communal effects of nucleation and growth. Thus, the degree of supercooling (▵T = Tm − Tc ) could be a measure of polymer crystallization ability: the smaller the ▵T, the higher the overall crystallization rate. 36 ▵T values for the nanocomposites decrease with the increase in organoclay content. These results confirmed that the overall crystallization rate for the nanocomposites is more than that of neat PTT. As shown in Table 3, nanocomposites exhibit a higher Tc , a greater ▵Hc /time, and a smaller ▵T in comparison to neat PTT, demonstrating nucleating agent’s role of clay. 37
DSC heating curves show a very small exothermic recrystallization peak before Tm in all samples, which is related to thermal history (Figure 12). Tm decreases slightly with increase in the organoclay content. The lower melting temperature peak was attributable to the melting of imperfect crystals, which formed as a result of the nucleation effect of 30B-APS during the cooling run. It was observed that ΔTm decreases in nanocomposites, therefore it could be concluded that the distribution of crystallites in nanocomposites was narrower than that of neat PTT and smaller crystallites are produced, which then melt at lower temperatures.
The degree of crystallinity (%Xc) of neat PTT and nanocomposites were calculated according to equations (3) and (4), respectively:
where ▵Hm is the measured heat of fusion, and ▵Hm 0 is the heat of fusion for 100% crystalline polymer. φ is clay weight percentage in polymer composites. The heat of fusion of 100% crystalline PTT is 145 J/g. 38 As seen in Table 3, there is no significant change in the degree of crystallinity with increasing organoclay content. Hence, it is concluded that crystallization follows nucleation mechanism in all samples that lead to increase the number of crystals but in smaller size.
Isothermal crystallization kinetics could be studied by the renowned Avrami equation:
or in double-logarithmic form:
where n is Avrami constant that represents the mechanism of nucleation, Zt
is Avrami growth rate constant and Xt
is relative crystallinity at constant temperature at time t. The relative crystallinity (Xt
) as a function of time is computed by the following equation:
where t
0 and t∞
are initial and end times of crystallization, respectively. There are few methods for studying the nonisothermal crystallization process in polymers. The Ozawa’s equation (equation (8)) is a simple one to determine the Avrami parameters using nonisothermal DSC data. This equation is based on the cooling rates, C, of crystallization:
where Xt
is the relative crystallinity, Z(T) is a function of crystallization rate and m is Ozawa's exponent. In order to study the nonisothermal crystallization at a constant C, another approach is employed to join the Avrami and the Ozawa equations.
39,40
The Avrami equation connects relative crystallinity at a constant temperature, Xt
, with time t, and the Ozawa equation connects Xt
with C. Therefore, to join the above equations, the following equation could be used:
where T
0 is the starting temperature of crystallization and T is the temperature at time t. By making these changes, the nonisothermal crystallization mechanism can be investigated with the equation (6). Using DSC data, Xt
was plotted versus t for all samples (Figure 13). It can be observed that all these curves have similar shape, which shows faster crystallization rate for nanocompsites. Figure 14 shows double logarithm plots of
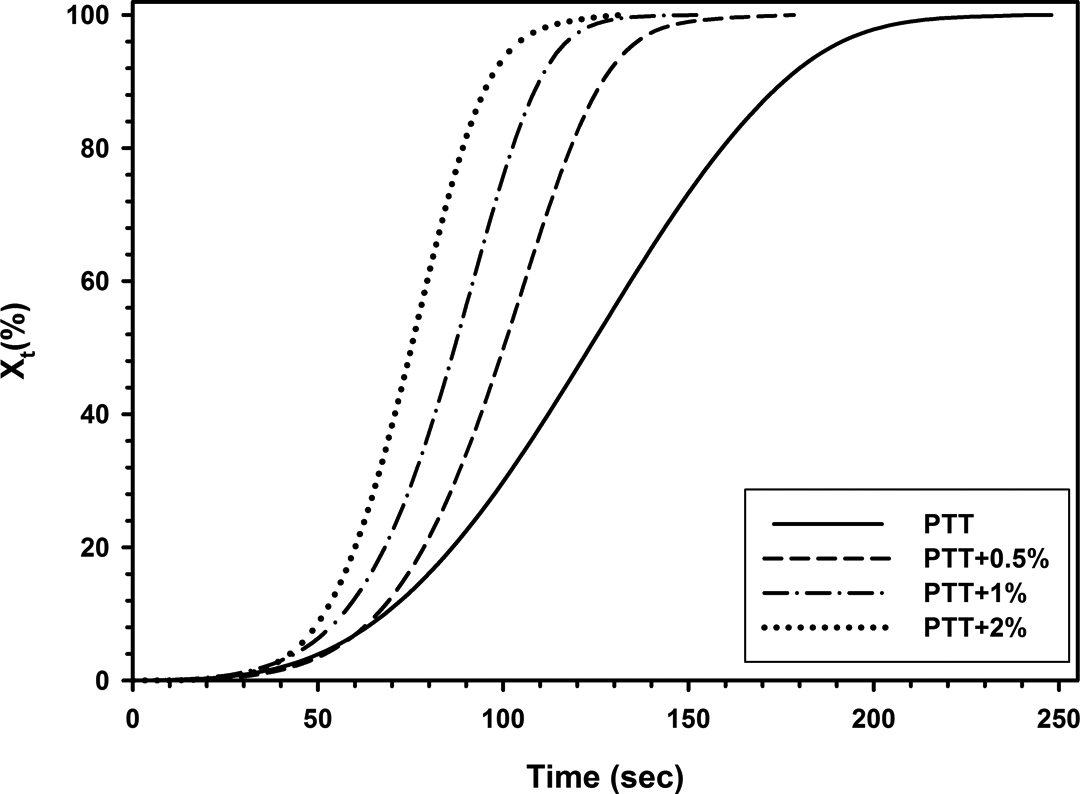
Development of Xt with t for nonisothermal crystallization of neat PTT and PTT/30B-APS nanocomposites. PTT: poly(trimethylene terephthalate).
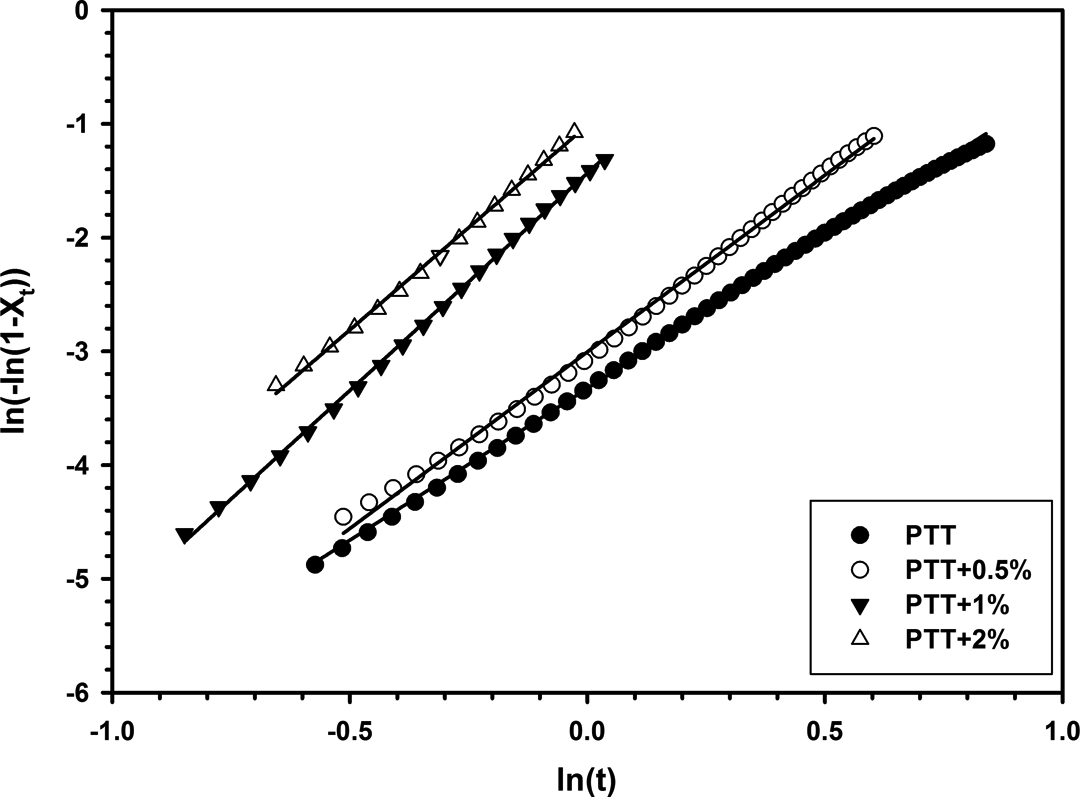
Plots of
Thermal degradation of neat PTT and nanocomposites was studied by TGA. Figure 15 displays TGA curves of all samples. Thermal decomposition temperatures and weight percentage of residue at 600°C are listed in Table 4. Results indicate that the initial thermal degradation temperature (TD i ) and the temperature of 5% weight loss (T 5%loss) of nanocomposites are increased with the amount of organoclay. This increase in thermal stability can be attributed to high thermal stability of 30B-APS and to intercalations of 30B-APS in polymer matrix. Weight of residue at 600°C was increased from 2% to 12% as 30B-APS content increased. Modified clay shows good thermal stability because of the thermal insulation effect of clay layers and creation of mass transport barrier to volatile products generated during decomposition. 4
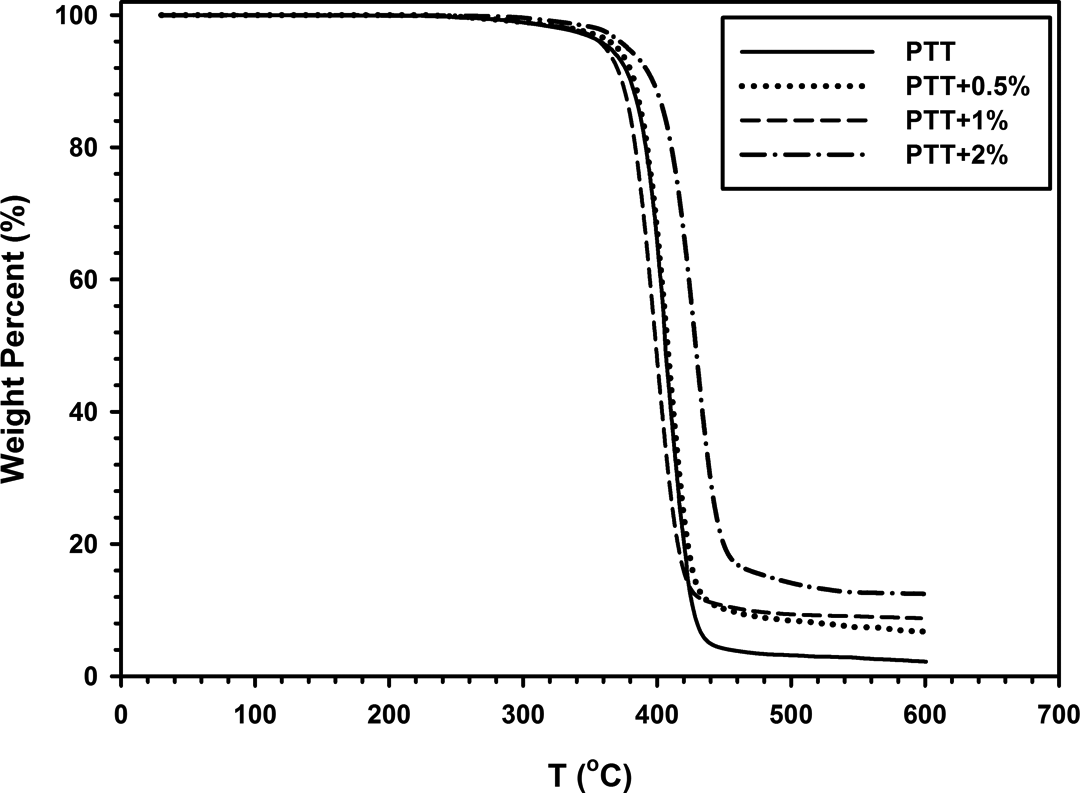
TGA curves of neat PTT and PTT/30B-APS nanocomposites. PTT: poly(trimethylene terephthalate).
TGA data of neat PTT and PTT/30B-APS nanocomposites.
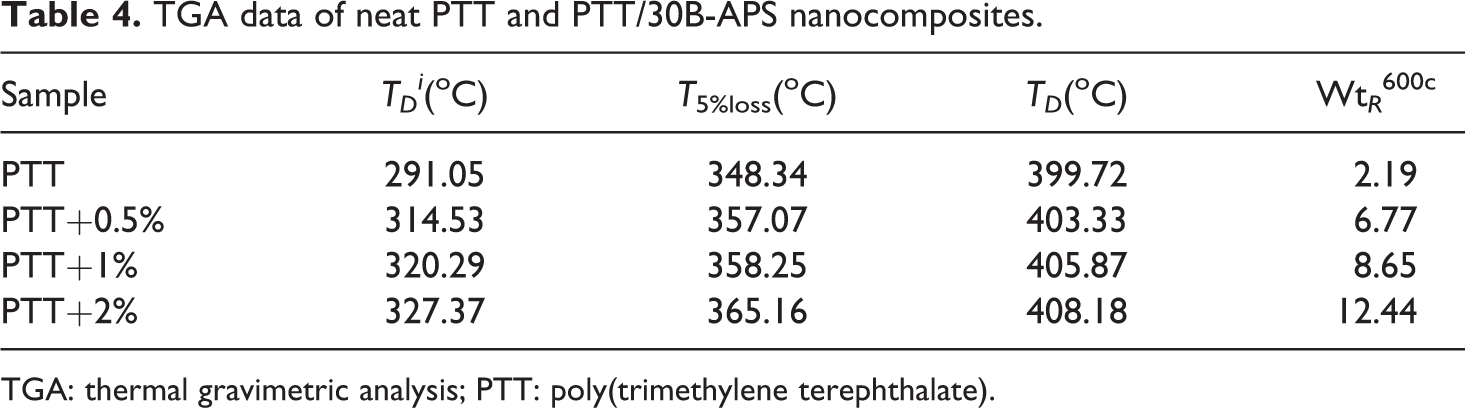
TGA: thermal gravimetric analysis; PTT: poly(trimethylene terephthalate).
Crystal morphology
The crystal morphologies of PTT and its nanocomposites were observed by POM (Figure 16). Neat PTT spherulites are almost big and perfectly grown, with a diameter of around 72 μm. However, spherulites of PTT/30B-APS nanocomposites, with 0.5, 1 and 2 wt% content of organoclay, are relatively small and their average diameters are 56, 45, and 38 μm, respectively. These results indicate that 30B-APS particles act as nucleating agent in the composites. Spherulite growth was confined to each other. Therefore, with organoclay content, the spherulite size decreases gradually, which is comparable to the published results. 40,41
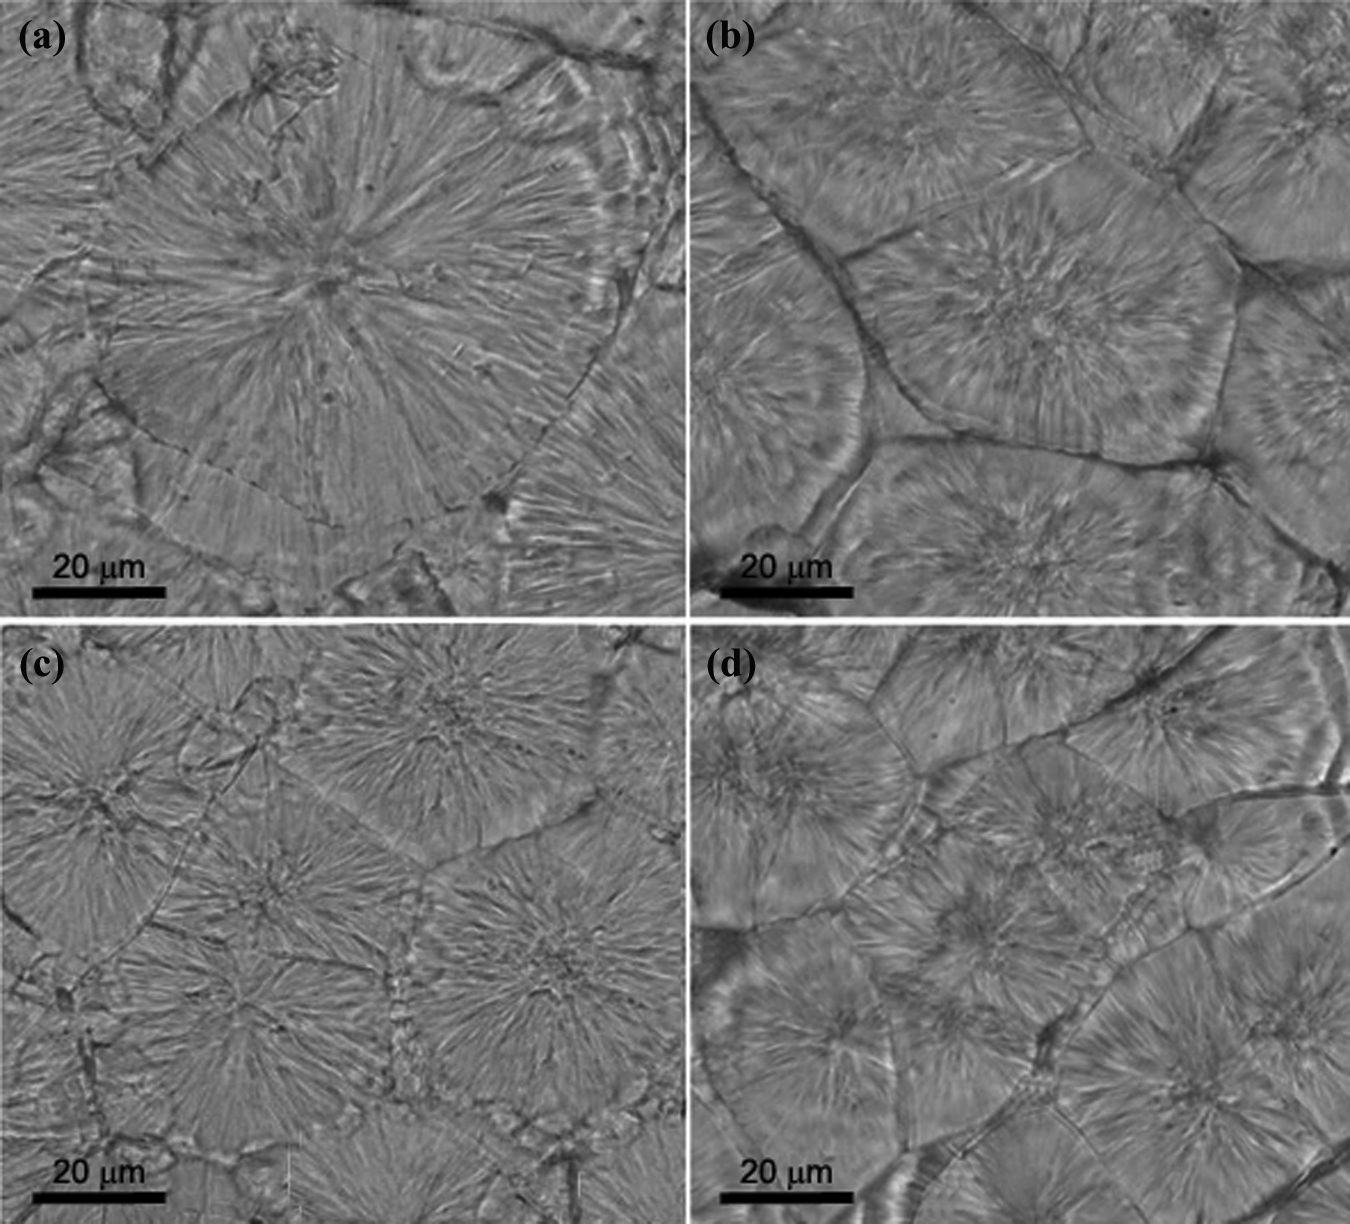
Polarized microscopy images of (a) neat PTT, (b) PTT+0.5 (c) PTT+1 and (d) PTT+2. PTT: poly(trimethylene terephthalate).
Dyeability
Dyeing behavior of the neat PTT and its nanocomposites was indicated by dye uptake and color strength (K/S value). Polar coordinate and corresponding Kubelka–Munk single constant theory were used to calculate K/S values at various wavelengths using the corresponding reflectance values. The Kubelka–Munk single constant theory was applied to calculate (K/S)
λ
values based on the corresponding Rλ
values using the following equation: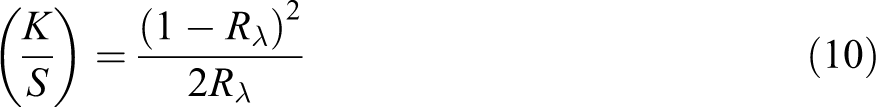
where K is the absorption coefficient and S is the scattering coefficient. The (K/S) λ values indicate dye uptake of each sample film. K/S values of all samples are presented in Figure 17. The PTT/30B-APS with 2 wt% content of organoclay shows the highest dyeing uptake at this dyeing method. Dye uptakes of nanocomposites were increased with increasing the organoclay content from K/S = 7.6 for neat PTT to K/S = 11.2 for PTT nanocomposite with 2 wt% organoclay. This is attributed to the reduction in crystal size. In other words, 32% improvement in dyeability was observed by adding up to 2 wt% 30B-APS to neat PTT.
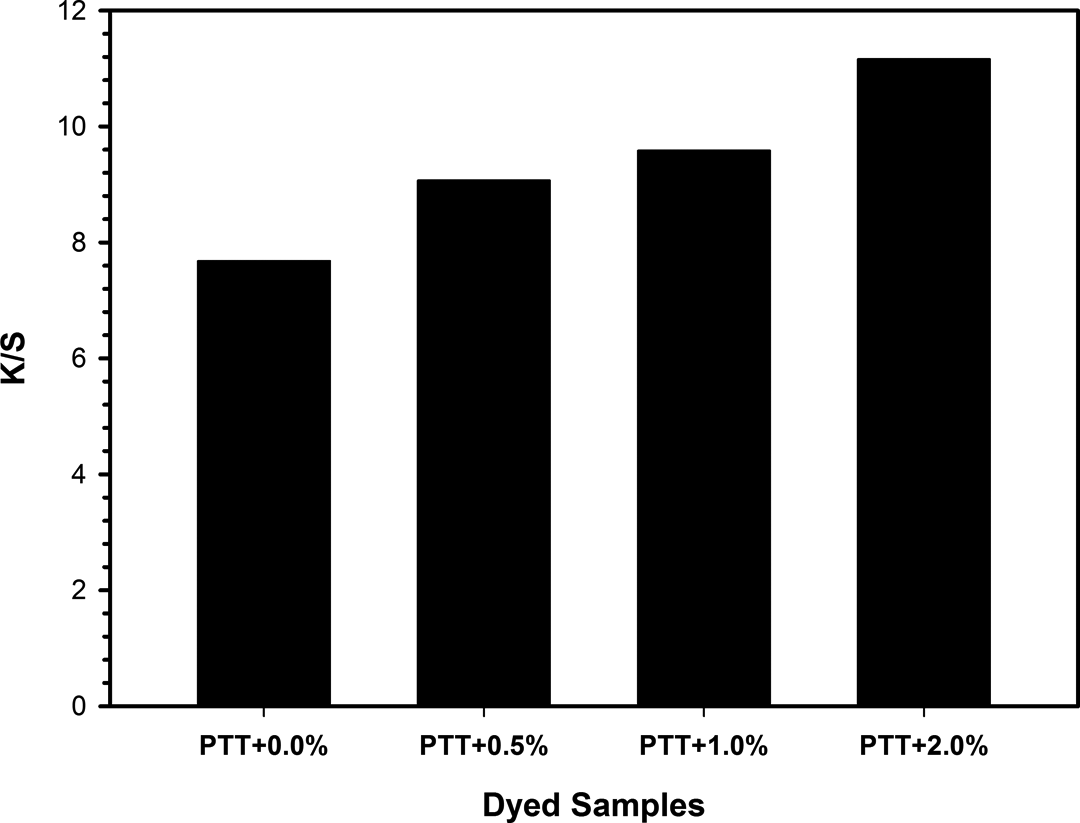
K/S values of neat PTT and PTT/30B-APS nanocomposites. PTT: poly(trimethylene terephthalate).
Conclusions
Neat PTT and its nanocomposites were synthesized in a two-step procedure: esterification and polycondensation. Cloisite 30B was modified with APS for improving its thermal stability and was homogenized in PTT matrix during polycondensation to prepare the nanocomposites. The APS enhanced the thermal stability of the Cloisite 30B and had an important role in opening the Cloisite 30B galleries. XRD patterns of nanocomposites showed no distinct peak at range of 2θ = 2.97–4.07. However, two peaks were observed for 30B-APS XRD pattern, confirming the good organoclay dispersion in PTT matrix. DSC data showed that the degree of crystallinity did not change notably by increasing the amount of clay, but the overall crystallization rate increased and crystallization peak became narrower, which were described as formation of smaller and more uniform crystals. Thermal stability and degradation of samples which were analyzed by TGA showed that increasing the organoclay content enhanced initial and maximum degradation temperatures. Dyeability test showed that addition of 30B-APS up to 2 wt% to PTT improves dyeability for 32%.
Footnotes
Funding
This research received no specific grant from any funding agency in the public, commercial, or not-for-profit sectors.