
Abstract
In this study, highly oriented self-reinforced wood–polymer composite (WPC) rods were produced by stable and continuous solid-state extrusion through a conical die. Polypropylene, softwood flour and inorganic filler were used at 50%, 40% and 10% weight concentration, respectively. The properties and morphology of the samples were studied by differential scanning calorimetry analyses, scanning electron microscopy observation and mechanics performance testing. Compared to a conventional extruded rod, the self-reinforced WPC rod profile exhibited a fibrillar structure largely parallel to the direction of extrusion, which contributed to the significantly high strength and modulus of the product as well as improved thermal properties and good dimensional stability. With the increase in draw ratio, the melting peak moved to high temperature, modulus (from 2200 to 5800 MPa) and strength (from 20.7 to 81.6 MPa) were greatly increased.
Introduction
The nomenclature “wood–polymer composite” (WPC) is usually used to designate materials made of natural fibers or flours and one kind of polymer or a mixture of polymers. In the past 20 years, WPC has become a state-of-the-art commercial product with a growing market potential in the field of building, construction and furniture, due to the wide spectrum of advantages they offer, such as green, recyclability, fungus resistant, reduced equipment wear and good processability. 1 –4 As a consequence, the price to performance ratio of WPC is particularly favorable. However, WPC has a number of disadvantages as well, for example, the modulus and strength are usually insufficient for structural applications. In order to meet the requirements of materials with high strength and modulus, self-reinforcement technology aimed at exploiting their own potential properties of materials is becoming an important research subject.
The term self-reinforcement refers to using of special forming method (physical method) to control polymer morphology. 5,6 The mechanical strength and modulus of the self-reinforced materials significantly increased as the result of specific measures taken to make the microstructure of the polymer transform into oriented reinforcement elements (like groups of oriented polymer chains forming morphological structures such as microfibrils, macrofibrils, fibers, extended chain crystals or shish-kebab crystals, and so on 7 ). In order to prevent the relaxation of the molecular orientation from the stretched chain configuration, the molecules must be rapidly crystallized. 8 Compared with the additive-based reinforcement, self-reinforced materials displayed much more superior performance on specific strength, specific stiffness, dimensional stability and more easy to recycle.
Self-reinforcement of the materials can be achieved by special processing techniques, such as solid-state extrusion, die drawing, rolling and so on.
9
–11
Successful processing can only take place in a narrow temperature range within the solid state because the temperature is connected with chain mobility. It is usually maintained below the melting temperature but above the glass transition temperature of the polymer, as too high temperature results in deformation without orientation while too low temperature shows is no chain mobility.
12
A number of studies have been conducted to understand the self-reinforcement of polymers, and most of these studies have been focused on pure polymer. Coates and Ward
13
demonstrated that die drawing was a controllable process for the production of very high stiffness polypropylene (PP) rods and found that the increase in axial Young’s modulus with draw ratio was very similar to that observed in fiber drawing and hydrostatic extrusion of PP homopolymer. Hope et al.
14
reported the hydrostatic extrusion behavior of two grades of polymethylmethacrylate, their research showed that frictional effects were particularly important in determining, both the process instabilities (stick slip) and the steady state process behavior. Weiler and Gogolewski
15
investigated the use of the solid-state extrusion technique for poly(
In this study, self-reinforcement of WPC rods were carried out by the method of stable and continuous solid-state extrusion combined with pushing and pulling together through a conical die, which was the actual extrusion. The thermal properties of the self-reinforced WPC samples were studied by differential scanning calorimetry (DSC) and the morphology was observed by scanning electron microscopy (SEM). Besides, mechanics performance testing was also employed to determine the mechanical properties.
Experimental
Materials
The PP (Pro-Fax PF 814) was virgin material with a melt index of 2.4 g/10 min and the density of 0.902 g/cm3 purchased from Basell Canada (Corunna, Ontario, Canada). The wood flour used was softwood (poplar) grade 6080 supplied by HC Wooden Co., Ltd (Zhejiang, China). The moisture content and the size of the wood flour were 8% and 180–250 μ. The wood flour was dried in a vacuum oven at 103 ± 2°C for 24 h to remove the moisture before processing. Cenosphere (grade HG325) with a bulk density of 1.5 g/cm3 was used as inorganic filler and purchased from Huijingya New Material Co., Ltd (Shanghai, China). All experiments were carried out using 50 wt% PP, 40 wt% wood flour and 10 wt% inorganic filler.
Composite preparation
The PP, wood flour and inorganic filler were mixed in a high speed mixer for 5 min. Then, the compounded materials were melt blended using corotating twin-screw extruder ( Kunshan Kesun Rubber & Plastic Machinery Co., Ltd. Jiangsu, China). The temperature profile along the extruder barrel was 170, 180, 200, 190 and 180°C (from feed zone to die) and the screw rotation speed was 180 r/min. The extrudate was then cooled in air and granulated. The melt blending process was repeated twice with the same processing parameters in order to obtain good dispersion of the wood flour.
Solid-state extrusion
The solid-state extrusion of the material was produced using the single-screw extrusion line. The diameter of the screw was 45 mm and the ratio of length to diameter was 25. Figure 1 illustrates the principle of self-reinforced WPC processing system. The hual off was used to pull the material throughout the die, and the pulling speed was fixed in the range of 15–60 mm/min. It should be pointed out that the pulling process for this study was carried out at appropriate speed in order to match the extrusion speed of the screw. If the pulling speed was too fast, the rods would rupture, otherwise, the material would accumulate at the exit of the die. The exchangeable conical dies with an entrance bore diameter (d 0) of 20 mm and semi-angle (α) of 10° were designed throughout the investigation to achieve different draw ratio for self-reinforced WPC rods. The self-reinforced rods using different conical die at draw ratios of 1 (isotropic), 3, 5, 6 and 8 were investigated. The photograph of the produced WPC rods with different draw ratio is shown in Figure 2.
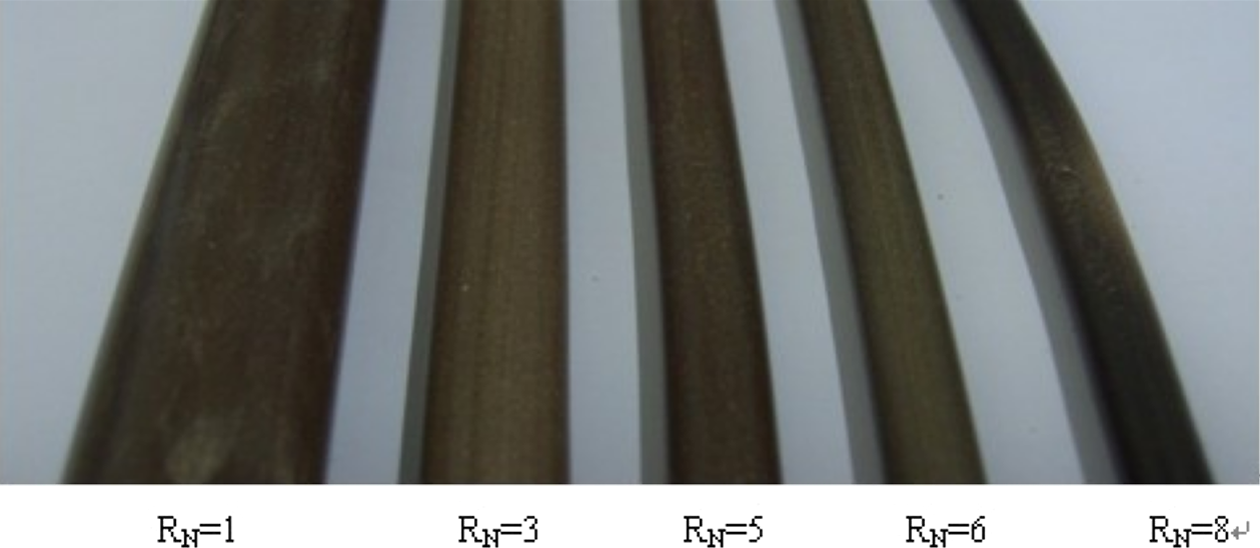
Photograph of the WPC rods produced with different draw ratio by solid-state extrusion. WPC: wood–polymer composite.
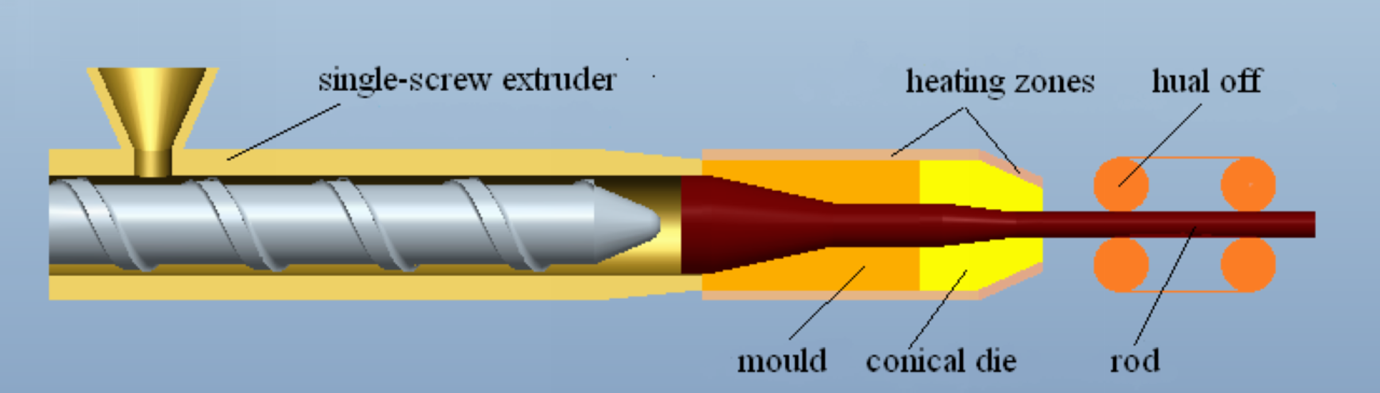
Schematic representation of the solid-state extrusion for self-reinforced WPC. WPC: wood–polymer composite.
The draw ratio of the sample was determined by the following two ways (Figure 3). For a given die, the nominal draw ratio (R
N) was measured as: Main process variables in solid-state extrusion.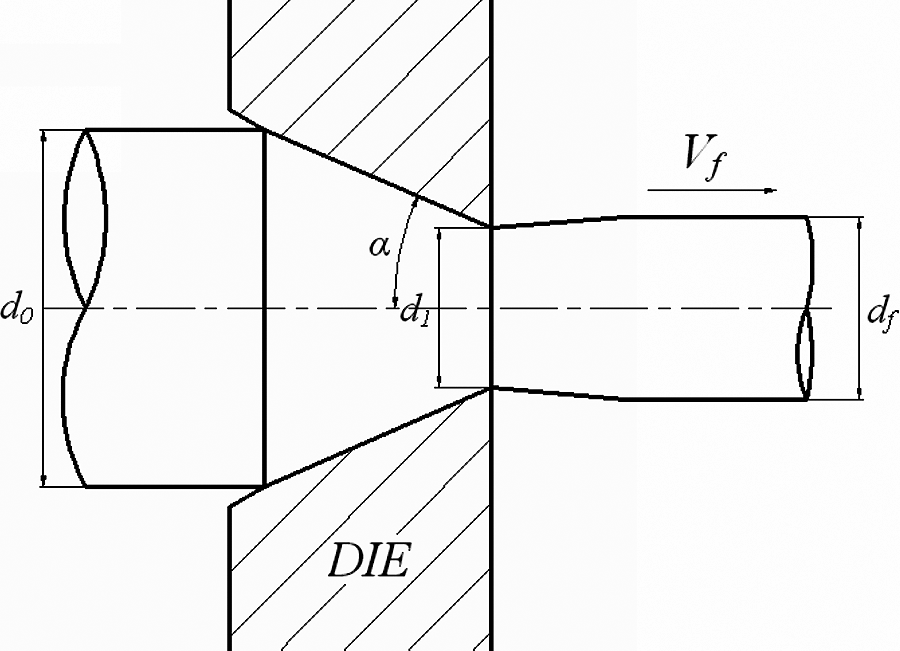

where d
0 was the billet diameter and d
1 was the die exit diameter. However, since the product was expected to be of bigger diameter than the die exit bore, the actual draw ratio (R
A) was measured as:

where d f was the diameter of the final product.
Considering that the variation on expansion ratio of the sample after extrusion was much smaller than die exit diameter, which could be ignored, the draw ratio could also be approximately calculated by equation (1).
Thermal analysis
DSC measurements were performed using a Perkin-Elmer Pyris I differential scanning calorimeter. The samples of 0.5 mm thickness were cut from the extruded rods perpendicular to the extrusion direction. Then the samples were heated in the range from 30 to 200°C with the heating rate of 10°C/min under a nitrogen atmosphere. The fusion heat of the samples was evaluated from the melting endotherms and the degree of crystallinity X
c was calculated by the following equation:
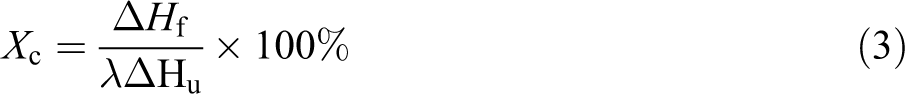
where ΔH f is the measured fusion heat of the sample, λ is the mass fraction of the matrix polymer in the system and ΔH u = 209 J/g, corresponding to the melting enthalpy of 100% crystalline PP. 21
Morphology examination
SEM was used to provide information on the damage in the oriented material. Each sample for SEM was dipped in liquid nitrogen to avoid damage to the surface morphology and then fractured along the axial direction. The broken surfaces of the samples were coated with gold–platinum alloy prior to examination using an Emscope (Ashford, Kent, Great Britain) SC500 SEM coating unit. The SEM micrographs were examined with a Hitachi (Schaumburg, IL) 510 SEM. The instrument was operated at 20 kV.
Density measurements
The density of the WPC samples
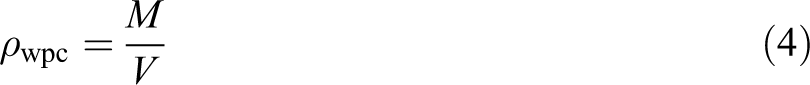
where M is the weight of the sample, V is its volume.
Tensile and flexural testing
The flexural modulus and strength of the rods were measured in a three-point flexural test at a speed of 10 mm/min in accordance with ASTMD790. The span/diameter ratio (L/D) of all the materials to be tested was 16. The tensile properties of the samples were performed using Instron tensile testing machine with a load cell of 10 kN and the length of the cylindrical samples was kept constant at 50 mm. To reduce the slippage, they were gripped by sand papers. Prior to the tensile and flexural testing, the specimens were conditioned for 48 h at ambient conditions of 23 ± 2°C and relative humidity of 50 ± 5%. For each draw ratio, at least five samples were tested to obtain an average value.
Results and discussions
Thermal properties
Thermal properties of both the commonly and self-reinforced extruded rods were examined using DSC. Figure 4 compared the melting endotherms of both common and self-reinforced samples. It can be seen that the common extruded WPC rod with R N = 1 had a wide and rather low melting peak shape and the melting peak temperature was 163.2°C. At a draw ratio of 3, the melting peak moved to higher temperature of 165.4°C. With a further increase in draw ratio, the melting peak became not only narrower but higher and the melting peak temperature also increased, which reached 169.5°C at a draw ratio of 8. This indicated that the structure of the self-reinforced rods was more uniform and highly regular.
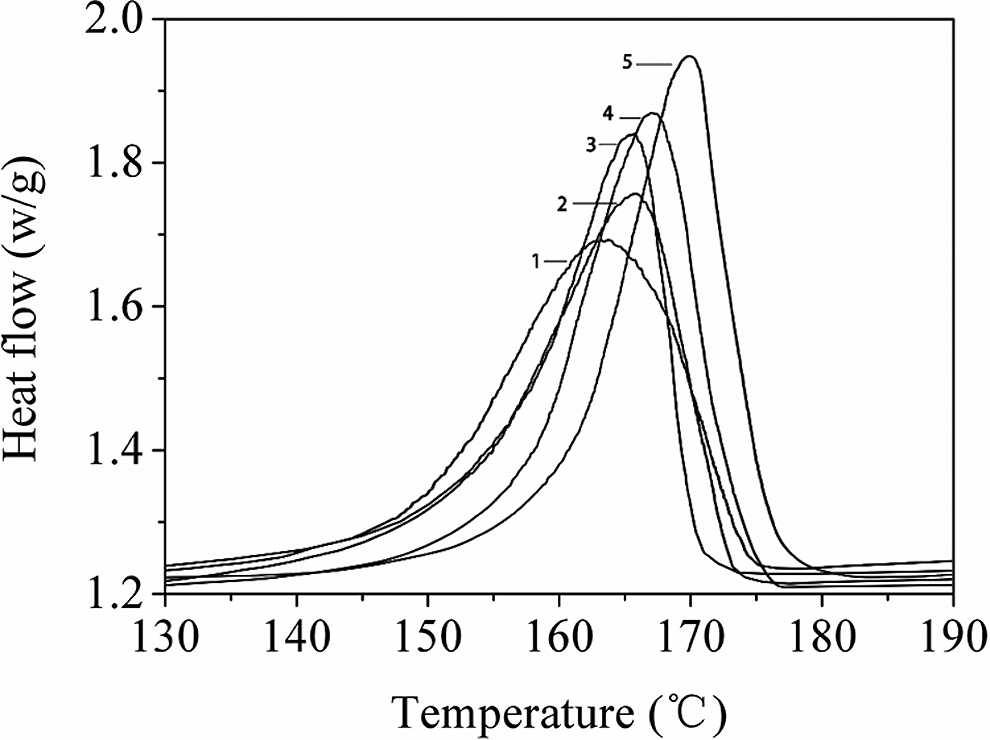
DSC endotherms of WPC (1: R N = 1; 2: R N = 3; 3: R N = 5; 4: R N = 6 and 5: R N = 8). DSC: differential scanning calorimetry; WPC: wood–polymer composite; R N: nominal draw ratio.
Crystallinity was another significant point that can be calculated from the heat of fusion from the DSC endotherms. The variation in crystallinity with different draw ratios for WPC rods is shown in Table 1. It can be seen from the table that the crystallinity of the samples increased obviously with increasing draw ratio importantly, the variation in crystallinity for commonly extruded and self-reinforced WPC rods clearly exemplified the higher structural arrangement in the self-reinforced rod with increasing draw ratio.
The variation in crystallinity with different draw ratios for WPC rods.
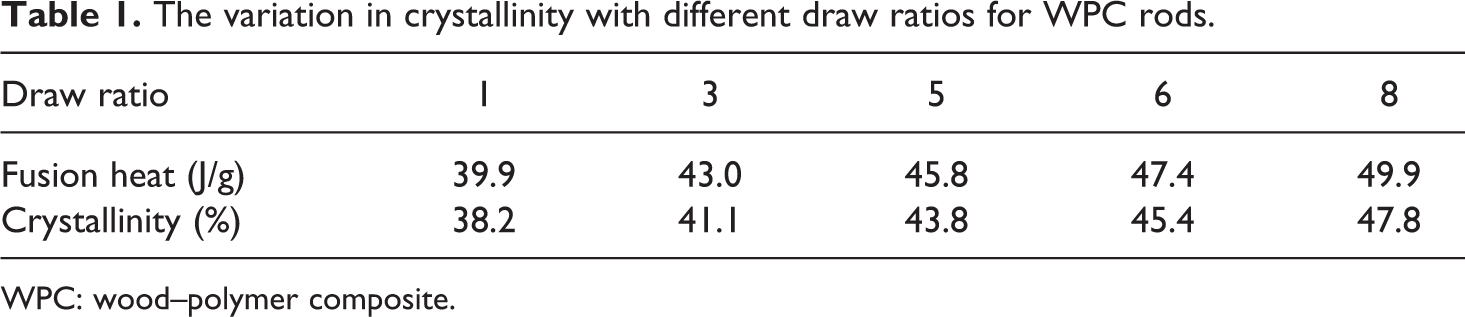
WPC: wood–polymer composite.
Morphology
The section morphology of both the common and self-reinforced WPC rods can be carried out via SEM. Figure 5 illustrates the morphology of cracked surface in the inner layer of WPC rods extruded at different draw ratios. Compared with the conventionally extruded samples (R N = 1), it can be clearly seen that the sections of self-reinforced WPC rods exhibited orderly arranged fibrillar bundle structure, which were oriented straight along the extrusion direction. The specimen with the draw ratio of 3 demonstrated larger dimension and scattered fibrillar bundle whose fibrous structure was the least evident. Moreover, it was obvious that the fibrillation of the self-reinforced WPC increased with the increase in the draw ratio. This fact indicated that fibrils were mainly composed of highly oriented molecular chains, which were favorable for the improvement in strength and modulus parallel to the direction of extrusion.
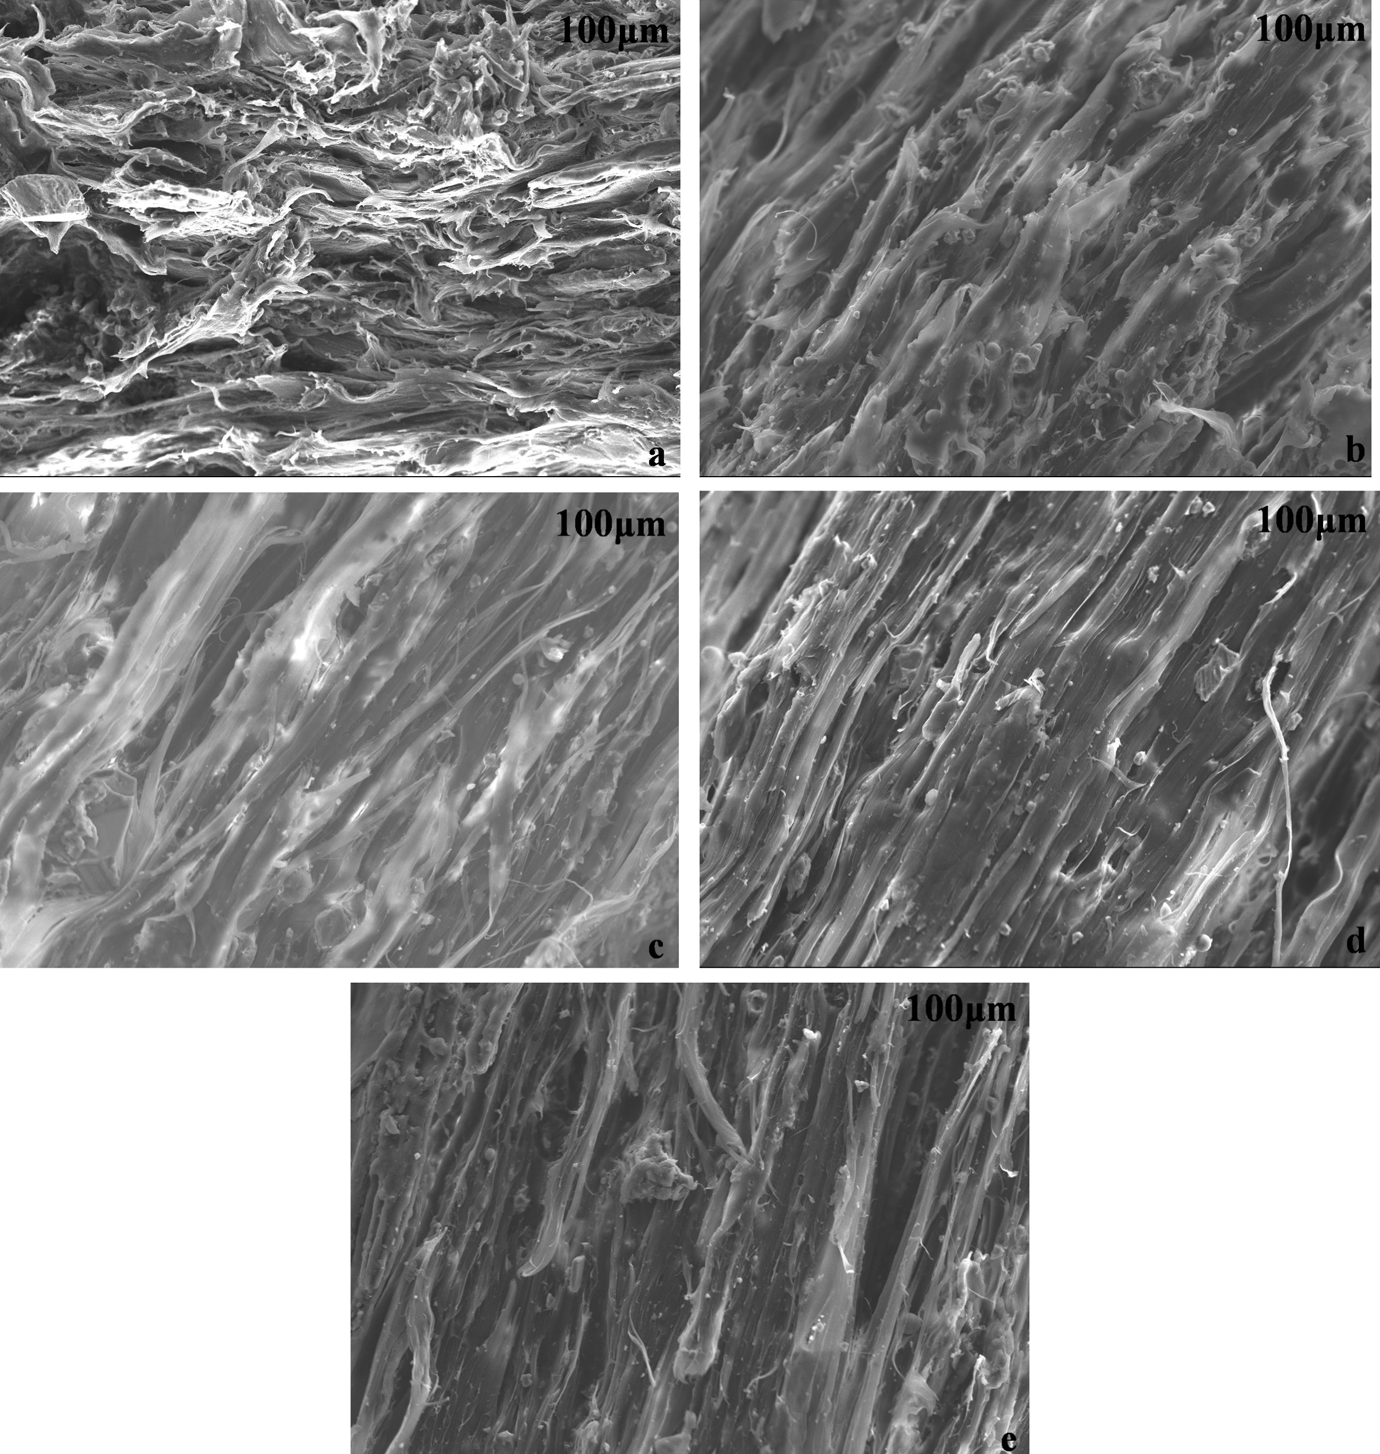
Morphological transformation of the WPC with R N at 500x: (a) R N = 1, (b) R N = 3, (c) R N = 5, (d) R N = 6 and (e) R N = 8. WPC: wood–polymer composite; R N: nominal draw ratio.
For clearly observing the section morphology, high magnified images are shown in Figure 6. It can be clearly seen that microfibril and microvoid were formed in the process of solid state extrusion with a high draw ratio and the higher the draw ratio was, the more obvious the phenomenon was, which is consistent with the researches by Zhao and Ye. 22
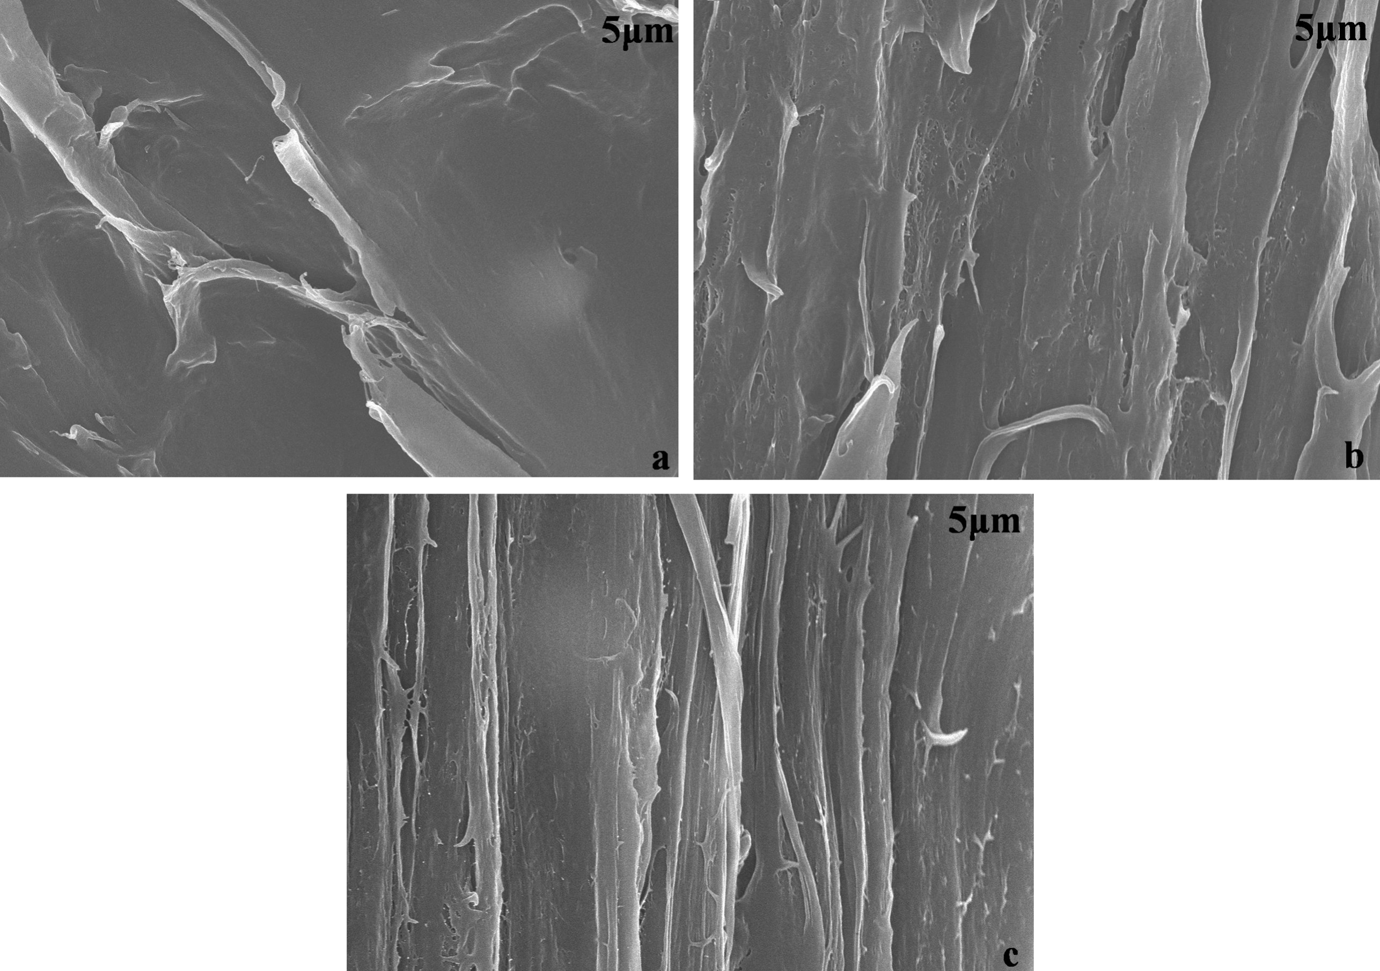
SEM micrographs of the WPC with R N at 10k-x: (a) R N = 1, (b) R N = 3 and (c) R N = 8. SEM: scanning electron microscope; WPC: wood–polymer composite; R N: nominal draw ratio.
Mechanical properties
The density of the pure PP and self-reinforced WPC samples with different draw ratio are presented in Table 2. It can be seen from Table 2 that when the draw ratio increased from 1 to 3, the density of pure PP increased while the density of self-reinforced WPC sample decreased. For pure PP, the crystallinity increased by solid-state extrusion resulting in high density. However, voids were generated between the PP matrix and wood flour due to the lack of interface compatibility during solid-state extrusion, which resulted in low density. It also can be seen from Table 2 that with further increasing draw ratio, the density of WPC samples increased. The reason can be explained that the arrangement between the microfibrils got more closely and the microvoids became much smaller with higher draw ratio and pressure, which resulted in high density.
Densities of isotropic and self-reinforced samples of pure PP and WPC.
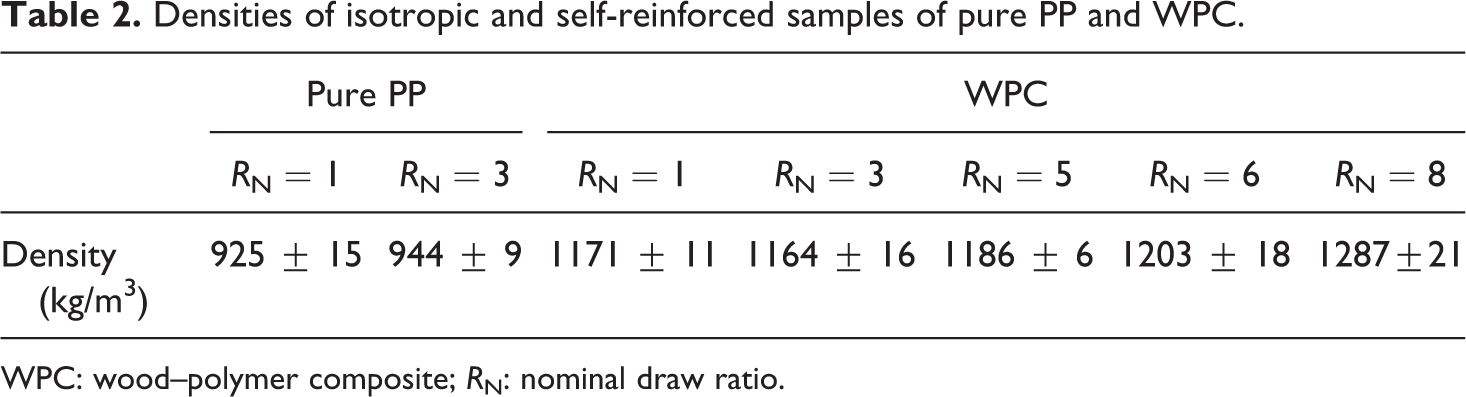
WPC: wood–polymer composite; R N: nominal draw ratio.
The most important purpose of our efforts is to increase the mechanical properties of the extruded materials using the solid-state extrusion technology. The mechanical properties of materials essentially depend on their supermolecular structure. 17 Figure 7 shows the effect of draw ratio on the tensile strength and modulus of isotropic (R N = 1) and self-reinforced WPC samples measured parallel to the longitudinal direction. It can be clearly seen from Figure 7 that the tensile strength and modulus both increased with the increase in the draw ratio, which got to 81.6 MPa and 2200 MPa, respectively, at a draw ratio of 8. Comparing with the values, it can be calculated that the tensile strength of the self-reinforced WPC composites was four times as high as that of commonly extruded samples, and the tensile modulus was 2-fold higher than that of the common extrudate as well.
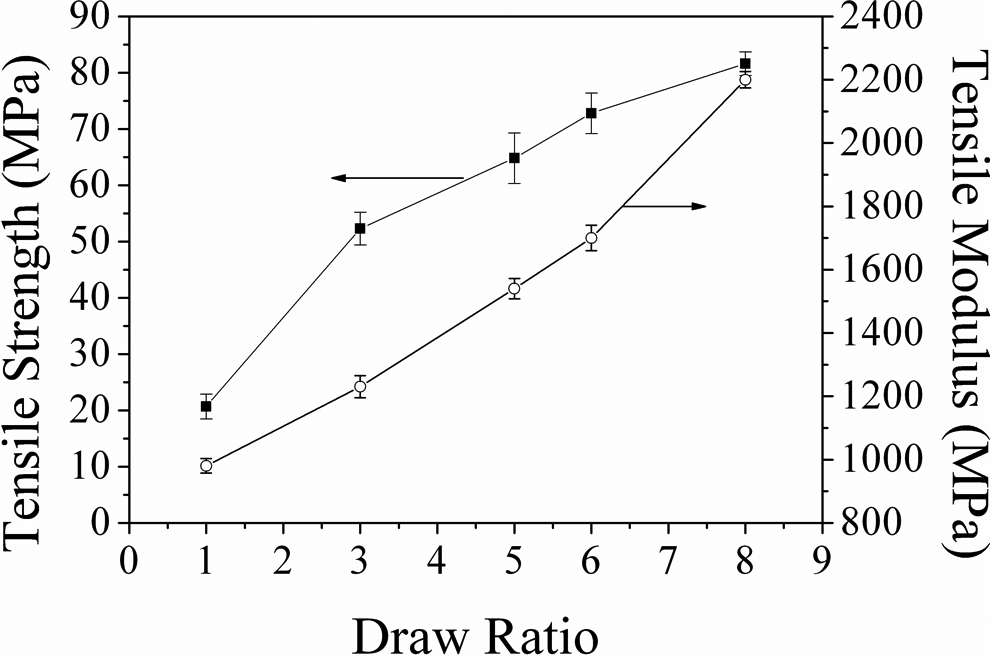
The effect of draw ratio on the tensile strength and modulus for solid-state extrusion.
The effect of draw ratio on the flexural strength and modulus is shown in Figure 8. It can be found from Figure 8 that the flexural strength and modulus of WPC samples after self-reinforced both increased with high R N, which is similar to the trend observed from tensile properties. At a draw ratio of 8, the value of flexural strength was 76.4 MPa, which was three times as high as that of commonly extruded samples. Similarly, the flexural modulus of WPC samples at draw ratio of 8 reached 5800 MPa which was approximately 2.4-fold higher than that of isotropic rods (R N = 1). The increasing flexural strength and modulus was attributed to the oriented molecular chains and the enhanced crystallinity after self-reinforced. Thus, it can be concluded that self-reinforcement is an effective method to improve the mechanical properties of WPC.
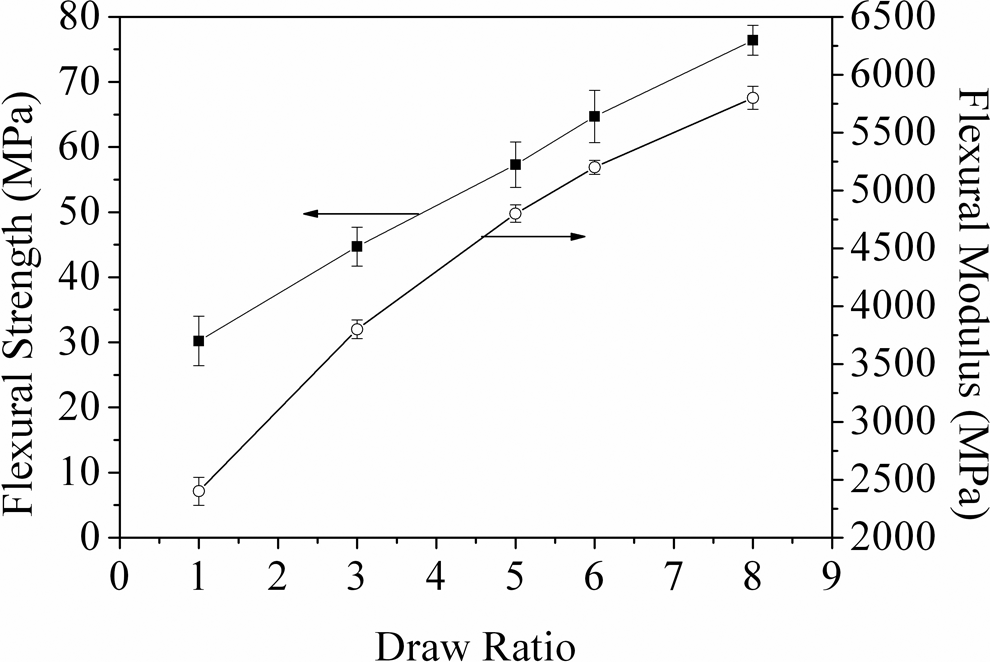
The effect of draw ratio on the flexural strength and modulus for solid-state extrusion.
The effect of draw ratio on the tensile elongation at break and flexural elongation at break is shown in Figure 9. Increasing draw ratio led to a large decrease in elongation at break, indicating that the rigidity of the sample improved greatly by self-reinforcement. It can be clearly found that the tensile elongation at break of the commonly extruded specimens exceeded 56.7%. At draw ratio of 8, there was about 50% decrease in tensile elongation at break. Meanwhile, the flexural elongation at break dramatically decreased from 12.2% to 5.8%. These decreases in elongation at break can be attributed to the crystallinity of the molecule. The modulus of the crystal was so big that deformation or elongation cannot happen in the crystalline region but occurred in the amorphous region. It can be concluded that, with the increase in draw ratio, the crystallinity increased, the proportion of the amorphous region of WPC reduced, and the elongation at break decreased.
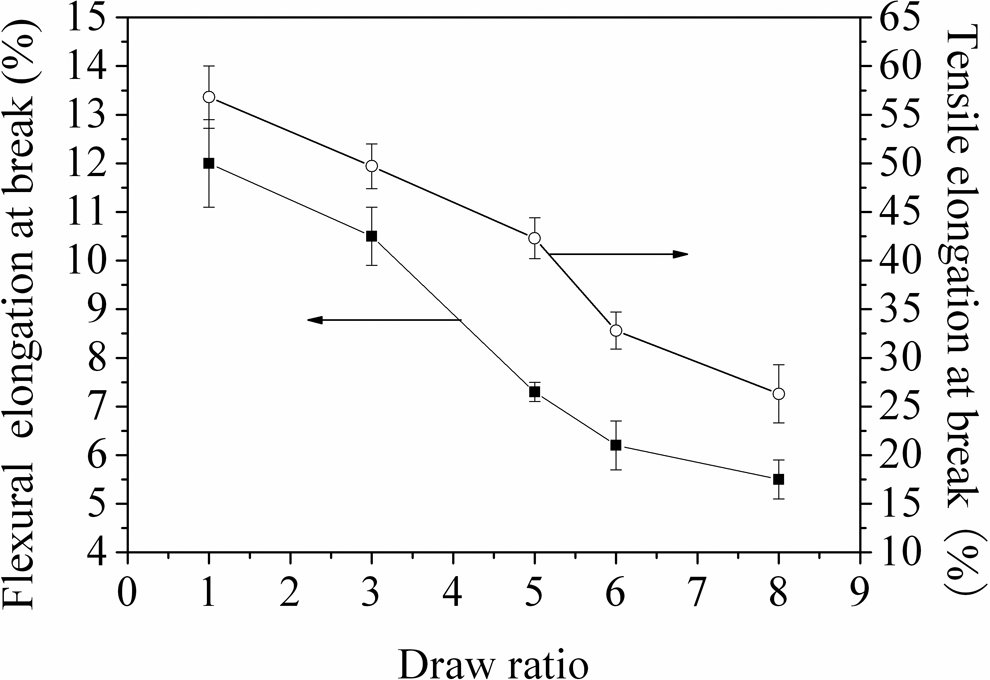
The effect of draw ratio on the elongation break for solid-state extrusion.
Conclusions
In this study, self-reinforced WPC rods with highly fibrillated and high mechanical properties were successfully prepared using the stable and continuous solid-state extrusion technique. The results of DSC analyses showed that the melting temperature and the crystallinity of the samples increased with the increase in draw ratio. SEM micrographs revealed that the structure of self-reinforced WPC rods consisted of microfibril throughout the profile, which extended straight along the extrusion direction. The density of the self-reinforced WPC samples increased as a result of the microfibrils arranged more closely when higher pressure was applied to the materials. Importantly, significant improvements in the tensile and flexural properties were observed for the self-reinforced WPC rods which were produced by the technique. The self-reinforced WPC rods with the draw ratio of 8 had tensile strength of 81.6 MPa, tensile modulus of 2200 MPa, flexural strength of 76.4 MPa and flexural modulus of 5800 MPa.
Footnotes
Funding
This research received no specific grant from any funding agency in the public, commercial, or not-for-profit sectors.