
Abstract
Addition of measured amounts of fillers into a polymer matrix is expected to improve the desired properties of the composites. Also the ease of processability of the matrix and reinforcement is always desired. Use of powder fillers in the polymer matrix at ambient conditions would make the processing much easier. This will help in in situ applications. In the present work, polymer–matrix composites are prepared with polystyrene as the matrix using metal (copper/aluminum/steel) and ceramic (alumina) fillers at ambient conditions. The composites with metallic and ceramic fillers in the ratio of 50:25:25 wt% (polymer:filler 1:filler 2) designated as three-phase composites were investigated for tribological applications. Both copper and aluminum fillers were considered for comparison in terms of their contribution to tribological behavior because of their thermal conductivity, specific heat and density.
Polystyrene is filled with metal powder (copper, aluminum or steel) and alumina in equal proportion and subjected to wear and friction tests. The polymer steel–ceramic composite has the least with the other two composites having almost the same values of friction coefficient. The polymer aluminum–ceramic composite has the least wear at all operating conditions. Polymer aluminum–ceramic composite was found to have better wear behavior among the three-phase composites. This may be attributed to the favorable value of density of aluminum, moderate thermal conductivity and excellent specific heat.
Introduction
In engineering and material science, composites are more narrowly defined as physical mixtures of chemically different materials that are insoluble in each other and are thus present as distinct phases: usually a continuous phase (matrix) and a discontinuous phase. In engineering practice, materials of desired properties for a specific application can be obtained through tailored composite materials. With proper selection of matrix and constituents, the composite can be designed to sustain the load as well as to possess antiwear properties. Also it would be convenient if the composite can be processed in situ at ambient conditions. For this particulate, reinforced polymer composites have been found suitable.
Larsen et al. 1 have investigated changes in the tribological properties of epoxy by incorporating nano-copper oxide (CuO) and micro polytetrafluoroethylene (PTFE) particles. The PTFE content was fixed at 7.5% and the CuO varied between 0 and 10 vol%. Tests were conducted using a pin-on-disc tribometer under dry sliding conditions against smooth steel surfaces. Without PTFE, the coefficient of friction was generally independent of the nano-CuO content. With PTFE, the coefficient of friction was found to reduce in the CuO range of 0–0.4 vol% after which it increased. At higher CuO concentrations, the coefficient of friction-lowering effect of PTFE was found to decrease. The wear rate of epoxy with CuO increased wear relative to the neat epoxy, but with the addition of PTFE to epoxy with nano-CuO, the wear decreased up to 0.4%.
Sliding wear of PTFE and graphite-filled poly(phthalazinone ether sulfone ketone) have been studied by Zhang et al. 2 Addition of 5–25 wt% of PTFE and 5–30 wt% of graphite contribute to the reduction of coefficient of friction at room temperature. Increased filler quantity gradually reduced the wear rate.
Thermal degradation of polypropylene due to the addition of nano alpha alumina particles and dispersed into the polypropylene matrix has been studied by Mirjalili et al. 3 Thermogravimetric analysis was performed to measure the mass loss as a function of temperature. It was observed that increase in loading of the nanofillers increased the degradation temperature.
The tribological behavior of epoxy filled with ultra high-molecular-weight polyethylene (UHMWPE) functionally graded composites have been studied by Chand et al. 4 The epoxy was filled with 4 wt% of UHMWPE of 75 µm size by centrifuging. Multipass abrasive tests were conducted by running the samples on silicon carbide (SiC) sheets. The neat epoxy sample showed maximum length loss, whereas the UHMWPE-filled noncentrifuged sample exhibited reduced loss in length. The centrifuged samples showed about 1/11 times length loss. This was attributed to increased presence of UHMWPE particles near the surface with increased centrifugation time. Sliding wear data of centrifuged UHMWPE epoxy samples exhibited better wear performance.
Mechanical and tribological properties of multiwalled carbon nanotubes (MWCNTs) reinforced thermoplastic poly(p-oxybenzoate) composites were investigated by Cheng and Cheng. 5 Addition of MWCNTs have reduced the friction coefficient and wear and yielded best results at 2 wt% of MWCNT addition.
PTFE-based composites filled with various inorganic fillers have been studied by Zhang et al. 6 It is seen that, under the given conditions in this work, Carbon fibre (CF), Glass Fibre (GF), Potassium Titanate Whisker (PTW; K2Ti6O13) as the fillers slightly increase the friction coefficients; nickel, lead sulfide, copper sulfide, SiC and silicon nitride as the fillers increase the friction coefficient considerably; while the other fillers including copper, lead, lead tetroxide, cuprous oxide, lead oxide (PbO), molybdenum disulfide (MoS2), graphite, boron nitride and boron trioxide have almost no effect on the friction coefficients, if one takes into account the scattering of the friction and wear test data. Addition of the fillers has shown reduction in wear excepting PbO where the wear rates drastically increase.
Deleanu et al. 7 have studied the effect of bronze filler in PTFE matrix. The mass loss approach was used to estimate wear. PTFE concentrations at the worn surface were studied. Friction coefficient is not a significant parameter to choose between polymer and composite. It is also observed that the thermal field may be lowered with the addition of metal filler into a polymer matrix. This contributes to reduced junction temperature leading to increased wear.
Testing of polymer composites under abrasive and water-lubricated conditions has been reported by Prehn et al. 8 Epoxy filled with 10 vol% carbon fiber, 7 vol% graphite and varying volume percentage of SiC particulate with particle size variation was also considered. The samples were of cuboidal shape. Tests were done under both dry and water-lubricated conditions using the block on a ring configuration. The composite showed excellent wear behavior with the smaller particle size. Polyetheretherketone (PEEK) filled with 10 wt% and 30 wt% of carbon fiber was tested under water-lubricated conditions. The specific wear rate was higher in the case of demineralized water compared to tap water. Also with 30 wt% fiber the wear resistance was high.
Xue and Wang 9 have reported the wear behavior of PEEK composites filled with various kinds of SiC. Nanometer, micrometer and whisker SiC were used as fillers in PEEK. Samples were prepared by compression molding. Experimental results showed that addition of all these fillers reduced the friction of PEEK. Nanometer SiC (10 wt%) was found to be more effective in reducing the wear due to the formation of thin and uniform layer of transfer film. With the formation of uniform and tenacious transfer film, sliding occurred between the nanometer SiC-filled PEEK and the transfer film. This resulted in reduced friction coefficient and wear.
A study on the influence of PTFE content in PEEK-PTFE blends on mechanical and tribological properties has been reported by Bijwe et al. 10 Adhesive wear and low-amplitude oscillating wear tests were conducted. It was reported that inclusion of PTFE affected the adhesive wear and low-amplitude oscillating wear in a beneficial way. With an increase in the PTFE content, the coefficient of friction in both the wear modes (adhesive and low-amplitude oscillating wear) decreased but the trends in wear performance differed. In the adhesive wear, the specific wear rate showed a minimum of 7.5% PTFE inclusion followed by a slow increase for further addition of PTFE. In the case of low-amplitude oscillating wear test, the wear rate continuously decreased for the selected compositions. The 30% PTFE blend showed excellent combinations of coefficient of friction and wear rate and limiting pressure–velocity (PV) values. However, increase in tribological properties was at the expense of deterioration of mechanical and abrasive properties.
Investigations of a hybrid composite have been undertaken by Kishore et al., 11 and these authors studied the effect of E-glass fabric and additives on the behavior of epoxy. The additives used were hydroxyl-terminated liquid butadiene-acrylonitrile rubber (3 wt%) and varying wt% of graphite powder. Hand lay up procedure was adopted to lay the E-glass fiber. The samples were of 6 mm × 6 mm × 3 mm in size. Tests were done using a pin-on-disc tribometer. The sliding distance was 5 km. The graphite composite exhibited less wear than the other, and it further reduced with increased filler content. The glass–epoxy composite recorded lower coefficient of friction for all combinations of load and velocity.
Palabiyik and Bahadur 12 conducted tribological studies on polyamide 6 (PA) and high-density polyethylene (HDPE) blends filled with PTFE, CuO and reinforced with glass fibers. With increased PTFE, the friction coefficient of the blends (80 wt% PA and 20 wt% HDPE) decreased. There was a large reduction in wear with the addition of PTFE to the blend. When CuO was added, the friction coefficient increased but the wear loss reduced. With the addition of 10 wt% of glass fiber to 80 wt% PA and 20 wt% HDPE, the wear was found to reduce. The changes in the friction coefficient with the addition of glass fiber were insignificant. At 10 wt% of glass fiber, the wear rate was minimum. With 15 wt% glass fiber reinforcement, the transient wear state became longer and the steady state wear rate increased.
The effect of counterpart material, internal lubricant and fiber reinforcement on the wear behavior of epoxy compounds is reported by Jacobs et al. 13 The resin and the matrix were mixed in the ratio of 4:1 by weight. The lubricant and fibers were added to the resin and mixed to get homogeneity with the mixture being cured in an oven. The lubricants used were PTFE, MoS2 and tin sulfide with the reinforcing agents of glass and carbon fibers. Different composites were worn against hardened steel, austenitic steel and alumina. The tests were done using ball on prism test system. Glass and carbon fiber reinforcement had no wear reducing effect under dry conditions. The internal lubricants did not improve the wear resistance under dry conditions excepting PTFE. This was due to the transfer film formed on the disc. The hardened steel produced a higher wear than austenitic and alumina counterparts. This was attributed to grooves (break in the wear curves) caused on the counter face disc after several hundred meters of sliding. The transition was accompanied by the production of rust powder. Under wet conditions, the wear of PTFE increased again. The results were found to be optimum for carbon fibers but only against alumina.
Addition of hard particles and fibers in epoxy matrix are expected to decrease the wear. Basavarajappa et al. 14 have studied the effect of glass fabric and secondary fillers such as SiC and graphite in epoxy matrix. Increase in SiC decreased wear. Wear tests (dry) were done using a pin-on-disc tribometer. It is observed that with increase in applied load and sliding distance the wear increases because of increased friction.
Chang et al. 15 have investigated the tribological properties of high-temperature-resistant PEEK and polyetherimide polymers filled with short carbon fiber (SCF), graphite flakes and submicron-sized TiO2 and ZnS under dry sliding conditions. Pin-on-disc tribometer was employed for the test. Tests were conducted at room temperature and elevated temperatures. Addition of filler greatly enhanced the wear resistance. At a given PV condition, the friction coefficient of neat PEEK was found to be more than SCF and graphite-filled PEEK. The temperature of the disc and wear rates decreased. Particulate addition into the same composite (SCF + graphite + TiO2) reduced the friction coefficients, increased the temperature of the disc slightly but wear rates increased. At elevated temperatures, the friction coefficient of particulate filled composite reduced substantially. The specific wear rates increased at the lower elevated temperature and decreased at higher elevated temperature.
Gopalakrishna et al. 16 have carried out tribological tests on microparticle-filled polystyrene composites under different load and speed operating conditions. Steel, alumina (ceramic) and a combination of both have been filled into polystyrene with a ratio of 50:50 wt% of polymer and filler. The three-phase composite has 50 wt% of polymer and 25 wt% each of the metal and ceramic powders. The steel powder is expected to influence the wear behavior due to its thermal conductivity, whereas the ceramic, being a poor conductor, will also influence the wear behavior. It has been inferred that the wear rate increases with the addition of metal powder and reduces with the addition of ceramic powder. The three-phase composite has wear rate less than polymer steel composite and more than the polymer ceramic composite. It has been hypothecated that increased thermal conductivity of the composite due to the addition of metal powder would increase the temperature along the pin axis resulting in softening of the pin leading to increased wear.
Basavaraj et al. 17 have investigated wear behavior of PTFE filler in nylon66/graphite composites. It was observed that the wear resistance increased with more addition of filler.
In summary, the addition of metal, metal oxide and ceramic fillers contributes to reduction in wear of the composite 1,2,4,6,7,9 –17 Friction coefficient was found to increase with the addition of fillers except filler lubricants and MWCNT. 1,2,5 Reduction in size is likely to reduce the wear rate. 8 Increased percentage of addition of alumina decreases the degradation of the composite. 3 Use is made of pin-on-disc tribometer for tribological testing. Though there are many reports on the tribological study of polymer composites with metal/fiber fillers, the effect of thermal conductivity, specific heat on the wear behavior polystyrene composites is not reported. The present investigation reports tribological behavior of polystyrene composites with metal and ceramic fillers to study the effect of thermal conductivity and specific heat of the filler/composite on wear.
Experimental
Materials
The monomer styrene ((
Composites with their volume fraction and density.
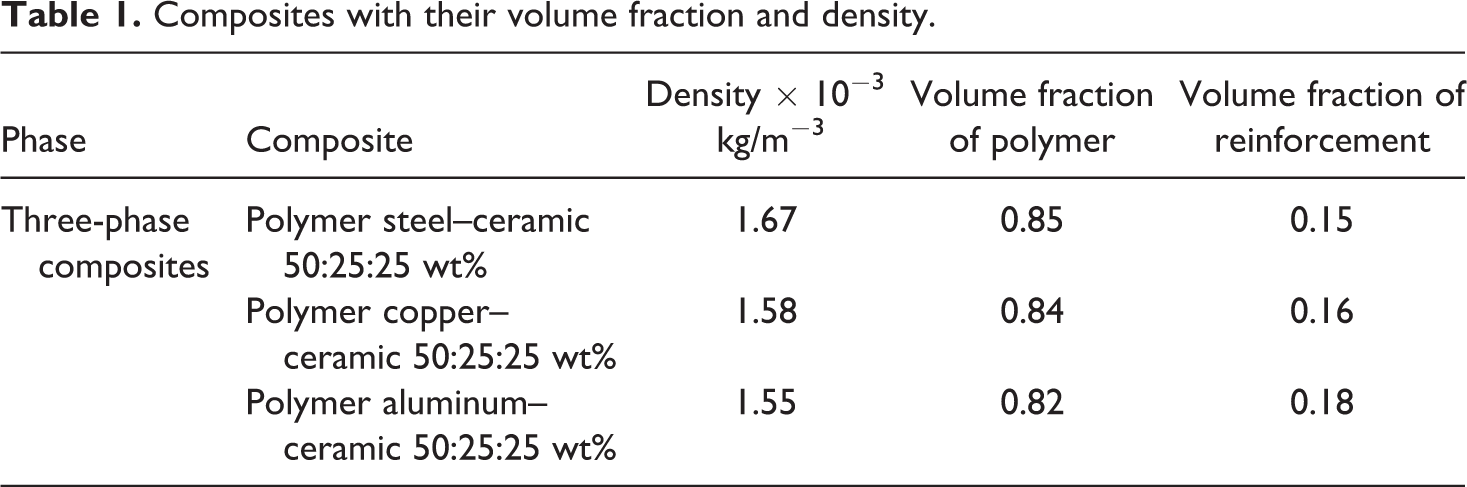
The metal powders, copper, aluminum and steel have thermal conductivity in the descending order of magnitude with the ceramic powder having the lowest value of thermal conductivity among all test materials. The study of effect of the replacement of the metal reinforcement by ceramic powder in the polymer matrix from 0 wt% to 50 wt% was undertaken to understand the heat transfer behavior of the composite. This is of immense value for use in real-time applications of the composite working under dynamic conditions. The effect of thermal conductivity and specific heat of the powders on the tribological behavior of all the composites is presented herewith. The composites have 50 wt% of polymer and 25 wt% of metal powder and 25 wt% of ceramic powder (50:25:25). For the 50:25:25 wt% of composites tested, the filler was divided evenly between the metal and ceramic powders.
The tribological properties of the composites were studied using the pin-on-disc tribometer. Friction and wear tests were conducted at three normal loads of 30, 40 and 50 N. Tests were performed at sliding velocities of 0.5–1.5 m/s in intervals of 0.25 m/s under ambient temperature. The pins (25 mm length, 6 mm diameter) were initially run in to ensure increased contact between pin and disc. All the tests were conducted under dry conditions. The tests were run up to a sliding distance of 2 km. Each data was determined from an average of five tests. The error bar was found by marking one standard deviation on either sides of the average.
The temperature at distances of 0.5, 2, 3, 5 and 6 mm along the axis of the composite pins from pin-disc interface were measured by inserting K-type thermocouples by making holes of 1 mm diameter along and up to the axis. These data were used for the analysis of wear and friction behavior. Track width was measured to find the normal pressure for evaluating energy consumption. The specific wear (w
0) (equation (1)) and energy (equation (2)) were estimated from the following: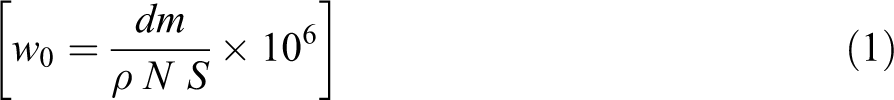
where 
A scanning electron microscope (Cambridge Instruments, Cambridge, UK) was employed to observe the worn out surface to assess the type of wear and a profilometer (Rank Taylor Hobson Leicestershire, UK) was used to determine the surface roughness of the worn sample surfaces.
Results
Frictional behavior
The frictional behavior of three composites as a function of load and sliding velocities at ambient temperature and different loads are as shown in Figure 1(a) to (c).
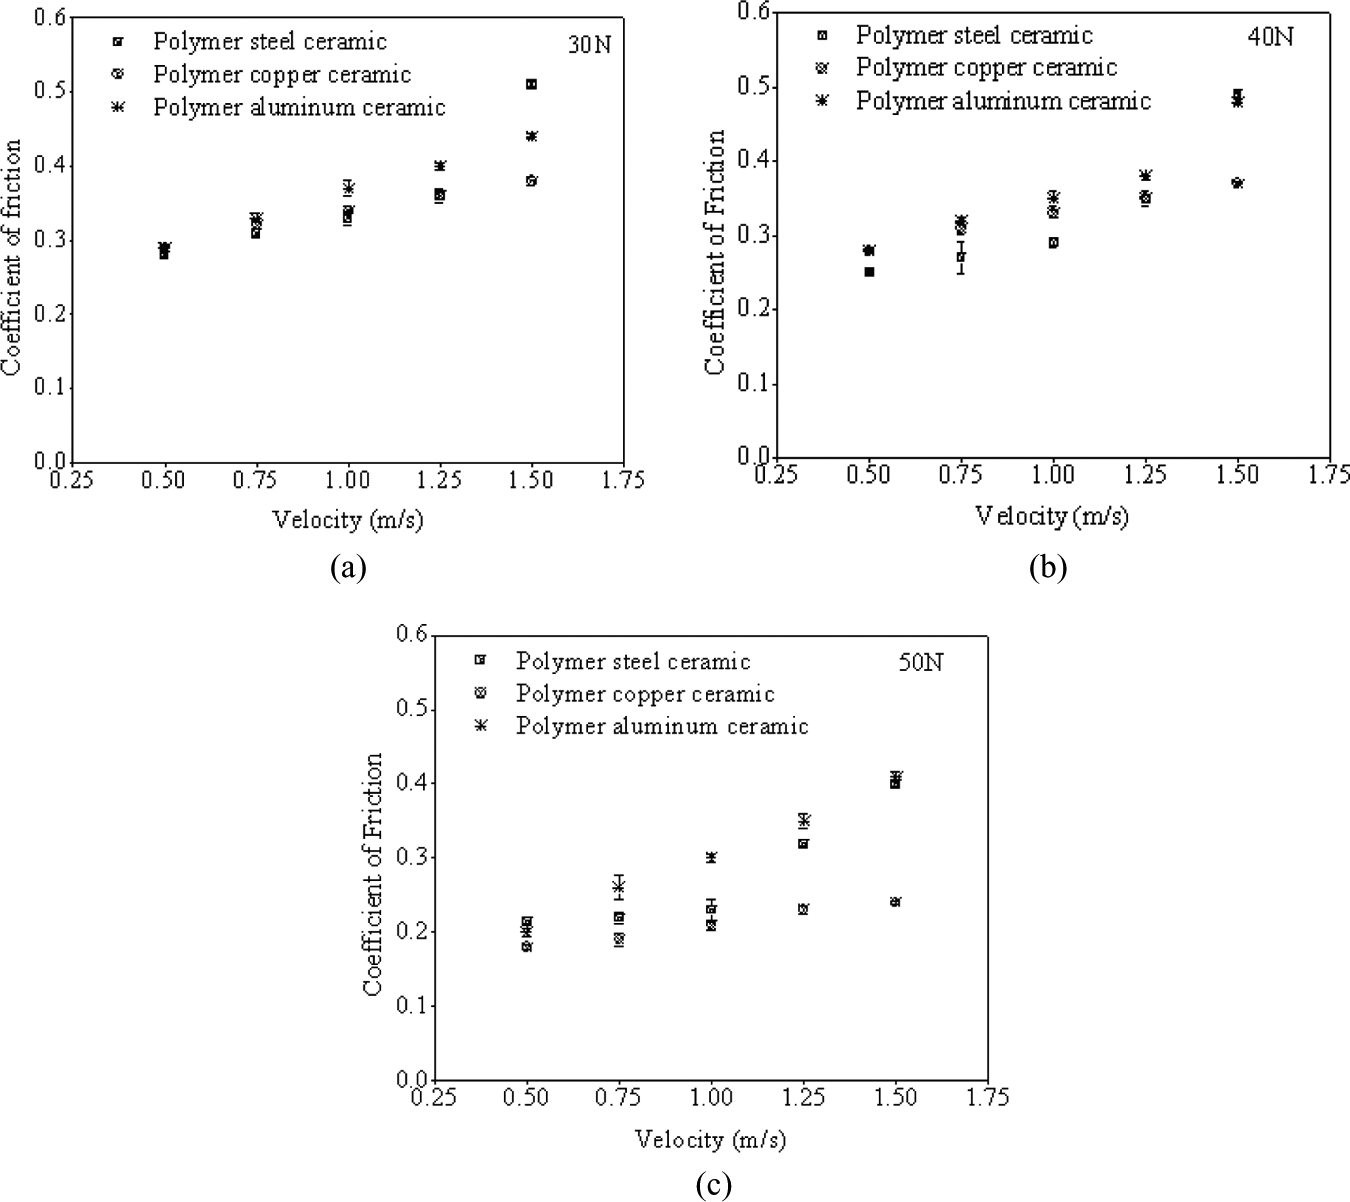
Variation in coefficient of friction as a function of velocity for three-phase composites at ambient conditions at (a) 30 N, (b) 40 N and (c) 50 N normal load.
The friction coefficient (frictional force/normal force) for polymer steel–ceramic composite varies in the range of 0.21 (0.5 m/s, 50 N) and 0.51(1.5 m/s, 30 N). For the polymer copper–ceramic composite, it is 0.18 (0.5 m/s, 50 N) and 0.38 (1.5 m/s, 30 N). For the polymer aluminum–ceramic composite, it is in the range of 0.2 (0.5 m/s, 50 N) and 0.44 (1.5 m/s, 30 N). The friction coefficient values increased with increase in velocity and decreased with increase in load. The variation in the frictional behavior at lower velocities is hardly discernible compared to that at higher velocities.
Evolution of temperature along the pin
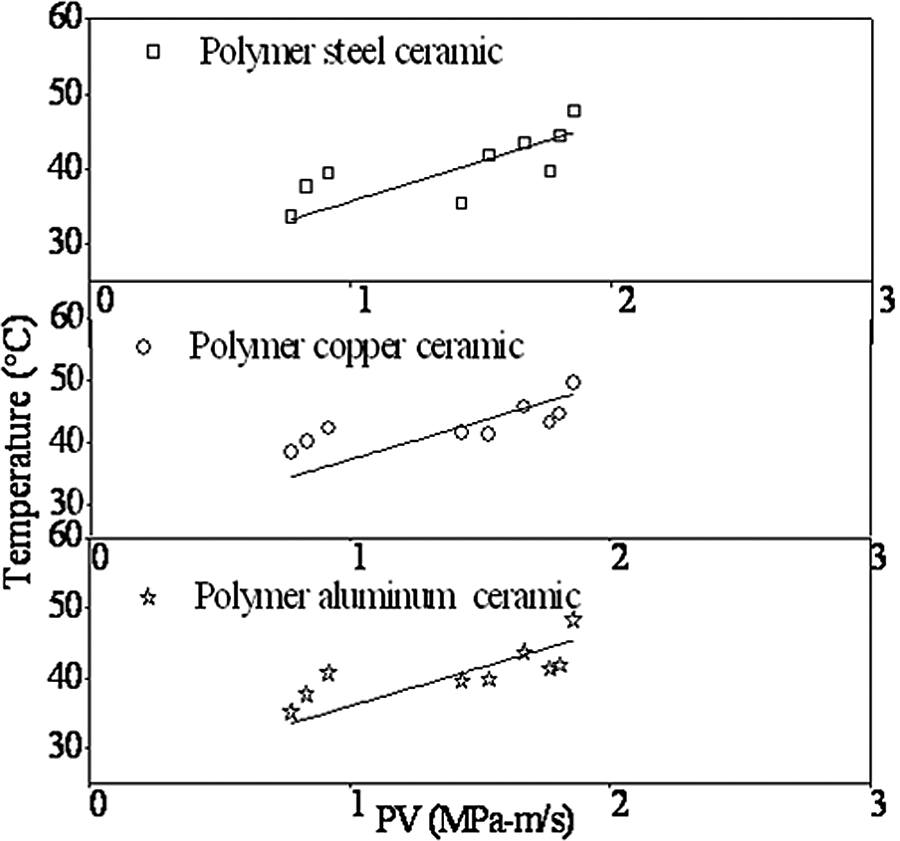
The variation in temperature as a function of distance from pin–disc interface is shown in Figure 2(a) to (c). Comparison of measured temperature as a function of velocity for all three-phase composites at 30 and 50 N load are shown in Figure 3(a) and (b). The temperatures measured at different distances from the pin–disc interface for all three-phase composites under test at different loads, velocities and distances from pin-disc interface under ambient test conditions are illustrated in Table 2.
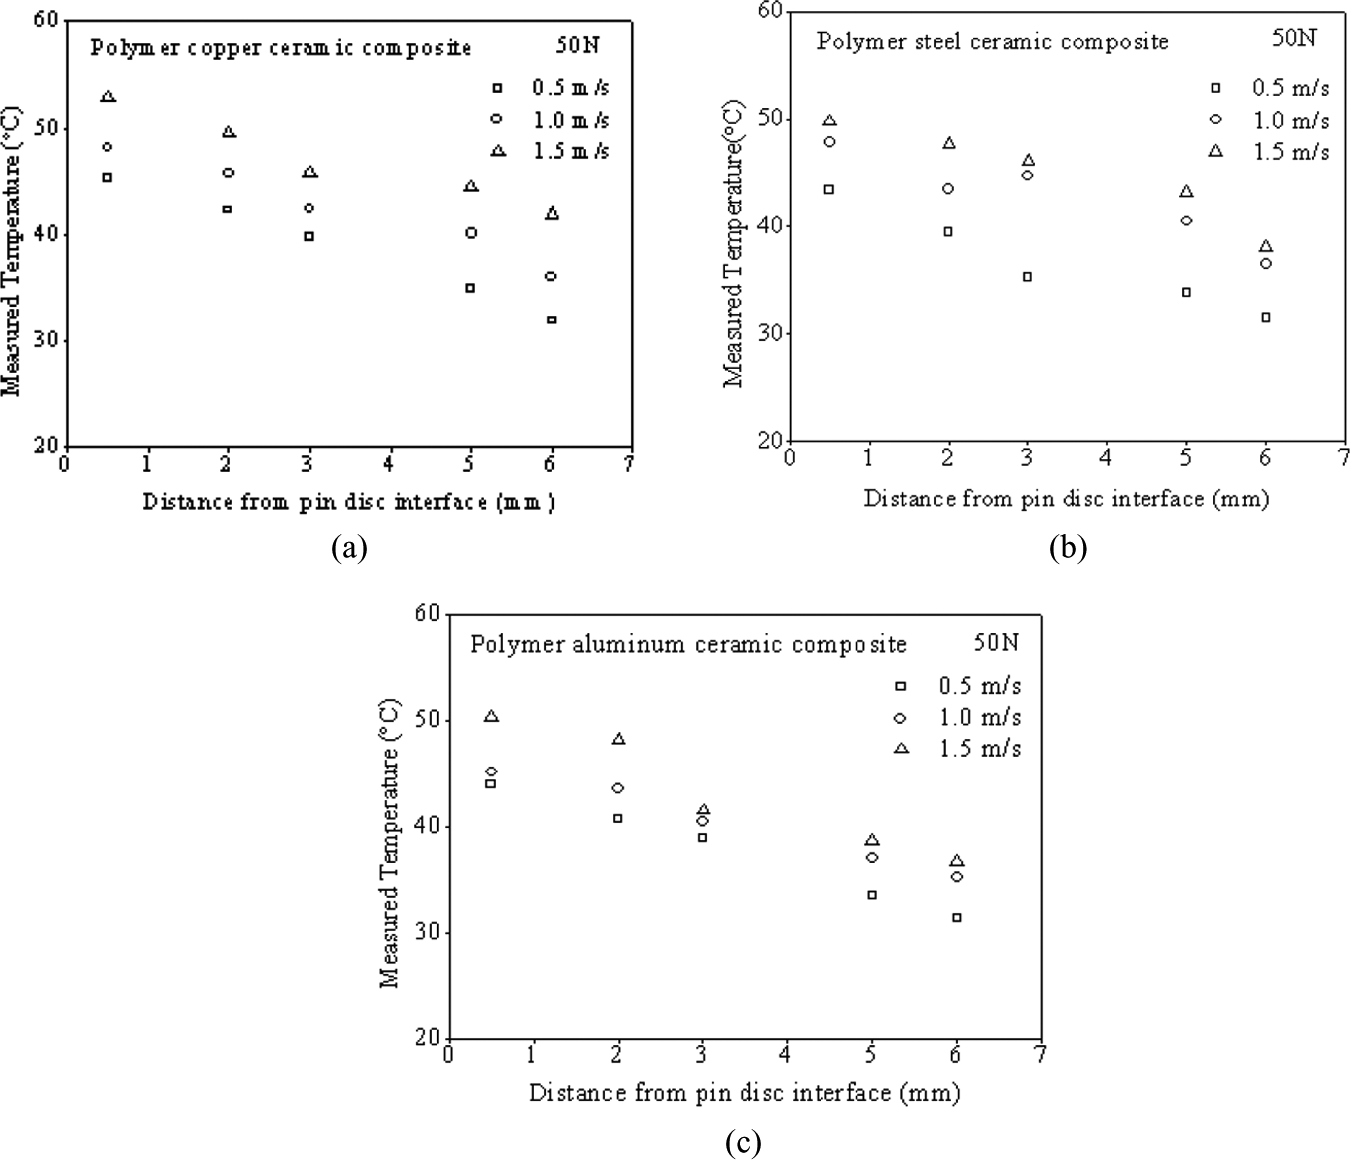
Variation in measured temperature as a function of distance at 50 N normal load for (i) polymer copper–ceramic composite, (ii) polymer aluminum–ceramic composite and (iii) polymer steel–ceramic composite at ambient conditions.
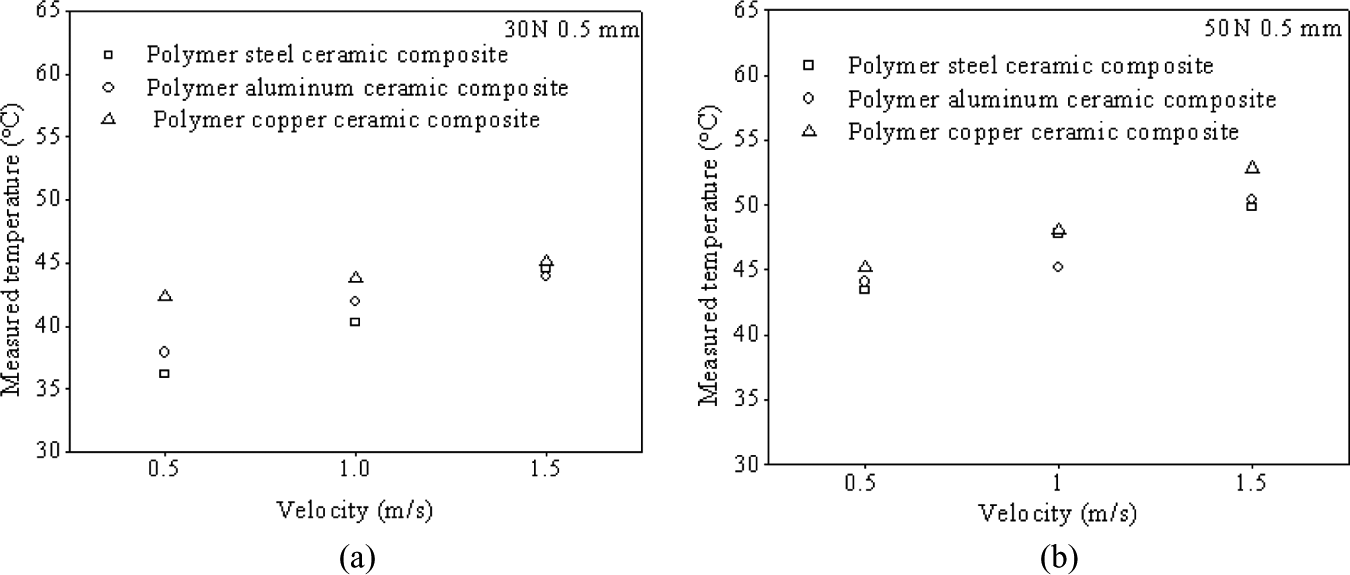
Variation in measured temperature at 0.5 mm distance from pin–disc interface as a function of velocity for three-phase composites (a) at 30 N and (b) 50 N normal load.
Measured temperature at all loads and velocities for three-phase composites at ambient conditions.
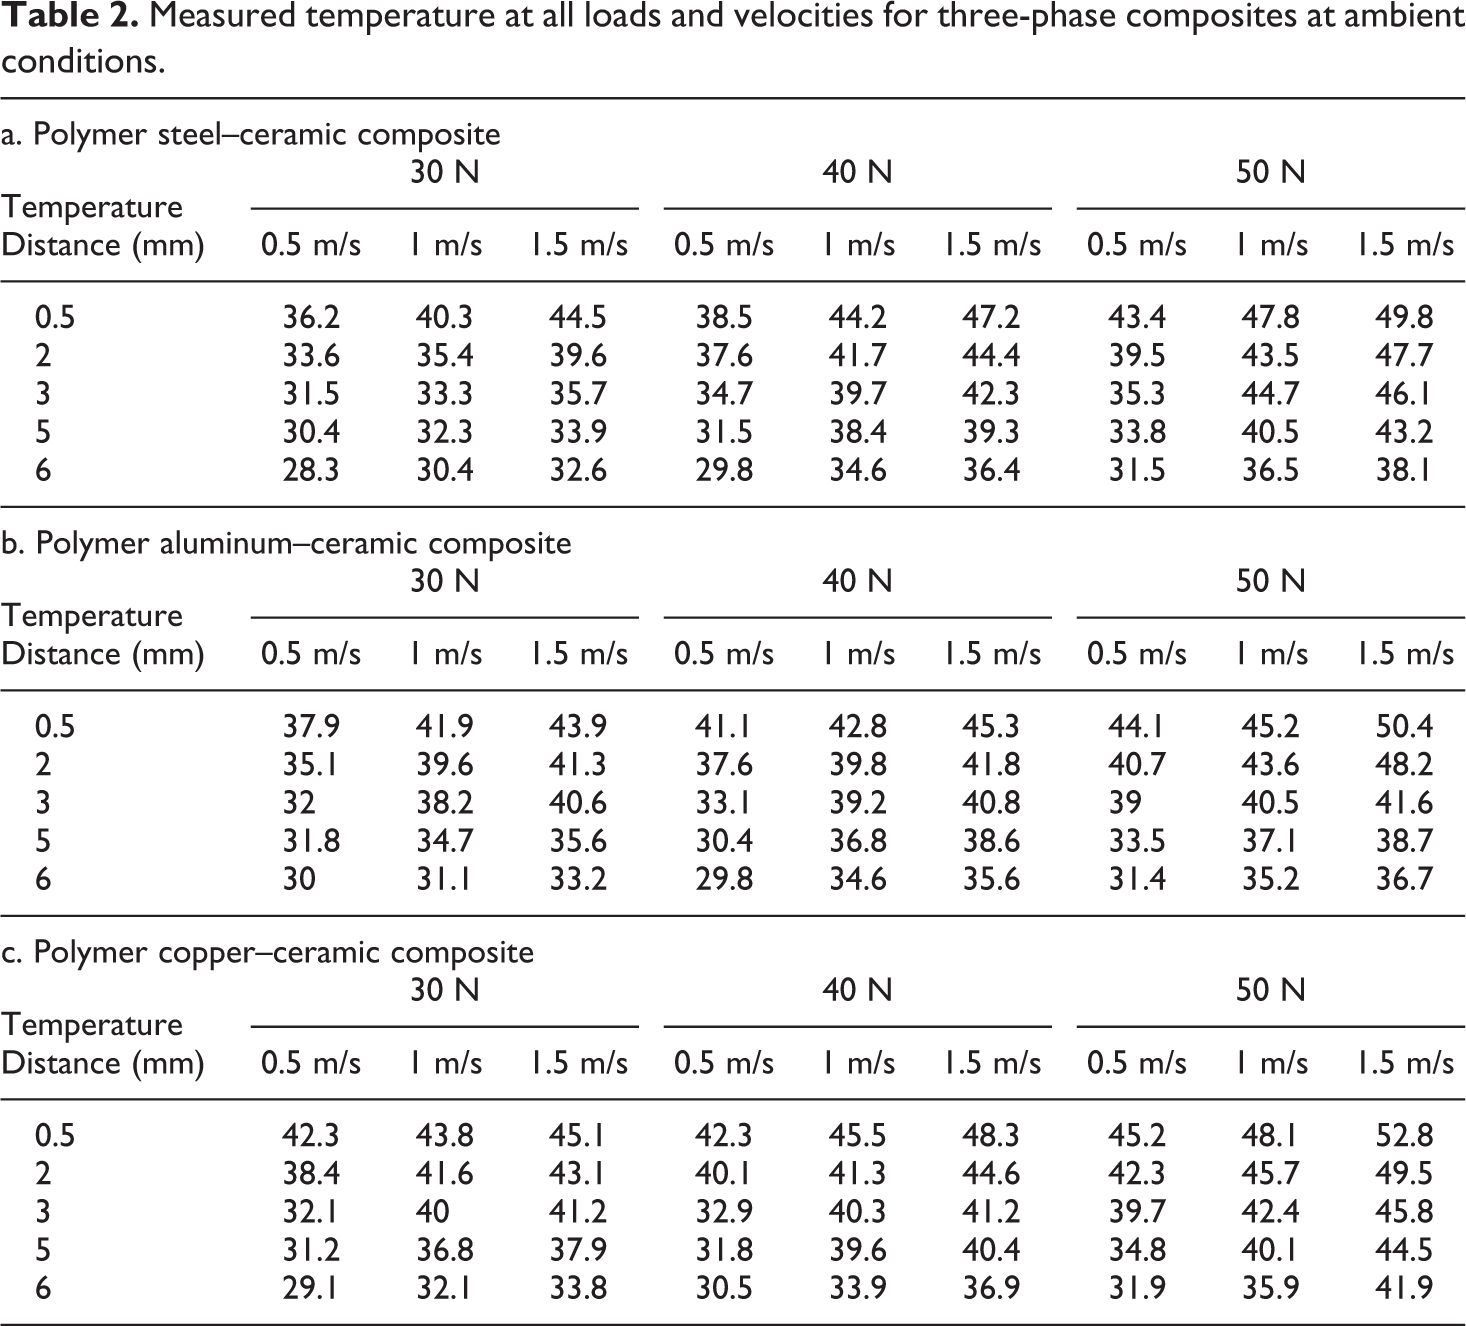
At a distance of 0.5 mm from pin–disc interface, the polymer steel–ceramic composite recorded temperatures of 36.2°C at 30 N, 0.5 m/s and 49.8°C at 50 N, 1.5 m/s. For the polymer copper–ceramic composite, the temperatures were 42.3°C and 52.8°C, respectively. In the case of polymer aluminum–ceramic composite, the temperatures were 37.9°C and 50.4°C, respectively.
The temperatures measured along the polymer copper–ceramic composite pin are higher than those of polymer steel–ceramic and polymer aluminum–ceramic composites. The temperatures increase with increase in load and velocity and decrease with increase in distance from pin–disc interface. Increased temperatures along the pin indicate increased heat transfer through the pin.
Specific wear
Specific wear at different operating conditions are shown in Table 3. The variation in specific wear as a function of velocity at a given load and different velocities for all three-phase composites at ambient temperature is shown in Figure 4(a) to (c).
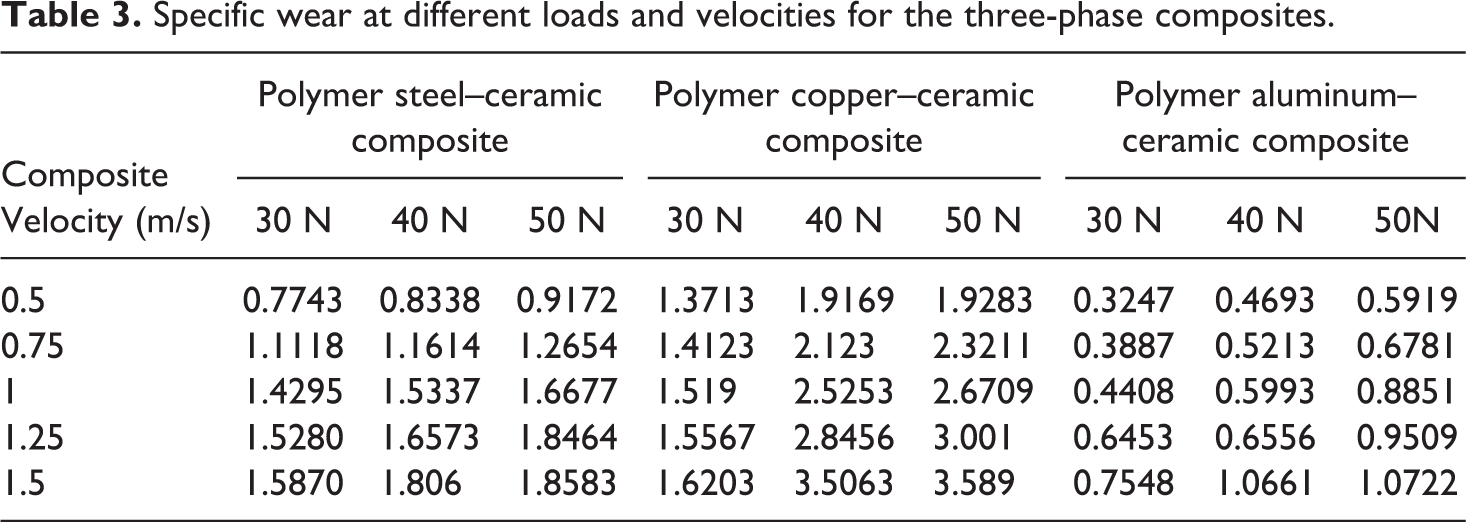
Specific wear at different loads and velocities for the three-phase composites.
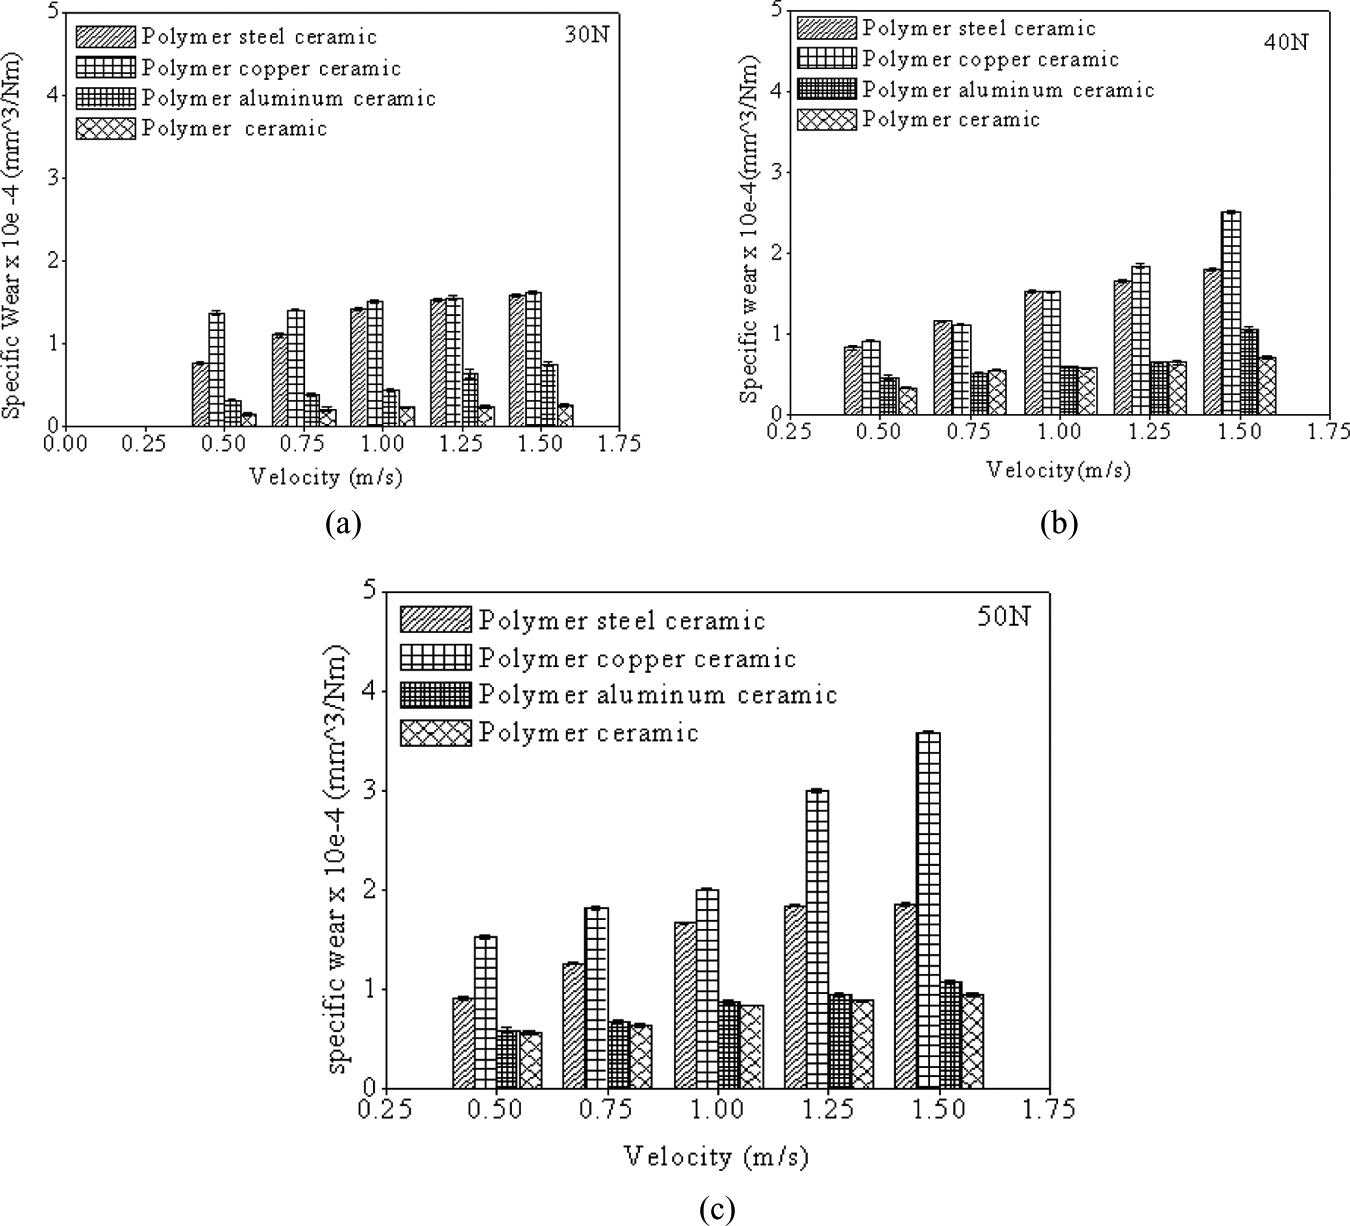
Variation in specific wear as a function of velocity for three-phase composites at (a) 30 N, (b) 40 N and (c) 50 N normal load.
The specific wear of the composites at 50 N load, 1.5 m/s velocity and ambient conditions are 3.589 × 10e−4 mm3/Nm for the polymer copper–ceramic composite, polymer aluminum–ceramic composite and polymer steel–ceramic composite, respectively.
Energy consumption
The variation in temperature at a distance of 2 mm from pin–disc interface as a function of energy (PV) at ambient conditions for the three-phase composites is shown in Figure 5. The variation in specific wear as a function of PV for ambient three-phase composites and polymer ceramic composite is shown in Figure 6. The polymer ceramic composite is included for comparison.
Variation in temperature as a function of PV for three-phase composites at ambient conditions. PV: pressure–velocity.
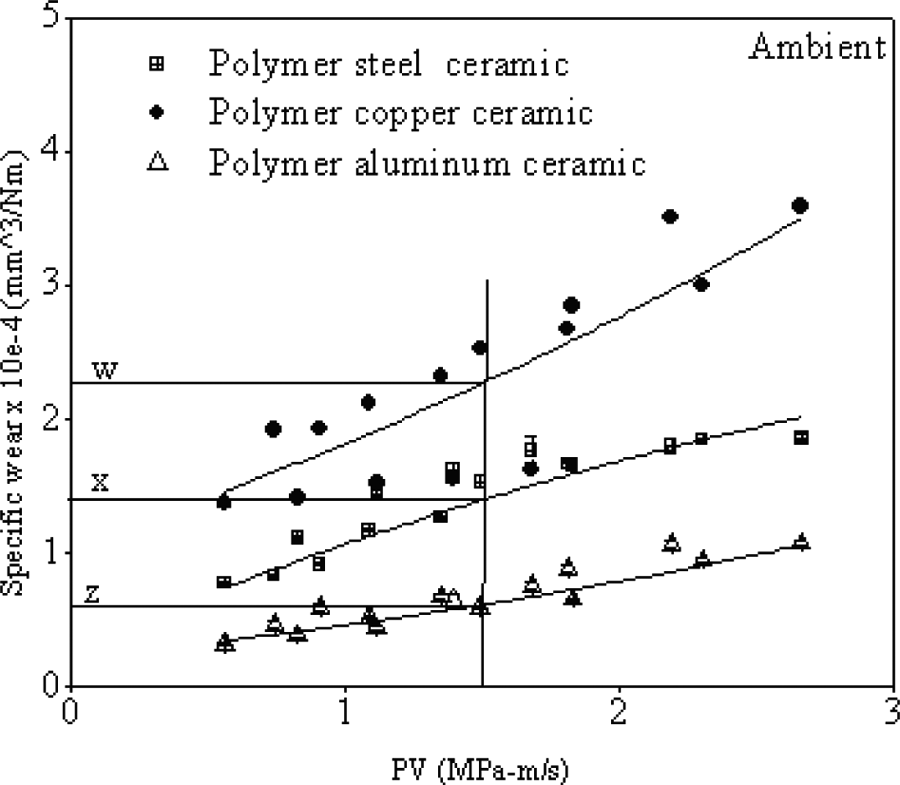
Variation in specific wear as a function of PV for three-phase composites at ambient conditions. PV: pressure–velocity.
The slope of the polymer copper–ceramic composite line is slightly more than the polymer aluminum–ceramic and polymer steel–ceramic composites at ambient conditions indicating more heat transfer through the pin in comparison to other composites as seen from Figure 5. For a given PV, the specific wear of polymer copper–ceramic composite is the largest as shown in Figure 6 (point w) and that of polymer ceramic is the least as indicated by point z. The specific wear of polymer aluminum–ceramic composite is nearer to polymer ceramic composite (point x). The polymer steel–ceramic composite has a value less than polymer copper–ceramic composite but higher than polymer aluminum–ceramic composite. Higher the PV, higher is the temperature along the pin axis for three-phase composites (Figure 5). For a given PV value, the temperature recorded by the polymer copper–ceramic composite is higher than the other two composites.
Discussions
At ambient conditions, the polymer copper–ceramic composite due to the higher thermal conductivity of copper powder allows larger amount of heat to pass through the pin and thus the temperatures (Table 2(b), Figure 3) measured along the pin will be higher than the other three-phase composites. Though the ceramic particles tend to prevent wear, larger heat transfer by the copper powder and smaller specific heat of the copper softens up the subsurface, leading to a smaller friction coefficient (Figure 4(a) to (c)) and reducing the effect of ceramic powder. Hardness of copper powder also does not help the cause. This increases specific wear which is evident from Figure 4(a) to (c) and the PV versus specific wear diagram (Figure 6), wherein this composite consumes less energy for a given specific wear. The wear is attributed to cracking, plucking and flaking as seen from the micrograph (Figure 7(a)) reflective of higher surface roughness (1.64 µm Ra) as evident from the profilometric trace shown in Figure 8(a).
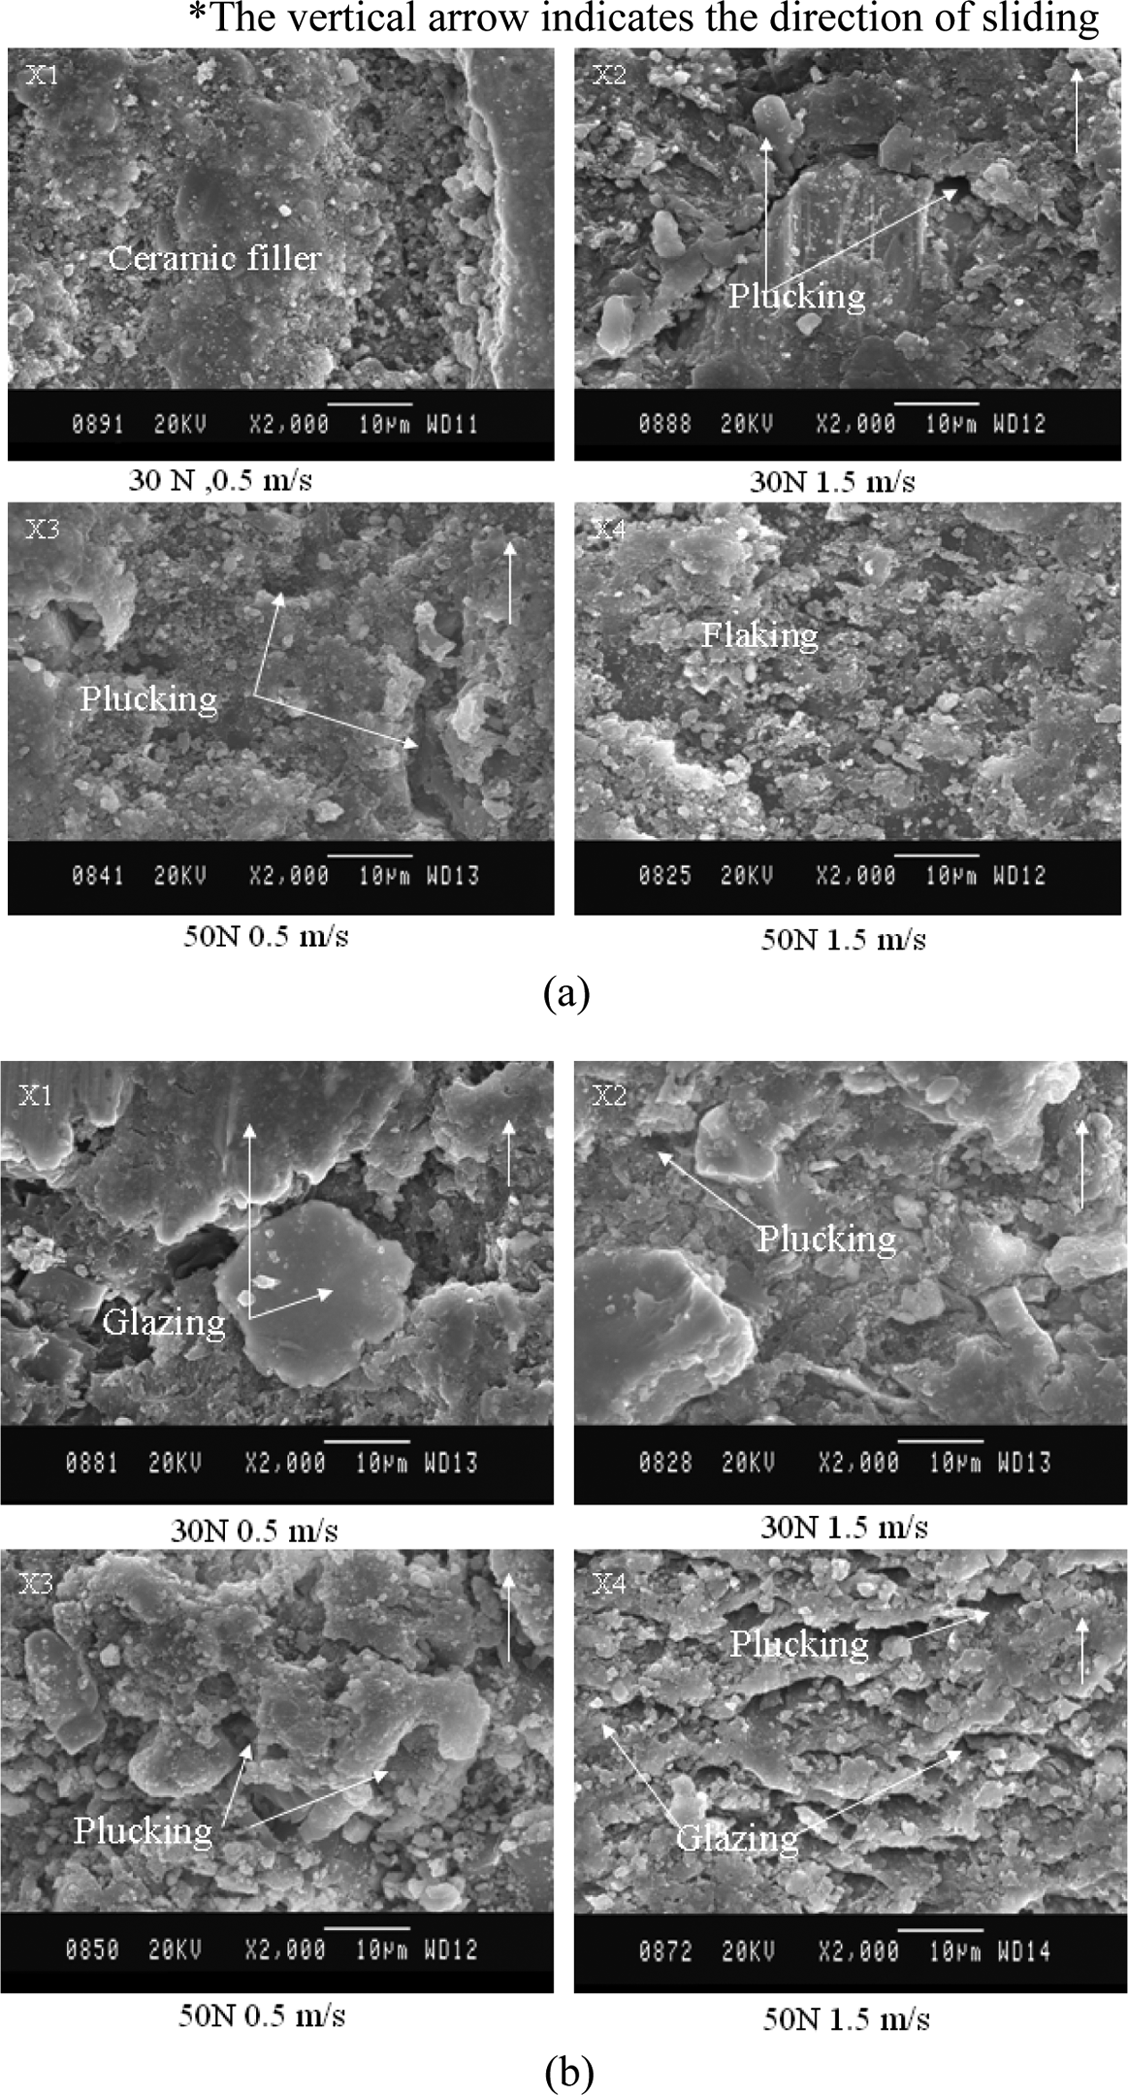
Scanning electron micrographs of (a) polymer copper–ceramic composite, (b) polymer aluminum–ceramic composite and (c) polymer steel–ceramic composite at ambient conditions.
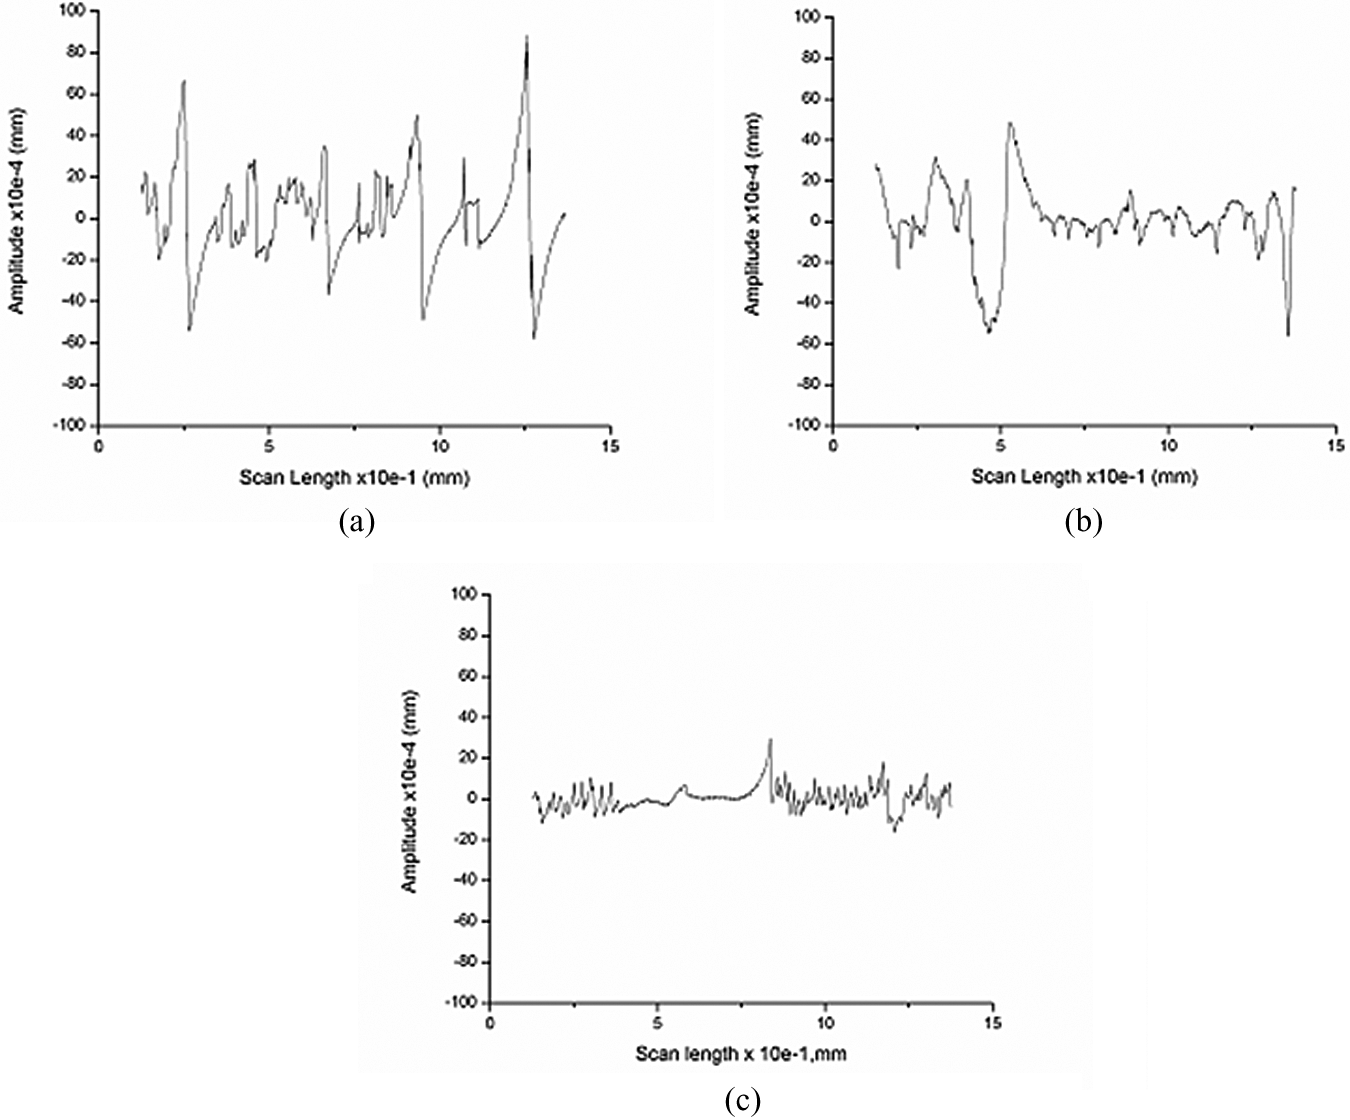
Variation in surface roughness as a function of scan length (a) polymer copper–ceramic composite. (b) polymer aluminum–ceramic composite and (c) polymer steel–ceramic composite.
The lower rate of increase in specific wear in the polymer aluminum–ceramic composite may be associated with the reasonable value of thermal conductivity and high specific heat of aluminum powder. These properties lead to lower temperature along the pin as compared to the copper-based composite (Figure 2(b)). The high specific heats of aluminum and ceramic powders, good wear resistance of ceramic powder (alumina) and moderate to inferior thermal conductivities of aluminum and alumina powders lead to the reduction in the wear (Figure 4(a) to (c)).
Thus, the metal and ceramic particles being held in position the friction coefficient is found to be higher leading to increased energy consumption at a given specific wear (Figure 6). At ambient temperatures, the scanning electron micrographs of the worn surface show plucking and glazing (Figure 7(b)) resulting in larger flow regions and smaller values of surface roughness (1.12 µm Ra) as seen from Figure 8(b).
The polymer steel–ceramic composite exhibited a higher coefficient of friction as compared to polymer copper–ceramic and polymer aluminum–ceramic composite (Figure 4.1(a) to (c)). The observations of higher friction coefficient and increased specific wear (Figure 4.3(a) to (c)) in the case of three-phase steel composite may be explained by the reduced heat transfer through the pin because of lower thermal conductivity (Figure 4.2(a) and (b)) and increased specific wear due to lower specific heat than aluminum.
The steel–ceramic composite indicates higher wear in comparison to polymer aluminum–ceramic composite. The heat transfer rate through the pin reduce due to smaller value of thermal conductivity of steel as the temperatures measured along the pin axis are less compared to both copper and aluminum (Figure 3(a) and (b)). Lower specific heat of the steel powder would result in increased specific wear. The specific wear is less than that of polymer copper–ceramic composite (Figure 3(a) to (c)). This may be due to reduced heat transfer and subsequent softening of the matrix leading to melting at the interface as seen from Figure 7(c). This results in a much smoother surface with low values of surface roughness (0.52 µm Ra) as seen from Figure 8(c).
Conclusions
The properties such as thermal conductivity, specific heat and density of the composites have a role to play in the wear behavior of the composites. Higher thermal conductivity would increase heat transfer through the pin leading to softening of the subsurface. This results in higher wear of polymer copper–ceramic composite. Polymer aluminum–ceramic composite has wear rate lower than the other composites. This may be attributed to reasonable thermal conductivity and high specific heat. Polymer steel–ceramic composite has lower thermal conductivity that may result in lower temperatures at the subsurface of the pin. Its wear rate is higher because its specific heat is low. Lower specific heat causes larger heat transfer through the pin. Due to hardness of the ceramic particles, significant plucking is observed, whereas polymer aluminum–ceramic composite tends to glaze as evident from profilometric trace.
Footnotes
Funding
This research received no specific grant from any funding agency in the public, commercial or not-for-profit sectors.