
Abstract
In this study, low-density polyethylene (LDPE)–thermoplastic corn starch blends containing various amounts of organomodified montmorillonite (OMMT, 0.5–3 part per hundred (phr) resins) were prepared using a twin screw extruder. A 3-wt% LDPE-grafted maleic anhydride was used as a compatibilizer. The tensile, flow and water absorption properties of all the samples were measured by means of standard methods. Intercalated structures were achieved in all the samples, based on the x-ray diffraction and transmission electron microscopic results. Increasing levels of clay also led to the higher gallery distance of silicate layers (i.e. 32.5–34.5 Å). Furthermore, increment in ultimate tensile strength (UTS) and Young’s modulus (E) as well as decrement in elongation at break (∊ b) were obtained with increase in clay loading. The sample containing 1 phr nanoparticles showed 20% and 63% increase in UTS and E when compared with the reference sample, respectively. However, ∊ b of this sample decreased by 17%. In addition, the flow property measurements indicated that as shear rate and the clay content increased, the apparent viscosity of all the samples decreased and increased, respectively. Finally, the presence of OMMT led to decrease in the melt flow index (MFI) of the samples. The MFI values also decreased with increasing the OMMT concentration. It is believed that the samples prepared in this work may biodegrade after exposure to the environment.
Introduction
The problem of waste plastic disposal has now been worsened in many countries and packaging plastics, such as shopping bags, are visible in the environment. 1 Low-density polyethylene (LDPE) is one of the mass produced nondegradable thermoplastics with excellent physical properties, which is used extensively in disposable packaging products. This caused serious ecological problems due to their long life of hundreds of years. There has been an interest in the development of degradable plastics, which can be decomposed after disposal to the natural environment (microorganisms, light, water and other factors). 2,3
Many researches indicate that the production and use of biodegradable starch-based materials could offer a good solution to the plastic waste problems, especially in short-life applications. 4,5 Because, starch-based products are the most wide spread and economic materials, starch is known to be completely biodegradable in soil and water and would be a potential candidate to replace some amounts of polyolefin products in the area of packaging. 6 Thermoplastic starch (TPS) is also prepared by plasticization of starch with the addition of a plasticizer, such as glycerol, which is usually susceptible to microbial attack. 7 However, TPS is water sensitive and has poorer mechanical properties than the polyethylene (PE) used in packaging industries; thus, it cannot fulfill the requirements of the products from packaging point of view. 8,9 It is expected that the combination of TPS with PE in the presence of a compatibilizer, such as PE-grafted maleic anhydride (PE-g-MA), satisfy the required mechanical properties for packaging products. 10,11
Study on the PE/starch blend plastics began in the 1970s 12 and still continues at various laboratories all over the world. 13,14 Many researchers prepared and studied rheology and mechanical properties of different PE–TPS blend systems and reported a decrease in their mechanical properties, especially in higher TPS loading. They also concluded that the presence of starch and increasing its concentration led to confining flowability, as a result of which the apparent viscosity of the blends increases. 15 –18
Data in the literature indicate that the incorporation of few weight percentages of an intercalated (or exfoliated)-layered silicate, such as montmorillonite (MMT) that is properly dispersed within the polymer blend matrix and created a very high surface area for polymer–filler interfacial interactions, provided the materials with desired processability as well as improved their mechanical and barrier properties. 19
Despite widespread research works on the preparation and properties of PE–starch materials, investigations on the blends containing MMT as ecologically safe filler are few. 20 –23 In this work, LDPE–TPS blends containing organomodified montmorillonite (OMMT) were prepared using a twin-screw extruder. Study on the effect of various contents of the nanoclay on tensile properties of the LDPE–thermoplastic corn starch (LDPE–TPCS; 75/25, g/g)) blend, which is appropriate for packaging applications, is the main objective of the present work. Flow and water absorption properties are also examined.
Experimental
Materials
LDPE (film grade, with density 0.924 g/cm3 and a melt flow index (MFI) of 4.7 g/10 min (at 190°C, 2.16 kg load)), which is appropriate for packaging usage, was purchased from Aria Sasol Polymer Petrochemical Co. (Bushehr, Iran). The corn starch containing 30% amylose was unmodified commercial grade and supplied from Glucosan Co. (Ghazvin, Iran). PE-g-MA containing 2 wt% maleic anhydride was prepared 24 and used as a compatibilizer. Glycerol was a reagent grade obtained from Hansa Co. (Saxony-Anhalt, Germany). An OMMT (Cloisite®15A, hereafter C15A) was obtained from Southern Clay Products, Inc. (Texas, USA).
Sample preparation
Corn starch, glycerol, PE-g-MA and C15A were dried in a vacuum oven at 80°C for 24 h. TPCS was first prepared by mixing the corn starch with 35 wt% glycerol manually at room temperature and stored under airtight conditions for 24 h until starch granules were swollen. This homogeneous mixture was then melt blended using a Haake internal mixer (model SYS 90; with a volumetric chamber capacity of 300 cm3) at 140°C with a rotor speed of 60 r/min for 8 min. Then, TPCS was melt blended with LDPE, PE-g-MA and C15A in a Brabender corotating twin-screw extruder with L/D ratio of 40 and a screw rotation speed of 150 r/min. The extruder temperature profile was 170–190°C (from feed to die zones). The formulations used for the preparation of LDPE–TPCS blends and the sample codes are listed in Table 1.
The codes and formulations of all the prepared samples.
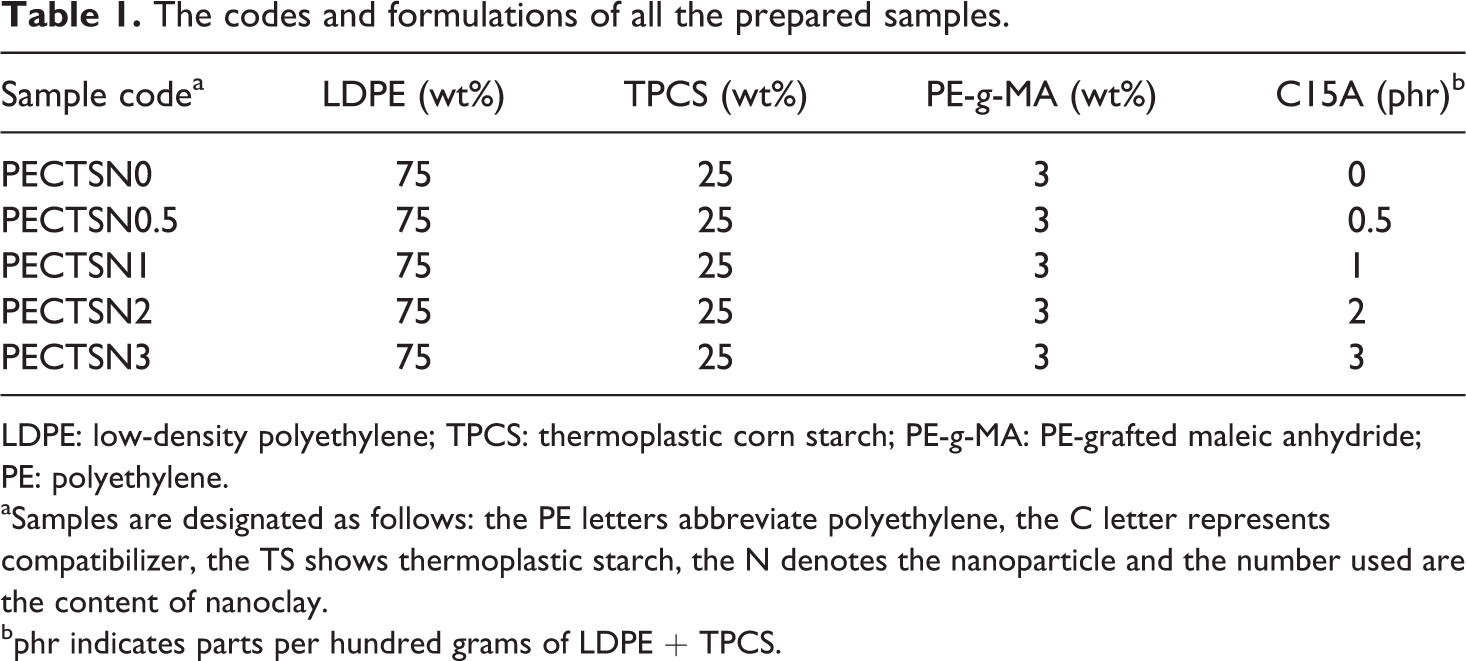
LDPE: low-density polyethylene; TPCS: thermoplastic corn starch; PE-g-MA: PE-grafted maleic anhydride; PE: polyethylene.
aSamples are designated as follows: the PE letters abbreviate polyethylene, the C letter represents compatibilizer, the TS shows thermoplastic starch, the N denotes the nanoparticle and the number used are the content of nanoclay.
bphr indicates parts per hundred grams of LDPE + TPCS.
The prepared samples were then compression molded, according to the ASTM D 4703-03, in a hot-press machine at 150°C for 9 min to obtain sheets of about 2-mm thickness.
Measurements
X-Ray diffraction (XRD) analysis and transmission electron microscopy were applied to evaluate the dispersion of nanoparticles in the blend samples. XRD analysis was performed on a Brucker D8 Advance x-ray diffractometer (Brucker, Germany) using Cu Kα radiation (40 kV, 40 mA and λ = 0.154 nm). Each sample was scanned in the range of 2θ = 2–10° with the rate of 1°/min. Transmission electron microscopic (TEM) image was also obtained by a Phillips CM200 transmission electron microscope operating at an acceleration voltage of 200 kV. Ultrathin cut (80 μm) from the PECTSN1 sample, using a diamond knife under cryogenic conditions, was carried out.
Measurements of tensile properties (ultimate tensile strength (UTS), elongation at break and Young’s modulus) were carried out, according to the ASTM D 638-03, using a tensometer (model Zwick 1446-60) equipped with a 10-kN cell and a data acquisition system. Dumbbell-shaped specimens (2 mm thick) of the LDPE–TPCS blends were cut from the compression-molded sheets. The samples were placed between the grips of the machine and stretched with strain rate of 5 mm/min at room temperature. Five replicates were tested for each sample, and the average values of the measured properties were reported. The modulus was determined from the slope of the linear portion of the stress–strain curves.
MFI was determined using an apparatus (Zwick 4100, Germany), according to the ASTM D 1238-04 (procedure B). A driving weight of 2.16 kg at 190°C was applied to the plunger and the molten sample (7 g) was forced through a die. An average weight of six cuts for each sample at a constant time was used to calculate the MFI values in grams per 10 min.
The apparent viscosity measurement of the LDPE–TPCS blends was carried out using a parallel plate rheometer (model Paar Anton MCR300, Austria) with a gap of 1 mm space at 190°C. Each sample was placed on the stationary plate and the rotational plate placed into it. The power law equation,
Water absorption of the samples was also measured using 76.2 × 25.4 mm2 strips of 2 mm thickness, according to the ASTM D570-98 method. Before the water absorption measurements, the samples were dried at 80°C for 24 h in a vacuum oven. Water absorption measurements were performed by soaking the samples in distilled water. The amount of water absorbed by the samples was determined by weighing the samples at regular time intervals until they were saturated and a constant weight was obtained. The percentage of equilibrium water absorption at any time (w
t, %) was calculated according to
where 
where
Results and discussion
XRD and TEM analyses
XRD and transmission electron microscopy were used to observe the dispersability of the C15A in the LDPE–TPCS blends. The XRD patterns of C15A and LDPE–TPCS blends containing different clay loadings are shown in Figure 1. A characteristic diffraction peak appeared at the angle of 2θ = 2.76° for C15A as a reference, which is attributed to the d
001 basal spacing of 3.93 nm, according to the Bragg’s diffraction equation
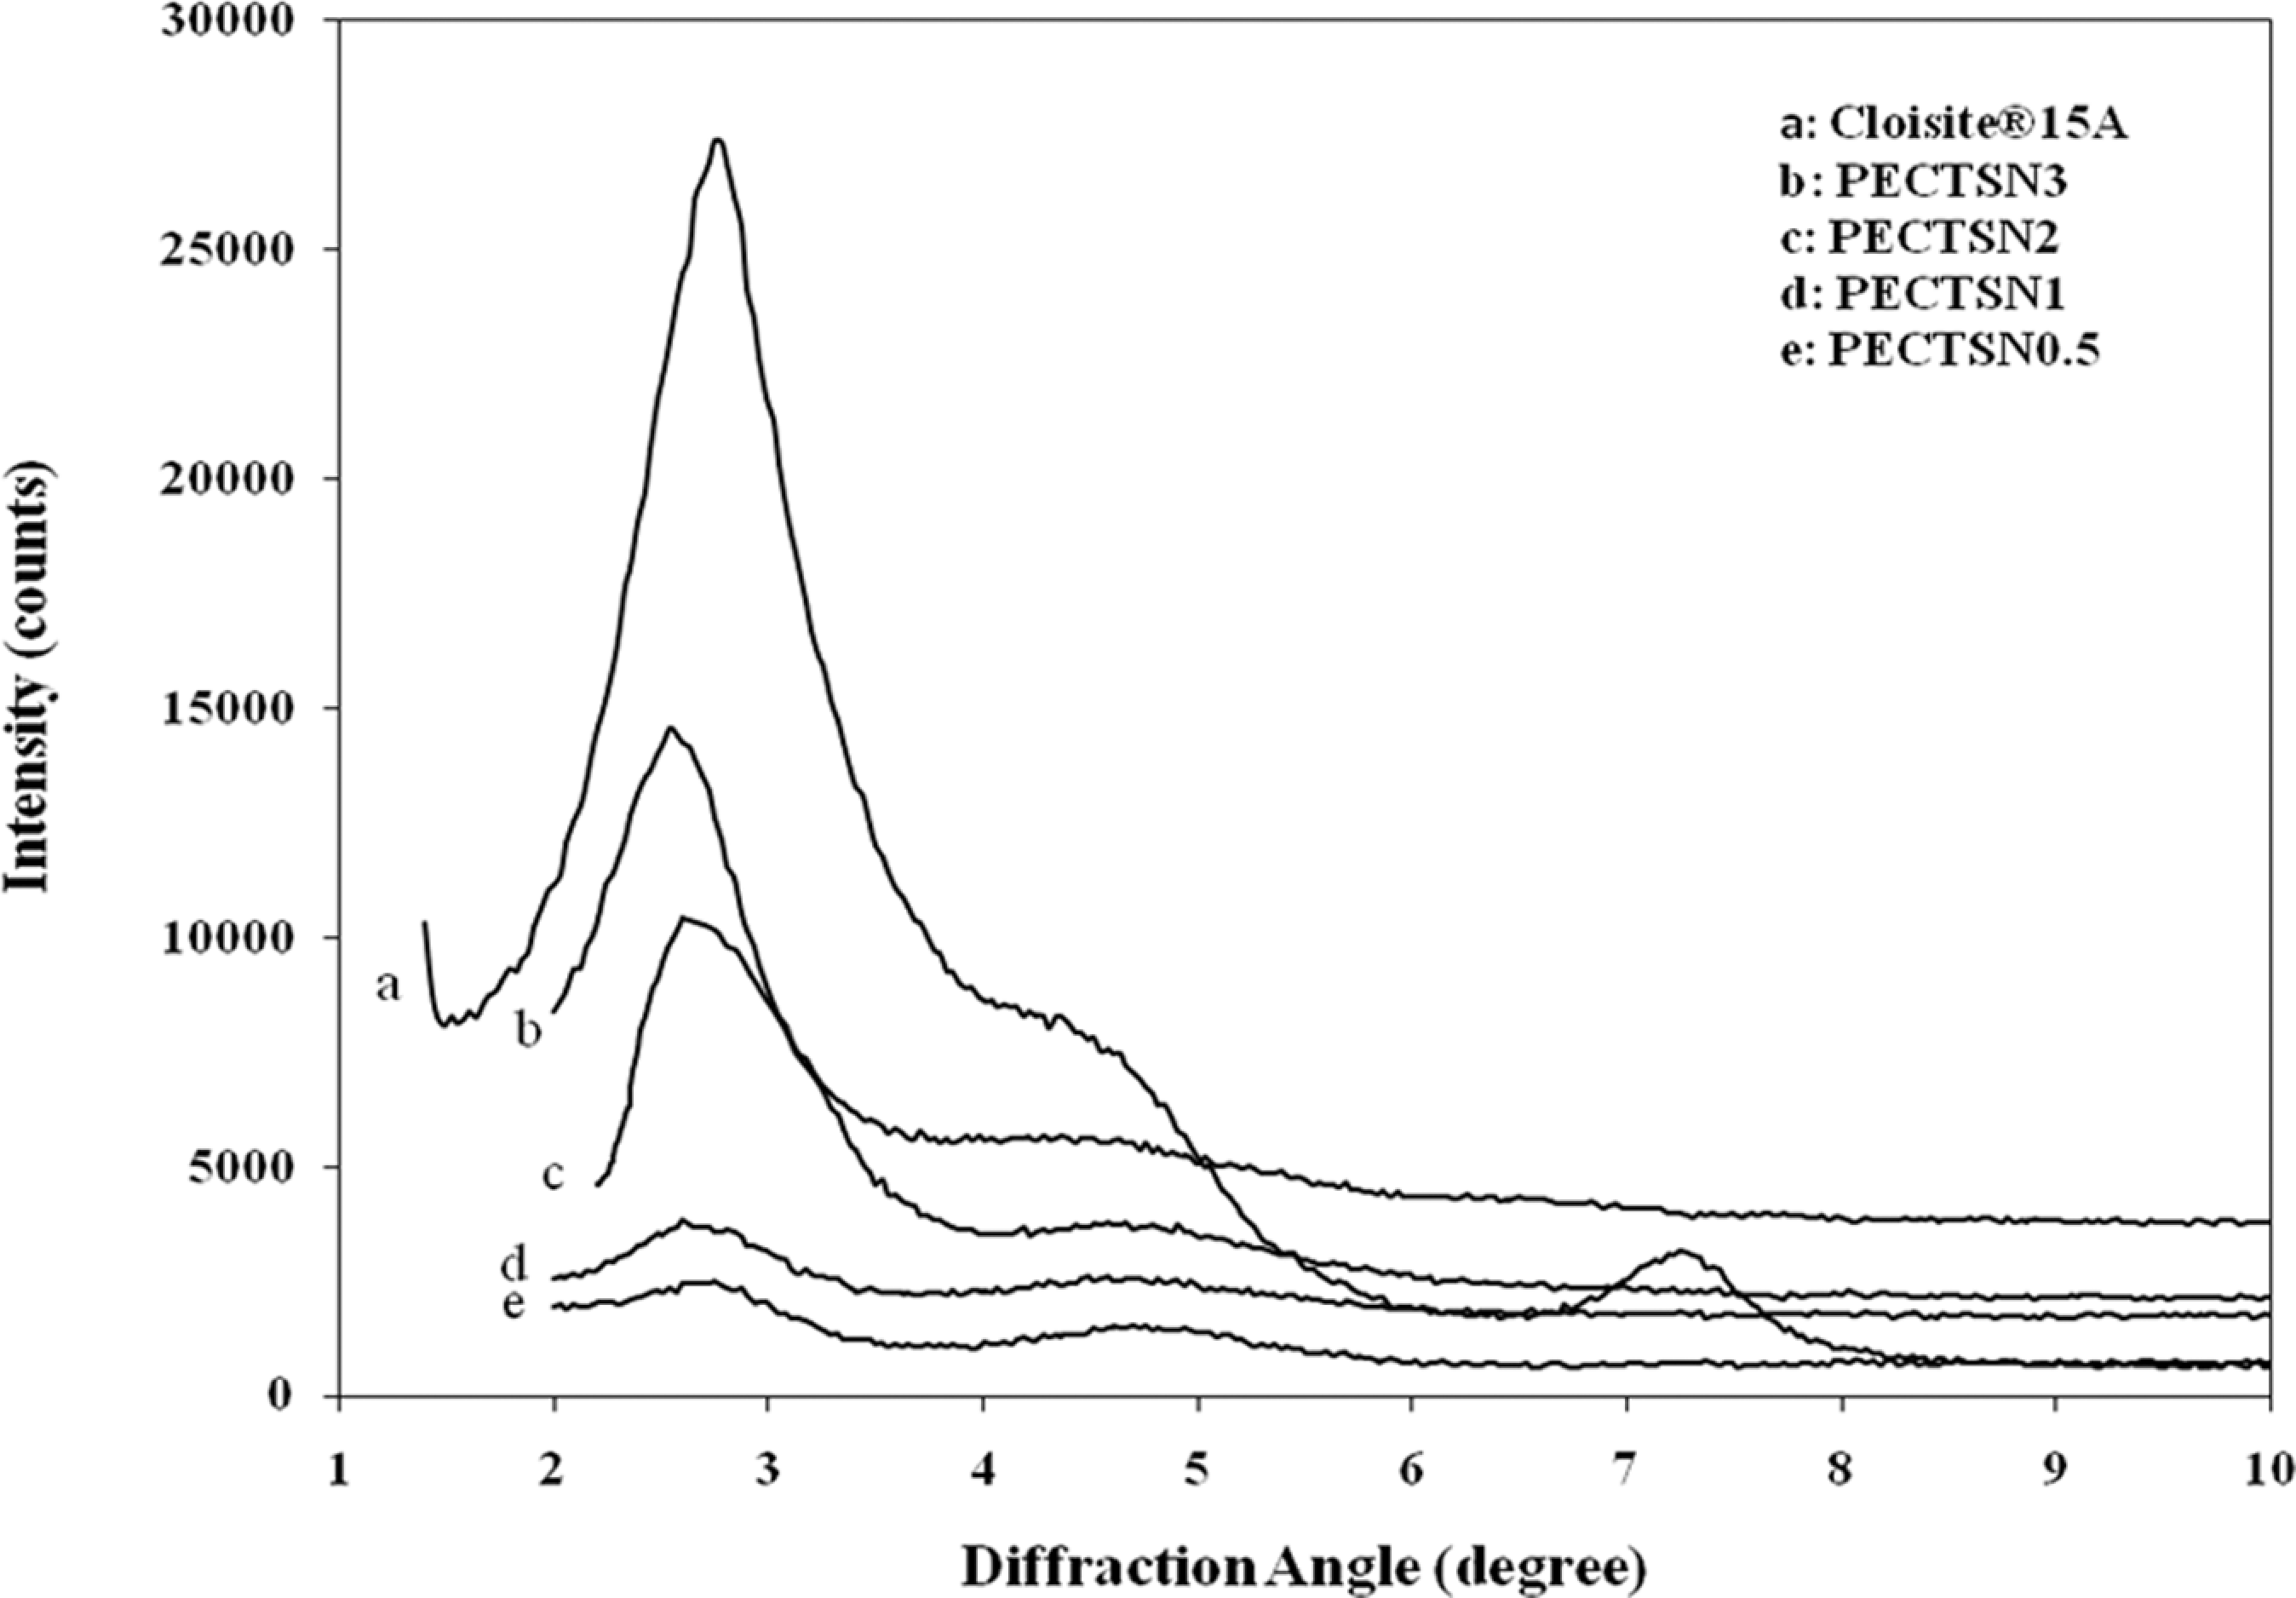
XRD patterns of the LDPE–TPCS blends containing C15A and pristine C15A nanoparticles. LDPE–TPCS: low-density polyethylene–thermoplastic corn starch; XRD: x-ray diffraction.
The XRD results indicate that the polymer chains enter into the silicate layers and separate the platelets. As the nonpolar LDPE chains can hardly intercalate into the gallery of C15A, the hydrogen bonding between the hydroxyl groups of the silicate and MA grafted onto the PE backbone facilitates the intercalation polymer chains into the clay layers. 26,27 By entering more polymer segments, the clay platelets become disordered. This causes broader peak indicating intercalation with a good dispersion of nanoparticles or some exfoliation in the matrix, which is more obvious in the PECTSN0.5 and PECTSN1 samples. To confirm this, the morphology of the PECTSN1 sample was observed by TEM image as shown in Figure 2. This sample shows the highest tensile strength that will be discussed later. From the figure, dispersed particles of TPCS can be seen as clear circular regions. In addition, the dark lines represent C15A, whereas the gray base corresponds to the LDPE matrix. This implies the formation of intercalated structure and/or some exfoliation. It seems that C15A dispersed homogeneously within the LDPE matrix or located at the interface between the LDPE and TPCS phases. 20
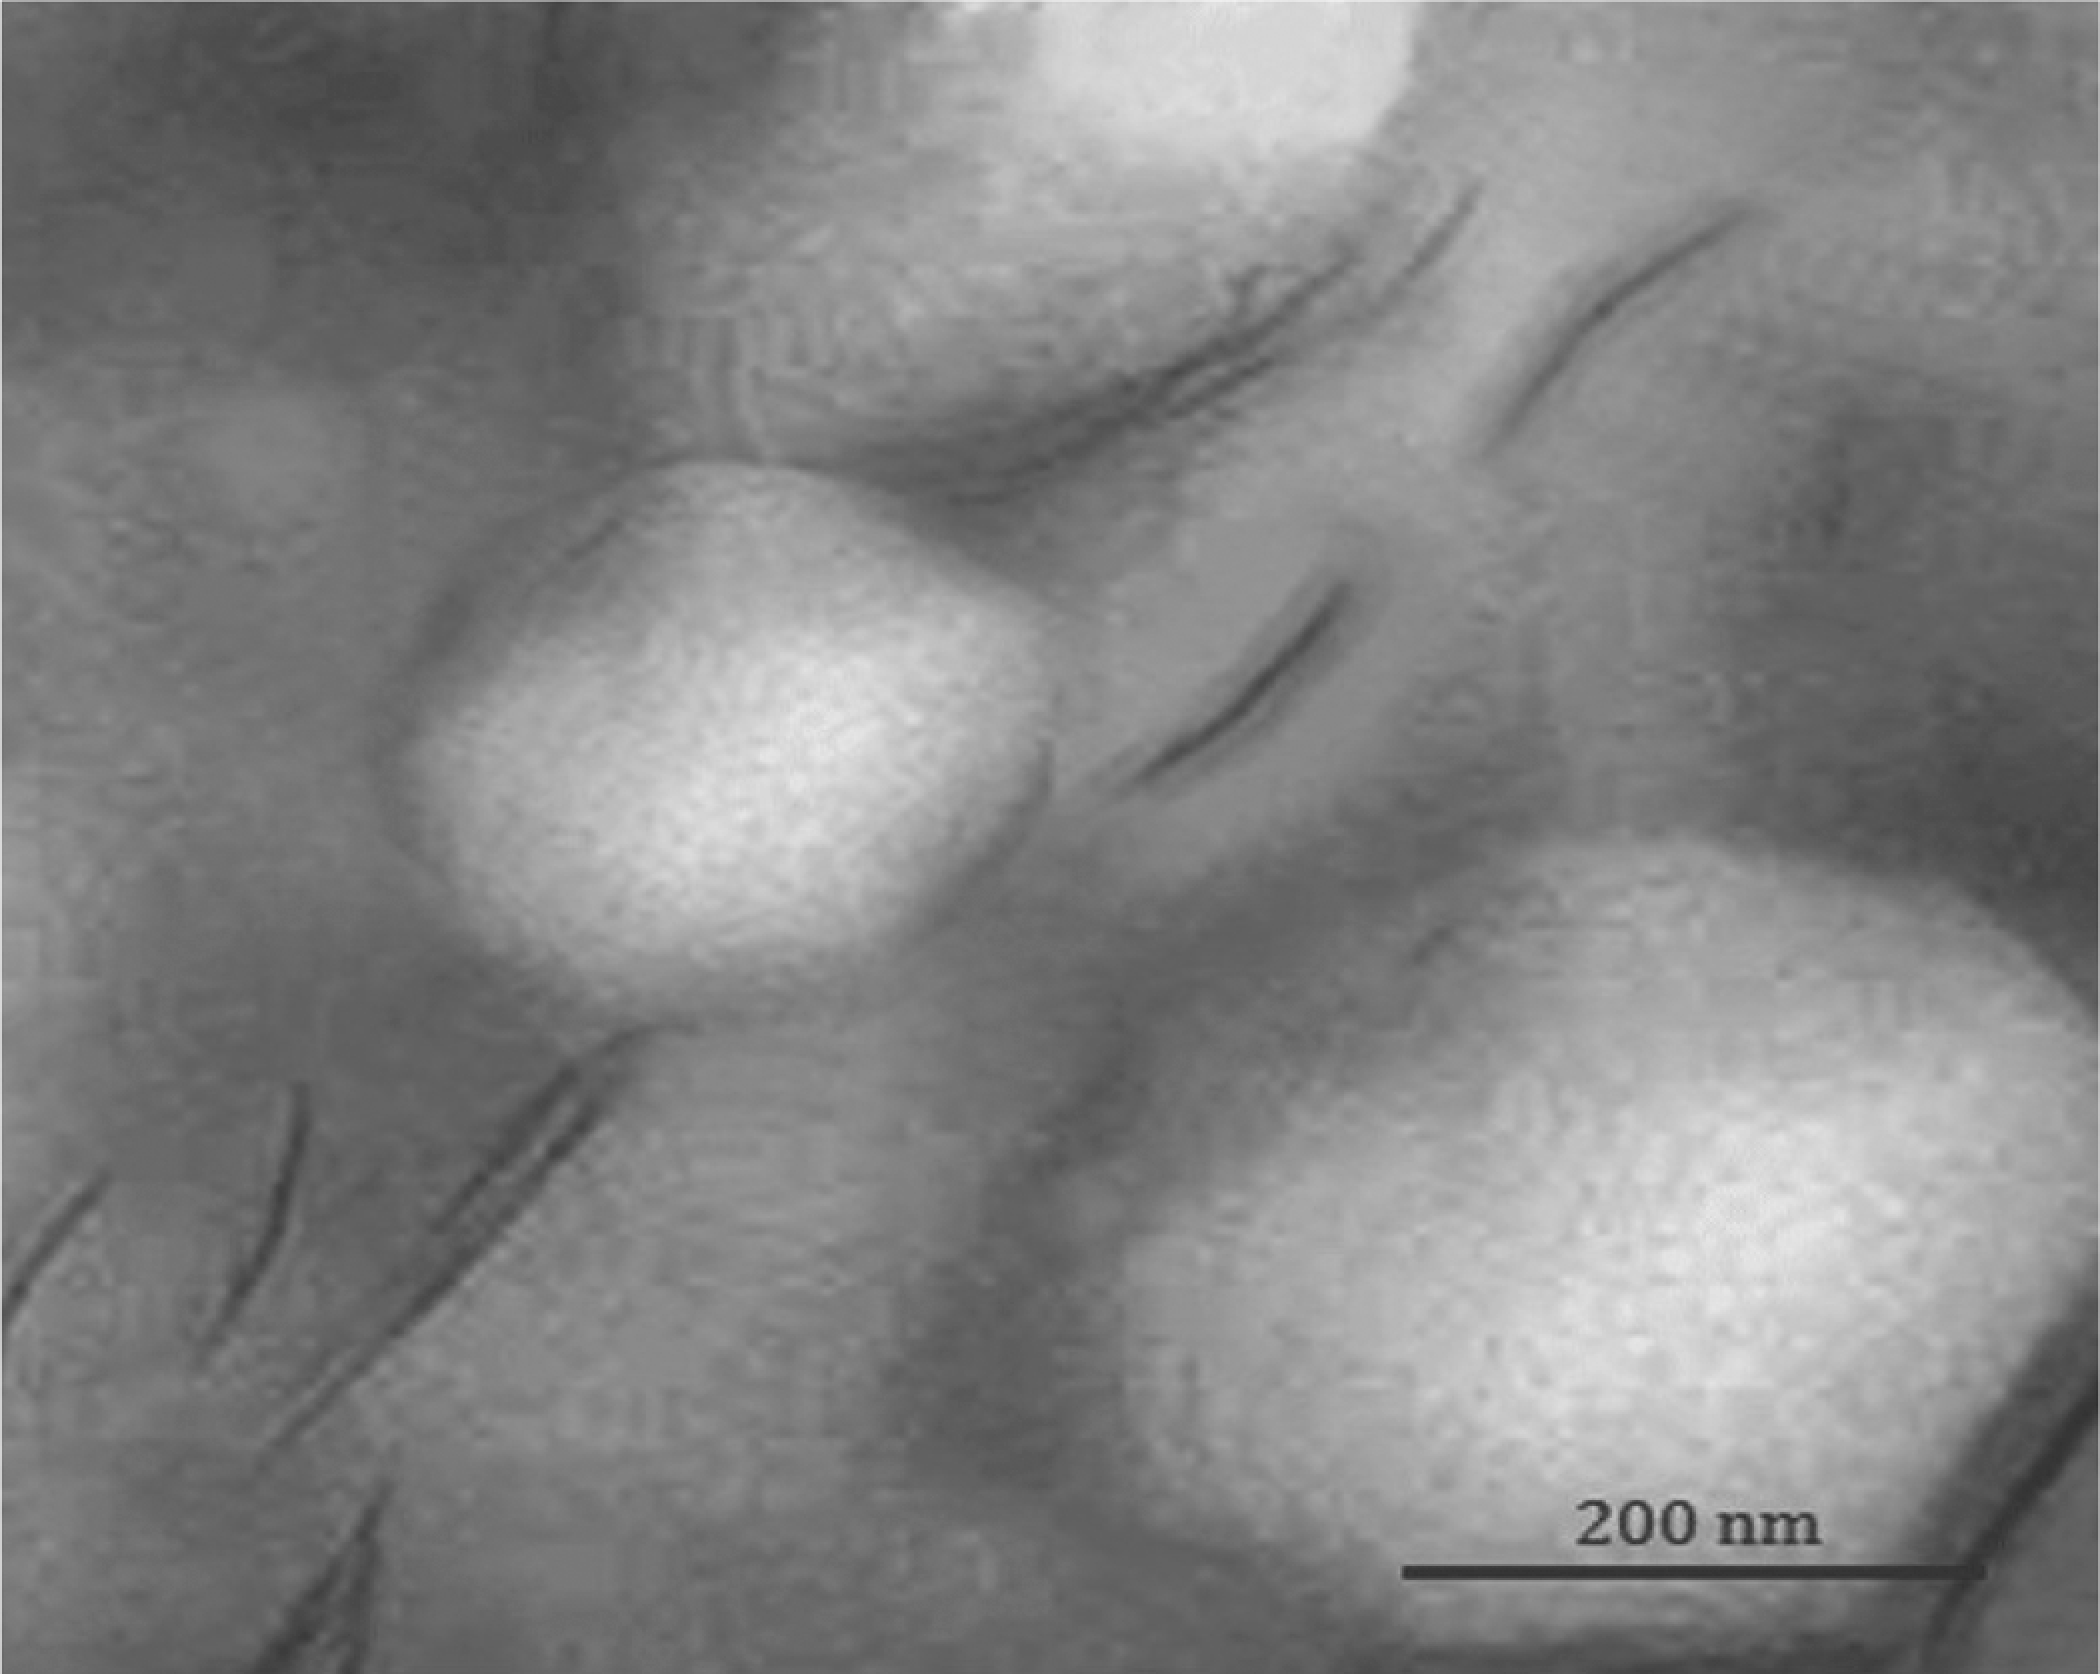
TEM image of PECTSN1 sample. TEM: transmission electron microscopic.
Tensile and flow properties
Effect of C15A concentrate (0.5–3 part per hundred (phr)) on UTS and elongation at break (∊ b) of the blends is seen in Figures 3 and 4, respectively. An increase in UTS is observed up to 1 phr C15A followed by a linear decrease (with small slope) till 3 phr C15A. In addition, the Young’s modulus (E) values are calculated and depicts in Figure 5. On the basis of these data, it can be seen that the introduction of a small amount of C15A influences the tensile properties of the LDPE–TPCS samples. It can be deduced that the C15A nanoparticles can interact with TPCS to form a physical cross-linking network 28 that provides a good interaction with LDPE molecules by LDPE-g-MA molecular segments. As a result, both UTS and E are increased, whereas ∊ b is decreased slightly. The probable agglomerates in the samples containing the higher amount of C15A (i.e. PECTSN2 and PECTSN3) can make difficulty of nanoparticles dispersion in the polymer blend matrix. This may be due to the stronger interactions between the C15A nanoparticles than nanoclay–polymer matrix interactions. 29
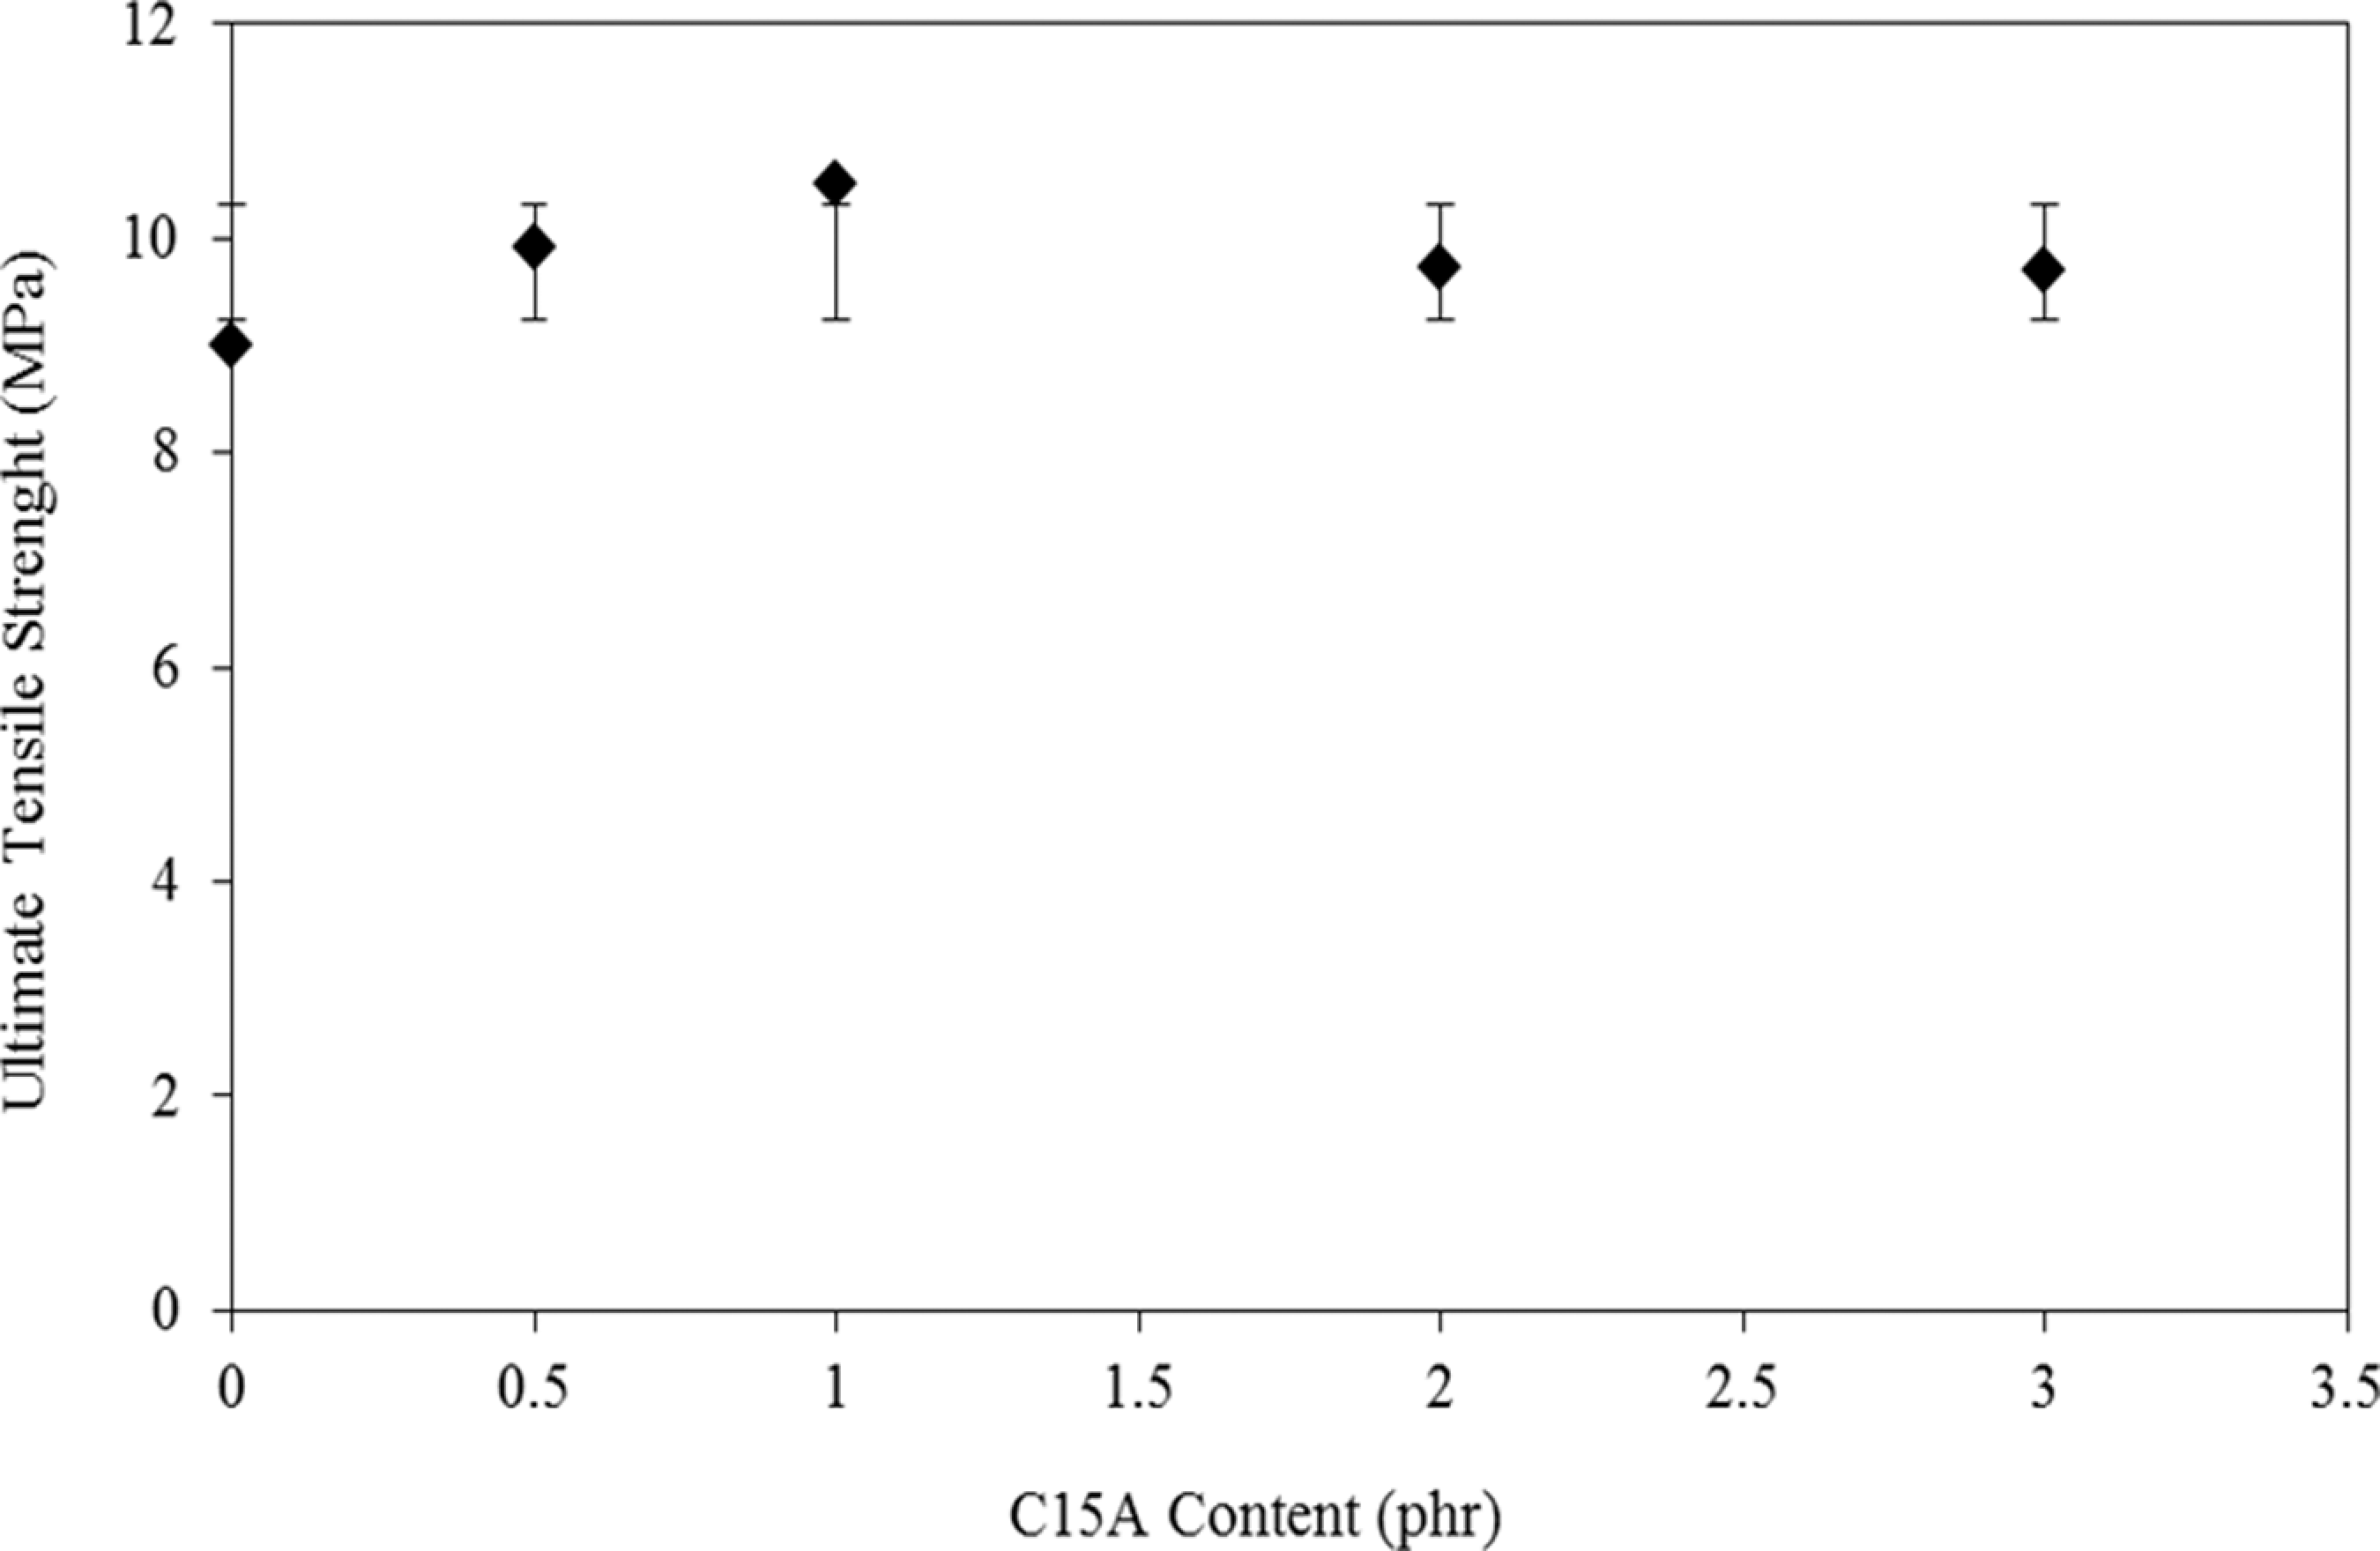
Changes in the ultimate tensile strength of the LDPE–TPCS samples as a function of C15A content. LDPE–TPCS: low-density polyethylene–thermoplastic corn starch.
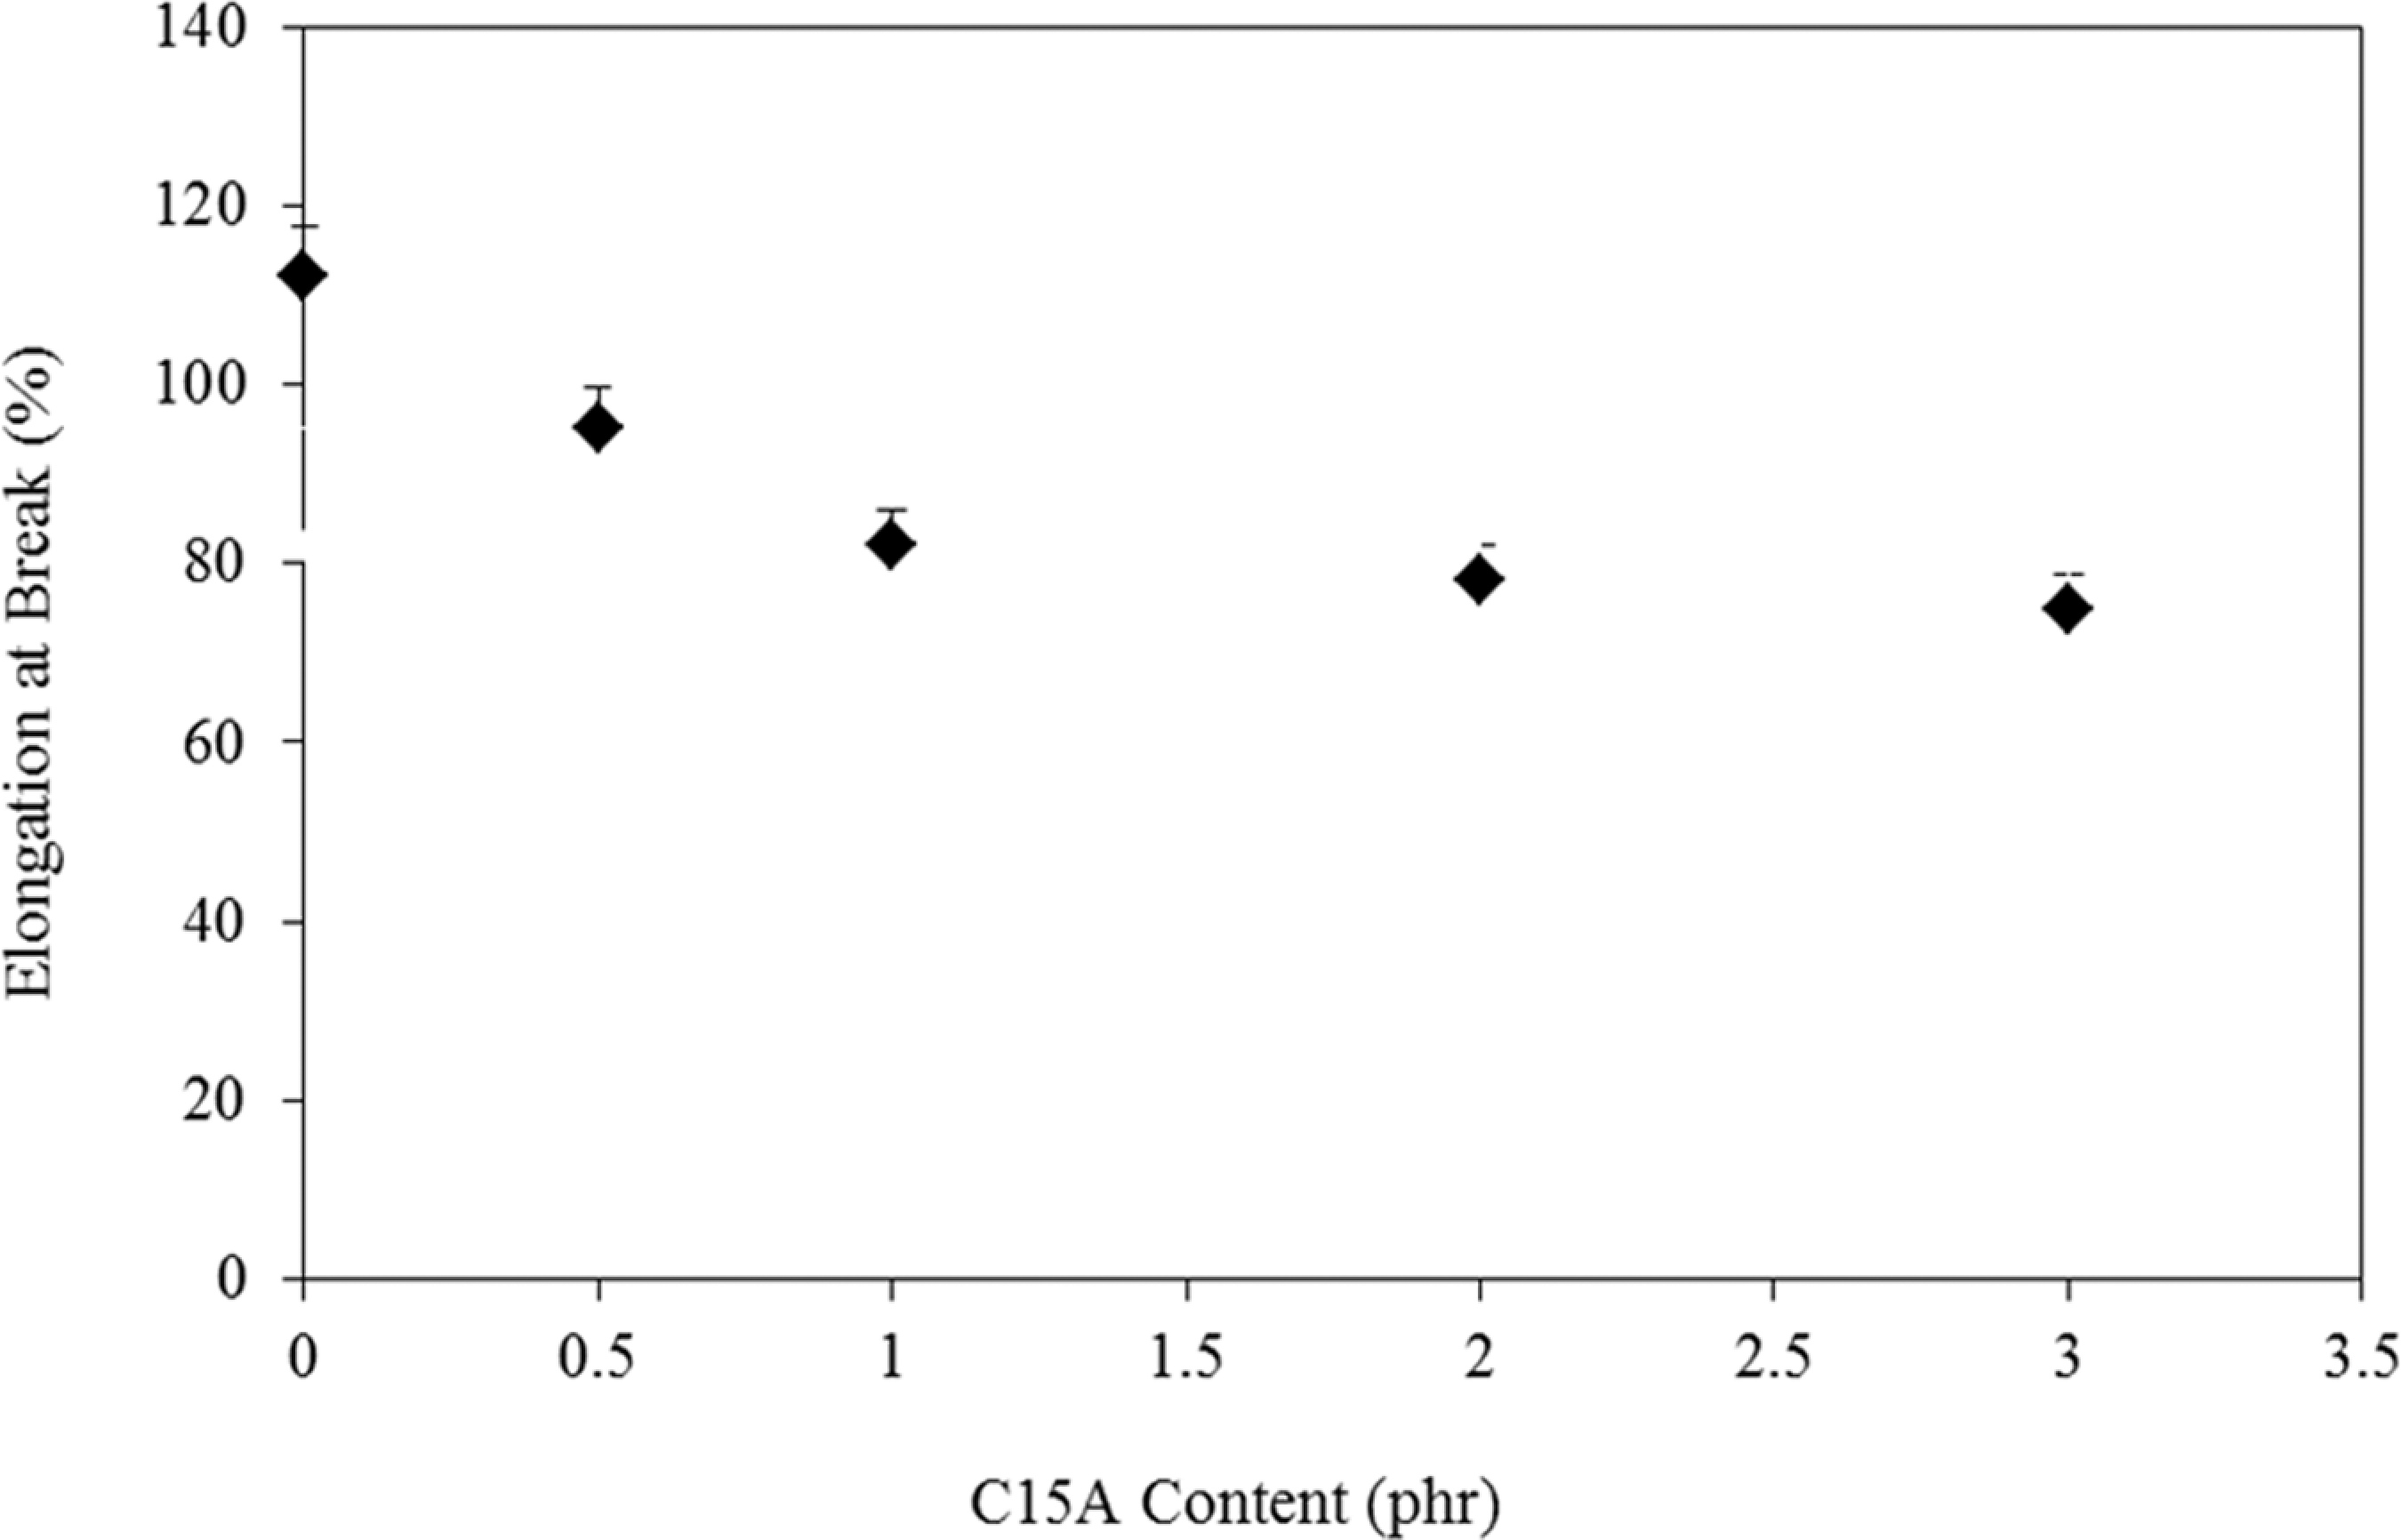
Changes in the elongation at break versus the C15A content (phr) of the LDPE–TPCS samples. LDPE–TPCS: low-density polyethylene–thermoplastic corn starch.
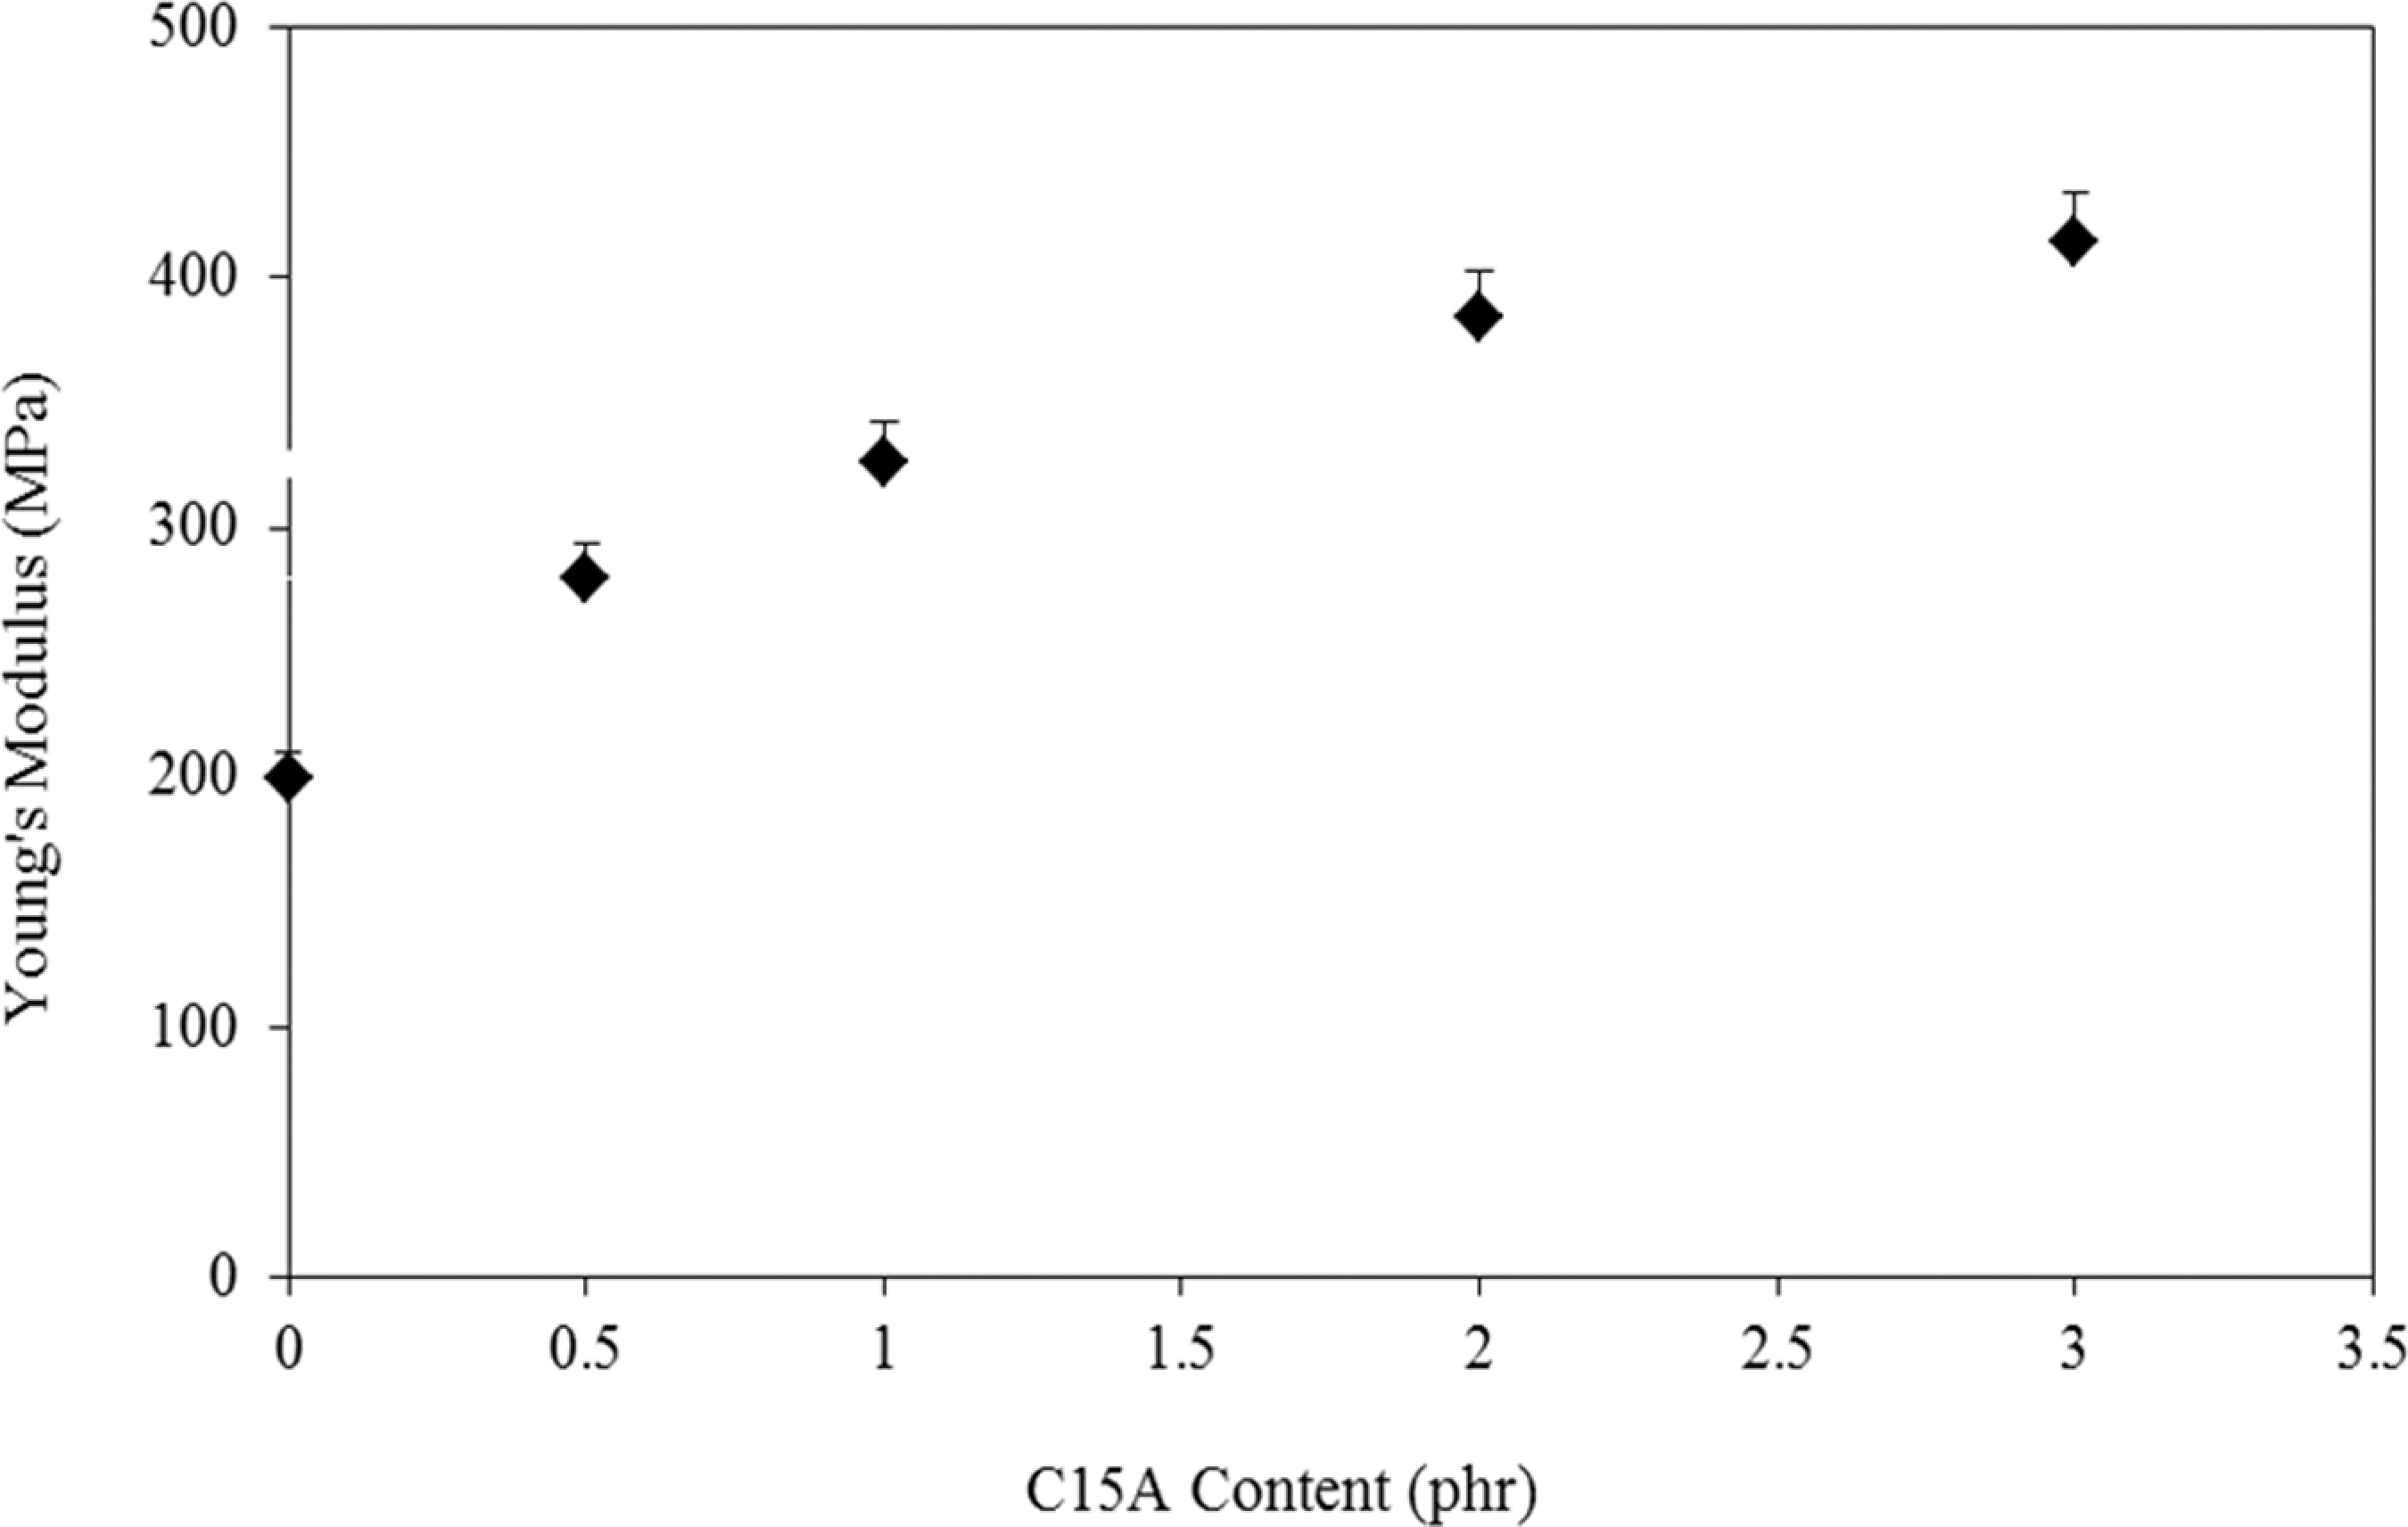
Effect of C15A concentration on the Young’s modulus of the LDPE–TPCS samples. LDPE–TPCS: low-density polyethylene–thermoplastic corn starch.
From Figure 3, it can be seen that there is a slight increment in UTS as the C15A content increases from 0.5 to 3 phr. It is believed that the presence of more than 1 phr C15A in the blends, which causes phase separation and agglomeration, could be the reason for the lower UTS. 30 It seems that the extent of intercalation or exfoliation is a great contributing factor affecting the amount of UTS. 31 The effect of this factor is lowered using more than 1 phr C15A nanoparticles (see Figure 1). Addition of more than 1 phr C15A seems to produce aggregations and partially intercalated platelets. These aggregations could act as the stress concentrators by reducing the UTS values. 31 Addition of C15A leads to the reductions in ∊ b, which is common in the systems containing nanoclay. The TPCS phase is not only expected due to its action on molecular restriction but is also embrittled by C15A nanoparticles. 32
Figure 5 shows that addition of C15A nanoparticles to the polymer blends increases Young’s modulus of the samples, and more increase in E is obtained by increasing the amount of C15A. The stretching resistance of the oriented backbone of the polymer chain in the clay gallery, bonding by hydrogen interaction, causes increase in the Young’s modulus. 33 It is been reported that the Young’s modulus is not dependent on the interactions between the filler and the matrix but restriction in mobility of the polymer chains by increase in C15A content, which can be responsible for increasing Young’s modulus. 19 Similarly, the modulus increment and elongation at break decrement of the plasticized starch-based materials containing OMMTs have also been reported. 20,23
Figure 6 shows changes in the MFI values of the LDPE–TPCS samples with increase in the C15A content. As can be observed, with an increase in C15A, the MFI values of all the samples decreased (compared to the reference). As an example, 21% decrement is observed in the samples containing 1 phr C15A. This decrement in the MFI values could be due to the physical interactions between the blend (as the matrix) and the clay particles. As the C15A content increases, the polymer–nanoparticle interactions enhance, causing immobility of the matrix chains between silicate layers. As a result, flowability is also confined. 34
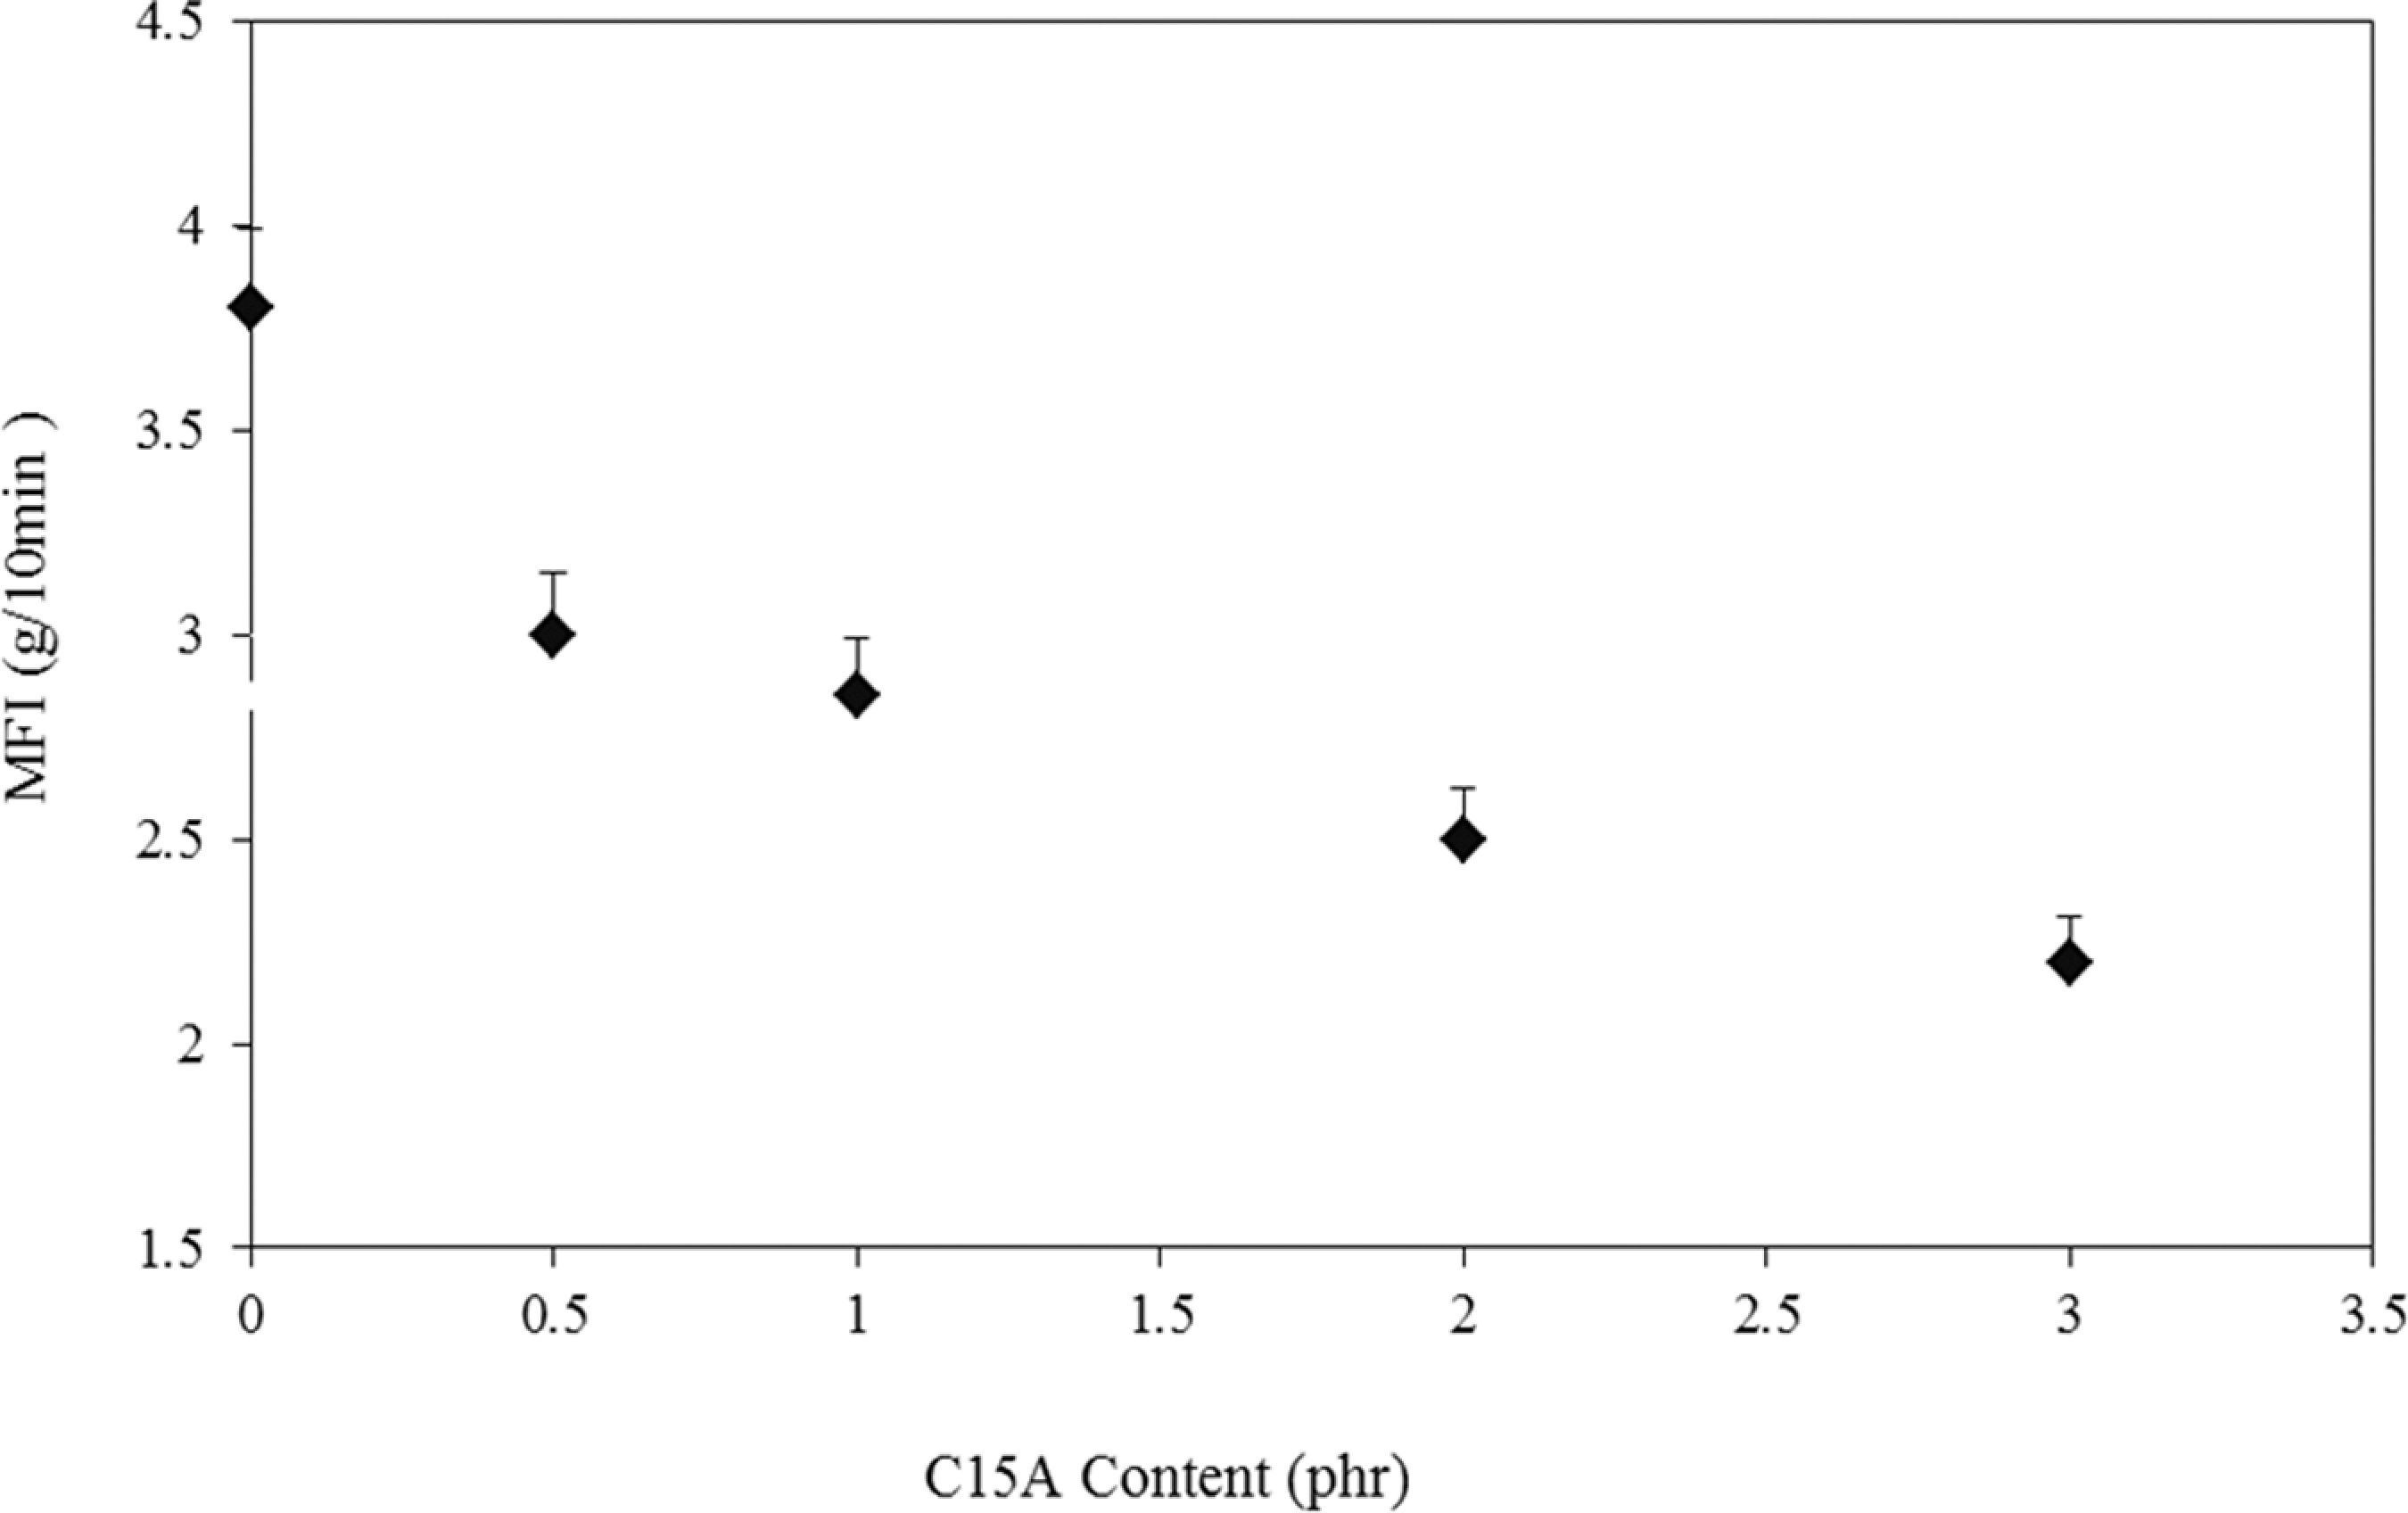
Changes in the MFI values versus C15A content of the LDPE–TPCS samples. LDPE–TPCS: low-density polyethylene–thermoplastic corn starch; MFI: melt flow index.
The apparent viscosity (η) versus shear rate (γ) of the LDPE–TPCS samples is plotted using a double logarithmic scale in Figure 7. It can be seen that as shear rate increases from 0.1 to 100s−1 the apparent viscosity of all the samples decreases, suggesting a shear-thinning behavior for them. An increase in the apparent viscosity at constant shear rate is observed by increasing C15A concentration.
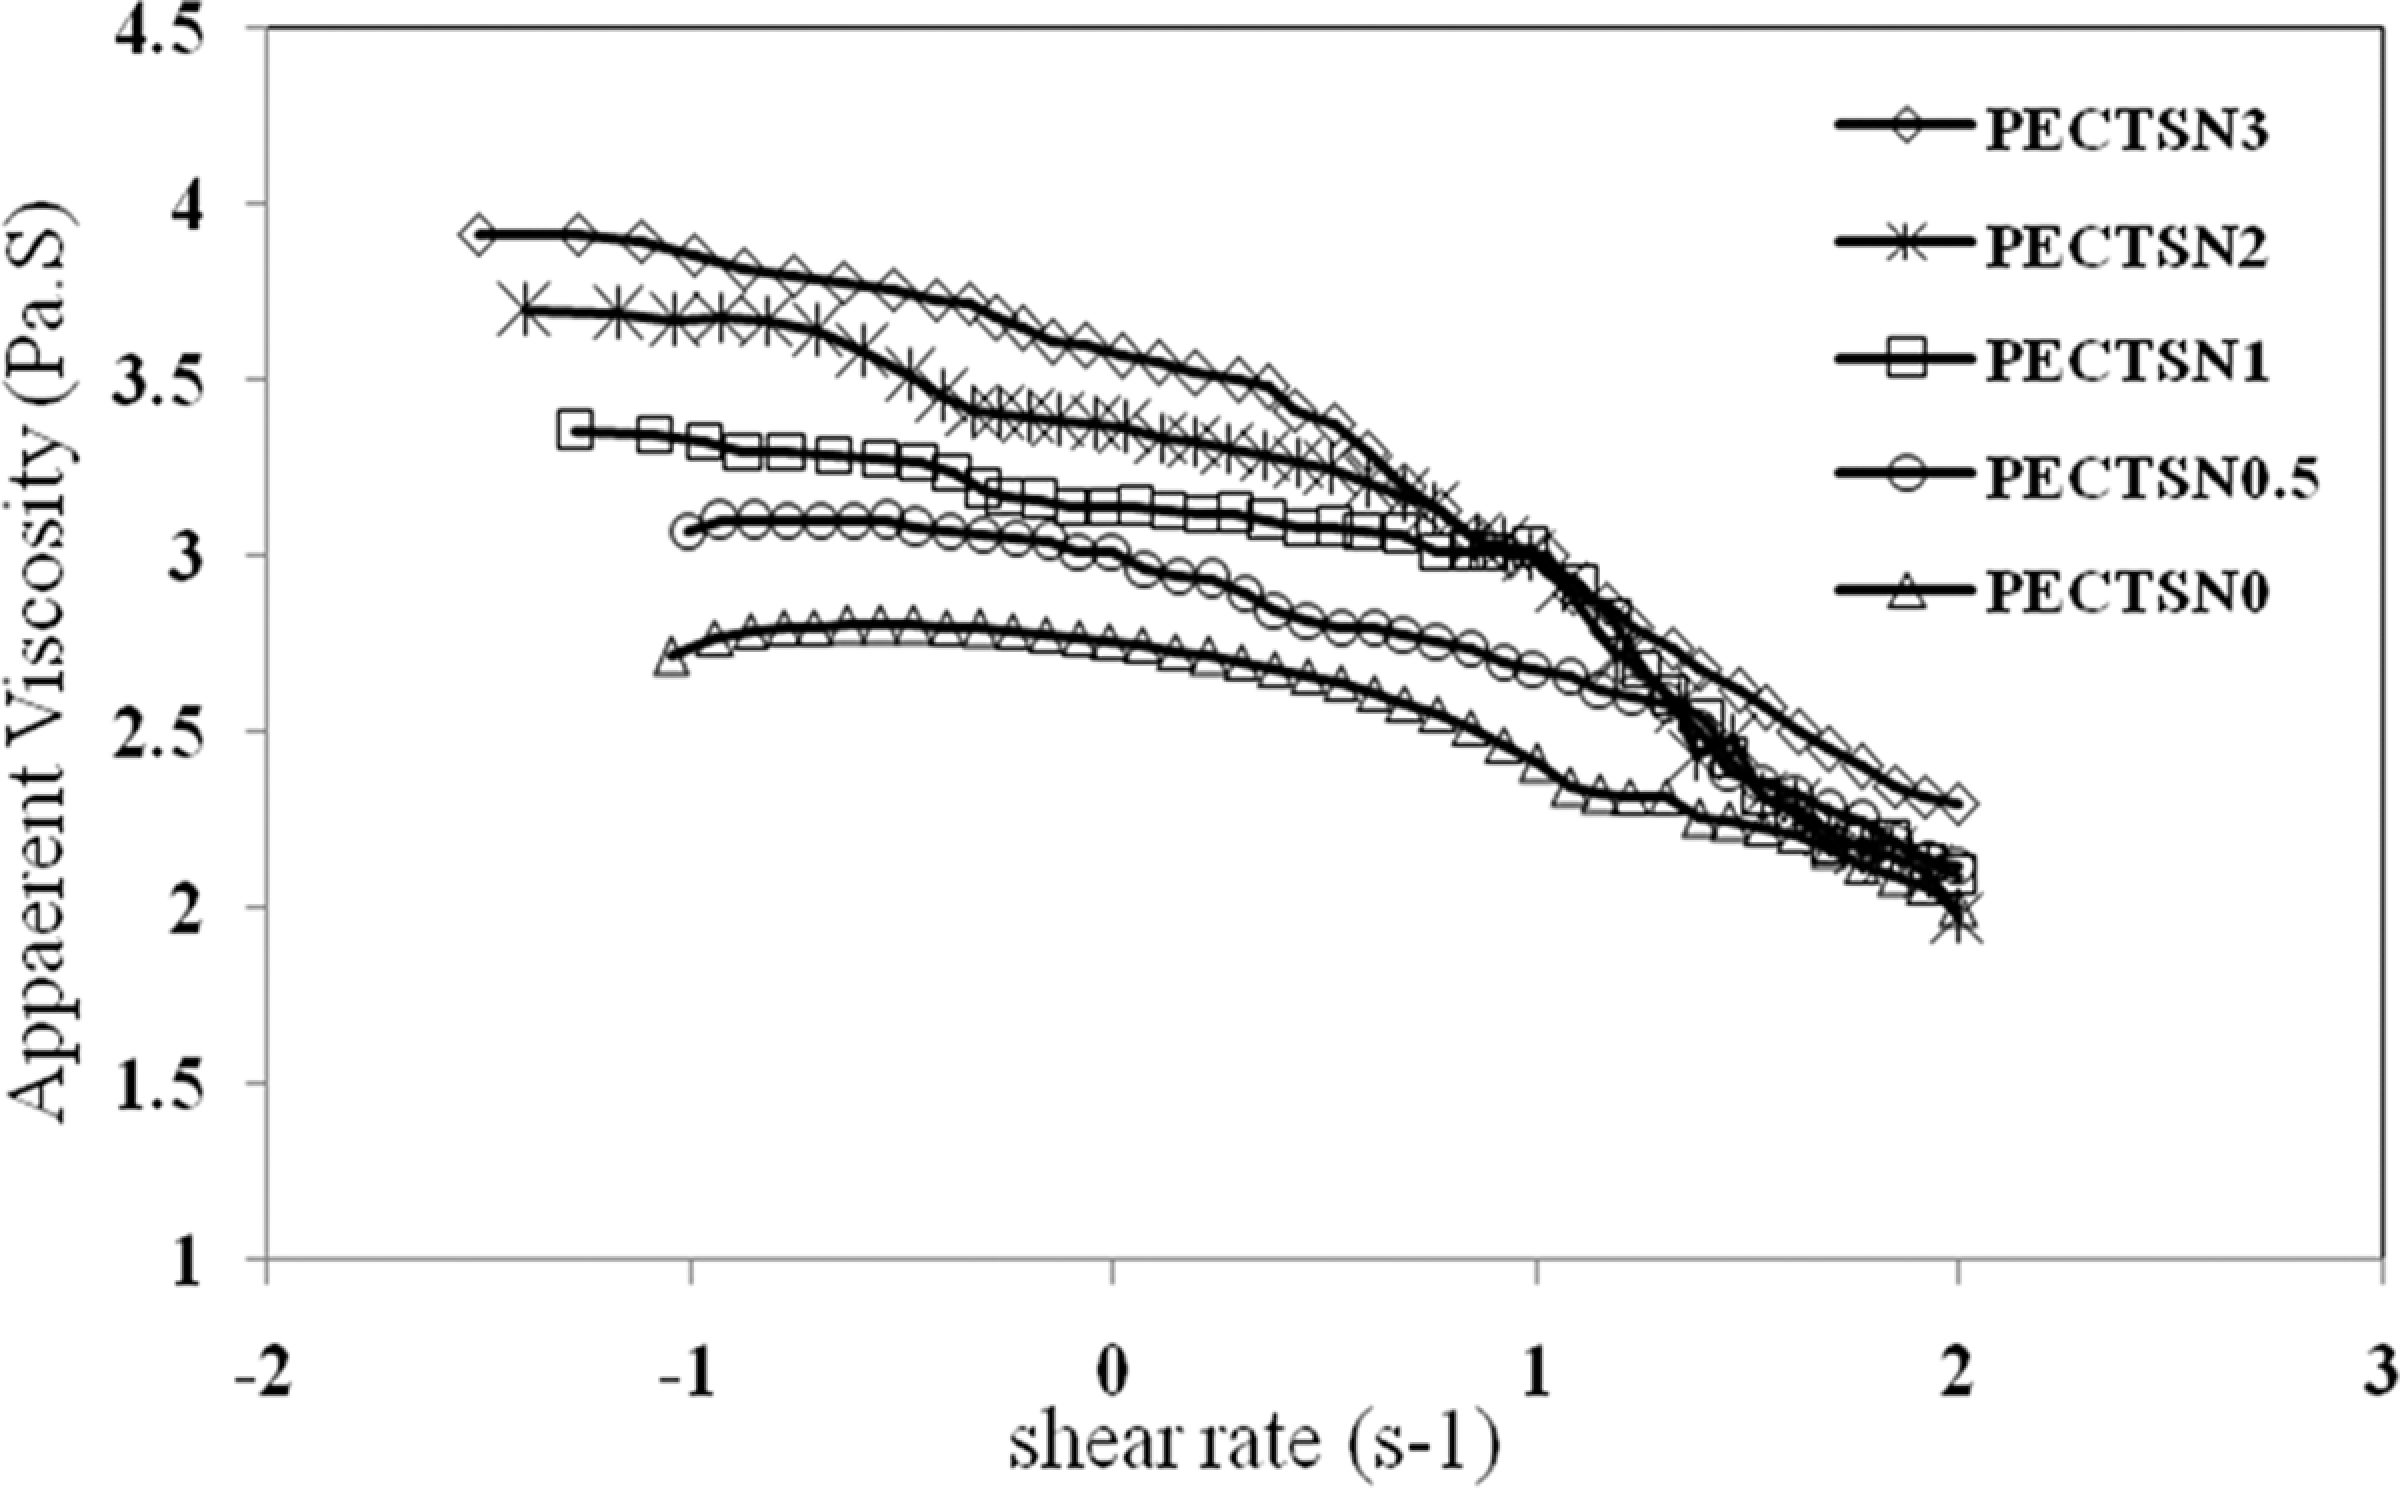
Variation in apparent viscosity versus shear rate of the LDPE–TPCS samples: effect of various contents (phr) of C15A nanoparticles. LDPE–TPCS: low-density polyethylene–thermoplastic corn starch.
The nanoparticles reduced flexibility (or molecular mobility) of the polymers in the blend, lowering flowability and subsequently increasing apparent viscosity. High interactions between the polymer molecules in the blend and nanoparticles could be the reason for such increase in the apparent viscosity. These interactions descend segmental mobility of matrix molecules and confine flowability of the samples. 35
Table 2 shows the calculated consistency index (k) and power law exponent (n) of all the prepared samples. Increase in the C15A content decreases n and increases k values of the samples. As it is seen from the table, the power law exponents of all the samples are less than one, suggesting pseudoplastic behavior for them. It is believed that the agglomeration of nanoparticles increases the n values, while intercalation of them reduces it. 36 Thus, on the basis of the samples, due to the realignment of polymer chains with nanoparticles under shear flow, the samples show shear-thinning behaviors. 37 In addition, increase in pseudoplastic behavior with an increase in C15A content may be the result of layer alignment of the nanoparticles and changes in the microstructure of random mode to the oriented types. 36
Consistency index (k) and power law exponent (n) for the LDPE–TPCS samples.
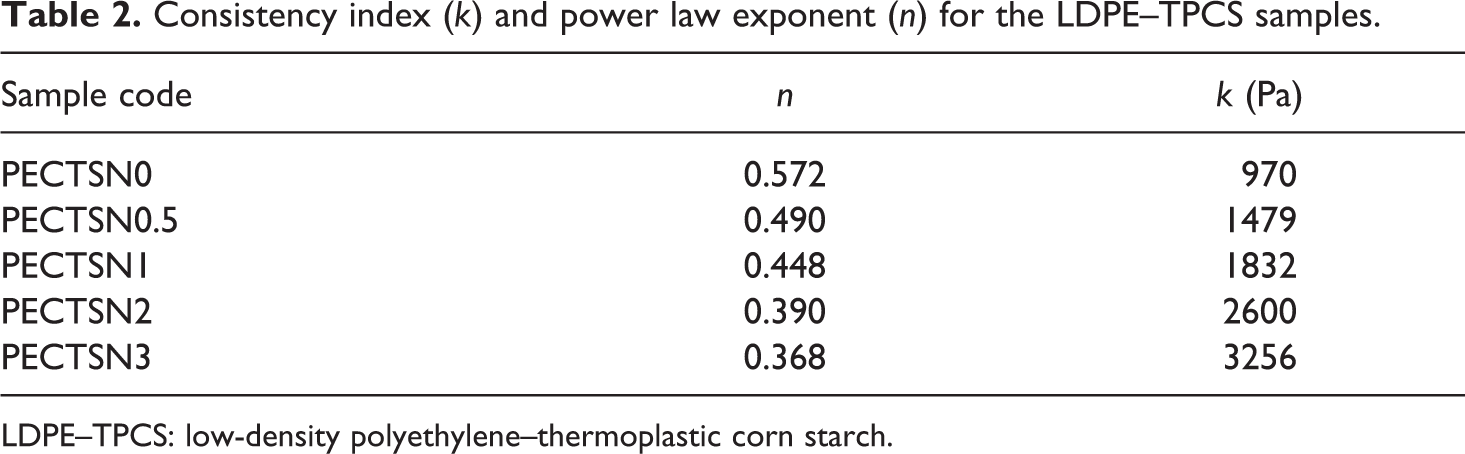
LDPE–TPCS: low-density polyethylene–thermoplastic corn starch.
Water absorption
Figure 8 depicts the water absorption percentage of the LDPE–TPCS samples as the function of both C15A concentration and the immersion time. The diffusion coefficient (D) of water in all the samples is also calculated from equation (2) and listed in Table 3. As can be observed from the figure, rapid water absorption is observed for all the samples during the first 5–12 days of the immersion time followed by a slow increase. After 30 days, the saturation of the samples occurs, and a steady state value of water absorption is achieved.
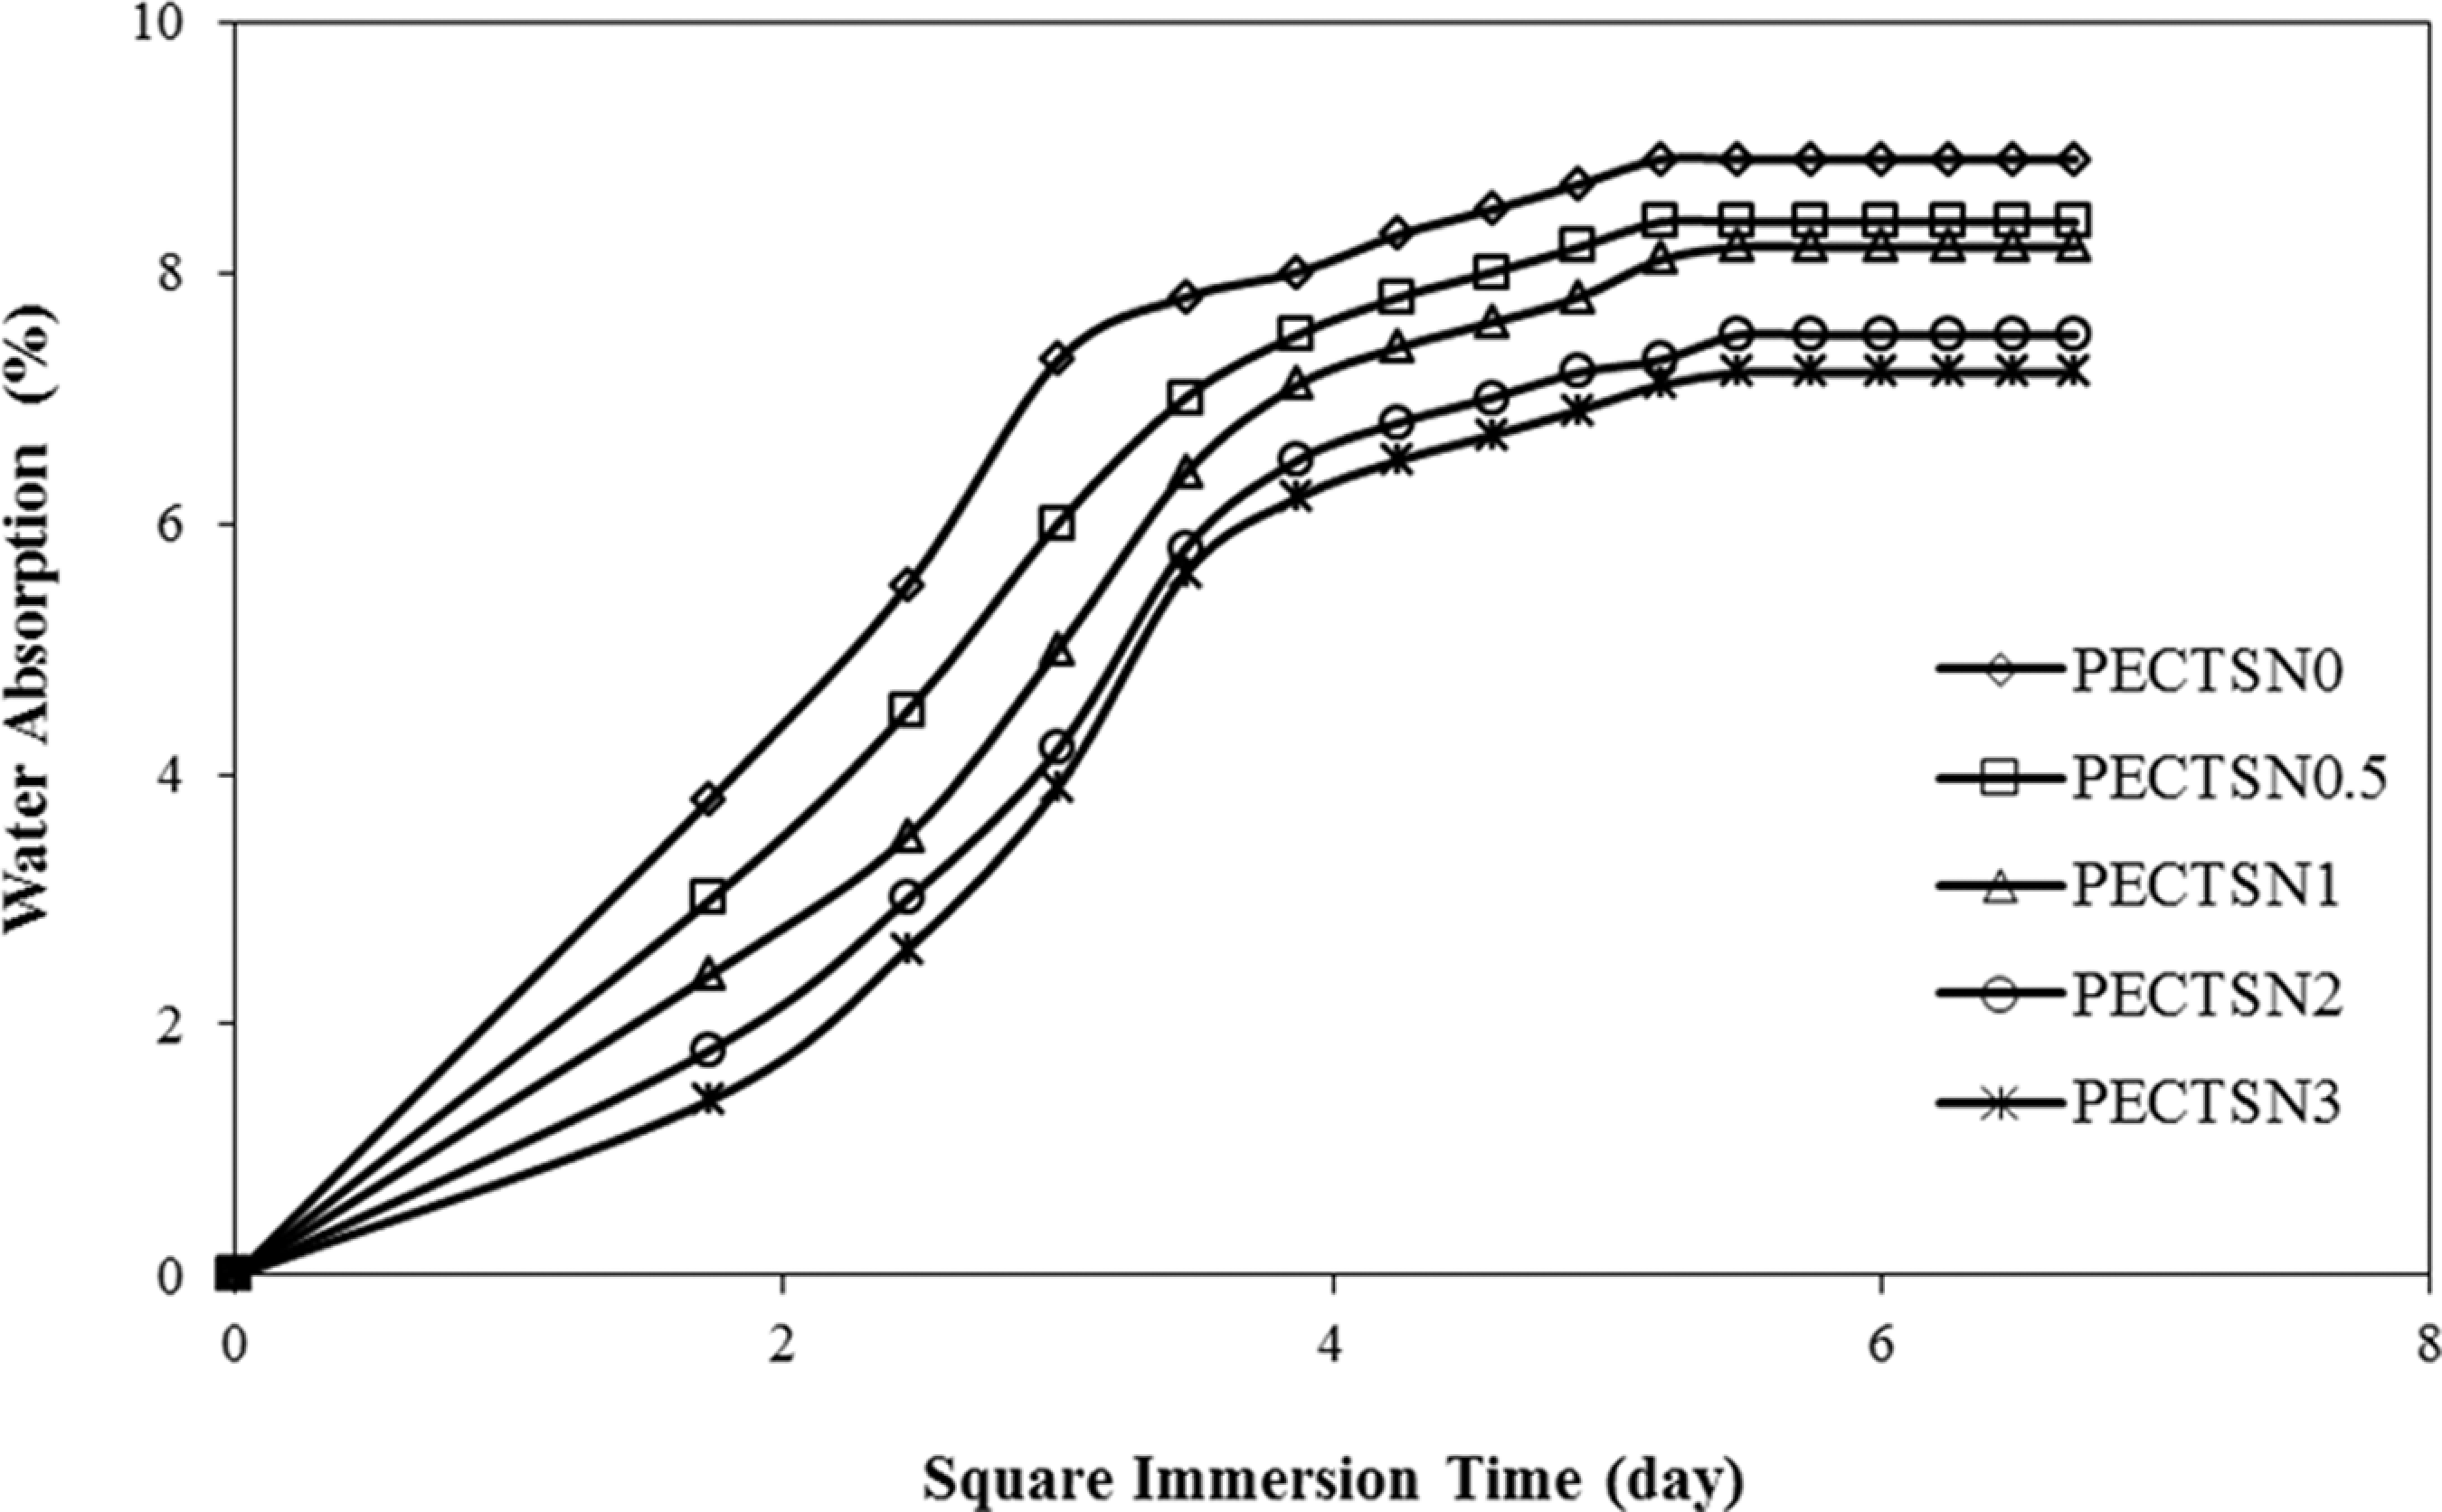
Variation in water absorption of the LDPE–TPCS samples versus immersion time (day): effect of various contents of C15A in the samples (a day = 24 h). LDPE–TPCS: low-density polyethylene–thermoplastic corn starch.
Diffusion coefficient of water for all the LDPE–TPCS samples.
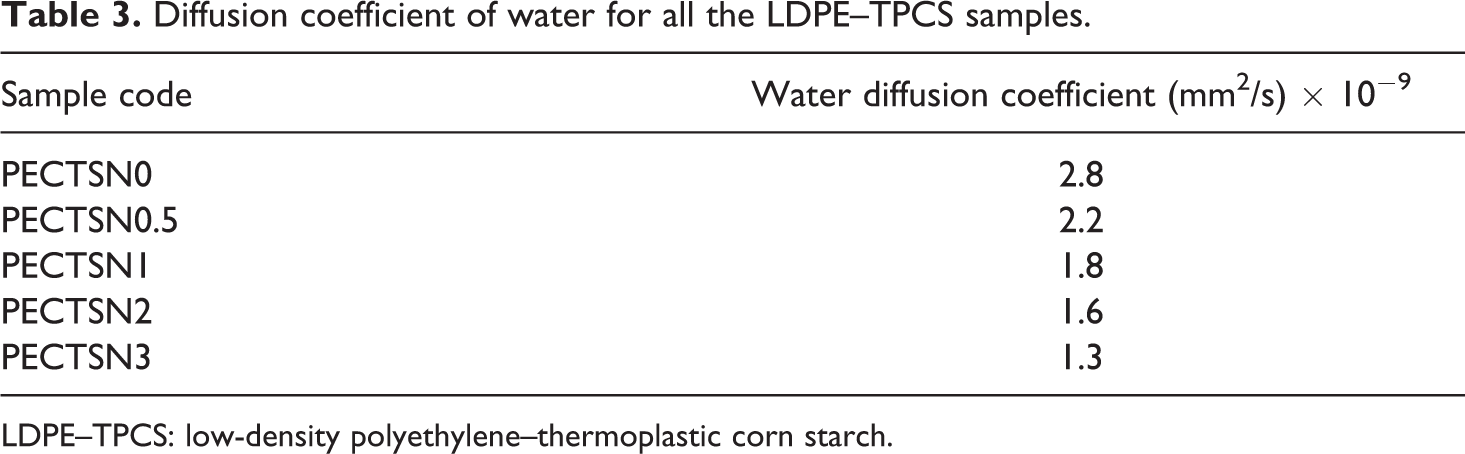
LDPE–TPCS: low-density polyethylene–thermoplastic corn starch.
From the obtained results, the nanoclay-containing samples show lower water absorption and subsequently smaller diffusion coefficients compared with the control sample (i.e. PECTSN0). Approximately 6% reduction in the total water absorption is achieved by adding 0.5 phr C15A nanoparticles in the blend. Increase in the clay content to 1, 2 and 3 phr in the blends results in the reduction of 8%, 16% and 20% water absorption, respectively.
The hydrophilic nature of starch leads to the water absorption in the samples that causes loss in their tensile properties and as a result increases in the rate of biodegradability. 38 Because of the constant TPCS content (25 wt%) in all formulations, the observed differences in water absorptions among all the samples can be attributed to the presence of nanoclay. 20 Incorporation of clay and increasing its content would improve the water resistance of the prepared samples. It is believed that the tortuous path constructed by the exfoliated-layered silicate acts as a barrier for the water diffusion inside the samples 20,39 ; but, some of the clay layers in the intercalated samples could form a staircase-like arrangement that creates a more tortuous path for the diffusion of the water molecules. 40 C15A nanoparticles also limit mobility of the polymer chains and decreases the diffusion of water molecules into the samples. If water molecule wants to permeate the samples, it has to pass through the maze channel (tortuous path), which reduces the diffusion rate of water molecule in the sample. 41,42 In addition, conversion of the interior C15A surface nanoparticles from hydrophilic to hydrophobic owing to alkylammonium ion exchange decreases water absorption of the samples. 39 Reduction in water absorption due to the presence of MMT in the polymer blends has also been reported by other workers. 20,33,39
Conclusions
LDPE–TPCS nanocomposites containing different amounts of nanoclay (0.5–3 phr) were prepared using a twin-screw extruder, and their properties were investigated. XRD analysis and a typical TEM image presented intercalated microstructures in all the samples. The tensile property measurements of the samples indicated increase in the UTS and modulus as well as slight decrease in elongation at break with the incorporation of clay particles. However, in this work, the prepared samples have the desired mechanical properties that would be appropriate for packaging applications. Apparent viscosity of prepared samples reduced with an increase in the shear rate confirming their shear-thinning behavior. There was also a linear relationship between the C15A content and the MFI reduction in the LDPE–TPCS samples. We believed that all the environmentally friendly samples in this work could be bioassimilated by combined biodegradation and humidity absorption in the environment after being used.
Footnotes
Funding
This research received no specific grant from any funding agency in the public, commercial or not-for-profit sectors.