
Abstract
This study presents the experimental characterization of new thermoplastic elastomers that comprised polypropylene and waste tire rubber (WTR). The processing was investigated to obtain standard tensile test samples. Particles and matrix compatibilization has been examined and the melt flow index was found to be a suitable way to determine the best ratio of compatibilizer. Additionally, standard mechanical tests were done on selected blends that have convenient compatibilizer concentration. Dynamic mechanical analysis tests have been carried out and storage modulus and loss factor were drawn as function of temperature. Influence of WTR concentration has been examined through quasistatic tensile tests (
Introduction
Among the numerous environmental problems currently faced by the world, one of the most preoccupant is the management of the waste rubber provided by automotive products. Since these rubber materials are the result of complex synthesis, they do not decompose on natural way and their recycling requires profitable solutions. According to the European directive 1999/31/CE, the tire producers in European Union must collect and promote recycling channels. Many solutions for reclaiming waste rubber as secondary raw material have been proposed. If the recycling proposals are rather elaborated for the range of large particles, the final purpose for the smaller size has to be investigated. Indeed, the biggest size particles (1–3 mm) may be used in asphalt mixtures. 1 The underneath particles may be managed as the substitution for geological matters; for example, Yilmaz and Degirmenci 2 applied particles of diameter under 1 mm in masonry applications. Concerning small particles, Chettah 3 used powder of 0.3 mm diameter in sound muffling walls. Another track to reclaim the smallest particles is to add the thermoplastic polymer as reinforcement inclusions. The introduction of elastomeric inclusions in thermoplastic matrix is a classical technique to improve their impact strength. For instance, Bucknall et al. 4 toughened polymethyl methacrylate (PMMA) matrix by filling it with core-shell rubber particles. Van der Wal et al. 5 have formulated some polypropylene (PP)/ethylene propylene diene monomer (EPDM) blends for automotive applications and studied the effects of rubber content, particles size and matrix crystallinity on the mechanical properties of obtained melange. They also investigated tensile characteristics, impact strength and brittle–ductile transition. Blending waste tire rubber (WTR) with thermoplastics appears as a promising way to reclaim it. Awang et al. 6,7 have worked on the processing and properties of PP filled with WTR. The main problem is that PP matrix and WTR particles are immiscible that leads to a poor interfacial adhesion, consequently to a high interfacial tension. High interfacial tension might induce particles clustering, voids formation and other defects during processing. This fact is largely discussed in the relevant literature and a solution to overcome this drawback is to use a third component as compatibilizer. It helps to form a coating around the particles, and the role of which is to transfer stresses and strains from the matrix to the particles and vice versa. The addition of compatibilizer allows a reduction in the interfacial tension between matrix and immiscible inclusions. Balasubramanian et al. 8 have developed a genetic algorithm based on artificial neural network to optimise some mechanical properties of PP/WTR blends with EPDM and PP-grafted maleic anhydride (PP-g-MA) compatibilizer. In industrial applications, physical and chemical compatibilizers are available. Graft or bloc copolymers are frequently used as physical compatibilizer. Their mechanical properties have to be positioned between those of main phases. The chemical compatibilizer reacts directly with polymers to form a graft interphase. This layer is often chosen softer than the matrix with characteristics close to those of the particles. 9 Some compatibilizers such as epoxidized natural rubber 10 and dicumyl peroxide were tested in literature. 11 Sonnier et al. 11 used gamma irradiation of rubber particles to compatibilize polyethylene and WTR blends. Nakason et al. 10,12,13 and George et al. 14,15 have compared two kinds of compatibilizer, namely, phenolic-modified PP (Ph-PP) and a graft copolymer of PP and MA. These two compatibilizers are compared via the analysis of their rheological properties. Some authors related blends viscosity to the interactions between phases and found that the increase in the compatibilizer concentration increases the blend viscosity. Usually, they used particles of small size, around 10 µm or less (e.g. Van der Wal et al. 5 ). However, the size of WTR particles is often bigger than 500 µm. 6 This work has prospected possible applications of the residual particles smaller than 1 mm, which have no outlet. In our case, particle diameters are ranged between 500 µm and 1 mm. The objective of the present work is to formulate various compounds of thermoplastic matrix of PP with WTR used as fillers. Another aim of this study is to link damage process occurring in blends with their microstructure. Five different compositions of PP/WTR blends were prepared by extrusion (i.e. 95/5, 90/10, 85/15, 80/20 and 75/25 wt%, respectively). A graft copolymer, PP-g-MA, has been chosen as a compatibilizer. Three ratios of PP-g-MA have been tested, namely, 10%, 20% and 30% in rubber weight.
The article is organized in the following manner. The next section is devoted to sample processing description and to the experimental tests and results obtained. The influence of the material composition on its mechanical behaviour is discussed in the last section.
Experiments
Material preparation
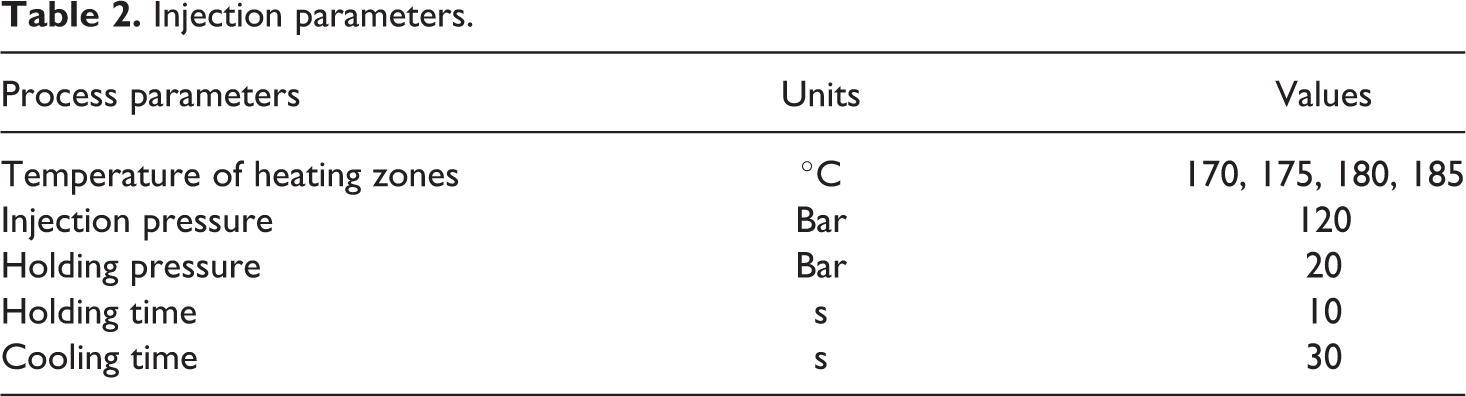
The polymer used as matrix is a homopolymer PP PPH 11012 provided by Total Petrochemicals (Feluy, Belgium), with a high melt flow index (MFI) of 55 g/10 min at 230°C, tested with a mass of 2.16 kg. The fluidity of this grade allows a good coating of the scrap rubber and improves compounding and processing. The powder of tire rubber was supplied by Rubber Bonded System International (RBSI; Teting s/ Nied, France), working in the granulation of car and truck tires. RBS Recycling collects waste tires and grinds them into particles with the intended size between 1 and 4 mm. The particles kept for this study were screened with a Retsch sifter and had the dimensions between 0.5 and 1 mm. The adhesion of the matrix and the rubber particles was enhanced via a compatibilizer: the graft copolymer of PP and MA Orevac CA100 (PP-g-MA) from Total Petrochemicals has been preferred. PP/WTR blends were formulated with blends ratios of 95/5, 90/10, 85/15, 80/20 and 75/25 in weight. For each blend ratio, the same quantities of PP and WTR have been fixed, and the suitable weight of compatibilizer has been added in a ratio with respect to 10%, 20% and 30% of WTR in weight. The obtained blends have been designated by PP/WTR/PP-g-MA code. The first and second numbers represent the ratio of the main components. The third number is a percentage compatibilizer with respect to WTR in weight. The proportions of mixtures studied are given in Table 1. The PP-g-MA was incorporated into the blends during the compounding process by means of a simple screw extruder provided by Soreco (Arbent, France). All the blends have been obtained at a melt temperature of 230°C and a screw speed of 1000 r min−1. After thermal conditioning, the compound was injected in the form of normalized tensile test specimen (NF EN ISO 3167) with the area of cross-section of 4 × 10 mm2 using an injection-moulding machine BOY (see injection parameters in Table 2). The required dynamic mechanical analysis (DMA) specimens were next machined from the tensile test samples. Thus, all the specimens have the same thermal history.
Blends formulation.
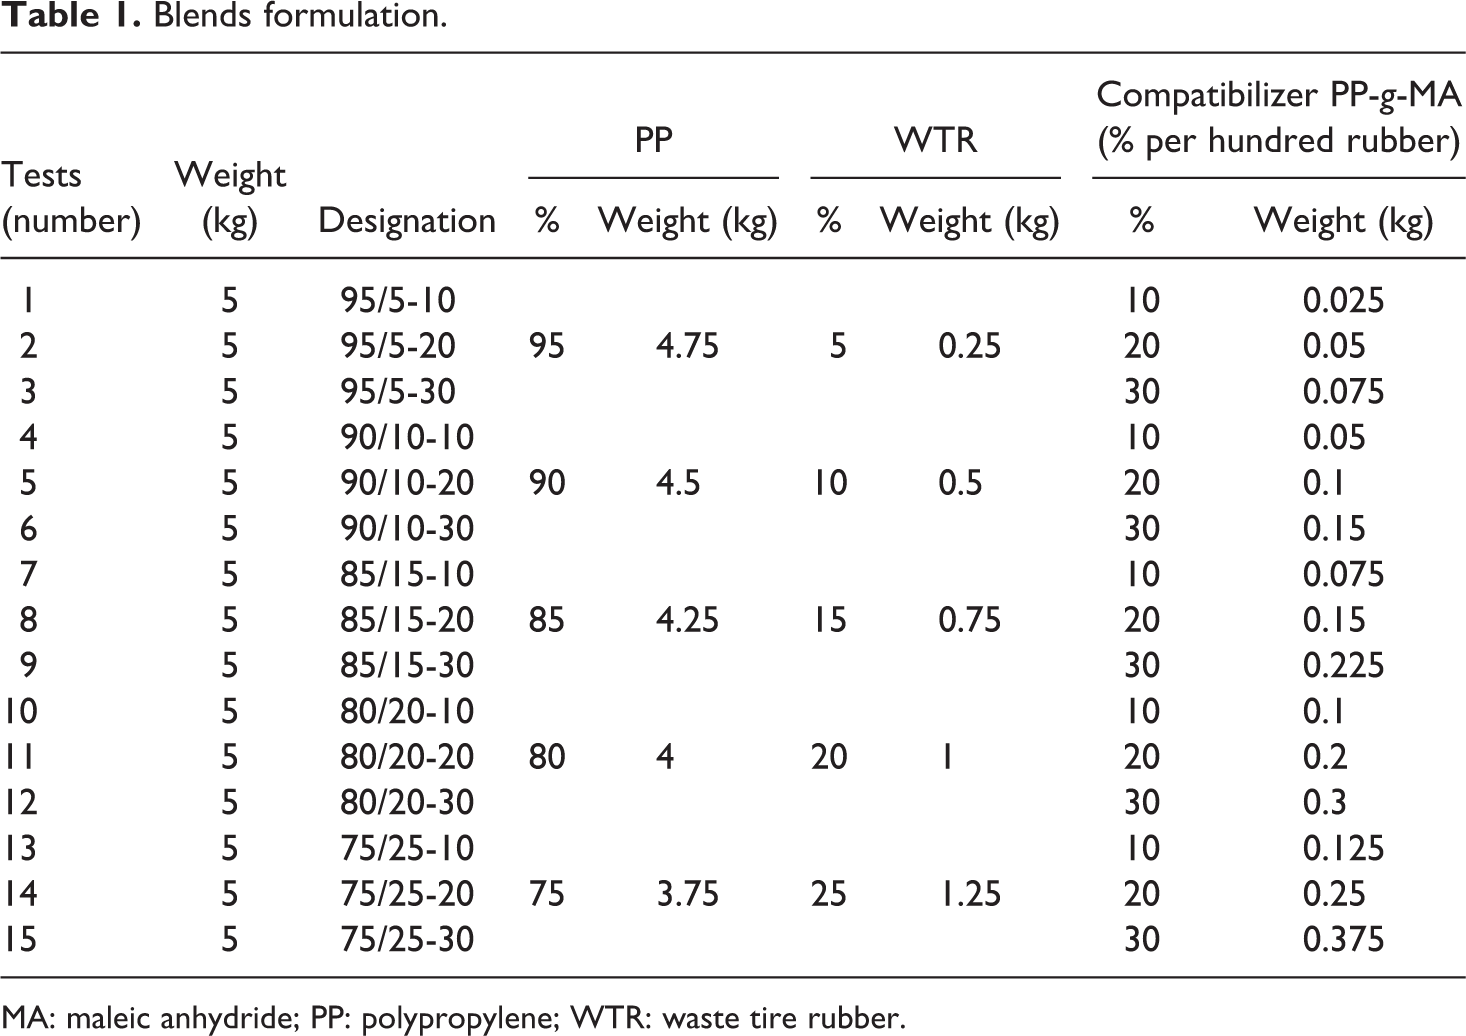
MA: maleic anhydride; PP: polypropylene; WTR: waste tire rubber.
Injection parameters.
Characterization of WTR composition by thermogravimetry
WTR was obtained by grinding various brand tires. Each tire generally comprises several rubbers. Therefore, to investigate the composition of WTR particles, the thermogravimetric analysis (TGA) has been performed on this rubber tire powder by means of the Netzsch Thermogravimetric Analyzer (STA 409PC). The heating rate was kept constant at 10 K min− 1. TGA enables to perform chemical characterization of WTR. Typical percentage mass loss (thermogravimetric (TG)) and differential thermogravimetric (DTG) mass loss rate (derivative of the TG) curves are shown in Figure 1 for the scrap rubber waste. The initial degradation of the scrap tire rubber, between 246 and 363°C, concerned oils (aromatic and/or aliphatic) and the corresponding mass loss attained 12.86%. The second decomposition step in Figure 1 occurred between 363 and 465°C and may be associated with the classical decompositions of rubbers used in tire industry; the global mass loss is estimated to be 40%. The double peak observed in the DTG curve may be attributed to two main rubbers emerging from the scrap tire, that is, natural rubber (NR) and styrene-butadiene rubber (SBR). The peak at 378°C in DTG curve was indexed to NR and the peak at 432°C was indexed to SBR. Their characteristic degradation temperatures are about 376 and 450°C, respectively. 16 At least two kinds of rubbers have been detected. Consequently, some heterogeneity of rubber phase is expected. The further step from 490 to 960°C is typical of the carbon degradation under air; the corresponding mass loss is about 10%. A reaction of decarboxylation may occur after 800°C leading to the formation of calcium carbonate eventually observed in the residual substances. 17 In the next paragraph, the rheological tests carried out on specific samples are presented in order to rank blends in function of compatibilizer concentration.
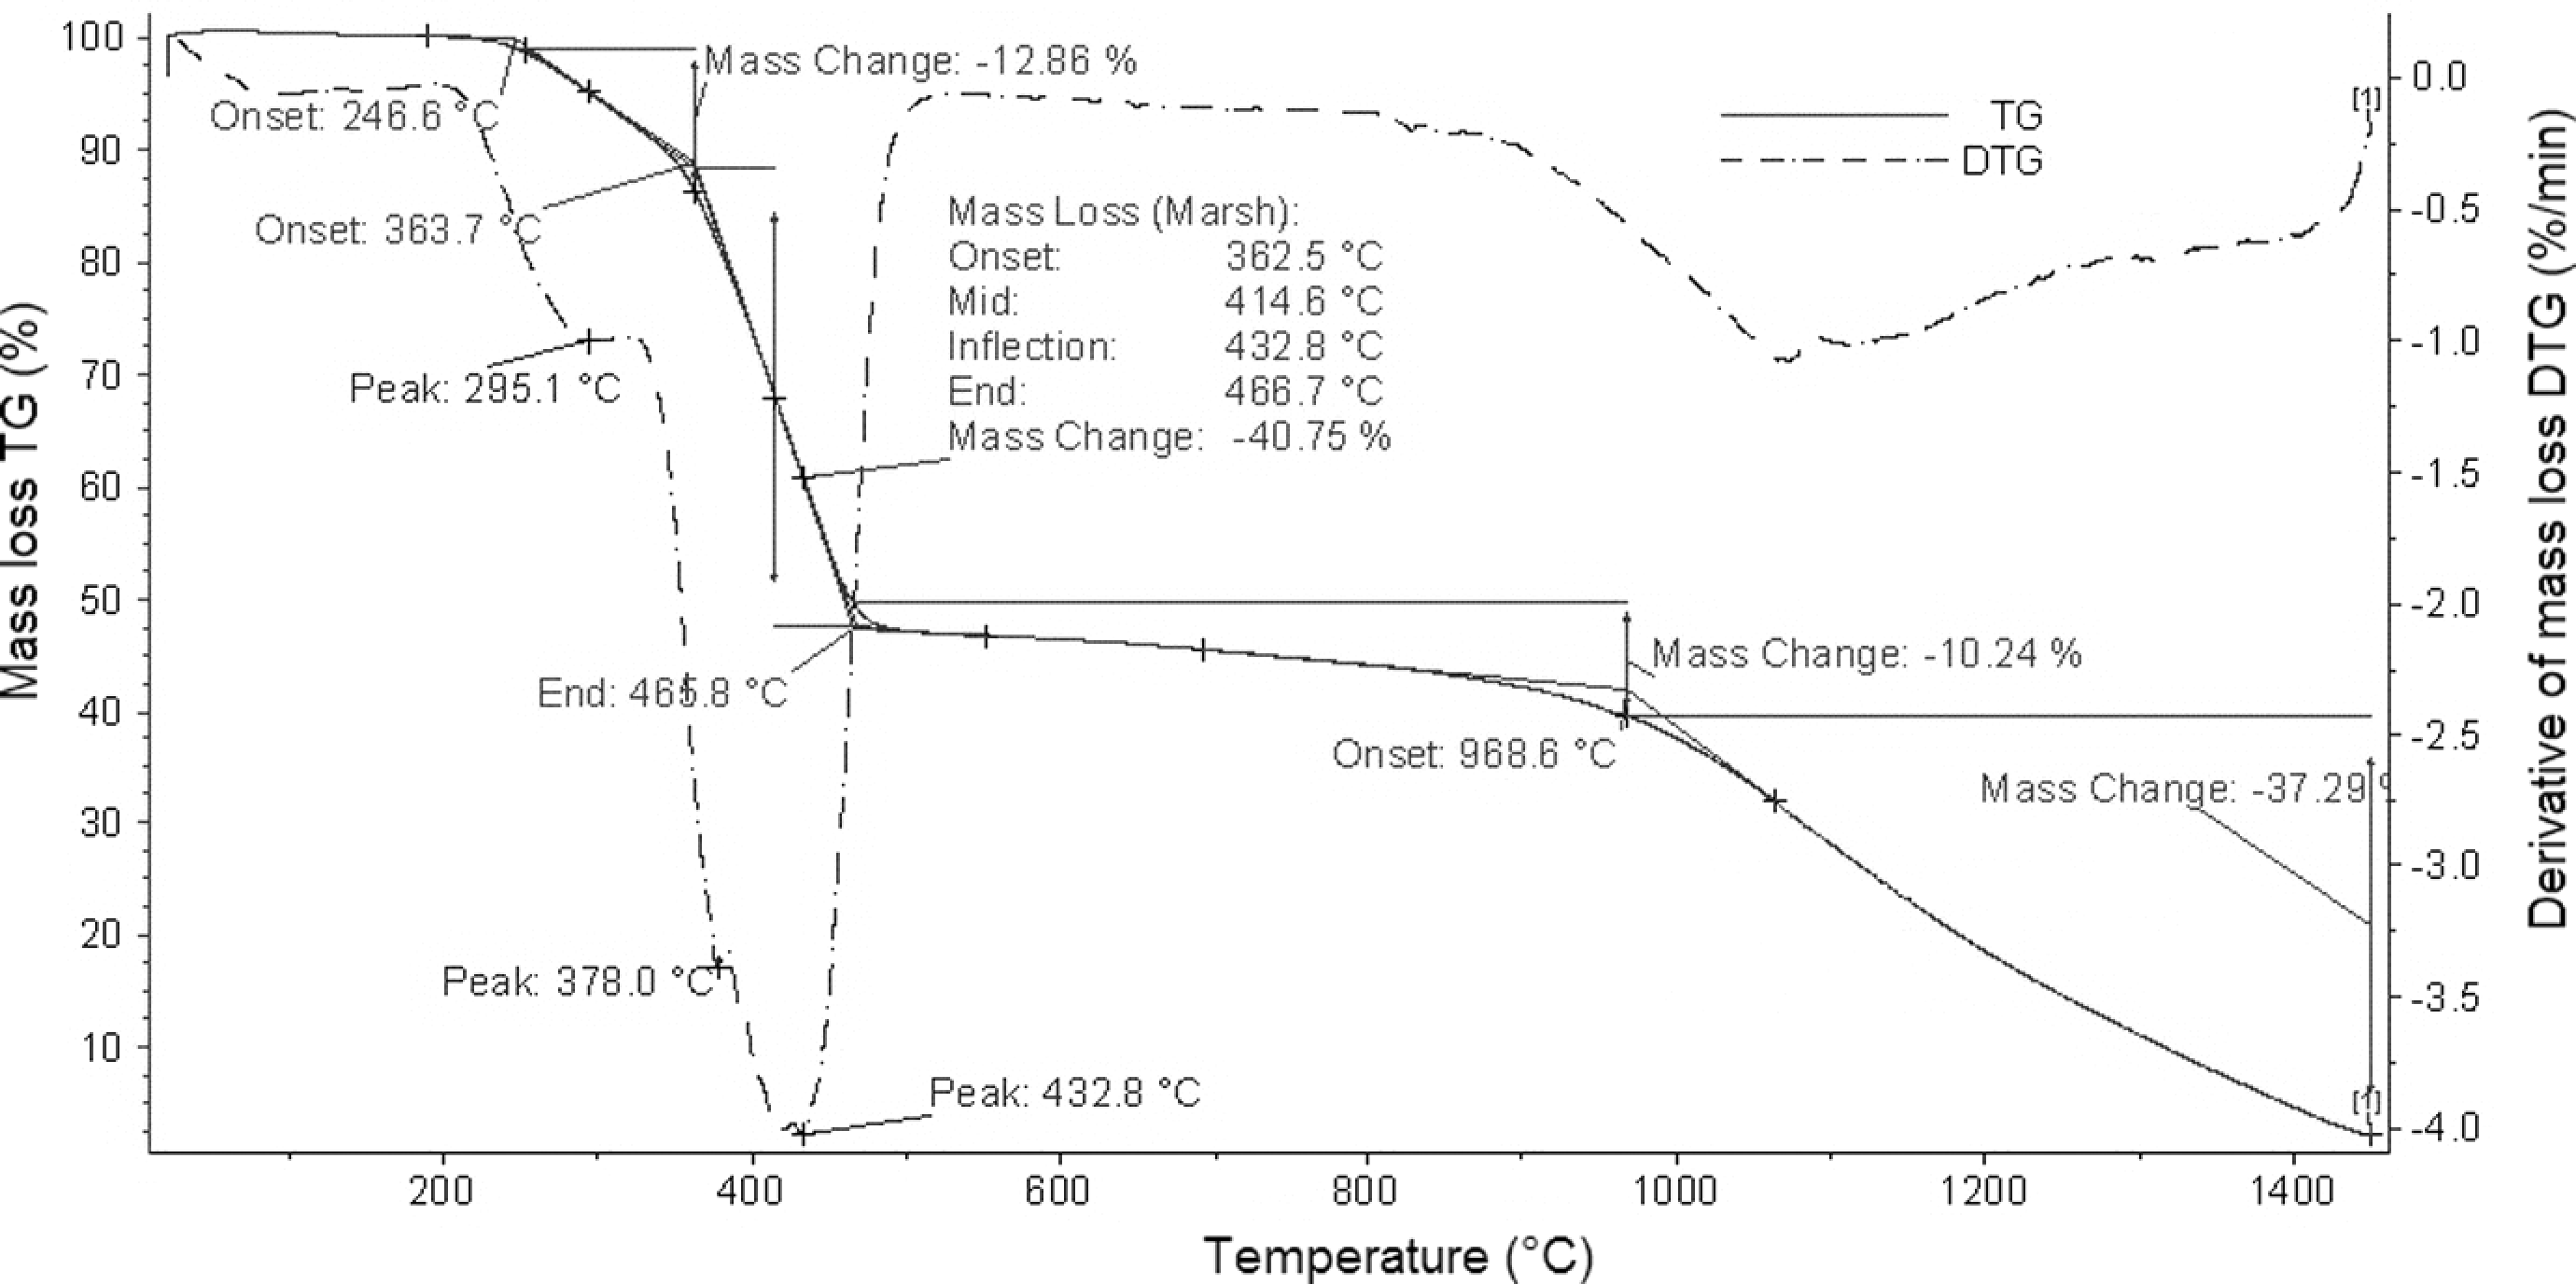
TG and DTG of WTR. DTG: differential thermogravimetric; TG: thermogravimetric; WTR: waste tire rubber.
Rheological characterization of blends
Chemical interactions between different phases of blends have been created by compatibilizers. They consist of segments chemically reactive to their respective counterparts in the polymer pairs. PP-g-MA is a chemical compatibilizer that attacks at the unsaturated locations in the chains; this is provided by nobornene ring that is attached to rubber chain structure. Then the blend viscosity changes with the compatibilizer effect. Consequently, MFI method can be used to rank mixtures by their viscosity and find the best compatibilizer ratio in formulated blends. The MFI of blends has been analyzed to determine their viscosity as a function of the additive percentage of compatibilizer. The choice of the initial ratios of 10%, 20% and 30% of WTR in weight has been led by typical values found in the literature. 10,12 –15 Tests have been performed with TWELVindex extrusion plastometer from ATS Faar (Sodexim SA supplier located at Muizon, France). Three tests for each blend have been conducted at 230°C with a mass of 2.16 kg according to ISO 1133 standard. The average values of MFI have been calculated for each blend in order to observe their evolution in relation to compatibilizer concentration. Some correlations between the MFI values and the viscosity data obtained by capillary measurements have been discussed by several authors. 14,15 Nakason et al. 12,13 demonstrated the construction of viscosity versus shear rate curves from master curves. They have shown that the increase in the compatibilizer concentration first increases the viscosity (i.e. decreases the MFI) followed by the levelling off at higher fractions. This last phenomenon results in the formation of micelles in the PP matrix. The same phenomenon was expected for blends studied in this work. The decrease in the MFI values testifies to the increase in interfacial interactions between matrix and inclusions. Figure 2 shows the synthesized results of our tests. Minimum values of MFI have been found for 20% of compatibilizer concentration for all tested blends except 75/25 composite for which the continuous growth of MFI values has been observed with compatibilizer content. However, it is interesting to emphasise that in this case, the MFI is rather low (about 26–28 g/10 min) indicating a relatively important composite viscosity. Consequently, it has been concluded that the best compatibilizer content for every blend tested corresponds to 20% of PP-g-MA in weight of rubber. Subsequently, it was decided to continue the mechanical study on samples elaborated from compounds with 20% compatibilizer ratio. Therefore, image analyses, DMA and tensile tests presented in the following section have been conducted only on these five blends.
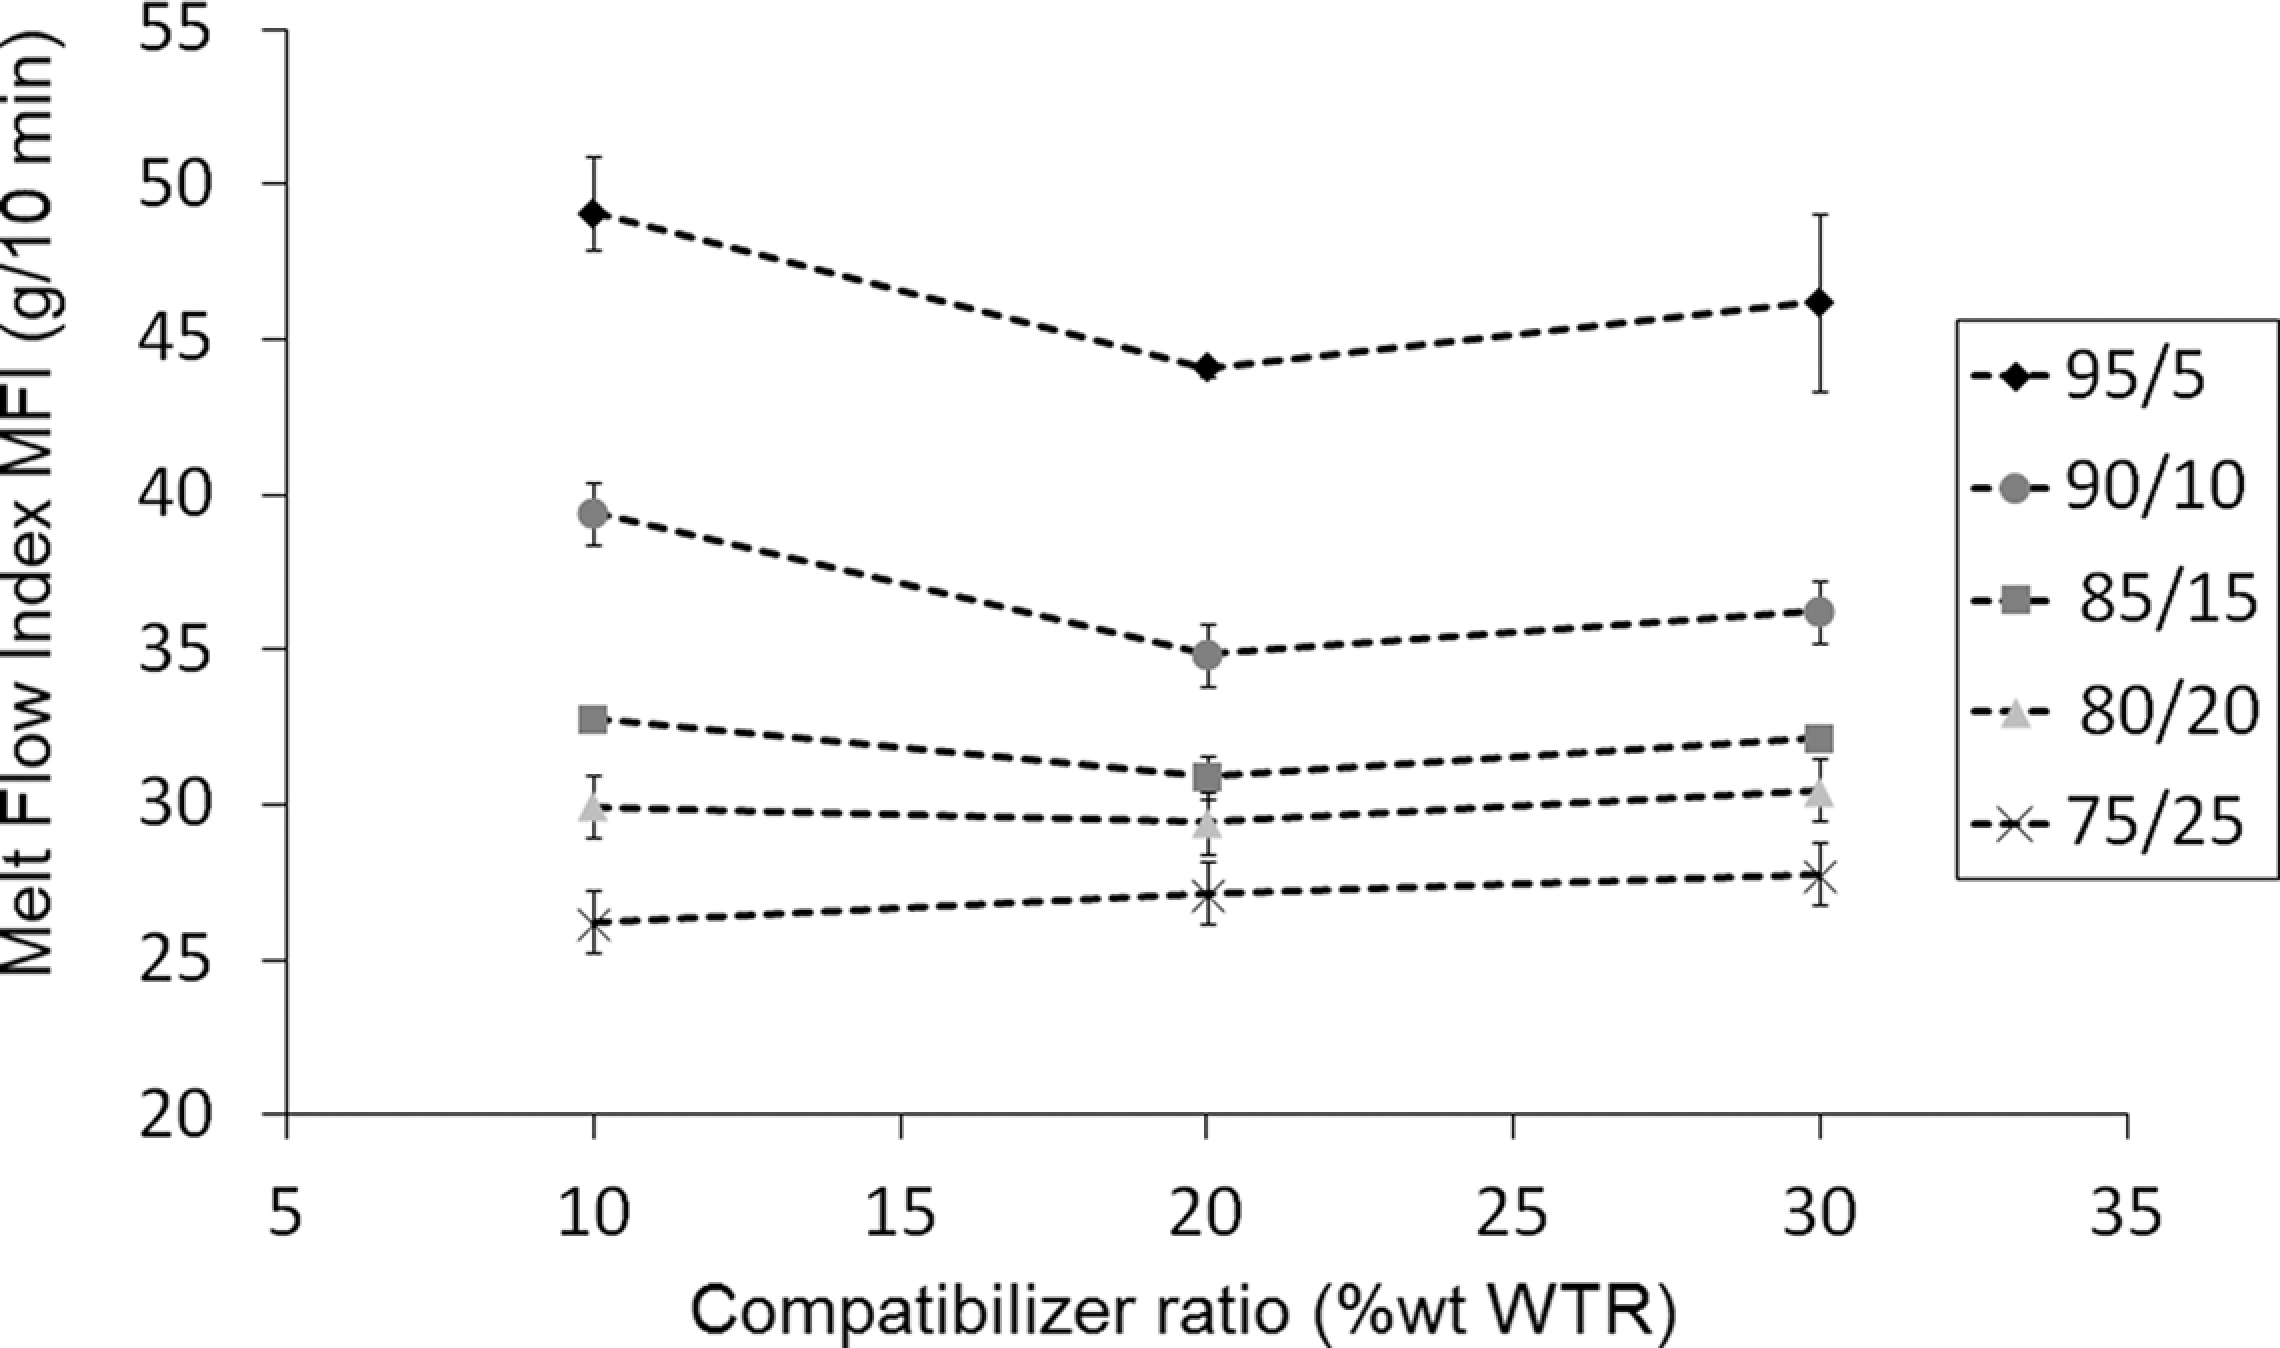
MFI values of blends versus compatibilizer content. MFI: melt flow index.
Tomography image analysis
The microstructure of a composite material is an important factor influencing its mechanical properties. Hence, it is crucial to characterize the volume fractions, particles distribution and particles shape of tested samples. Image analyses have been made by a tomography system (Nanotom Phoenix X-Ray) with a spatial resolution of 1/2000 of the object size. The reconstruction of three-dimensional (3D) sample objects has been performed next. Then 3D objects were sliced into three stacks of two-dimensional images allowing analyses with free software Image J (Figure 3). With the aid of developed plug-in, image analyses have provided some useful data concerning volume fractions, particles dispersion, morphology and possible bubble occurrence. Particles shape has also been observed in order to connect the damage phenomenon initiation to this geometric characteristic. It was found that WTR particles have complex polyhedral shapes. Their size is included between 0.5 and 1 mm with rare dispersal particles in the lengthwise dimension resulting from sieving process. Additionally, cracks appearance was promoted by plate-face inclusions having perpendicular orientation with respect to loading direction. 18 During debonding under normal stress, cavitations have been observed at the interface. It is important to consider these phenomena while analyzing postmortem sample images. The image resolution in our study is 6.25 µm. Image analyses in x-ray tomography allowed controlling blend volume fractions and dispersion of WTR phase. Volume fractions have been determined with a density threshold on images and the results are presented in Table 3. Values observed with tomography are compared with the theoretical ones calculated from the targeted weight fraction. The volume fractions obtained by image analysis are close to theoretical ones calculated with mean rubber density of 0.95 g/cm3. As shown by TGA presented in previous paragraph, there are two kinds of particles in WTR. They are also visible in image density histogram. Another important characteristic in composite material is the spatial distribution of particles. Quadrat method 19 has been used to analyze the distribution of the particles in blends. The analysis has been performed on 50 images taken through the thickness of gauge part of the specimens. Each image is defined by 1200 × 1200 pixels that are cut into grid of square cells of 300 × 300 pixels. Therefore, the total number of 16 quadrats has been analyzed on each image leading to 800 quadrats for whole analyzed sample gauge zone. The number of particles (Nq) in each cell has been counted and the frequency of the particles apparition has been estimated corresponding to the number of quadrats having Nq. An example of histogram obtained for 85/15 blend showing frequency versus Nq is presented in Figure 4. An ordered particle distribution generates a large number of quadrats with the same Nq. Therefore, the histogram appears as a sharp peak. If particles collapse, two peaks emerge. The first one corresponds to empty quadrats and the second one to quadrats containing numerous particles. The random distribution produces results somewhere in between these two extremes. The histogram of 85/15 blend, shown in Figure 4, is characterized by a large peak localized on Nq = 5. This result testified to a quasi-random repartition of WTR particles. Similar histograms were found for other blends. Therefore, it can be concluded that the specimens had random distribution of fillers and no clusters were formed during material processing for all particle concentrations tested.
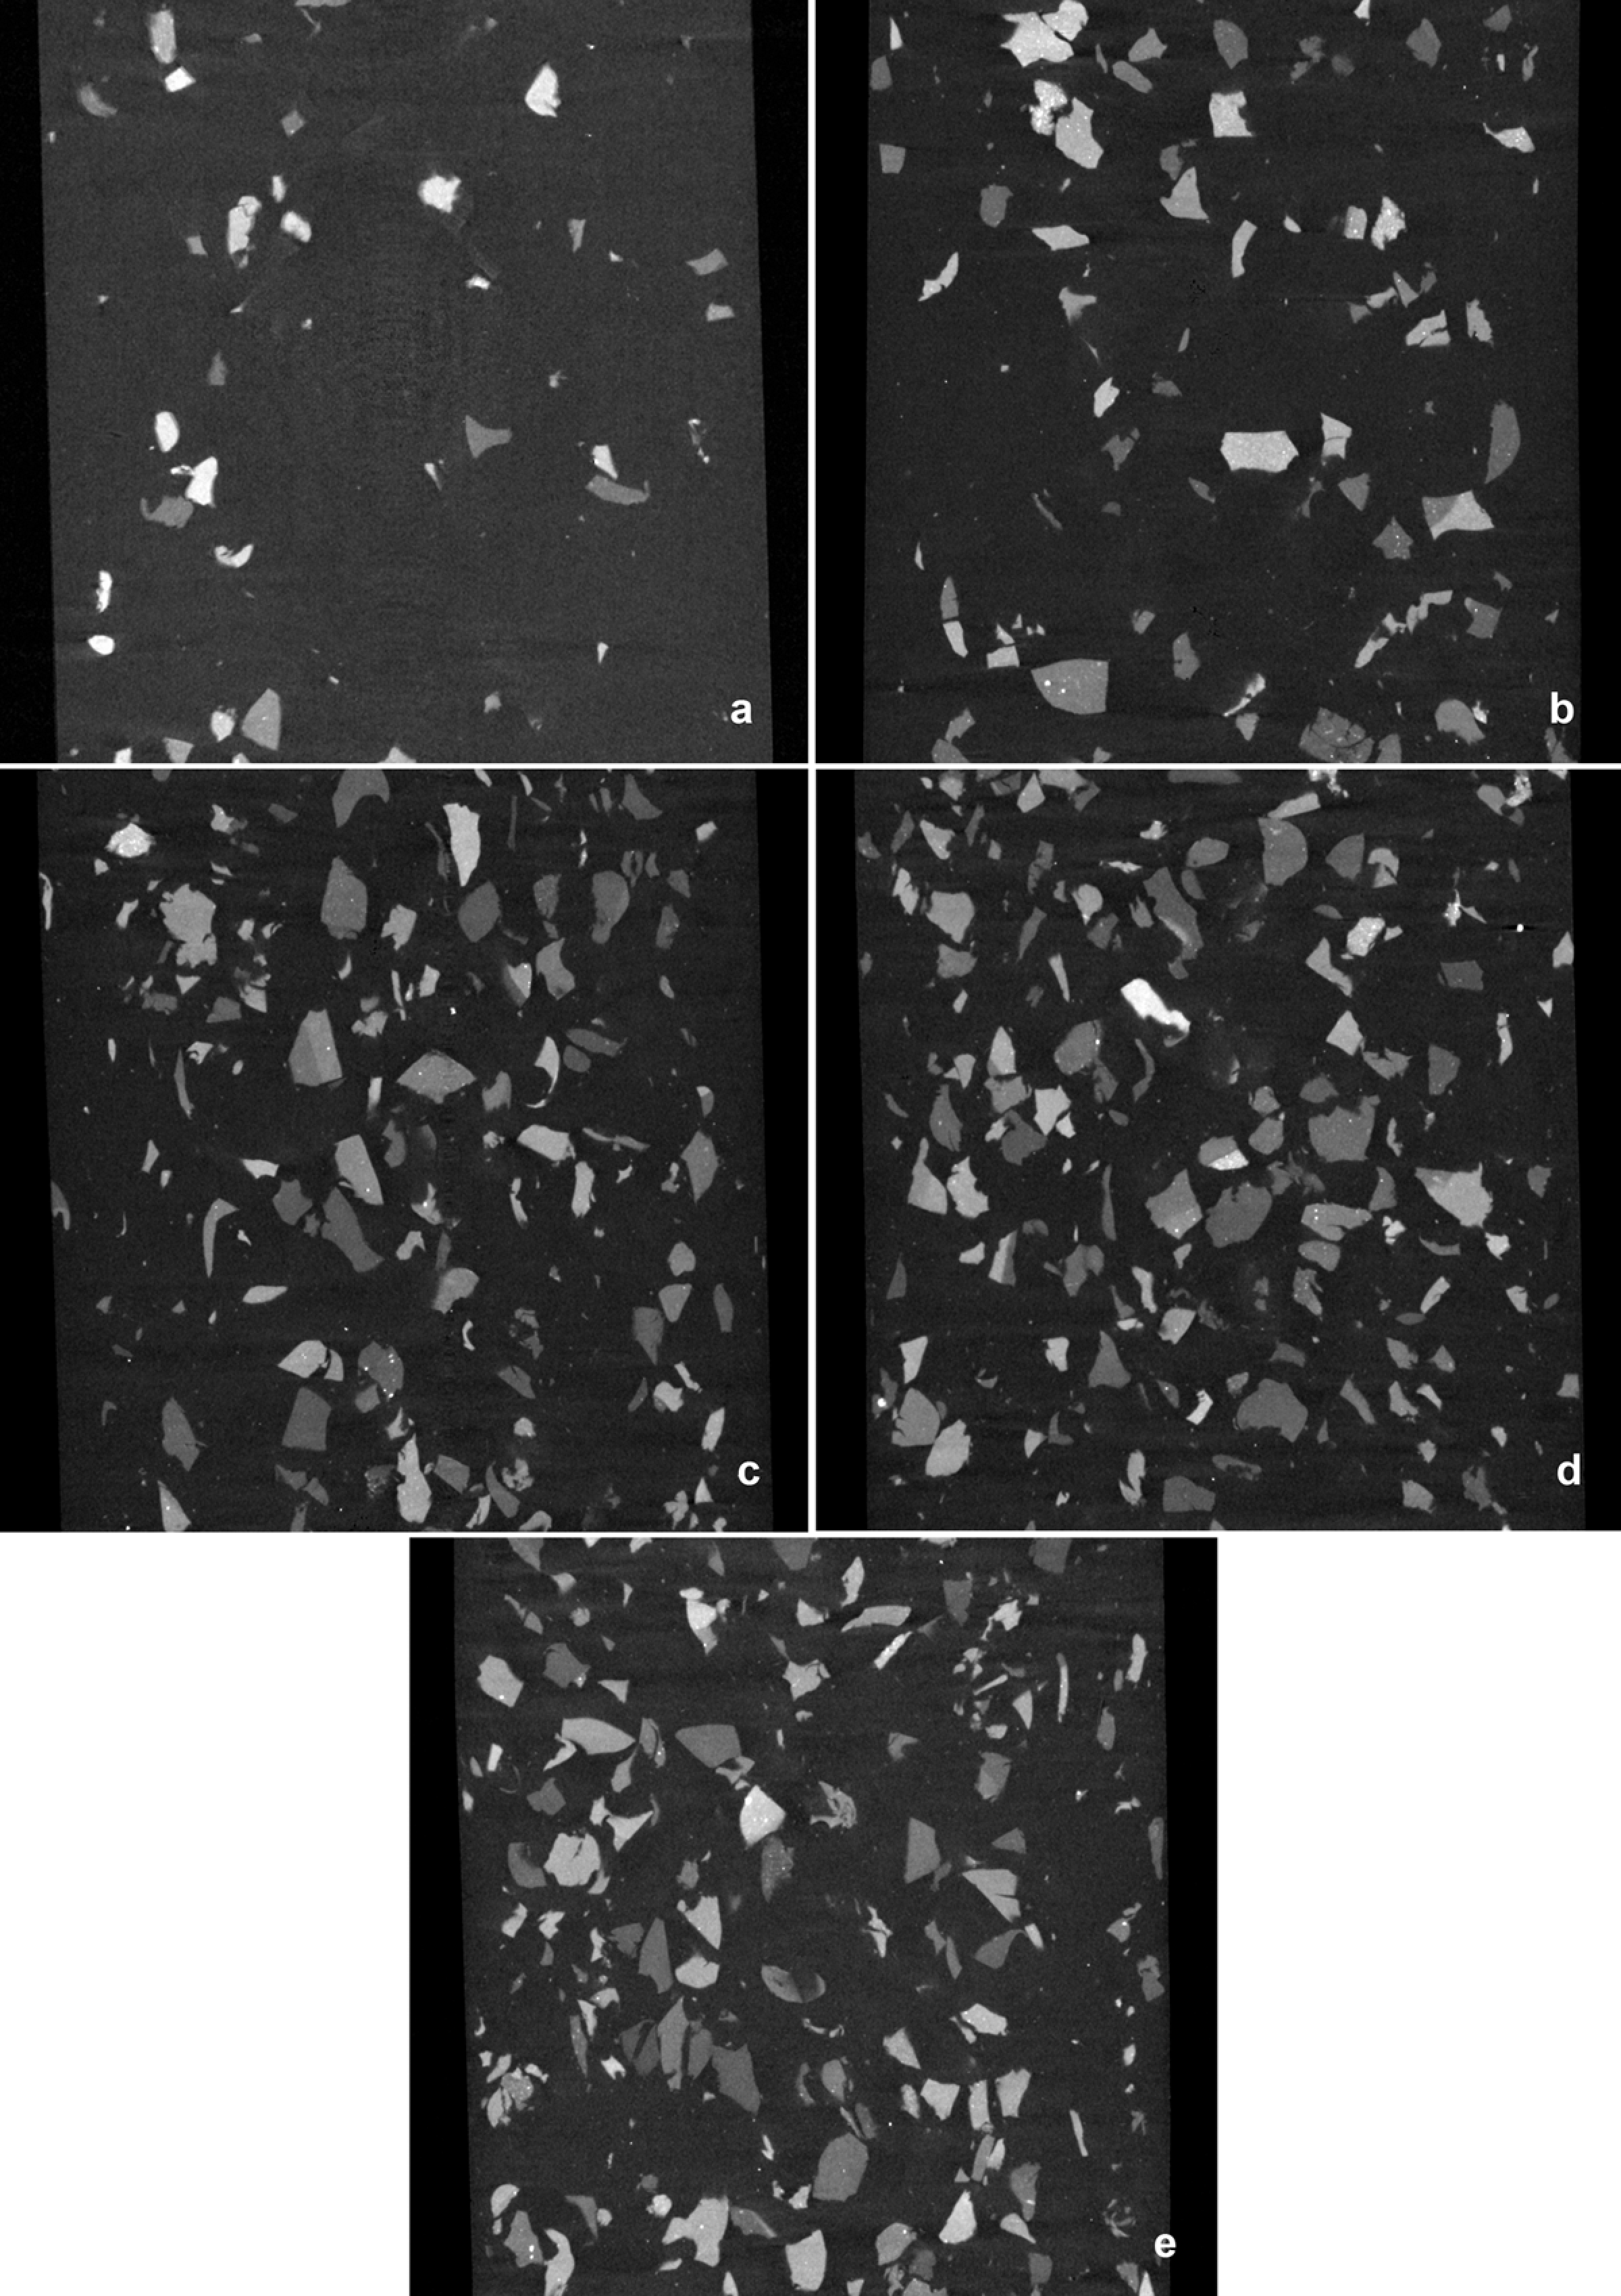
Tomography images of PP/WTR blends: (a) 95/5, (b) 90/10, (c) 85/15, (d) 80/20 and (e) 75/25. PP: polypropylene; WTR: waste tire rubber.
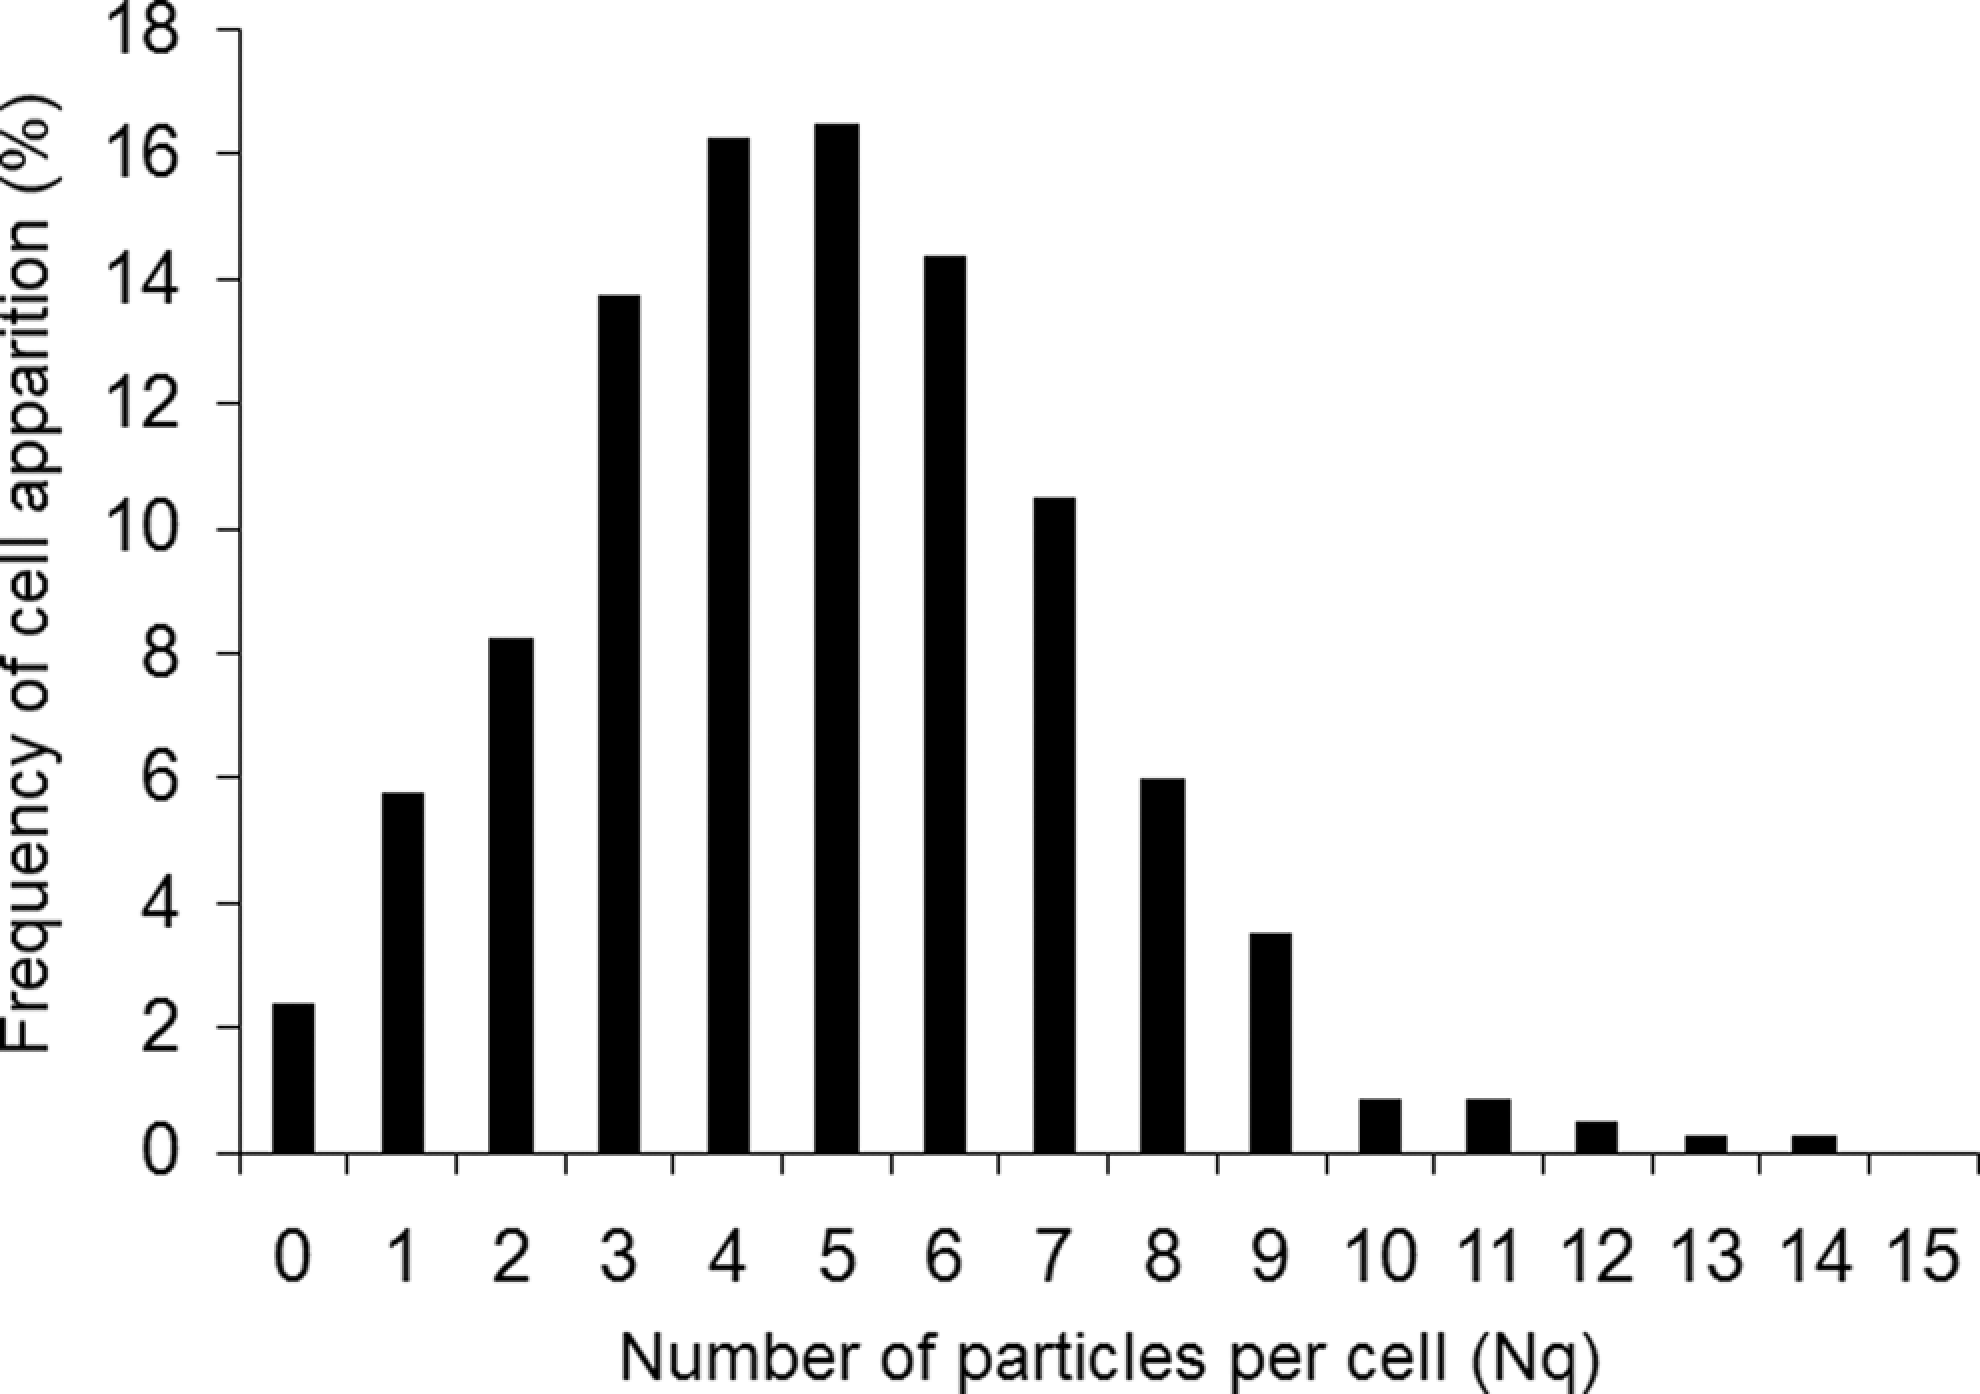
Particle distribution in blend PP/WTR 85/15. PP: polypropylene; WTR: waste tire rubber.
Volume fractions of blends.
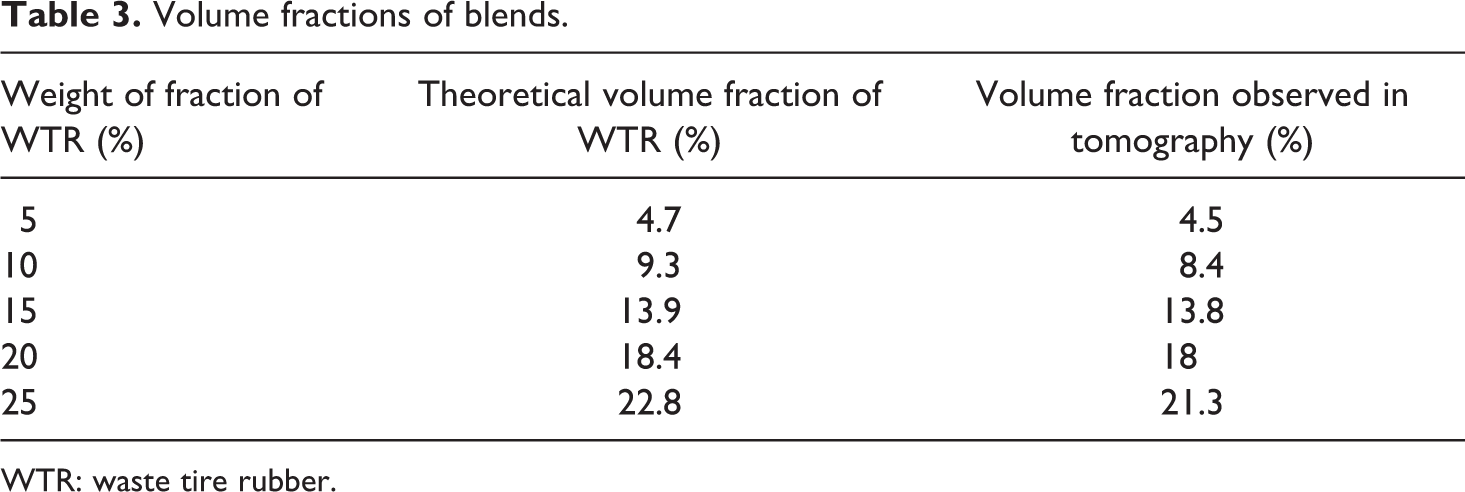
WTR: waste tire rubber.
Dynamic mechanical analysis
Glass transition temperature of components and the evolution of storage modulus and loss factor as functions of temperature have been determined by DMA tests. The mechanical behaviour of polymeric materials is very much dependent on temperature and loading frequency or strain rate. There is frequency–temperature equivalence in the polymers’ behaviour leading to the so called master curve. For instance, when a polymer is loaded at low temperature and some strain rate, then the equivalent mechanical response can be obtained at higher temperature for higher loading rate. This frequency–temperature equivalence allows characterising the damping behaviour of materials for large range of frequencies. To determine the storage modulus and loss factor of blends, three-point bending tests have been performed using Netzsch DMA machine model 242 C. The parallelepiped samples of 40 × 10 × 3 mm3 size have been experienced. After a cooling time, the testing temperature increased from −80°C to 100°C with heating rate of 4°C min− 1. Such tests have been performed for three frequencies, namely, 2.5, 5 and 10 Hz. Figure 5 illustrates the loss factor of pure components and five blends (PP/WTR: 95/5, 90/10, 85/5, 80/20 and 75/25) at 5 Hz. First, it appears from the DMA curves that the glass transition temperatures of pure components are located at 28°C and −40°C, respectively, for the PP and WTR. The five blends present the two glass transitions highlighted by the two peaks on blend curves. These peaks are located at the glass transition temperatures of pure components. Consequently, it can be concluded that the two phases are not miscible. The damping effect of rubber particles is also well distinguishable on these curves. The rise of WTR particles content increases the loss factor peak at rubber glass transition of the resulting blend. However, the overall curves evolution is not systematic or monotonic, the curves cross and no ranking is observed, as seen in Figure 5. The evolution of storage modulus as a function of temperature is depicted in Figure 6. The storage modulus of PP is higher than that of WTR and conventionally blend storage modulus curves should take place between rubber and PP storage modulus curves. The storage modulus of all the blends decreases with the increase in rubber content, except for 75/25 blend. Indeed, at low temperatures, its storage modulus overtakes the others to catch PP storage modulus. However, above the temperature of −30°C, all curves are well ranked, as seen in Figure 6.The stress stiffening phenomenon can be evoked to explain this unexpected behaviour observed at low temperatures. This may be related to a particular stress state in the rubber inclusion when compared with the parallelepiped sample of tire. Consequently, to the difference of coefficients of thermal volume expansion in PP and WTR (80 × 10−6 K−1 and 530 × 10−6 K−1, respectively), positive hydrostatic stresses may occur in rubber phase during the cooling stage of the DMA process. These prestressed inclusions may modify the overall behaviour especially at low temperature. Ayre and Bucknall 20 and Bucknall et al. 21 have studied particle cavitation of rubber in PMMA matrix. They showed that below matrix melt temperature, rubber phase are loaded by hydrostatic stress consequently to differential thermal contraction of phases. If cooled enough, rubber cavitation occurred consequently to positive hydrostatic stress. Bucknall et al. 21 proposed a method to calculate the hydrostatic stress (σ hr) in rubber particle. The model is a simple concentric core-shell element. 20 Ayre and Bucknall 20 used this formula for rubber-toughened PMMA for which the melting and glass transition temperatures may be confused. This formula of hydrostatic stress cannot be applied in our case, because the glass transition of PP occurs at 28°C. Consequently, the mechanical properties of PP could not be considered constant during the cooling process. In conclusion, the amount of rubber preserved the rubber peak on blends curves. Such composite material was more successful to dissipate energy than pure PP at least at low temperatures or high frequencies. Indeed, the improvement of damping characteristics is sought for impact applications. Storage modulus blends are well drawn, considering that the thermal stress occurred in 75/25 blend.
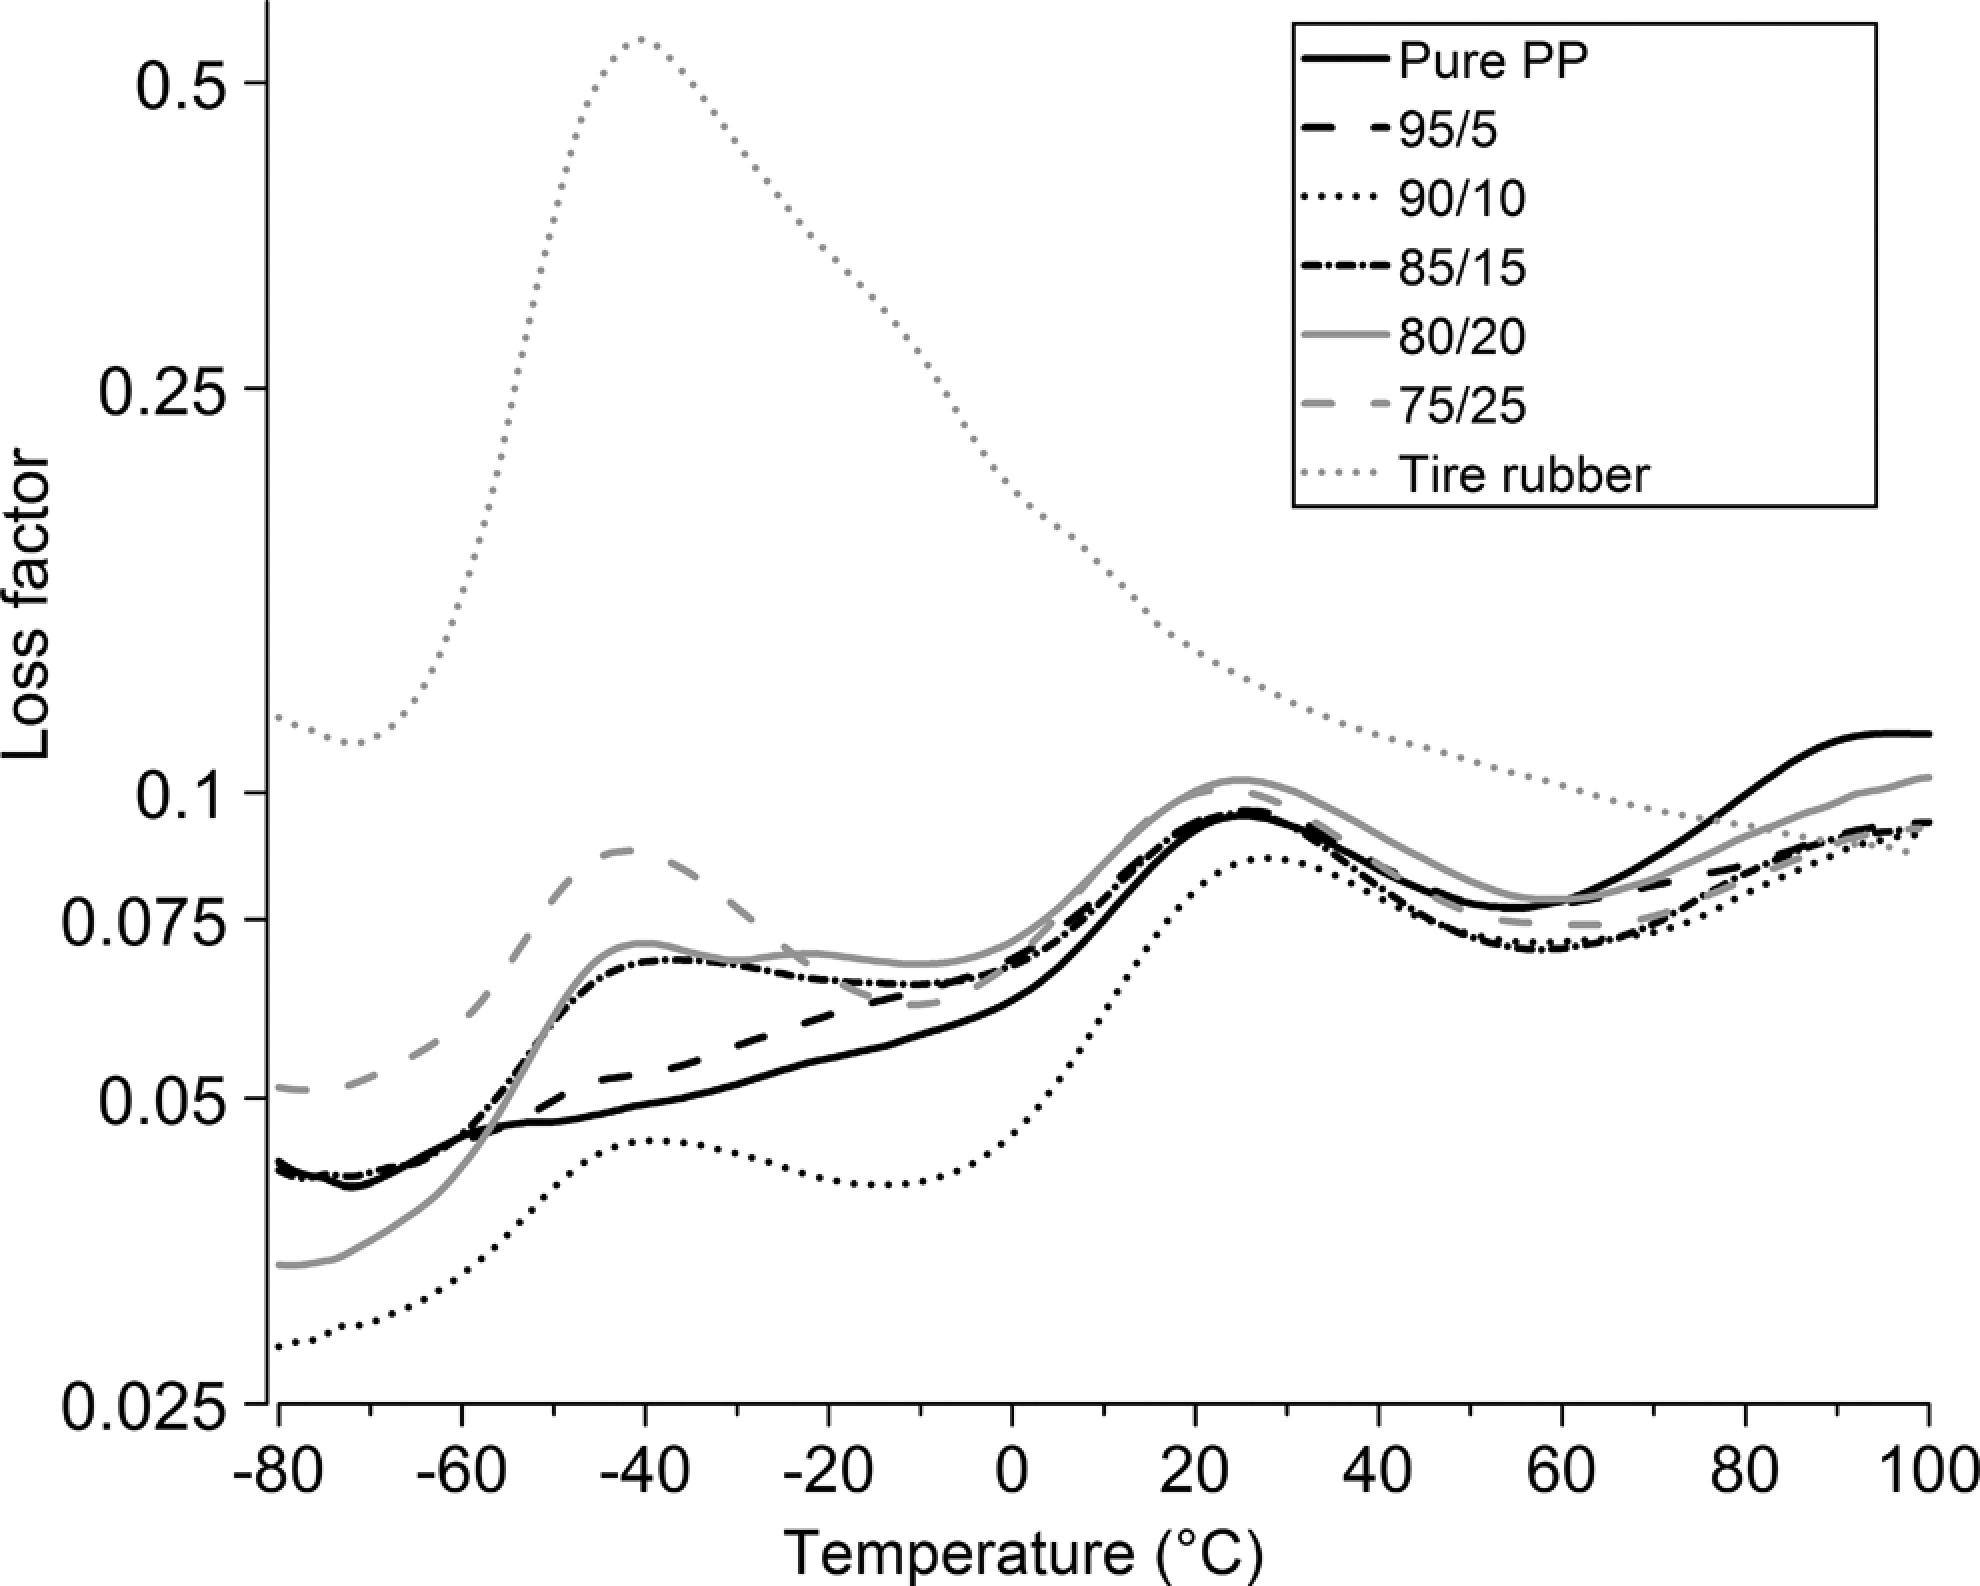
Loss factor curves function of temperature at 5 Hz.
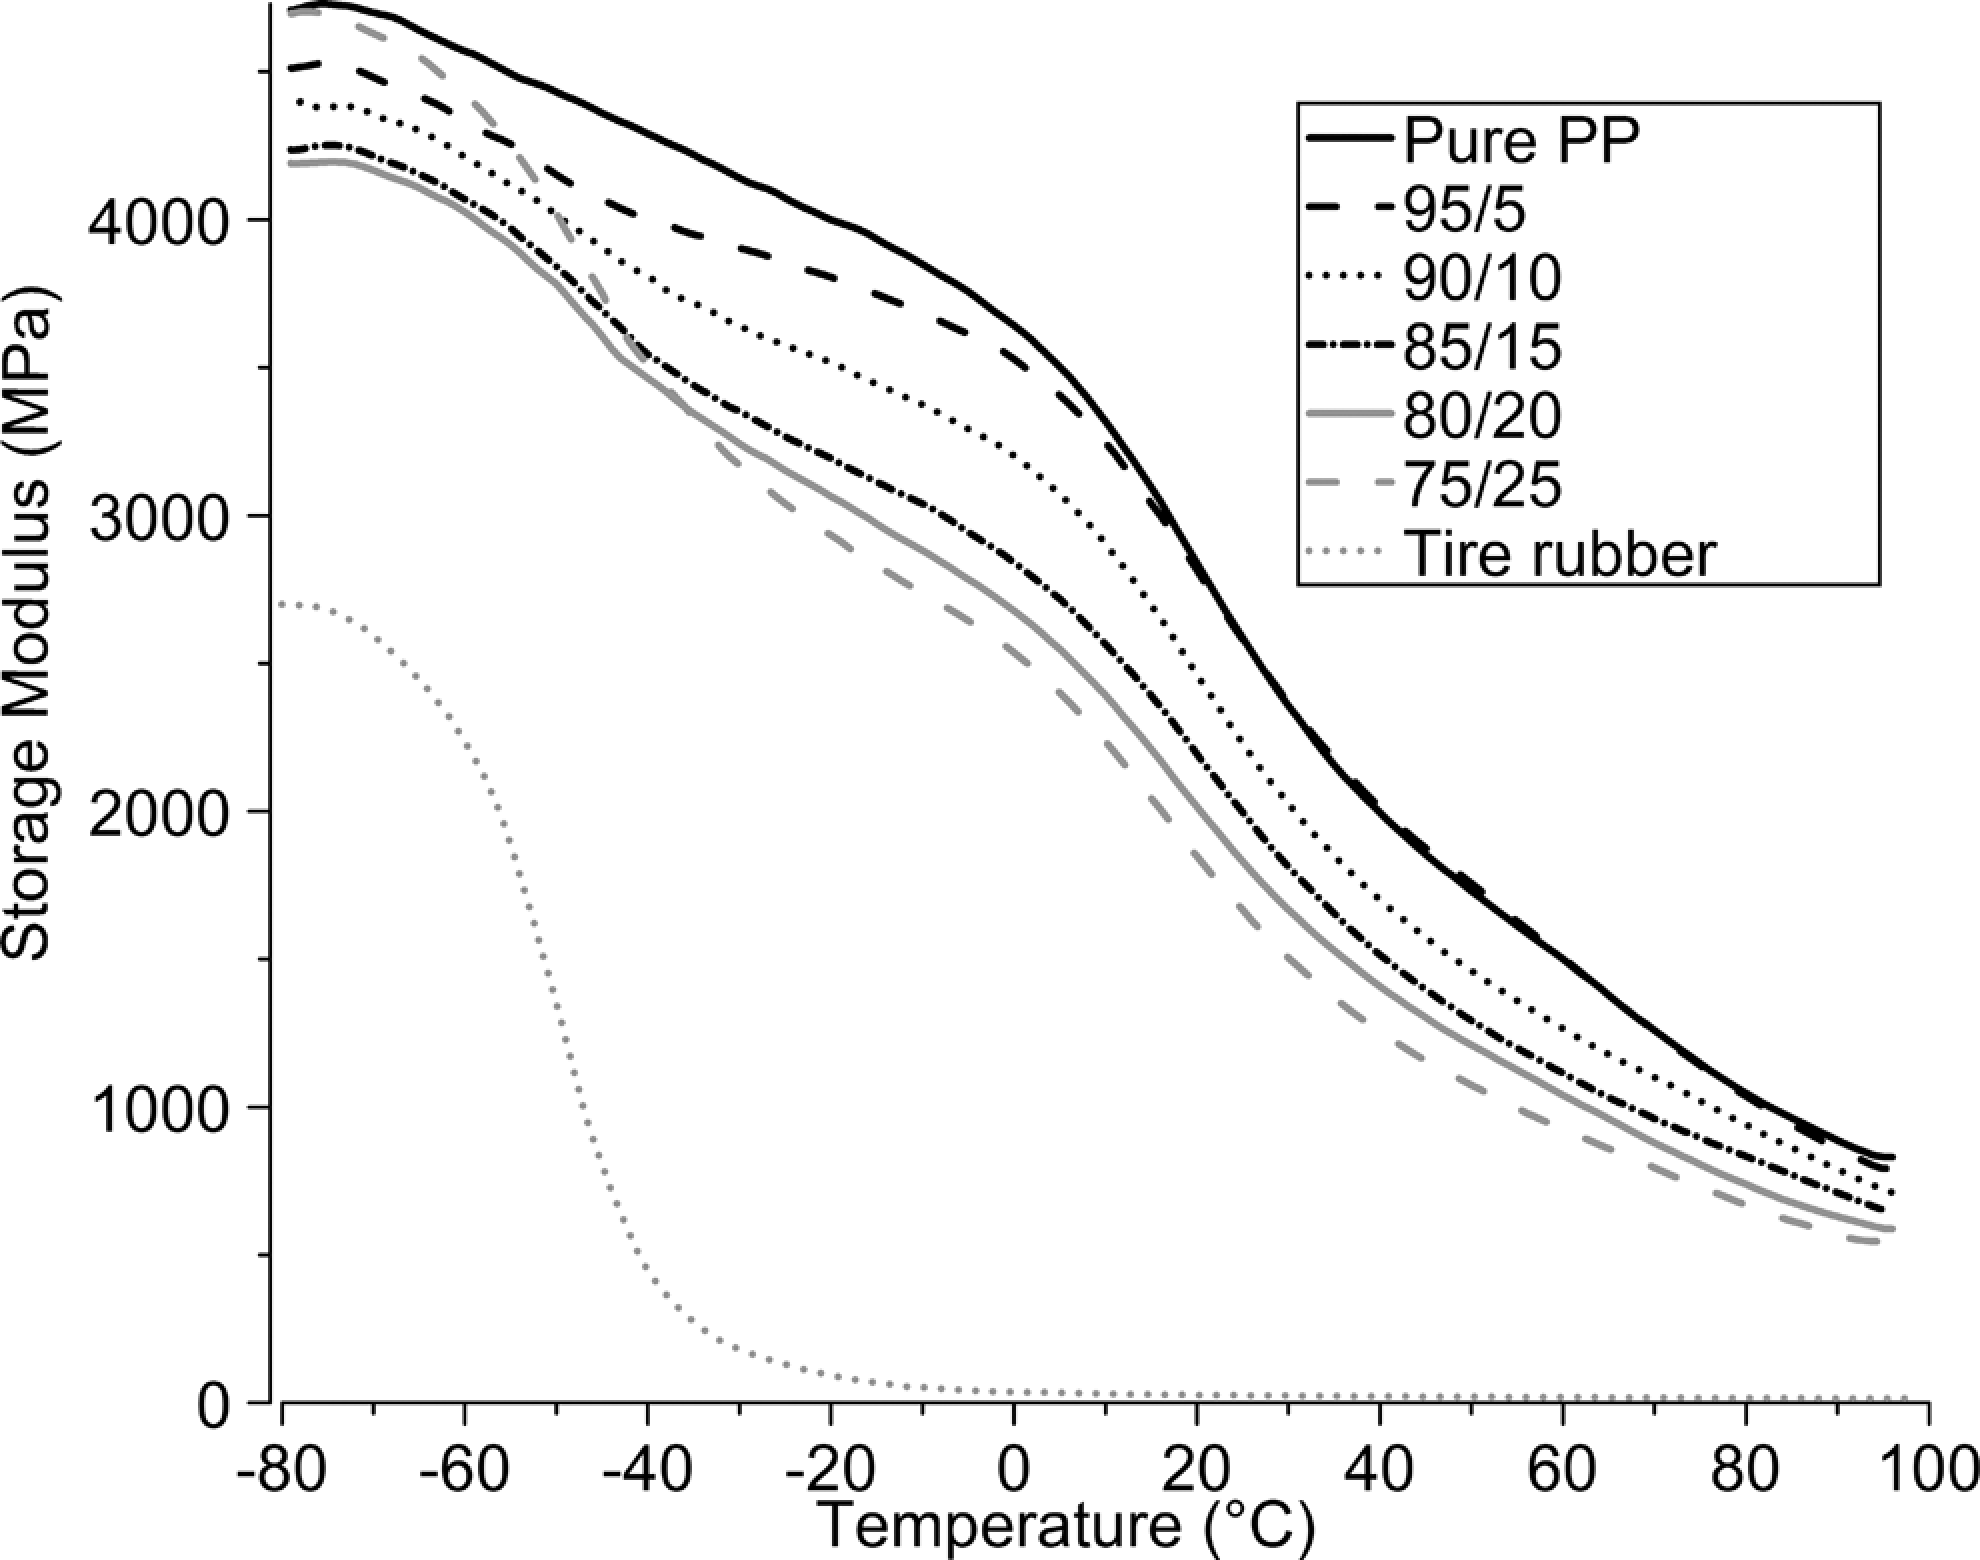
Storage modulus function of temperature at 5 Hz.
Mechanical properties of thermoplastic elastomer in tension
Tensile tests
An Instron (5866) testing machine has been used to perform the quasistatic tensile tests. Tests were carried out at room temperature for three true strain rates (10−4, 10−3and 10−2 s−1). Strain rate has been controlled with Apollor® tensile video system. Tensile tests provide some mechanical properties such as elastic modulus, critical elongation, maximal or ultimate stress of the tested samples. Five tensile experiments were carried out for each composition and strain rate. The average true stress–true strain curves have been constructed for strains not exceeding the lowest critical elongation obtained among the five samples experienced at the same conditions. Figure 7 represents the five tensile test curves of blend 80/20 at a strain rate of 10−4 s−1 and the average polynomial fit of these results. The tensile behaviour is investigated as a function of rubber content. Experimental data are fitted by fourth order polynomial curves plotted in Figure 8. This figure illustrates the average tensile curves for all the blends at a strain rate of 10−4 s−1. It can be noted that the stiffness (Young’s modulus) and stress levels decrease with increase in rubber content. The same tendencies have been observed for both remaining strain rates (10−3 and 10−2 s−1). This behaviour is in agreement with the results obtained by Van der Wal et al.,
5
Awang et al.
6,
7
and Jose et al..
22
The elastic modulus and the ultimate tensile strength are decreased by ˜41.5% and ˜46.5%, respectively, in the blend 75/25 when compared with pure PP (Figure 9). Both the properties evolve in similar manner. As usual, the critical sample elongation is strongly influenced by particular physical and geometric characteristics of samples, such as individual reinforcement size and position or the presence of micro-flaws. Nevertheless, general tendency of decrease in the critical elongation with particles concentration has been observed. Figure 10 presents the average true stress–true strain curves of a 90/10 blend obtained for three strain rates. The strain rate sensitivity of the blend is clearly noticeable. To quantify this property, the strain rate sensitivity, m, has also been evaluated following the classical definition below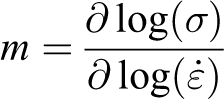
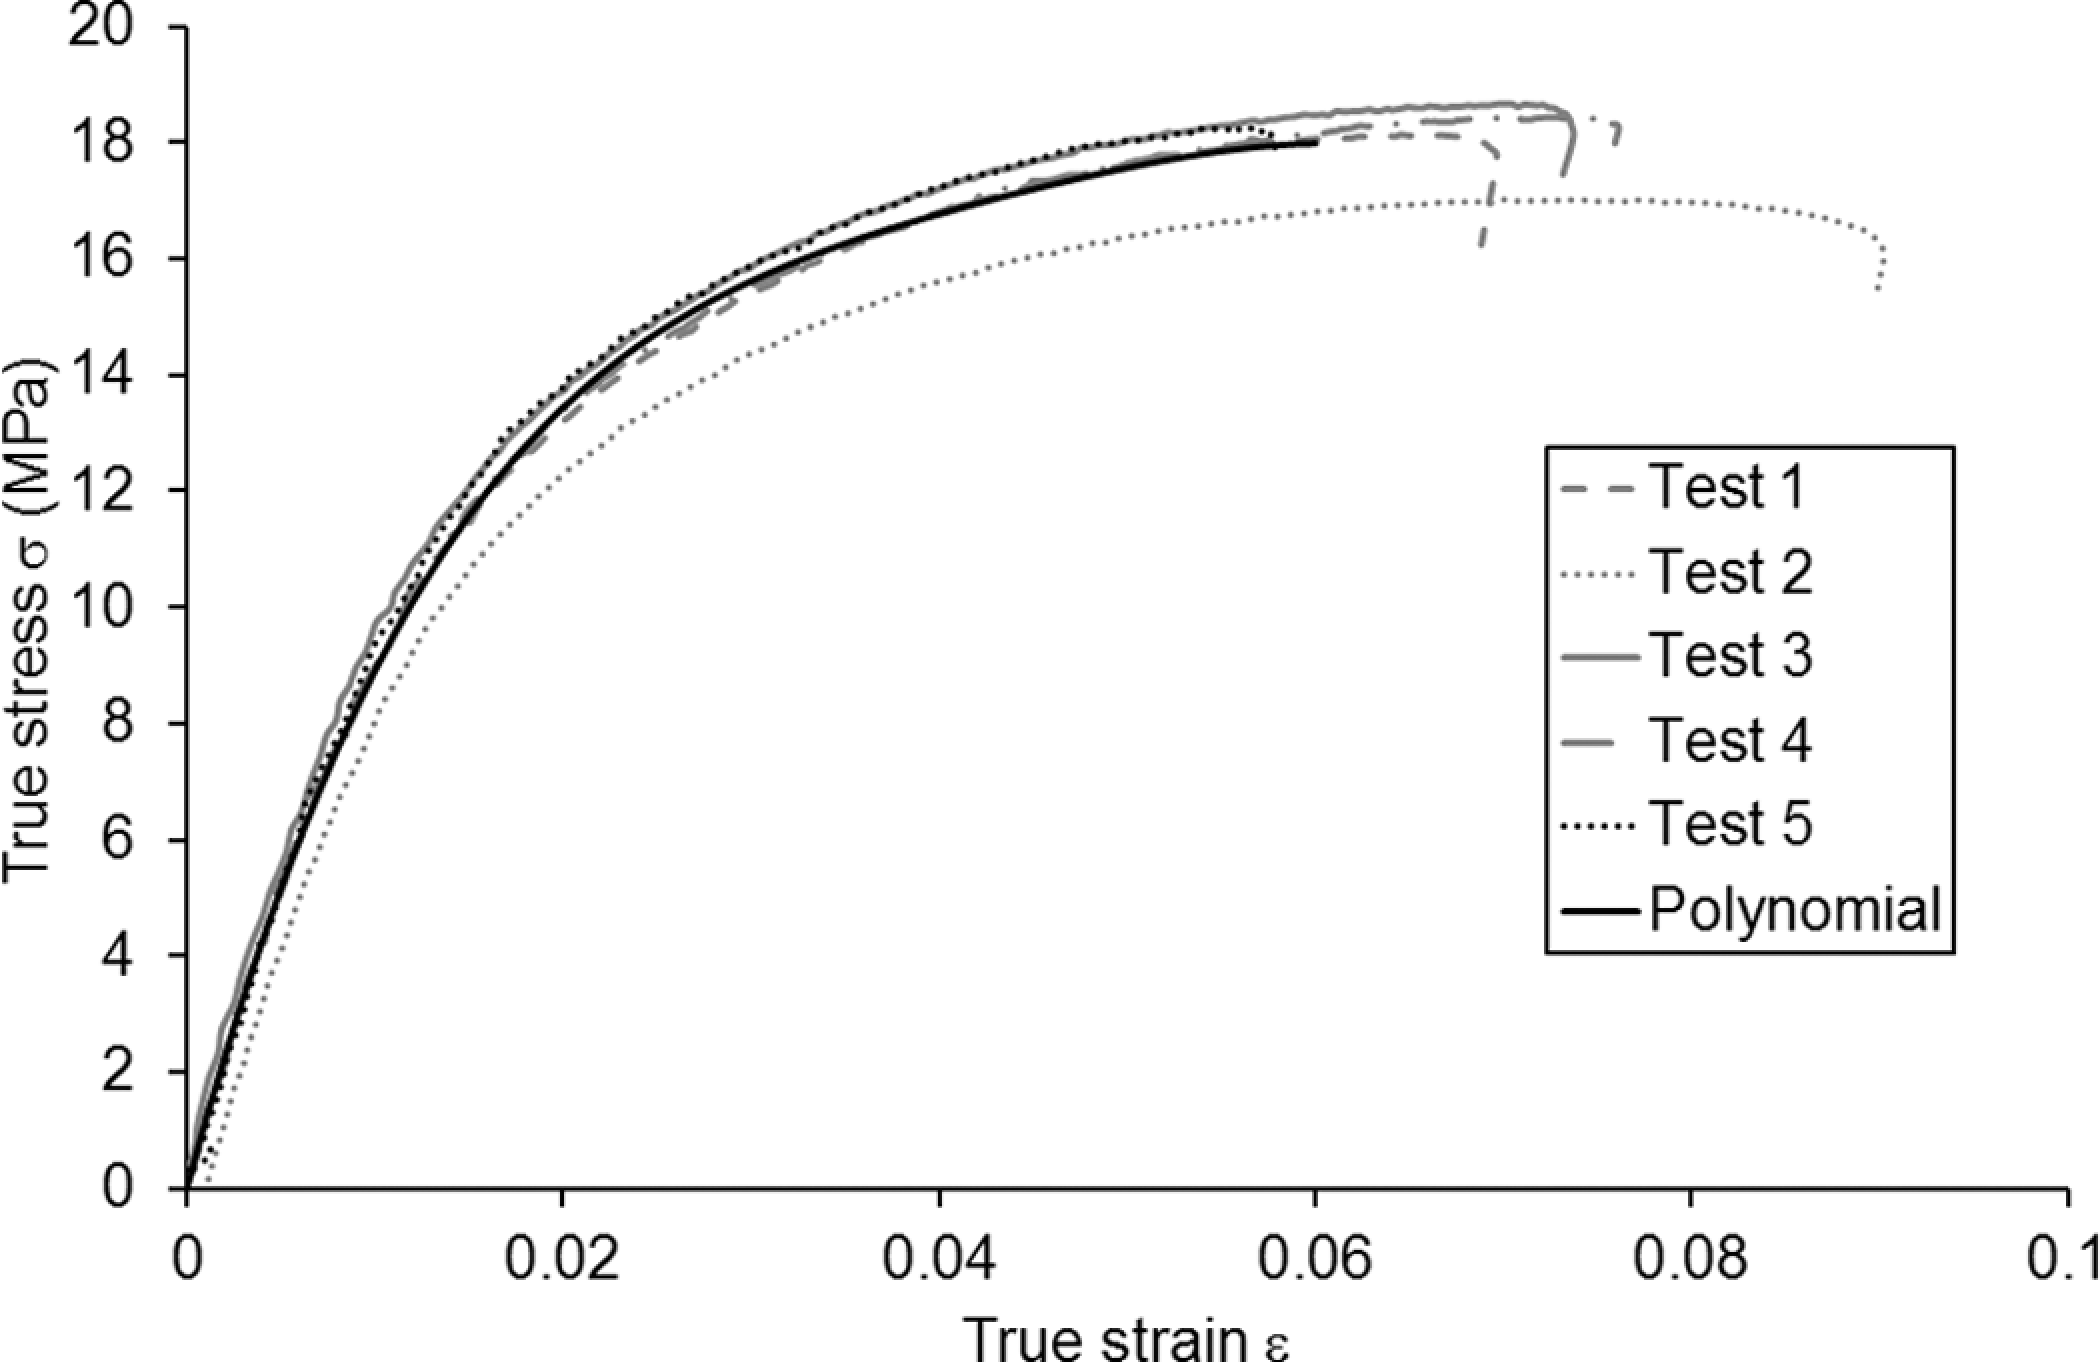
Tensile tests and average polynomial curve of blend 80/20 at strain rate 10− 4 s−1.
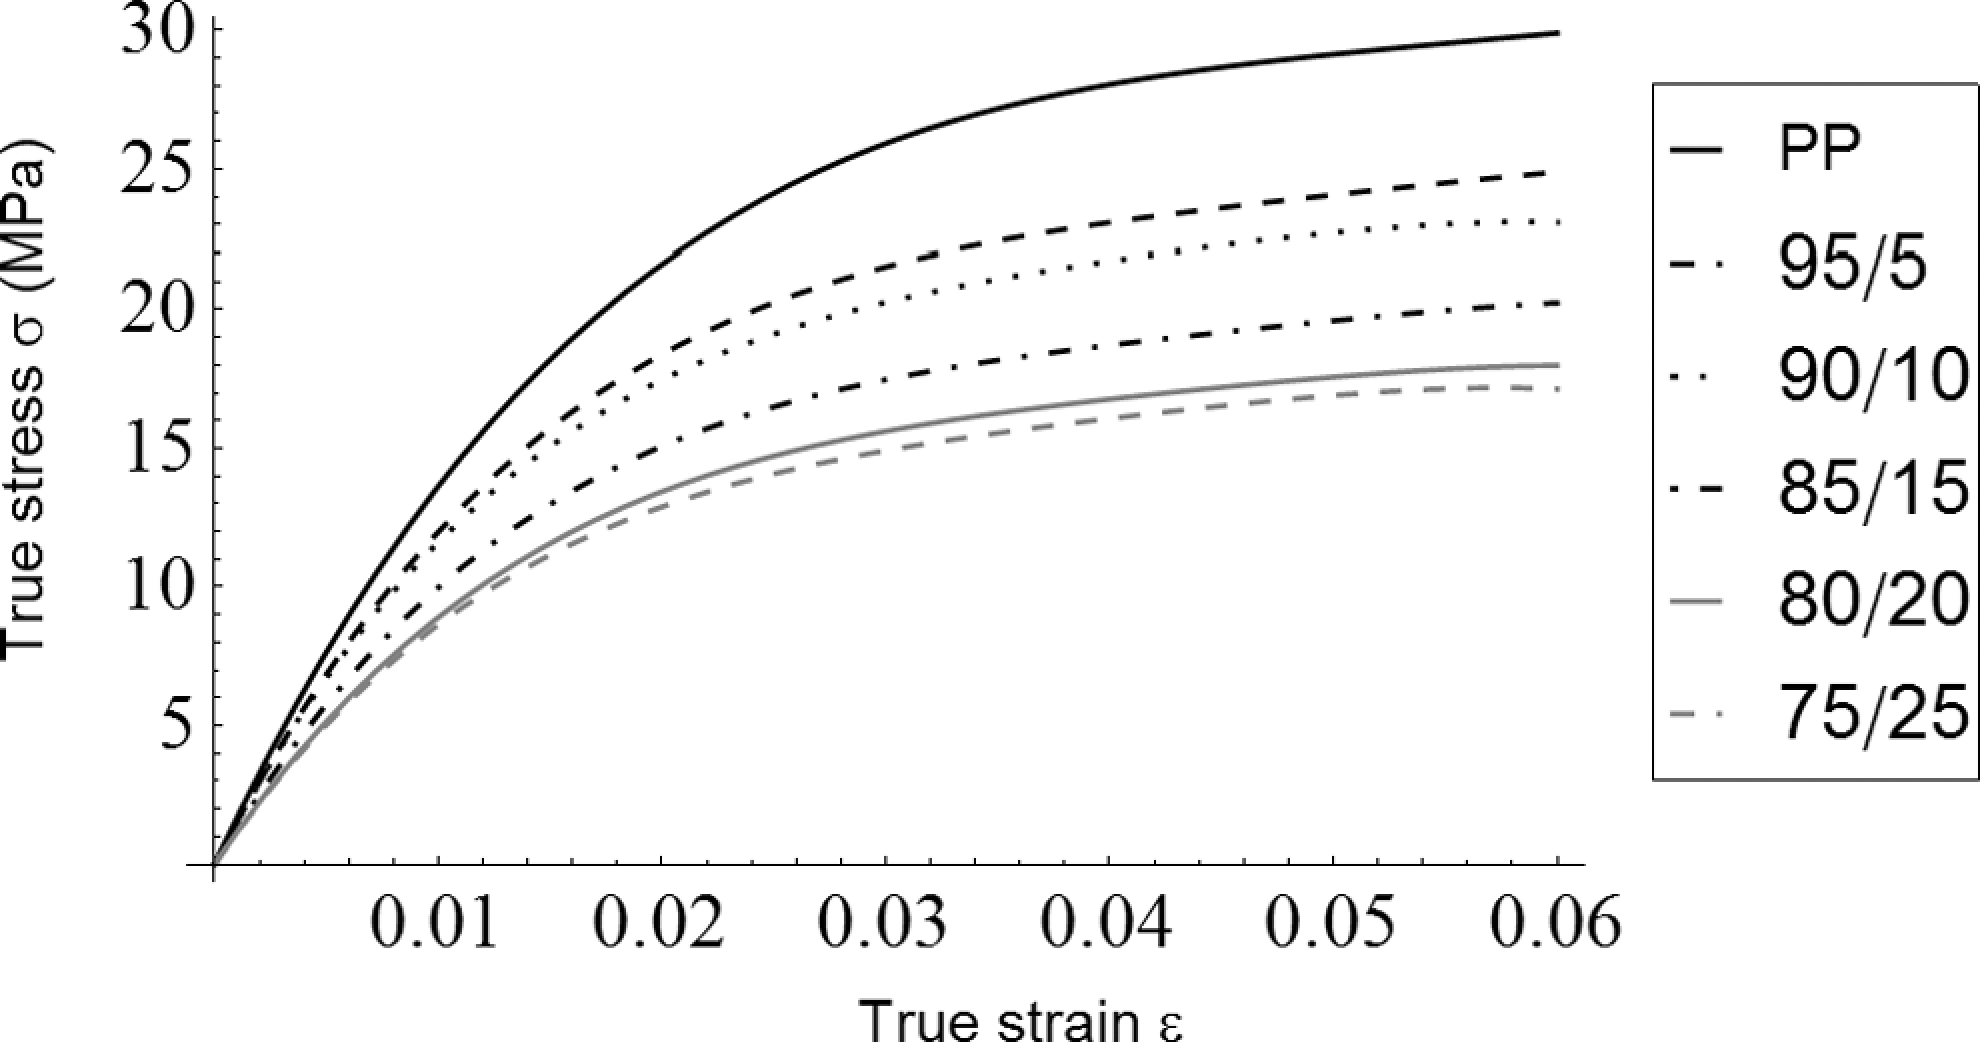
Tensile curves of PP and blends at strain rate 10− 4 s−1. PP: polypropylene.
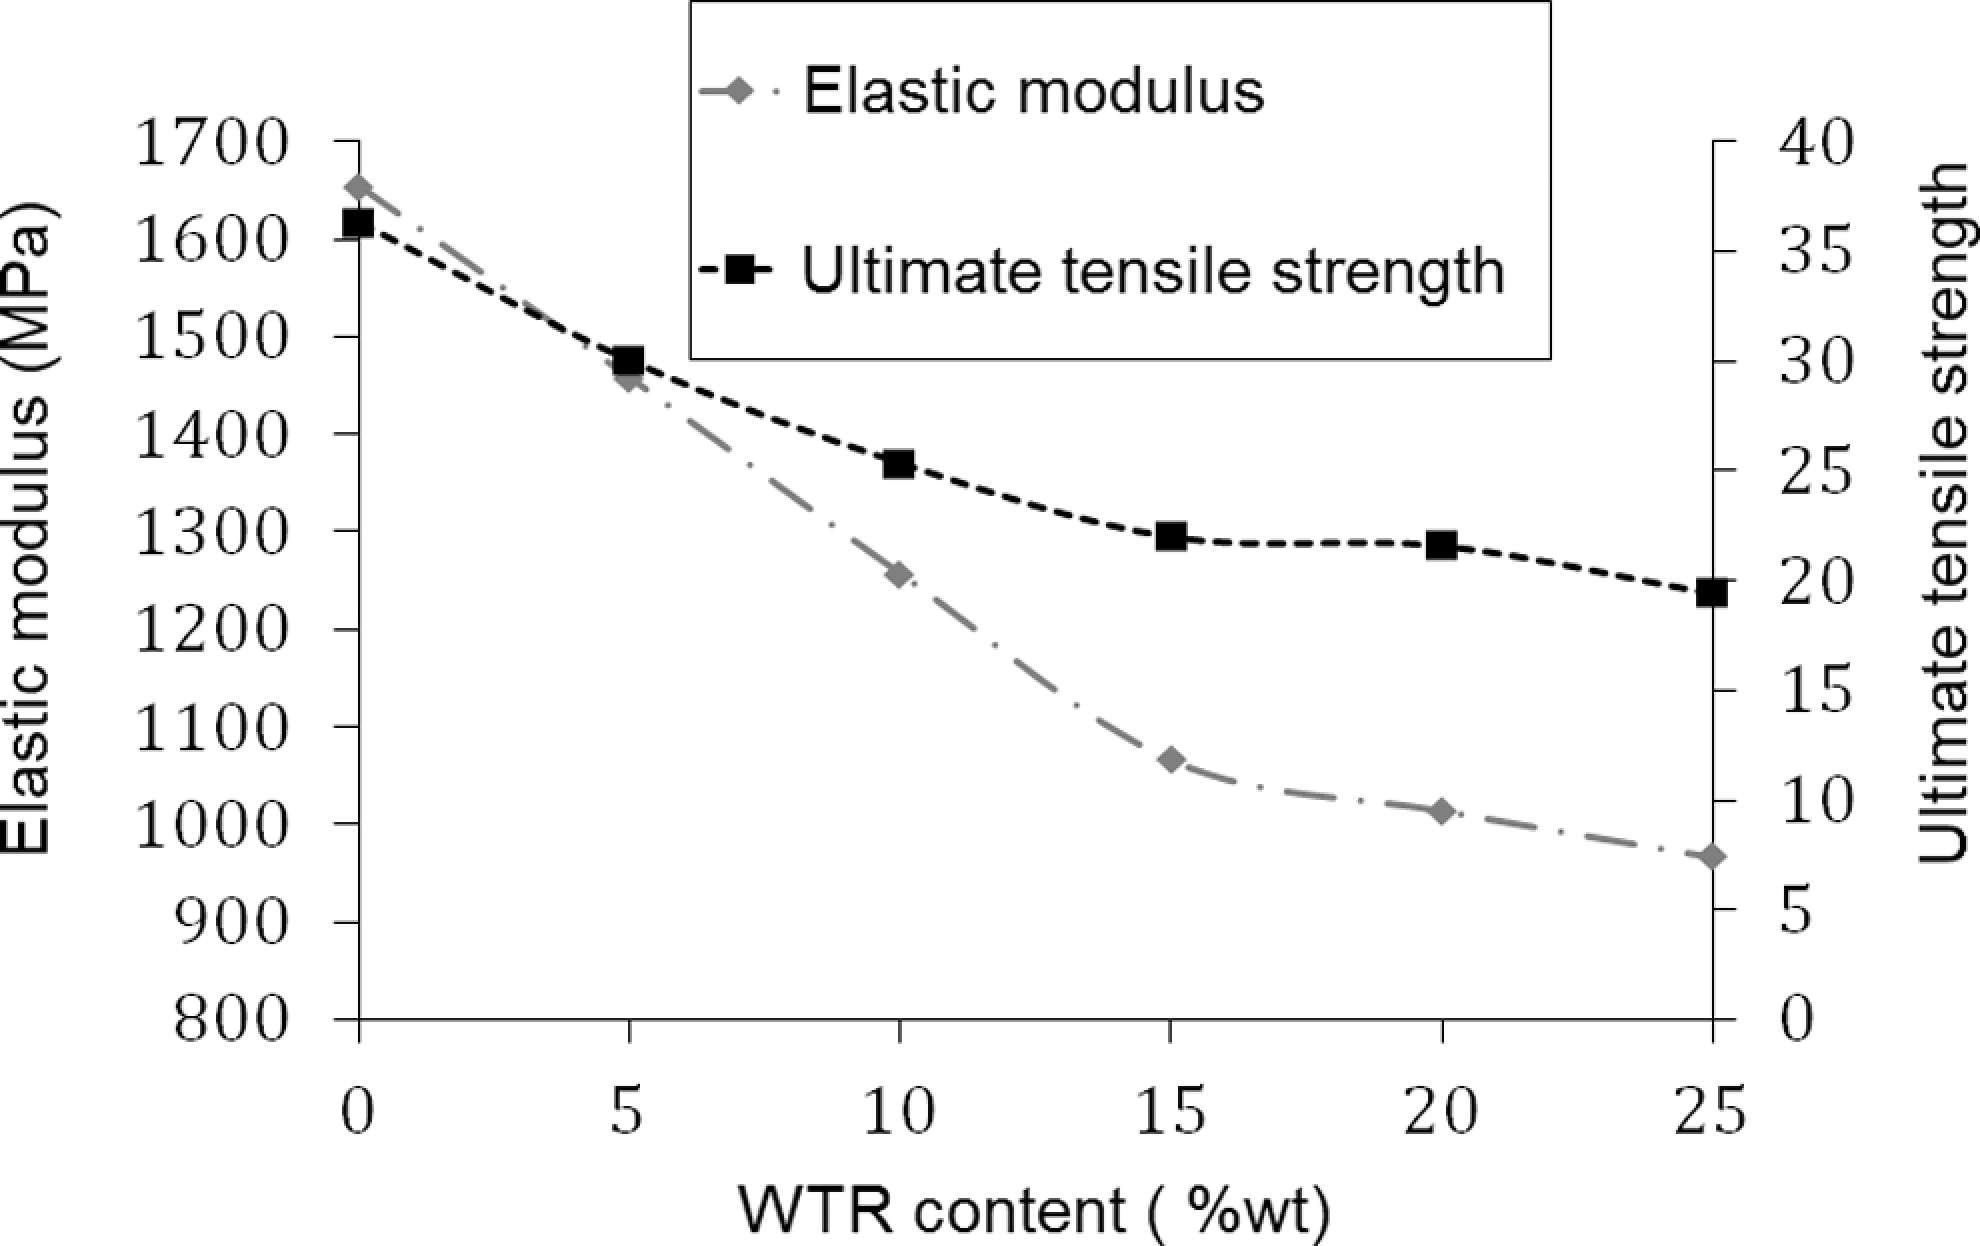
Elastic modulus and ultimate tensile strength versus WTR content at strain rate 10− 4 s−1. WTR: waste tire rubber.
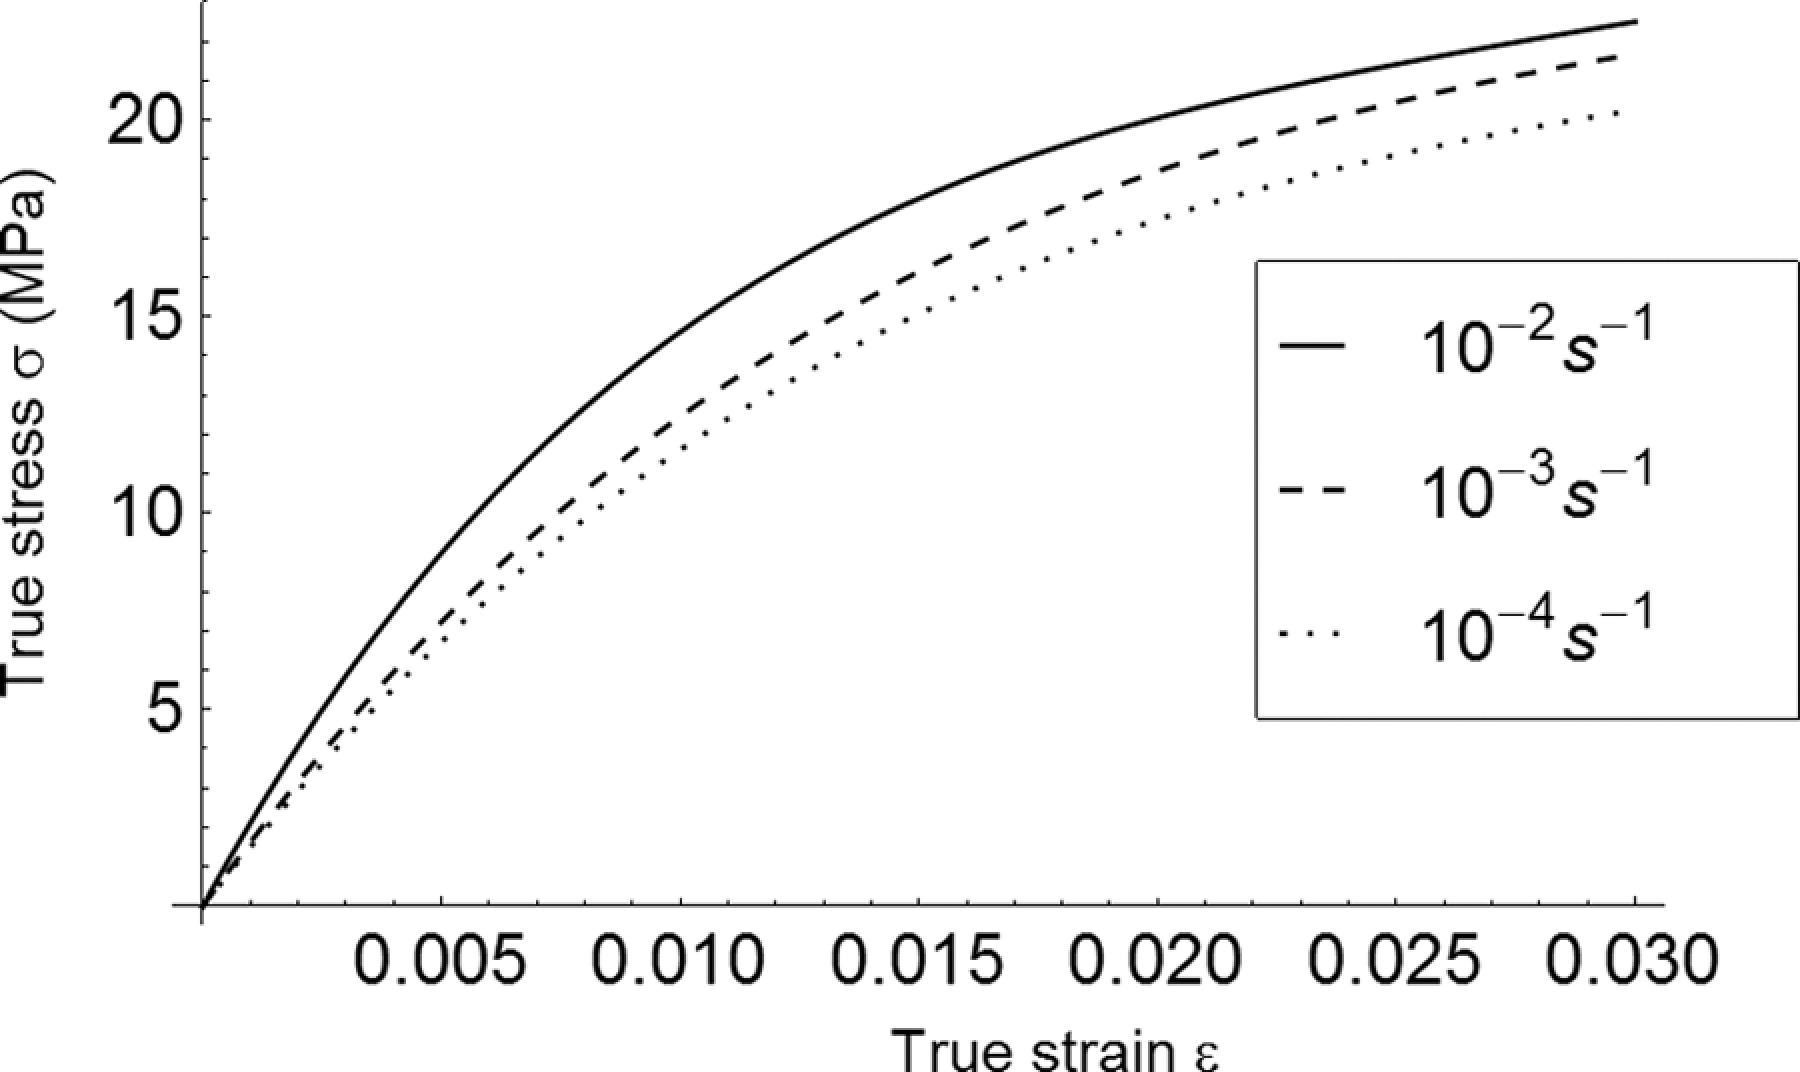
Tensile behaviour of blend PP/WTR 90/10 at various strain rates. PP: polypropylene; WTR: waste tire rubber.
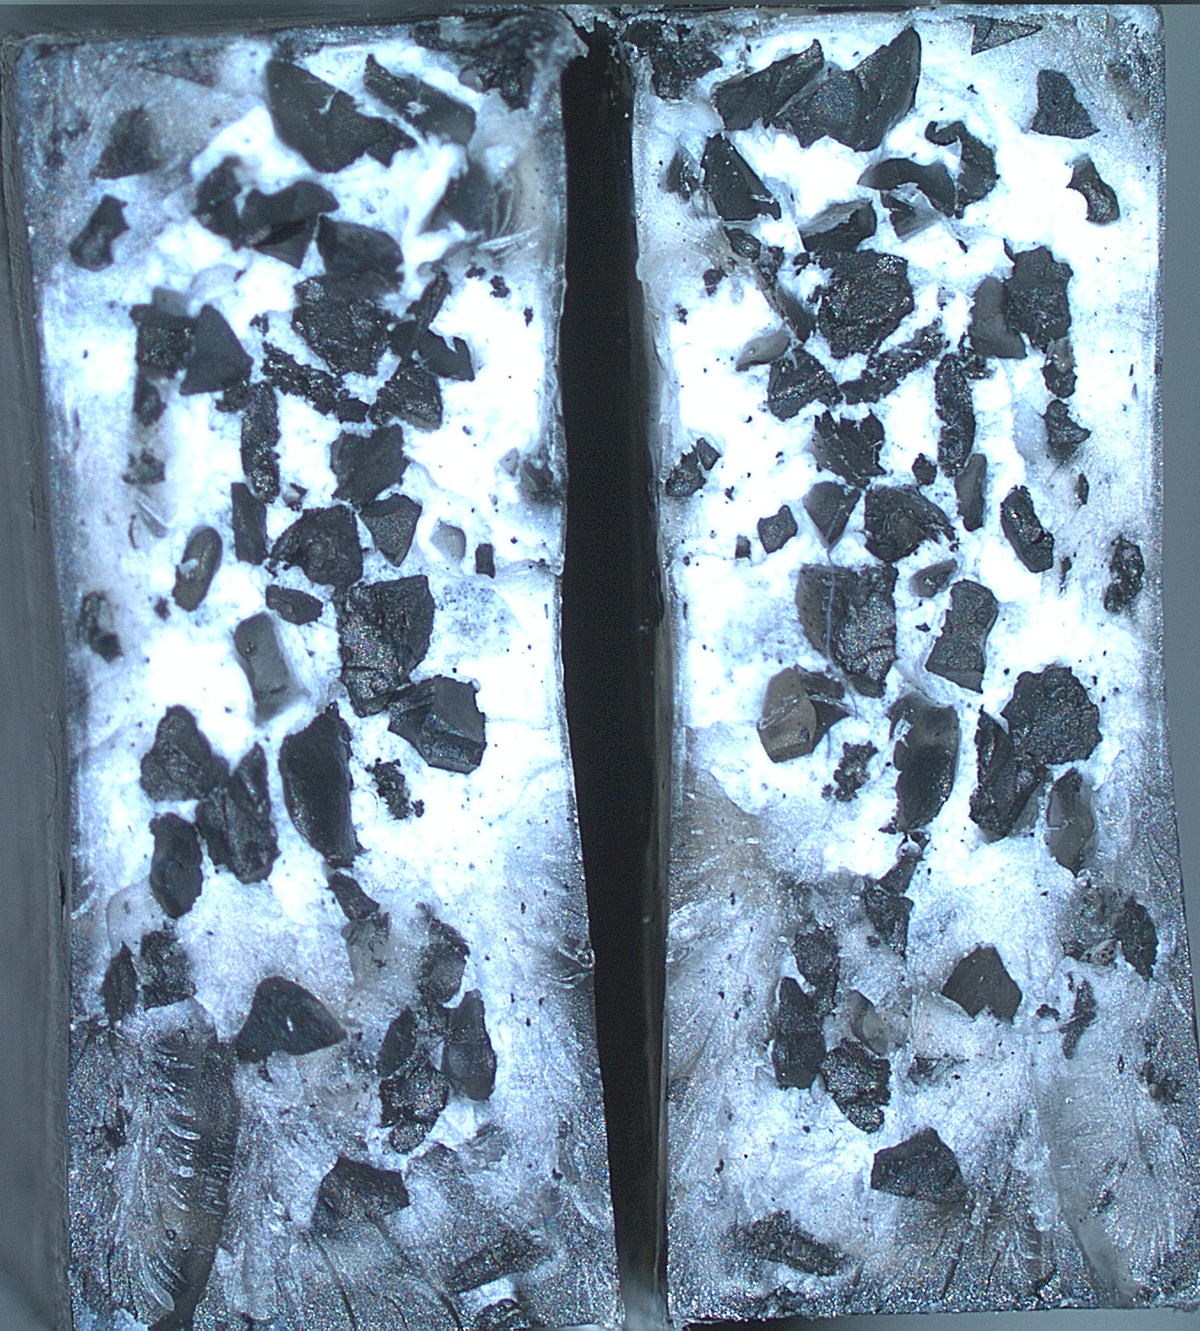
The obtained values of the strain rate sensitivity at a strain of 0.01 are reported in Table 4. The global tendency of increase in the strain rate sensitivity as a function of the WTR content or concentration can be stated even if this increase is not monotonic. This tendency confirmed the results of DMA analysis concerning the evolution of the loss factor. Therefore, blends of two components lead to an elastic modulus and ultimate tensile stress smaller than those of PP. Table 5 summarises the strain at break values obtained and the SD observed for each blend at the three strain rates tested. Usually, the strain at break has been improved by the addition of large amount of rubber. 6,7,13,14 However, for small amount of particles in bulk matrix, the strain at break has been more sensitive to defects in microstructure. Indeed, it has been observed that the strain at break has not been affected by the rubber content but rather by the local damage occurring near the main imperfection (void, particle cluster, biggest or peculiar particle). During tensile tests, sample whitening appeared. This whitening can be attributed to matrix damage by crazing. Whitening has been more intensely close to defect zones and the cracks have been nucleated in those zones. Initial cracks grew and met up to form the macrofracture. Each part attached to one of the fracture surfaces can be seen in Figure 11.
Stain rate sensitivity coefficient.
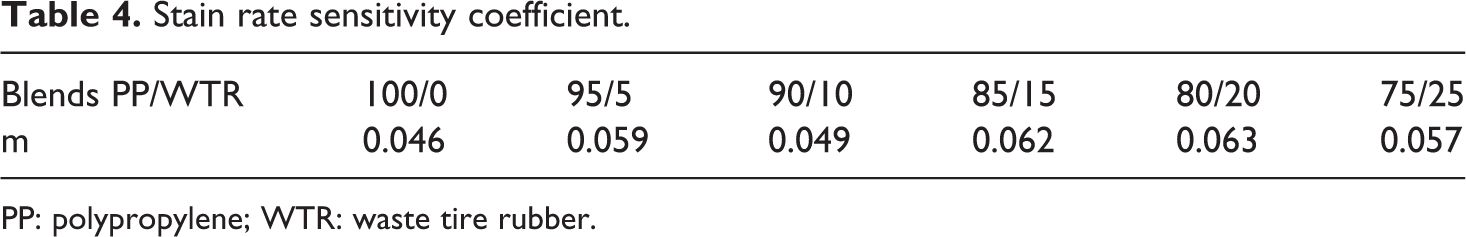
PP: polypropylene; WTR: waste tire rubber.
Average strain at break and SD at various strain rates.
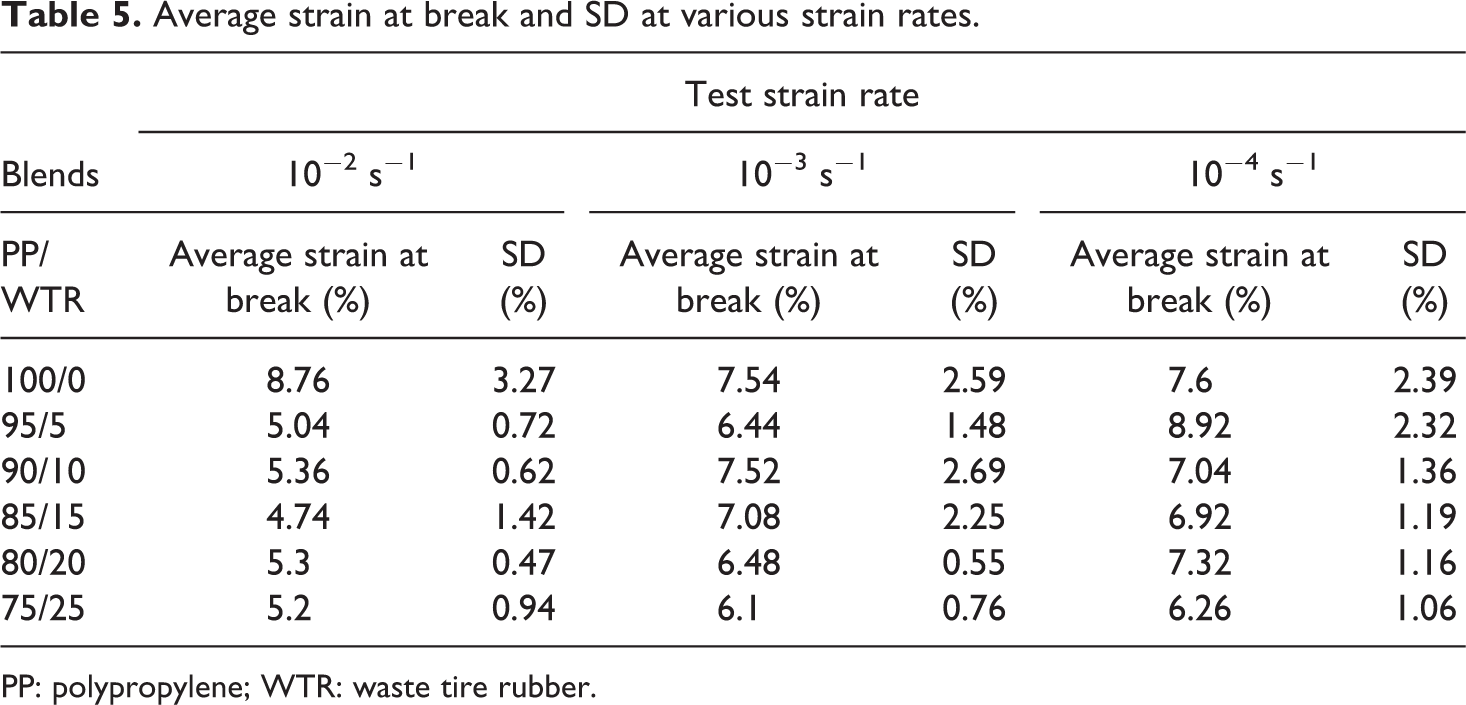
PP: polypropylene; WTR: waste tire rubber.
Optical microscopy image of postmortem sample of blend PP/WTR 85/15. PP: polypropylene; WTR: waste tire rubber.
Damage observation
Optical microscopy has been carried out on the fracture surface of postmortem tensile test specimens. The optical microscope (Olympus SZ61) coupled with a CCD video camera (Olympus SC30) provided images of both the opposite fracture faces of specimens. Figure 11 shows typical micrography of an 85/15 blend sample. Practically, each particle was broken in two parts, which can be easily identified on both fracture faces of the broken sample. This fact confirmed a good bonding between the particles and the PP matrix and consequently would be proved good compatibilization of the tested compounds. White zones visible on these faces indicated the plastic deformation of the PP matrix prior to the final specimen fracture. It was perceptible that these white zones were more intense in more filled areas. Additionally, they bridged individual separated particles. This information indicated strong strain localization around individual particles. However, optical microscope provides only information on sample surface. X-Ray tomography makes available 3D visualisation of whole bulk objects. This technique can be applied to observe the damage occurring in samples in vicinity of the fracture faces. Nanotom Phoenix X-Ray CT scan has been used to perform such observations. Figure 12 gives an example of postmortem 80/20 blend specimen treatment. It appeared from this figure that whole observed zone is affected by the occurrence of damage (cracks). Different stages of crack development can be distinguished and are indicated by white ellipses in this figure. It seems that in this case, some cracks initiate by debounding (Figure 12(c)) and remaining ones start propagating in the PP matrix between two adjacent particles (Figure 12(a)). Next, they propagated through the PP matrix (Figure 12(a) and (d)) towards the nearest particles. In some cases, they provoked fracture of the particles (Figure 12(b)). It should be mentioned that this scanning has been performed on broken sample (postmortem analysis) few days after the tensile tests. Consequently, the sample has been entirely relaxed and some cracks closed up. Moreover, the imaging resolution of this treatment is 6.25 µm. Consequently, cracks with lower opening could not be detected. In order to analyse kinematics of damage, an ‘in situ’ mechanical tests have to be undertaken. For this reason, a specific loading device has been developed enabling this kind of tension tests with controlled strain level. Some preliminary results of such tests are presented in the next section.
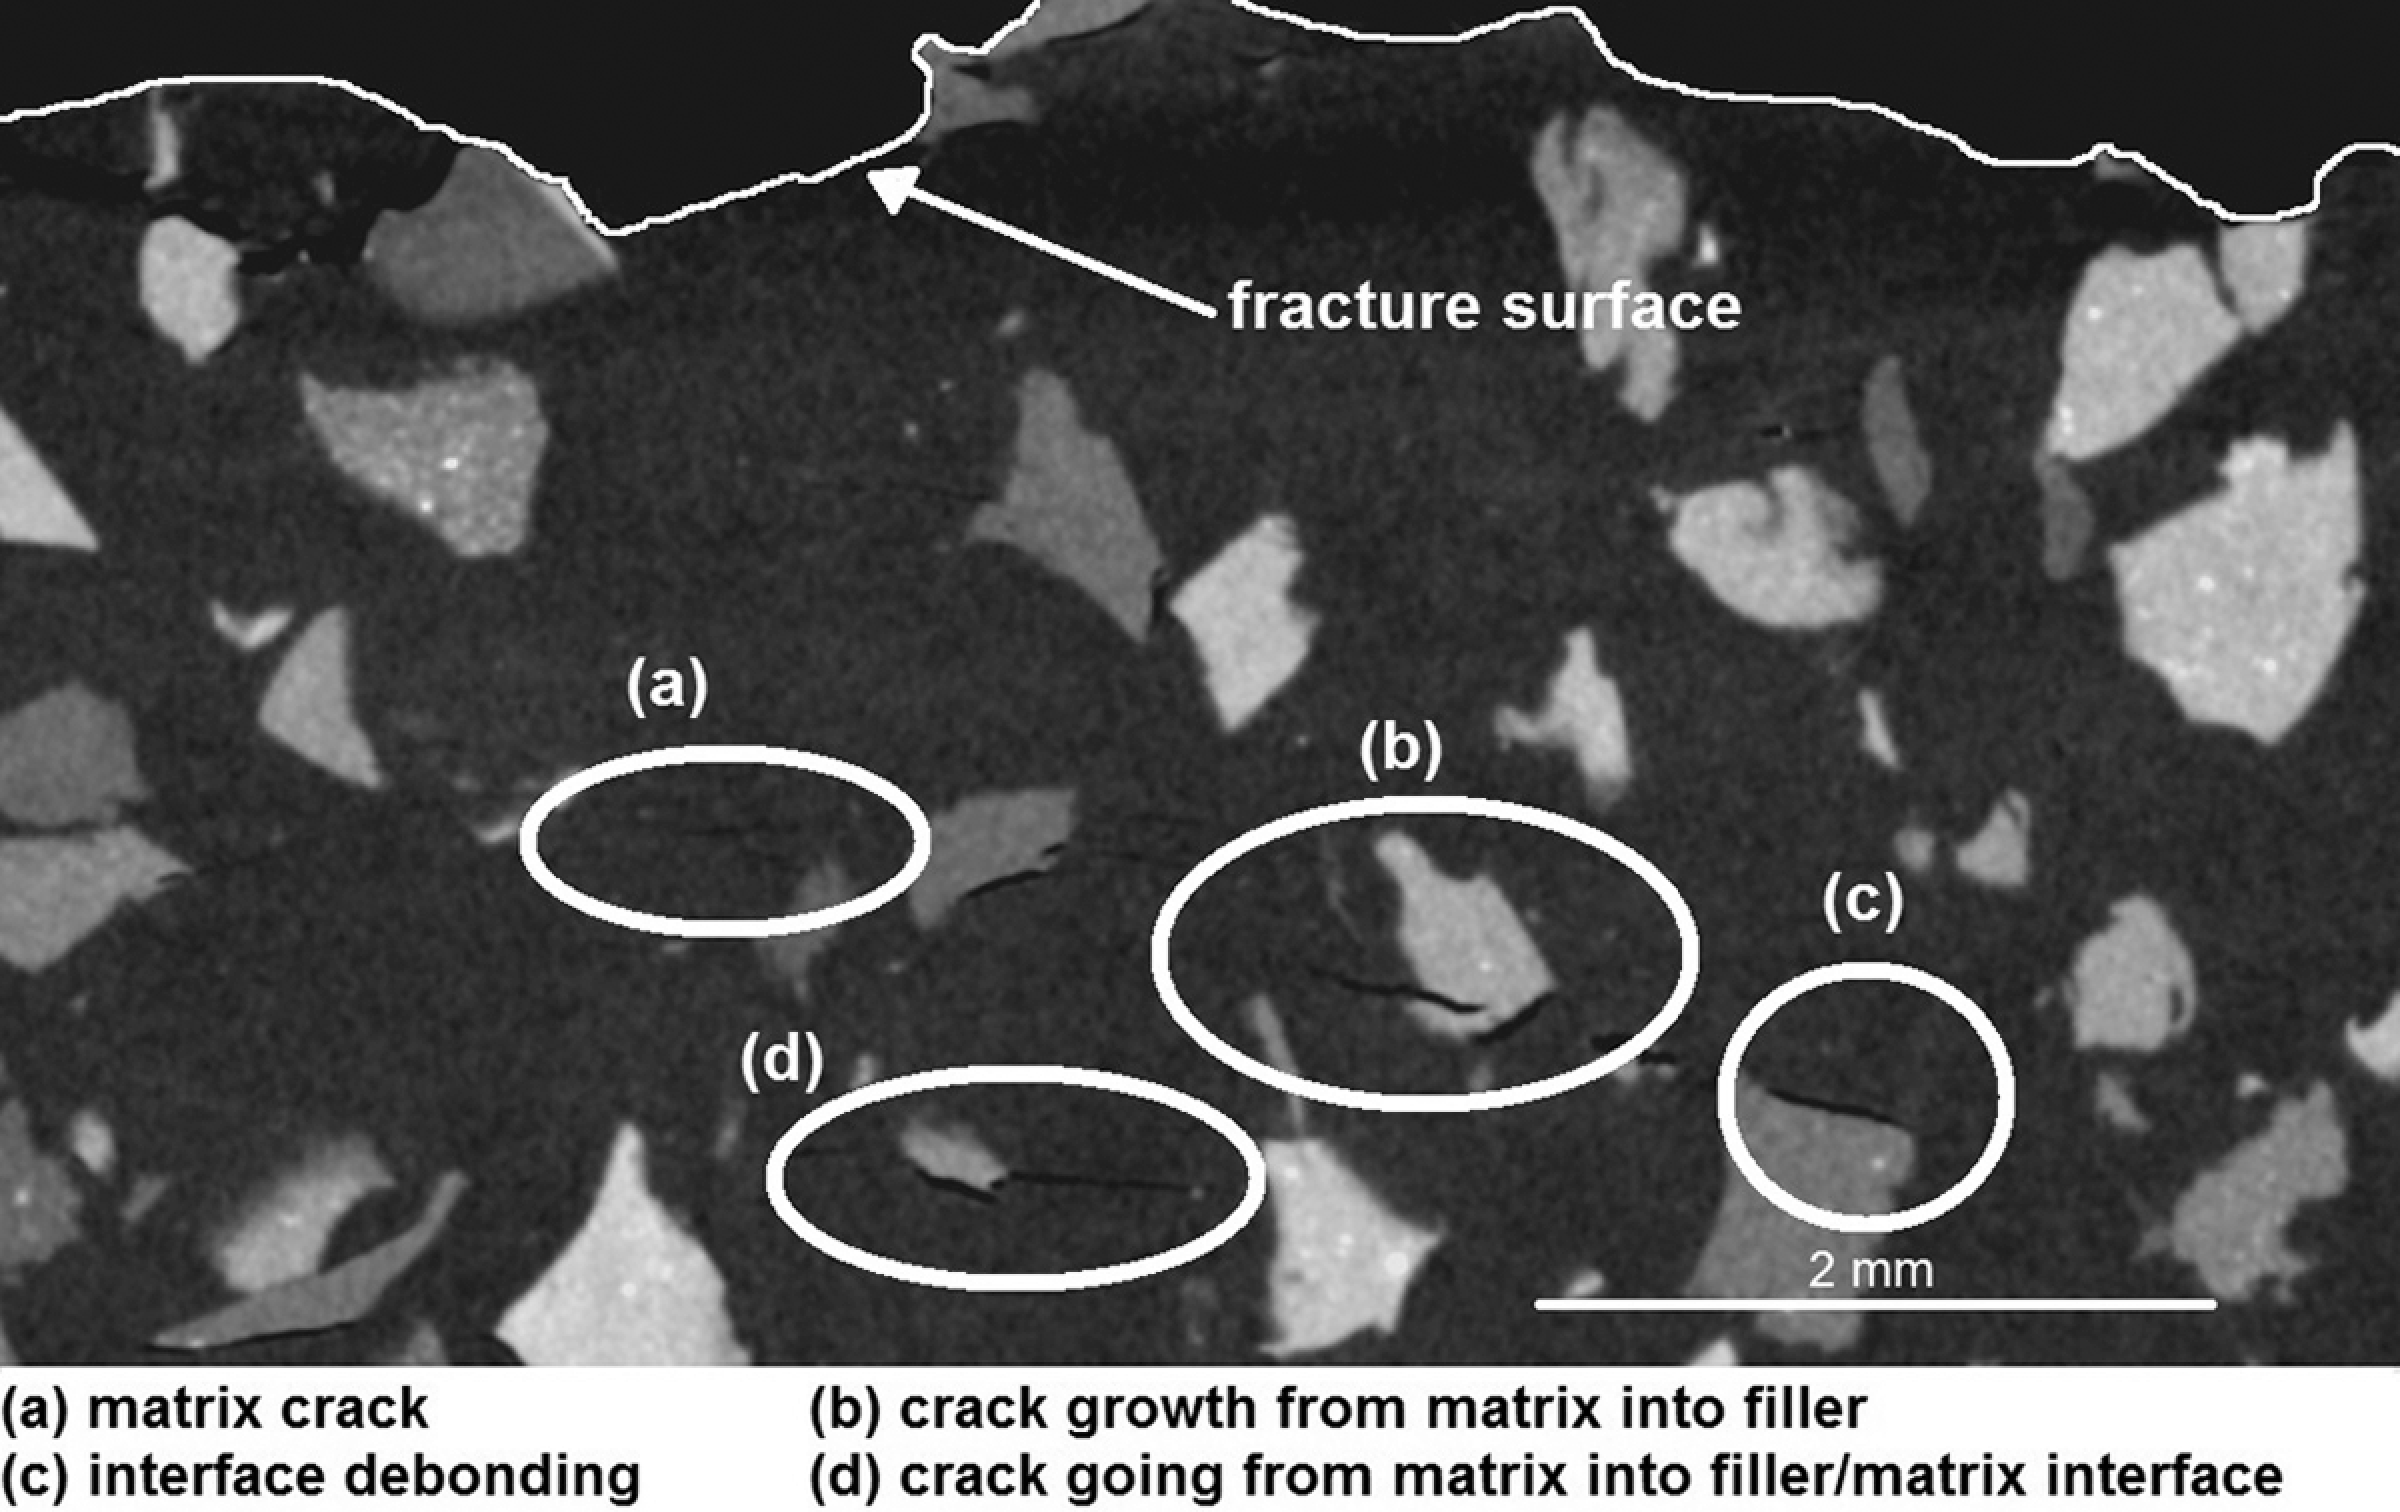
Tomography image of bulk damage of postmortem sample of blend PP/WTR 80/20. PP: polypropylene; WTR: waste tire rubber.
In situ tensile tests
To overcome the drawback of cracks, a specific device has been developed to carry out tensile tests in situ of the CT scan Nanotom Phoenix X-Ray. To ensure the quality of obtained images, the system comprised a stiff tube made of low-density material (carbon tube). It can be supposed that the strain imposed on the sample does not evolve during the scanning time (typically about 1 h) due to the high stiffness of the tube. The results presented in Figure 13 correspond to four stages of 90/10 blend sample straining. To be sure that damage has occurred in observed area, the cross-section of tensile sample has been slightly reduced. Figure 13(a) illustrates the microstructure of the sample before deformation. Figure 13(b) shows the first deformed stage to nominal strain εn = 0.008. No significant damage was visible on this image, except small cavitation of two particles. Figure 13(c) shows the state of the composite under the nominal strain εn = 0.0225. The cavities are grown but are the only damage yet. Figure 13(d) has been obtained just before the final specimen fracture. The particles were not yet broken but the cavities observed on the previous image are bigger and more numerous. Fairly opened cracks can be appreciated on this image, mainly situated in the weakest section of the specimen. It can be remarked that some particles are largely stretch; another are completely or partially debounded. Therefore, it can be possible to observe damage phenomena occurring in the studied composites.
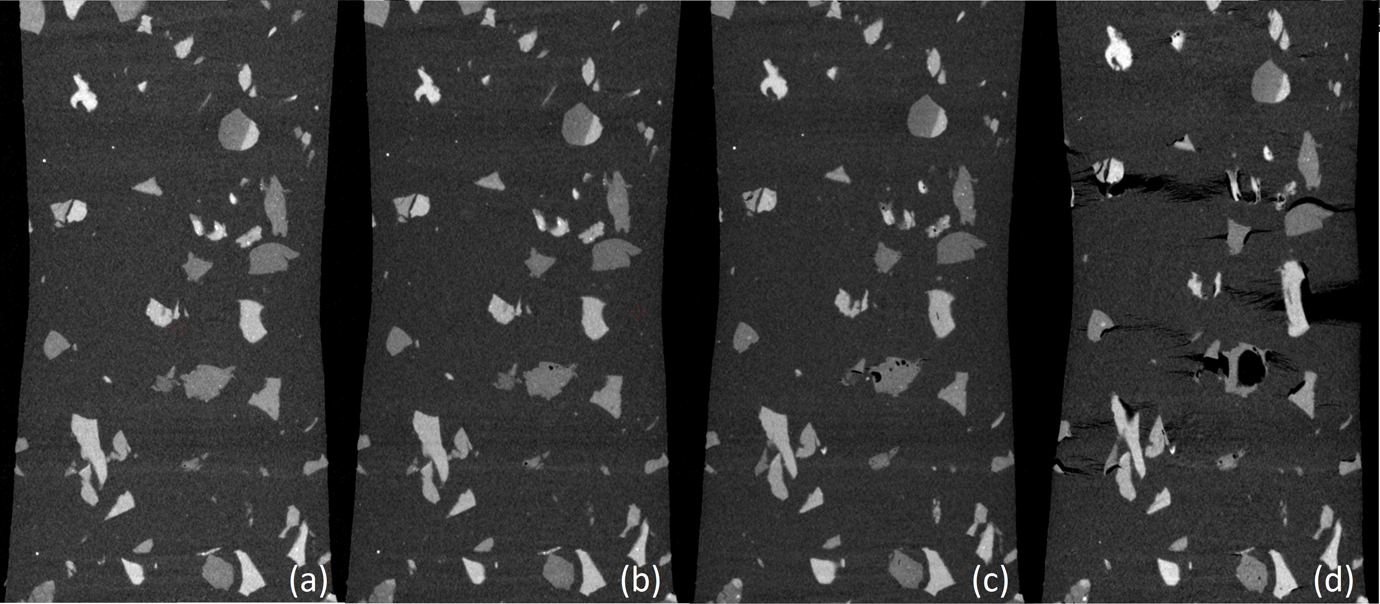
Tomography in situ of a sample 90/10 at four step of deformation: (a) unstrained sample, (b) first stage of deformation (ε n = 0.008), (c) second stage of deformation (ε n = 0.0225), (d) sample just before failure (ε n = 0.131).
Conclusions
In this article, the formulation and injection of composite PP-filled WTR were successfully carried out. Imaging analyses have shown no particles cluster and no voids as confirmed by Figure 4. Due to the fluidity of PP matrix with the MFI of 55 g/10 min, particles are well surrounded and homogeneous microstructure of composites has been obtained using chemical compatibilizer. The analyses of the fluidity index (MFI) gave the preference to the compatibilizer content of 20% in weight of WTR. Tomography image analyses have allowed determining microstructural characteristics of blends as volume fraction, particle distributions and shapes. Dynamic behaviour of blends as a function of WTR content has been investigated and differences in coefficients of thermal expansion of matrix and WTR have been evoked to explain unusual curves positioning at low temperature. Lost factor evolution as function of temperature and strain rate sensitivity has showed the damping effect of WTR content in composites behaviour. On the other hand, stress at break has decreased with WTR content and the dispersion of sample elongation at break for various blends tested has been found. Quasistatic tensile tests at room temperature completed previously cited tests and expected stiffness sensitivity has been found. Indeed, the higher the rubber content in blends is, the softer they are. It is consistent with literature where this phenomenon is also observed with other matrix such as polyethylene. 23 Observations of postmortem tensile samples have also been done. They have shown that the particles are broken consequently to stress and strain fields transferred from the matrix to rubber particles. Therefore, investigation of these local mechanical fields is of major importance to understand the global behaviour of blends. A system of tension test in situ has been developed to allow the investigation of damage process. A study of damage apparition and damage growth has to be continued. Indeed, the knowledge of stress–strain fields occurring around particles and in the matrix would provide precious information on blends damage. The first results of in situ tensile tests are promising but the system has to be improved to obtain a better strain–stress state control.
Footnotes
Acknowledgements
The authors wish to thank RBS Recycling for supplying WTR and Total Petrochemicals for supplying Orevac CA100 (PP-g-MA). Dr Raphaël Pesci of Laboratoire d’Etude des Microstructures et Mécanique des Matériaux (LEM3) is thanked for allowing the use of optical microscopy. The authors also thank Dr Jean-Marie Hiver of Institut Jean Lamour (IJL) for the x-ray tomography images.
Funding
This research received no specific grant from any funding agency in the public, commercial, or not-for-profit sectors.