
Abstract
Spherical iron silicon (FeSi) particles and irregular shaped magnetite (Fe3O4) particles with particle sizes ≤146 μm and varying volume filler fractions up to x = 0.7 (70 vol%) were mixed with polypropylene (PP) matrix. The samples were prepared by kneading and injection moulding and show particle–particle interaction at elevated filler fraction of x ≥ 0.5. Thermal and magnetic properties of the composites were characterized and show a significant increase at filler fractions of x ≥ 0.3. The thermal conductivity of PP (0.176 W/(m K)) was increased up to seven times to 1.239 W/(m K) at x = 0.7. FeSi-filled composites show slightly higher values of thermal conductivity than Fe3O4-filled composites. The magnetic permeability of the composites rise from 1 for PP to a maximum value of 23.1 for PP/FeSi composites at x = 0.7. The nonlinear increase in the thermal conductivity corresponds with the lower boundary of the Hashin–Shtrikman model. The Bruggeman model can be applied to describe the nonlinear increase in the magnetic permeability. Magnetic permeability increases with mean particle diameter as well as magnetic coercivity and loss dissipation increases with inverse mean particle diameter.
Keywords
Introduction
In general, most of the polymers show low-thermal conductivity and no magnetic permeability. Therefore, they are used for insulations and housing devices. To modify the properties of thermoplastic polymers, fibers and particles can be admixed to the polymer melt, for example, in kneading, extrusion and injection moulding processes. This implements the properties of the filler material to the composites regarding the material, size, distribution and content of the filler. 1 –4 For example, soft magnetic nano- or microparticles can be incorporated as fillers in a nonmagnetic polymer matrix to create functionalized polymer-bonded soft magnetic composites (PBSMCs) with customized magnetic properties, having a continuous process in mass production. 5 –10 Nowadays, PBSMC becomes increasingly important in industrial sectors to substitute seldom materials, like rare earth-metals, and produce functional components and structural elements, such as electromagnetic screening devices or inductivities in electrical machines. 11 Furthermore, the material can be used for noise and vibration control by increasing the weight of the composites with increasing filler fraction. 12
The homogeneity and the content of the particles embedded in the polymer material depend on the processing parameters as well as particle–particle and particle–polymer interactions, which strongly affects the properties of the composite parts as well as the flow behavior of the composite melt while processing. 13,14 In literature, the percolation threshold of electrical and thermal conductivities as well as magnetic permeability of composites with statistically distributed spherical magnetic microparticles are mentioned as x = 0.33 as well as x = 0.2, respectively. 15 In comparison with magnetite (Fe3O4), iron silicon (FeSi) shows high permeability, no magnetostriction 16 and consequently low magnetic losses.
Thermal conductivity, thermal diffusivity and specific heat capacity of various particle-filled polypropylene (PP) are indicated by Weidenfeller et al. 17 Kirchberg et al. characterized the thermal degradation, mechanical behavior and viscosity of FeSi particle-filled PP. 14,18 The influence of particle size and particle alignment on magnetic properties was determined by Anhalt 19 and Weidenfeller et al. 20 However, the theoretical approximation of the effects of particle material, size and content up to 70 vol% on thermal conductivity and magnetic permeability of injection molded PP/FeSi and PP/Fe3O4 composites was not explicitly reported in the literature, while it is important to adopt it to other composite materials and to thoroughly understand the processing behavior in melt processing, for example, extrusion or injection molding. As thermal conductivity of the composites mainly influences the cooling of the material, for example, in injection moulding process, 21 it has to be considered during the process simulation. Furthermore, the suitability of PBSMC in thermal and magnetic applications needs to be predicted by theoretical approximation of these composite properties.
Theoretical consideration
The examined PBSMCs are two-phase materials that consist of a low-conductive polymer matrix and highly conductive iron-based soft magnetic microparticles. With increasing filler fraction, the particles start to interact with each other by direct contacts when the electrical percolation threshold of the composite is reached.
Magnetic percolation of well-distributed spherical particles was found at the filler fraction of approximately x = 0.2, when the distance between the particles is below 2.7 times that of the particle radius. 22 Magnetic forces are generated by moving electrical charged particles, which induces magnetic dipoles in the magnetic material which, in some respects, are analogous to electric dipoles. Referring to Anhalt and Weidenfeller, 23 the increase in permeability with filler fraction without inner demagnetizing fields would follow a square function, which course is changed by demagnetizing effects. 24
In literature, several empirical and phenomenological models can be found to describe the thermal and magnetic properties of two-phase materials.
25
–30
The self-consistent model of Hashin and Shtrikman gives an upper (HS+) and lower (HS−) boundary between which the property of the composite can be found. The Hashin–Shtrikman model was developed to describe the magnetic permeability of two-phase materials depending on their composition. Due to the mathematical analogy between transport phenomena like magnetic, electric and thermal properties, the thermal conductivity (λ
C) of a composite consisting of a homogenous thermoplastic matrix with a conductivity of λ
T and a volume fraction of (1 − x) as well as conducting spheres (e.g. particles) with a thermal conductivity of λ
P and a volume fraction of x relates to the lower boundary of the Hashin–Shtrikman model λ
HS−, shown in equation (1).
28,29

The Bruggeman model was developed to describe the dielectric constants of isotropic materials.
30
Due to the mentioned mathematical equivalence, the Bruggeman model can also be used to model the thermal conductivity of isotropic materials (equation (2)).
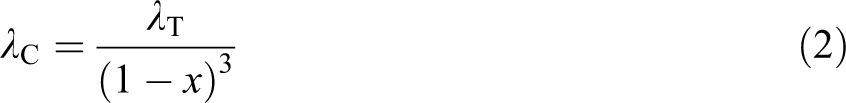
Equation (2) shows the Bruggeman model for a mixture of low-conductive polymers (λ T) and high-conductive particles (λ P >> λ T). Hence, thermal conductivity of the particle material λ P is assumed as infinite in the Bruggeman model.
A correlation of experimental magnetic permeability results with Hashin–Shtrikman and Bruggeman model was presented elsewhere. 31 Because of the mentioned mathematical analogy of thermal and magnetic properties, experimental and theoretical behavior—according to equations (1) and (2)—of magnetic properties were investigated in this study.
Experimental
Materials
Polypropylene DOW H 734 52 RNA (Dow Customer Information Group, Edegem, Belgium), a semicrystalline isotactic homopolymer with a density of 0.9 g/cm3, was chosen as a matrix material.
The spherical FeSi (FeSi6.8) particles with a particle diameter of d < 106 μm were supplied by Höganäs AB (Höganäs, Sweden) and produced by gas atomization. The iron-based material consists of 6.5–6.9 wt% silicon, 0.02% carbon dioxide, 0.15% oxygen and 0.01% nitrogen. The density of the powder material is given as 7.48 g/cm3. The particles were annealed for 2 h at 1573 K in a nitrogen–hydrogen atmosphere to improve magnetic properties of particles by recrystallization, dissolving silicon precipitations and removing carbon. 32 The FeSi particles were sieved into four particle size fractions with monomodal density allocations shown in Figure 1.
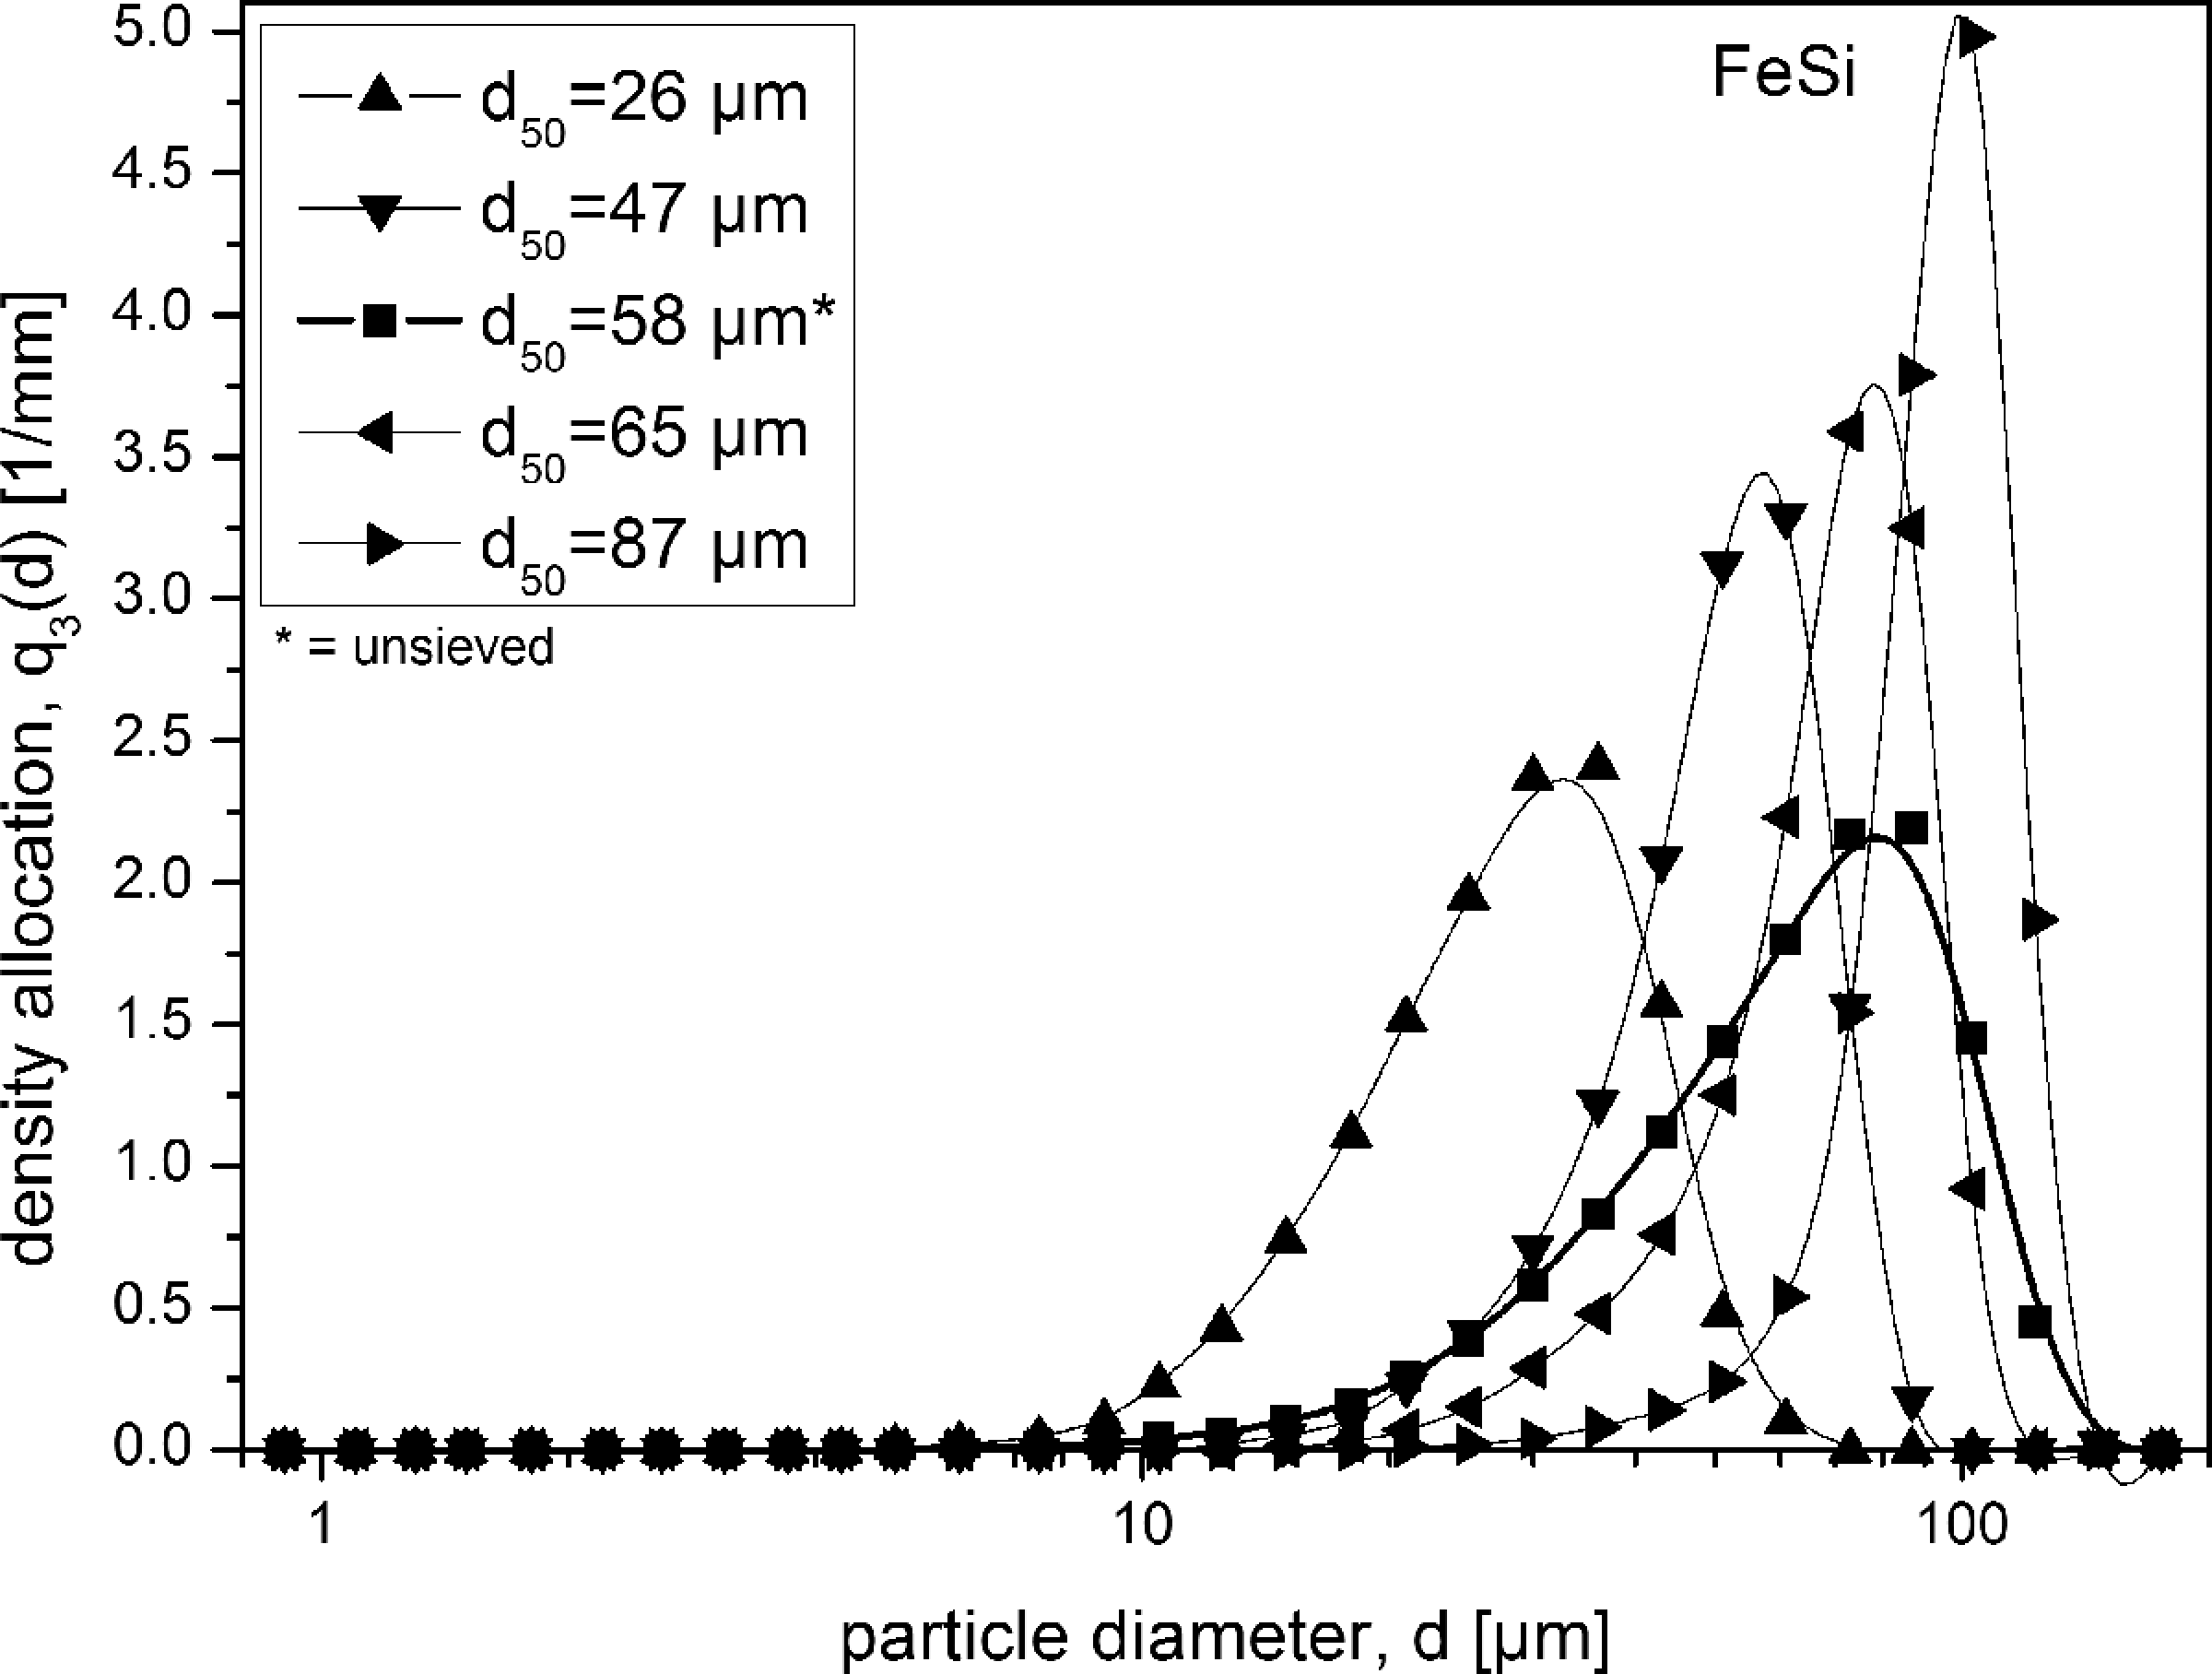
Density allocation of unsieved and sieved FeSi particle size fractions. FeSi: iron silicon.
The used irregular-shaped Fe3O4 particles with a particle diameter of d < 146 μm and a density of 5.1 g/cm3 consist of 98.1% Fe3O4, 0.3% calcium oxide, 0.4% magnesium oxide, 0.1% aluminum oxide, 0.6% silicon dioxide, 0.2% titanium oxide and 0.2% vanadium oxide and were supplied by (MagniF25, Minelco GmbH, Essen, Germany). Figure 2 illustrates the relatively wide density allocation of the Fe3O4 particles.
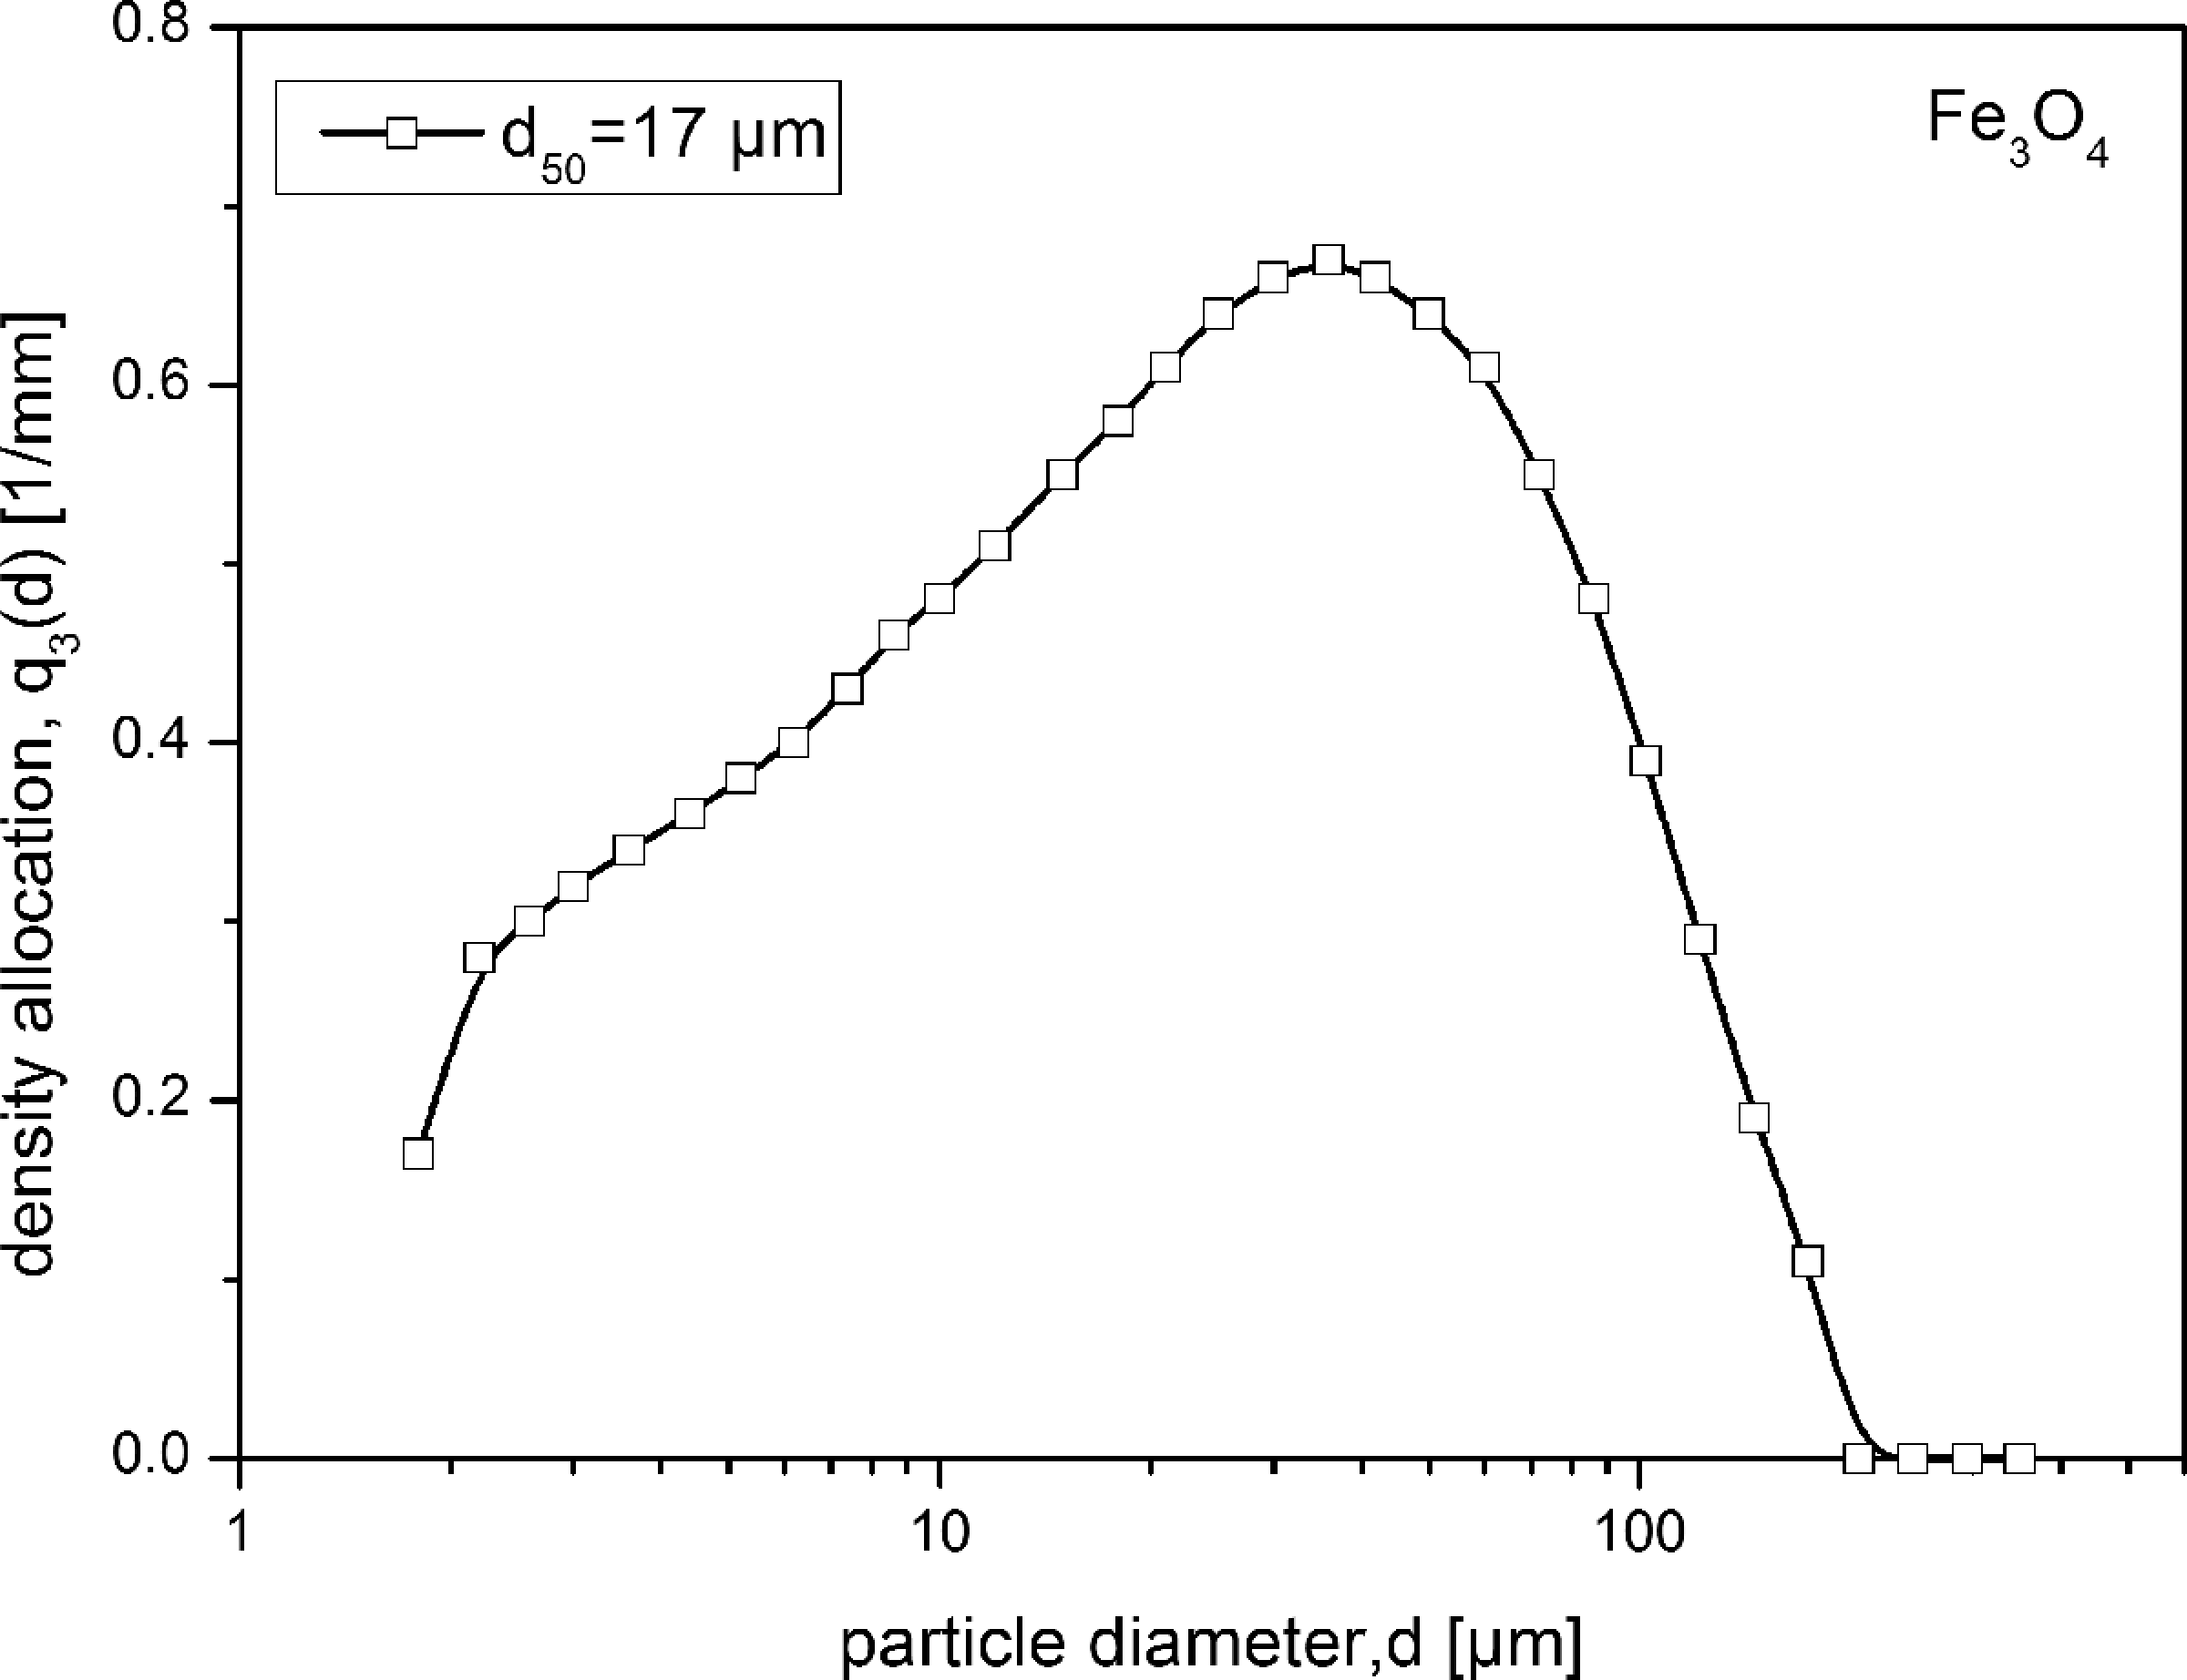
Density allocation of Fe3O4 particle size fraction. Fe3O4: magnetite
Despite the particle size distribution, FeSi and Fe3O4 particles show different particle shapes as mentioned above. The scanning electron micrographs in Figure 3 show exemplary FeSi and Fe3O4 particles with spherical and irregular shape, respectively.
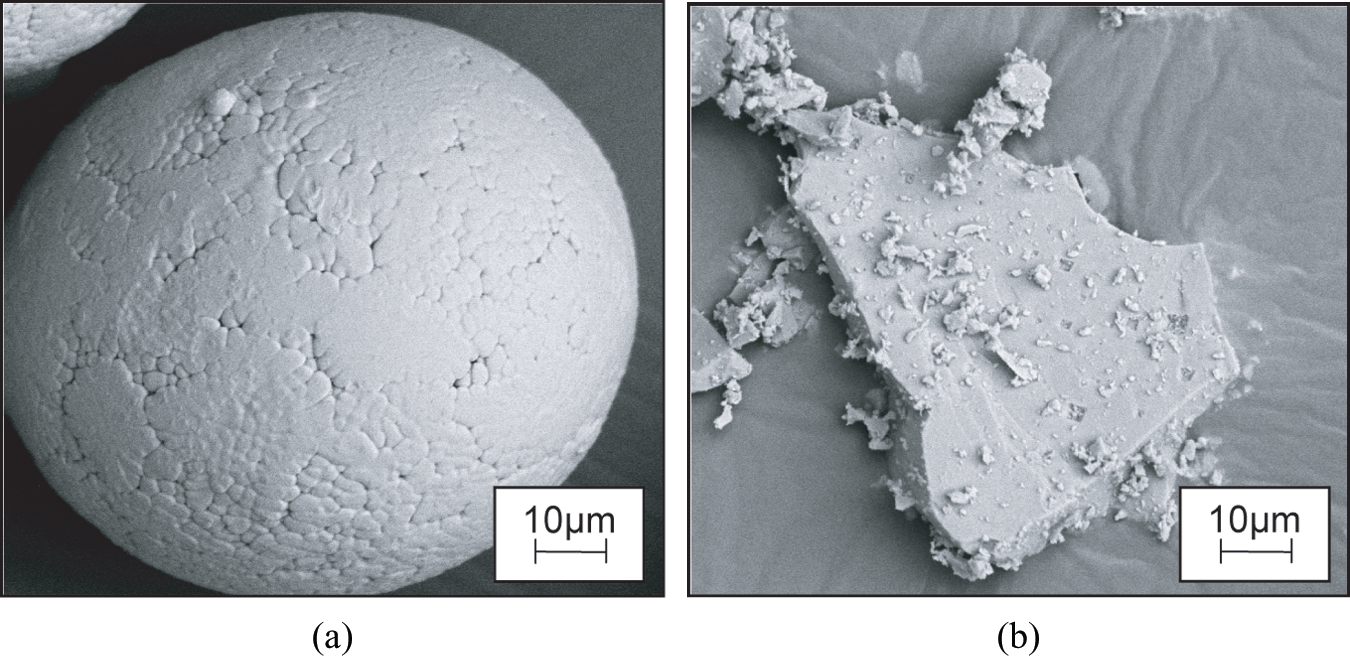
Scanning electron micrographs of (a) spherical FeSi and (b) irregular-shaped Fe3O4 particles (magnification ×1000). FeSi: iron silicon; Fe3O4: magnetite.
Thermal conductivity λ and magnetic permeability μ max of PP, FeSi and Fe3O4 bulk materials are listed in Table 1.
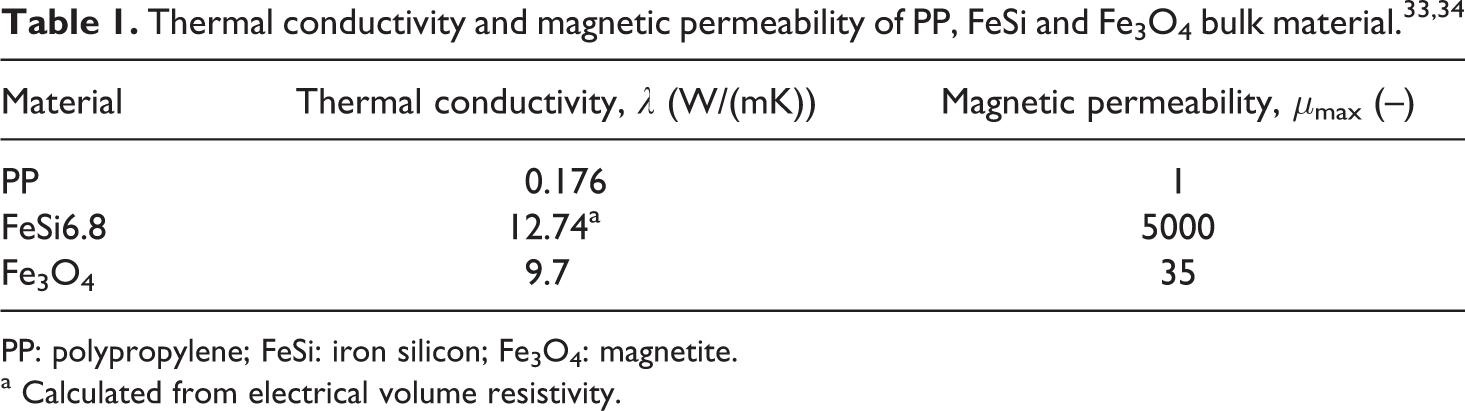
PP: polypropylene; FeSi: iron silicon; Fe3O4: magnetite.
a Calculated from electrical volume resistivity.
Table 2 shows a composition of additives which were incorporated to improve the processing and material properties of the composites. The percentages of the additives are related to the mass of pure PP.
Additive composition mixed in polypropylene.
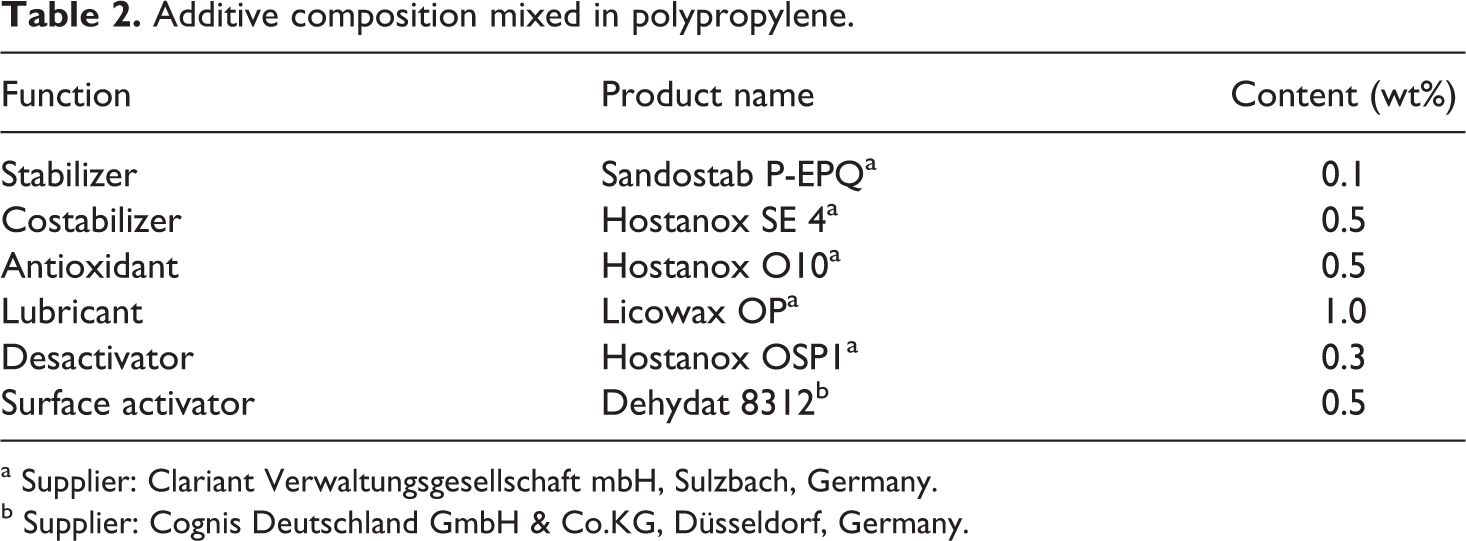
a Supplier: Clariant Verwaltungsgesellschaft mbH, Sulzbach, Germany.
b Supplier: Cognis Deutschland GmbH & Co.KG, Düsseldorf, Germany.
Sample preparation
The PP and the additives (Table 2) were mixed and compounded with the FeSi and Fe3O4 particles using a co-rotating kneader (Rheomix 600p, PolyLab-System Thermo Haake GmbH, Karlsruhe, Germany). The soft magnetic particles were gravimetrically admixed to the PP matrix. Afterward, the granulated composite was injection molded (Allrounder 220 S 150-60, Arburg, Lossburg, Germany) to rectangular specimens with a gauge section of 30 × 4 × 2 mm3 for magnetic and scanning electron microscopic (SEM) characterization and round sample with a thickness of 2 mm and a diameter of 50 mm for thermal conductivity measurement. Injection pressure of 1000 bar and injection rate of 10 cm3/s was used. Depending on the filler fraction, the temperature of the melt ranged between 473 and 493 K. The mold temperature was held constant at 293 K. Samples of pure PP were produced as a reference. For the sake of describing the physical properties of the particulate-filled polymers, the content of filler material is shown in volume percentage ξ as well as volume fraction x, respectively.
Methods
SEM was done with a Cambridge CamScan S4 (Cambridge Scanning Ltd, Cambridge UK). Thermal conductivity was measured at a constant temperature of 323 K by a computer-controlled instrument used to measure the thermal conductivity of materials by the guarded heat flow meter method (TCA 200-LT-A, NETZSCH-Gerätebau GmbH, Selb, Germany) with a repeating accuracy and reproducibility of 5%. The test sample is placed between two heated surfaces controlled at different temperatures with a heat flow from the hotter to the colder surface. The thermal resistance of the interfaces between the sample and adjacent surfaces is reduced by applying a coupling agent, for example, silicone heat sink compound. 35
The magnetic measurements were performed with an in-house developed computer-controlled hysteresis measurement system similar to the one described previously. 36,37 For all materials, permeability measurements versus magnetic field strength was carried out at ambient temperature and a frequency of 1 Hz in the region from magnetic field H = 200–50,000 A/m with 50 measurement points were used. Furthermore, the low-field permeability (at 3% of maximum polarization induction) and the maximum permeability versus filler fraction were analyzed with a repeating accuracy of 3%. Due to the low reachable polarization J c of a composite, which is linearly dependent on the filler fraction and the saturation polarization J s of the magnetic filler according to J c = xJ s, the dependency of coercivity on filler fraction was measured at a polarization of 0.07 T for the purpose of comparability.
Results and discussions
Figure 4 shows scanning electron micrographs of fracture surfaces of injection molded PP/FeSi test specimen at a filler fraction of x ≥ 0.2. The FeSi microparticles are randomly orientated and show a homogeneous distribution in the polymer matrix. Whereas, particles are relatively separated from each other at low filler fraction of x = 0.2, increasing particle–particle contact can be seen at high filler fraction (x ≥ 0.5) described by the white spots in the area of the casts (Figures 4(b) and (c)) shaped by particles, which are quarried out of the fraction surface. Hence, increasing particle–particle interaction at high filler fraction (x ≥ 0.5) can be predicted. Assuming a homogeneous particle distribution, below the electric percolation threshold (x = 0.33) no electric pathways via contacting particles through the composite can be formed. For particle fractions higher than the electric percolation threshold, more and more electric pathways are formed and also lead to more and more thermal and magnetic interactions.
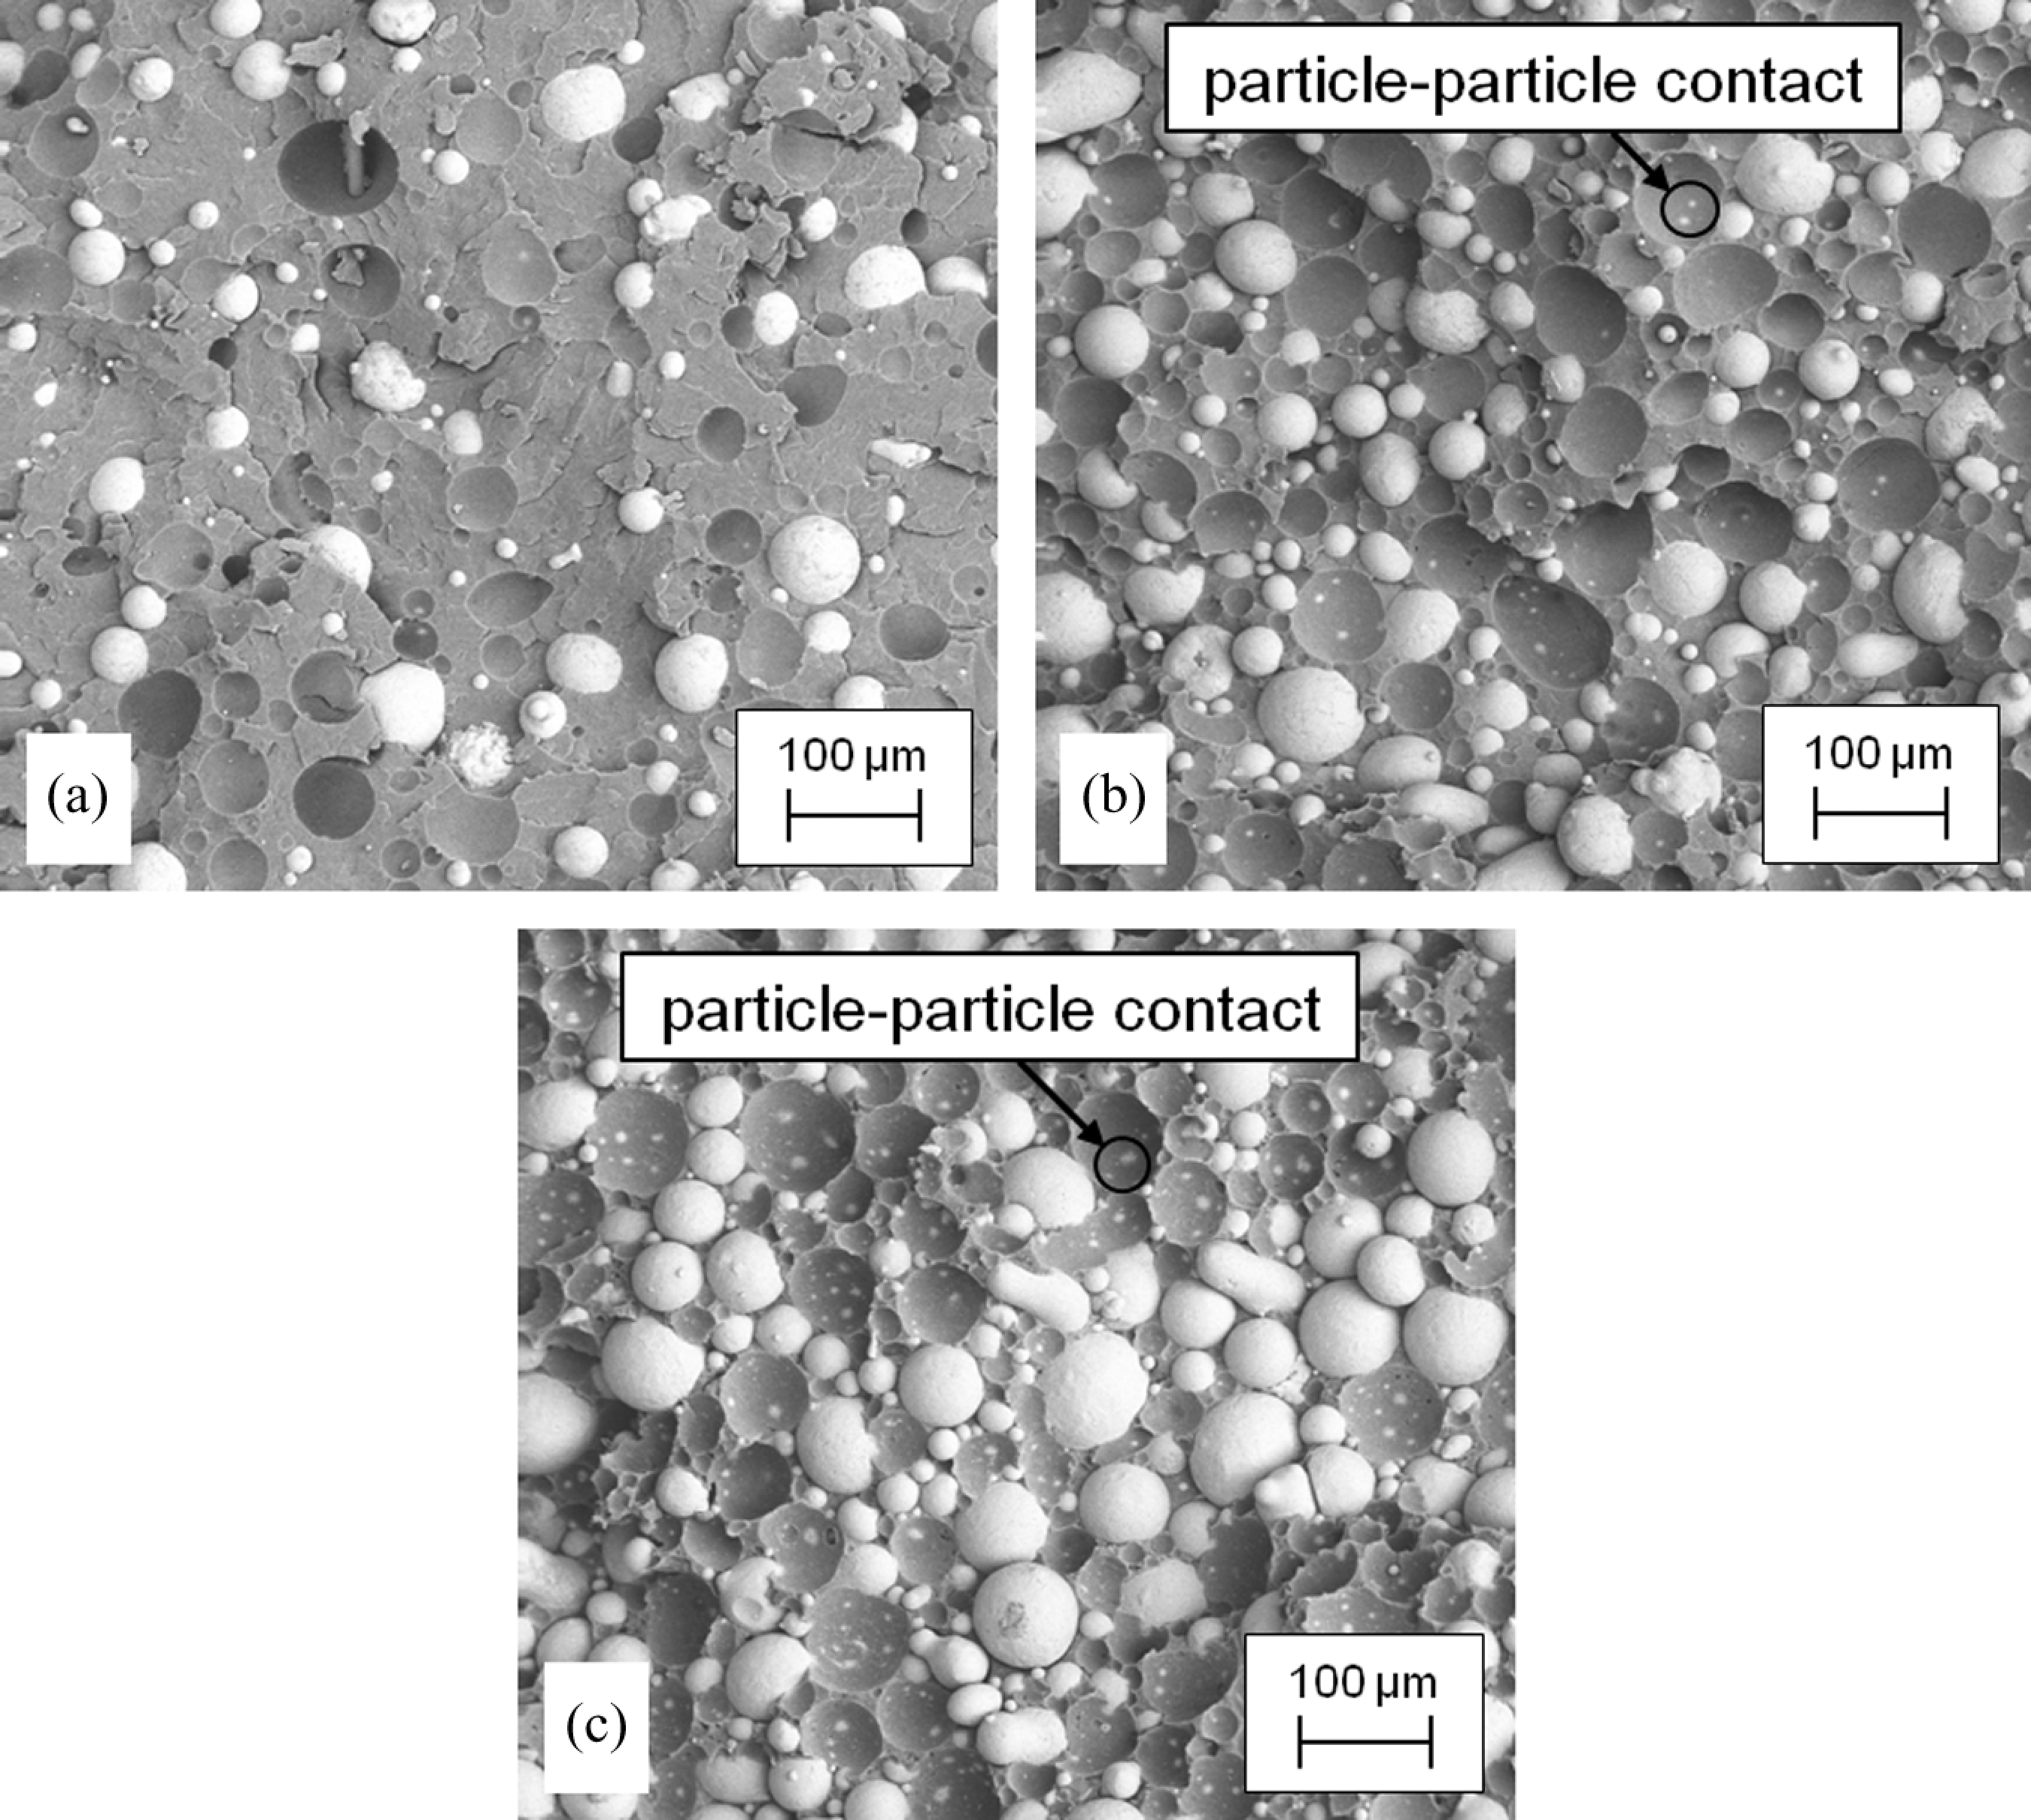
Scanning electron micrographs of unsieved spherical FeSi microparticles embedded in PP matrix with (a) x = 0.2 (20 vol%), (b) x = 0.5 (50 vol%) and (c) x = 0.7 (70 vol%; magnification ×100). FeSi: iron silicon; PP: polypropylene.
The thermal conductivity of PP/FeSi and PP/Fe3O4 composites versus filler fraction is given in Figure 5. Thermal conductivity values λ vary with increasing filler fractions from 0.176 W/(m K) for pure PP to 1.206 W/(m K) for PP + 70 vol% Fe3O4 and 1.24 W/(m K) for PP + 70 vol% FeSi. The results in Figure 5 show that the maximum relative enhancement (λ C/λ T = 7) was established for a filler fraction of 70 vol% FeSi. Starting from x = 0.3, PP filled with FeSi particles show higher thermal conductivity values than Fe3O4 particle-filled composites at x > 0.3, corresponding to the thermal conductivity λ P of the particle material (Table 1).
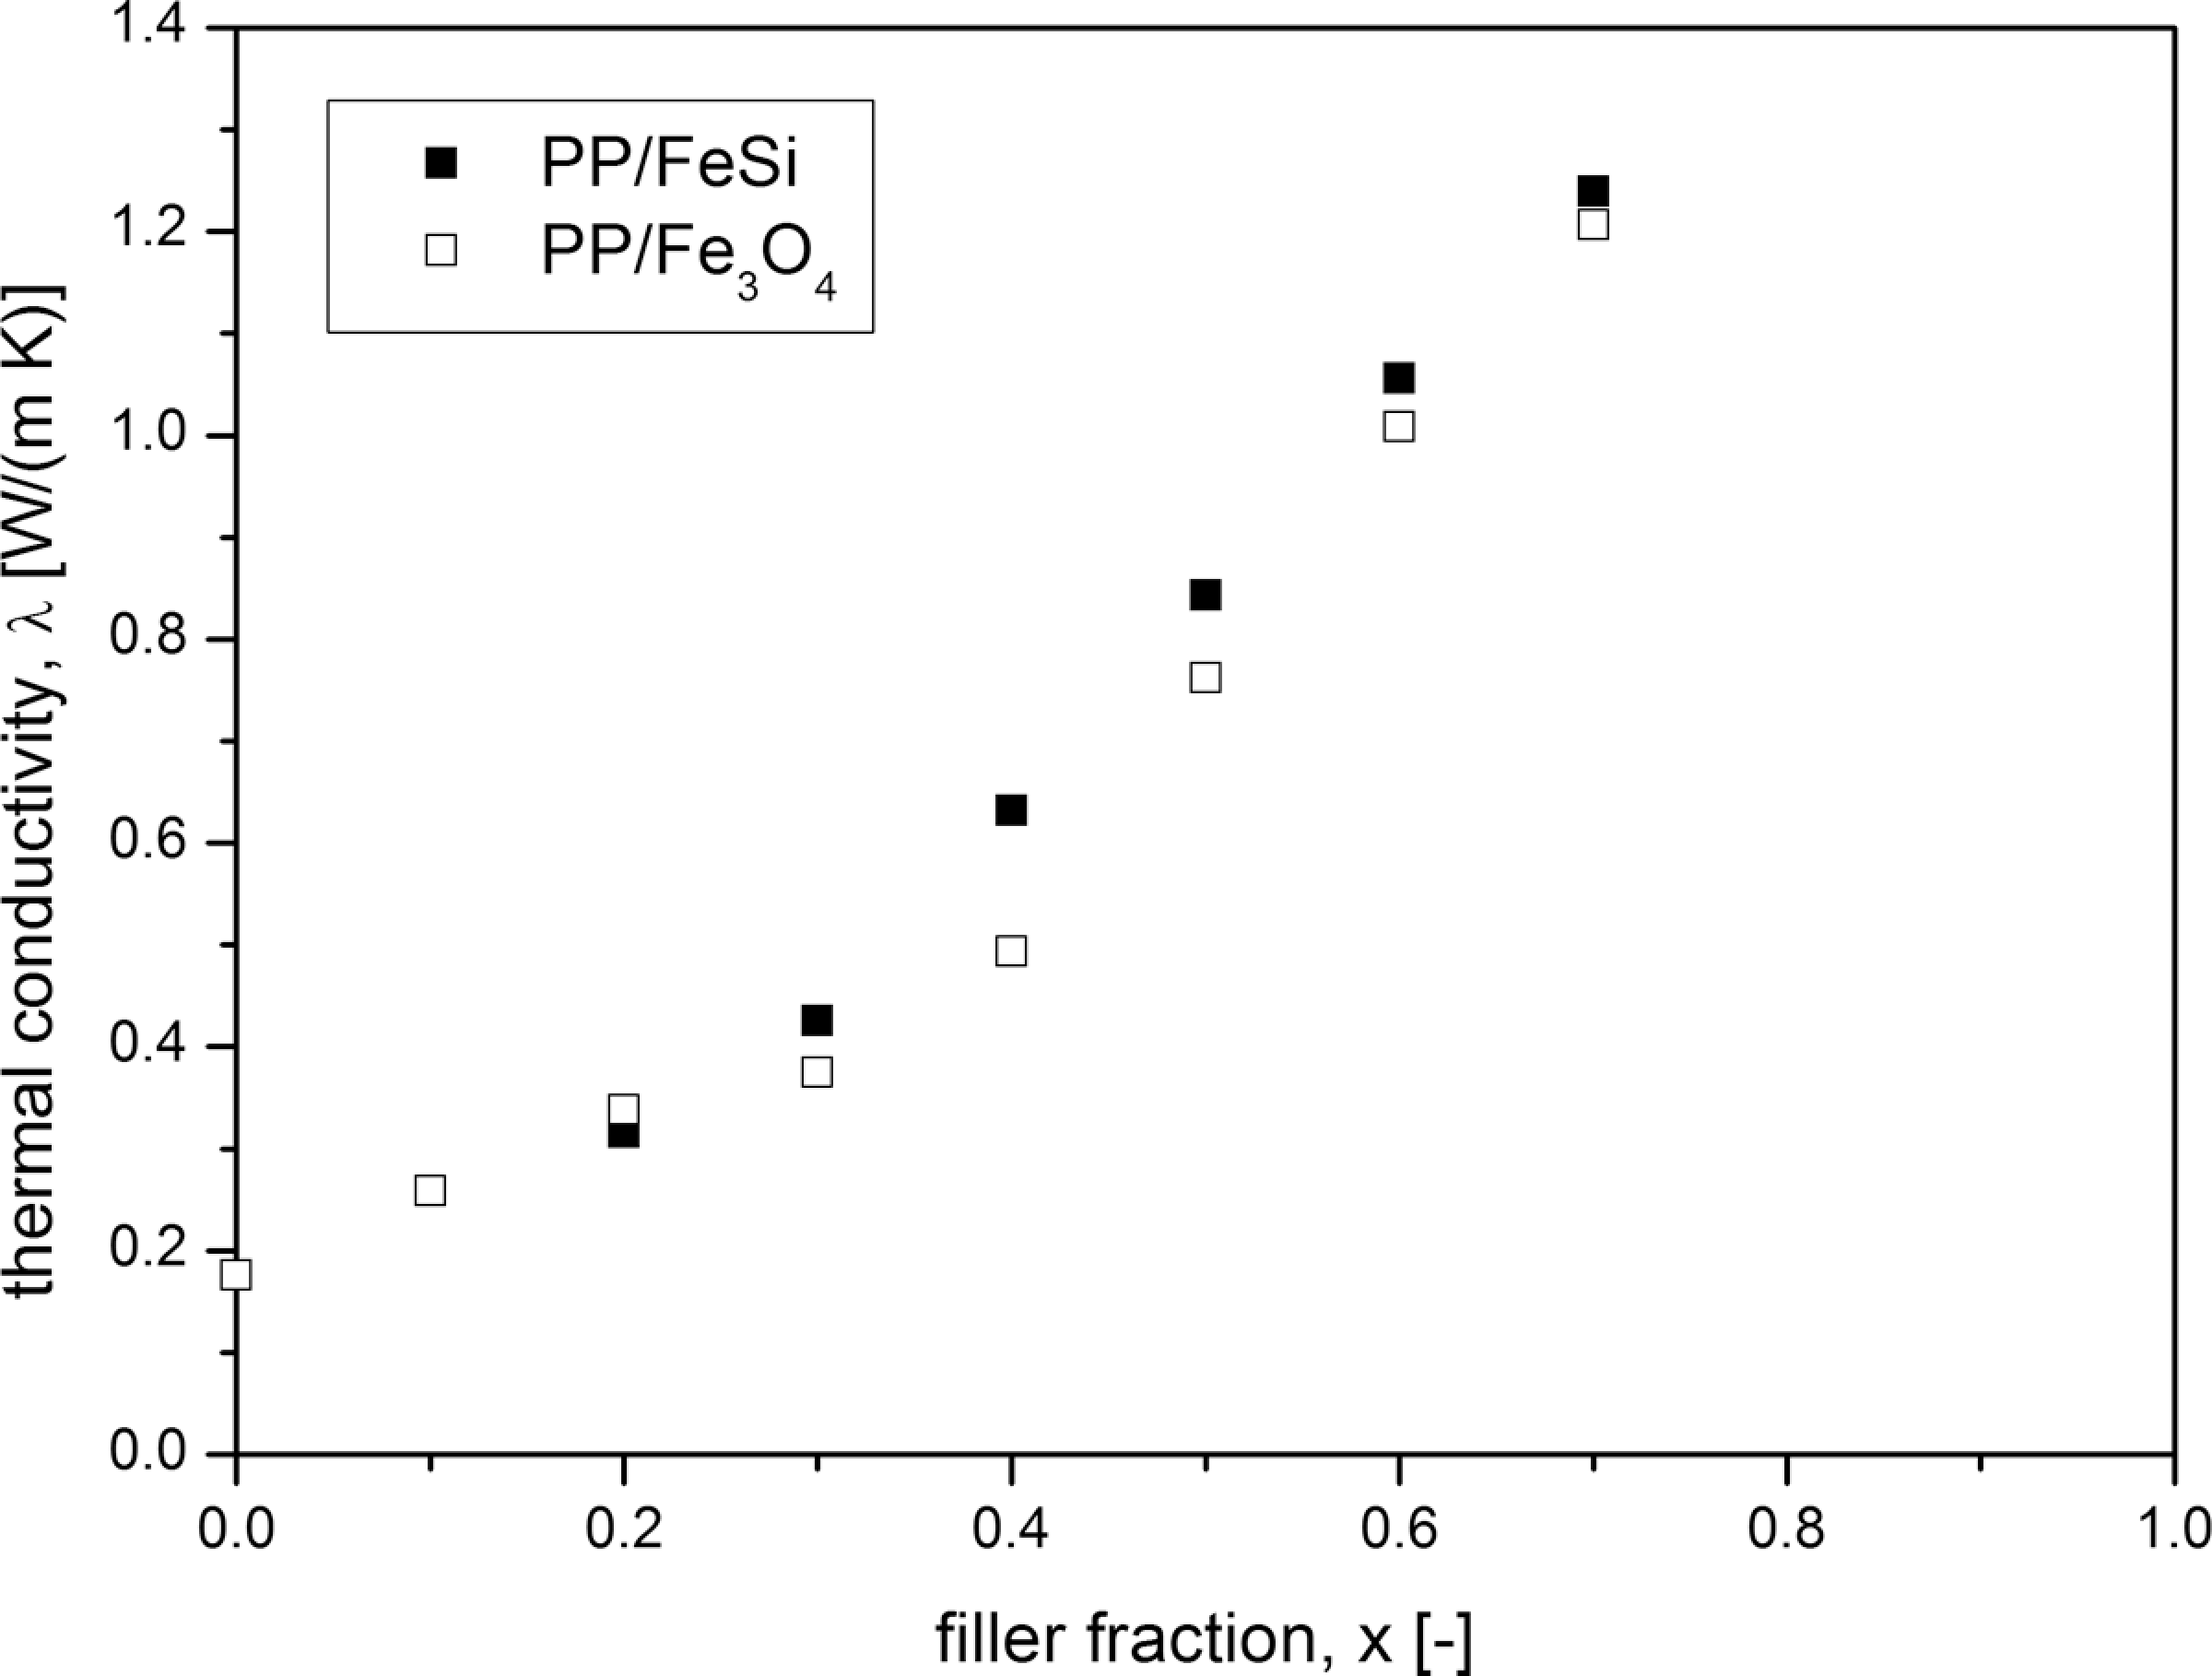
Thermal conductivity of PP/FeSi and PP/Fe3O4 composites versus filler fraction at temperature T = 323 K. FeSi: iron silicon; Fe3O4: magnetite; PP: polypropylene.
The experimental results depicted in Figure 5 in comparison with the theoretical calculation regarding the lower boundary of Hashin–Shtrikman (HS−) in equation (1) and Bruggeman in equation (2) are shown in Figure 6. The calculated graphs of the lower boundary of Hashin–Shtrikman (HS−) model for PP/FeSi and PP/Fe3O4 composites show no significant divergence up to x = 0.6. At high filler fraction, the influence of the thermal conductivity of particle material can be noticed by different slope for PP/FeSi and PP/Fe3O4 composites.
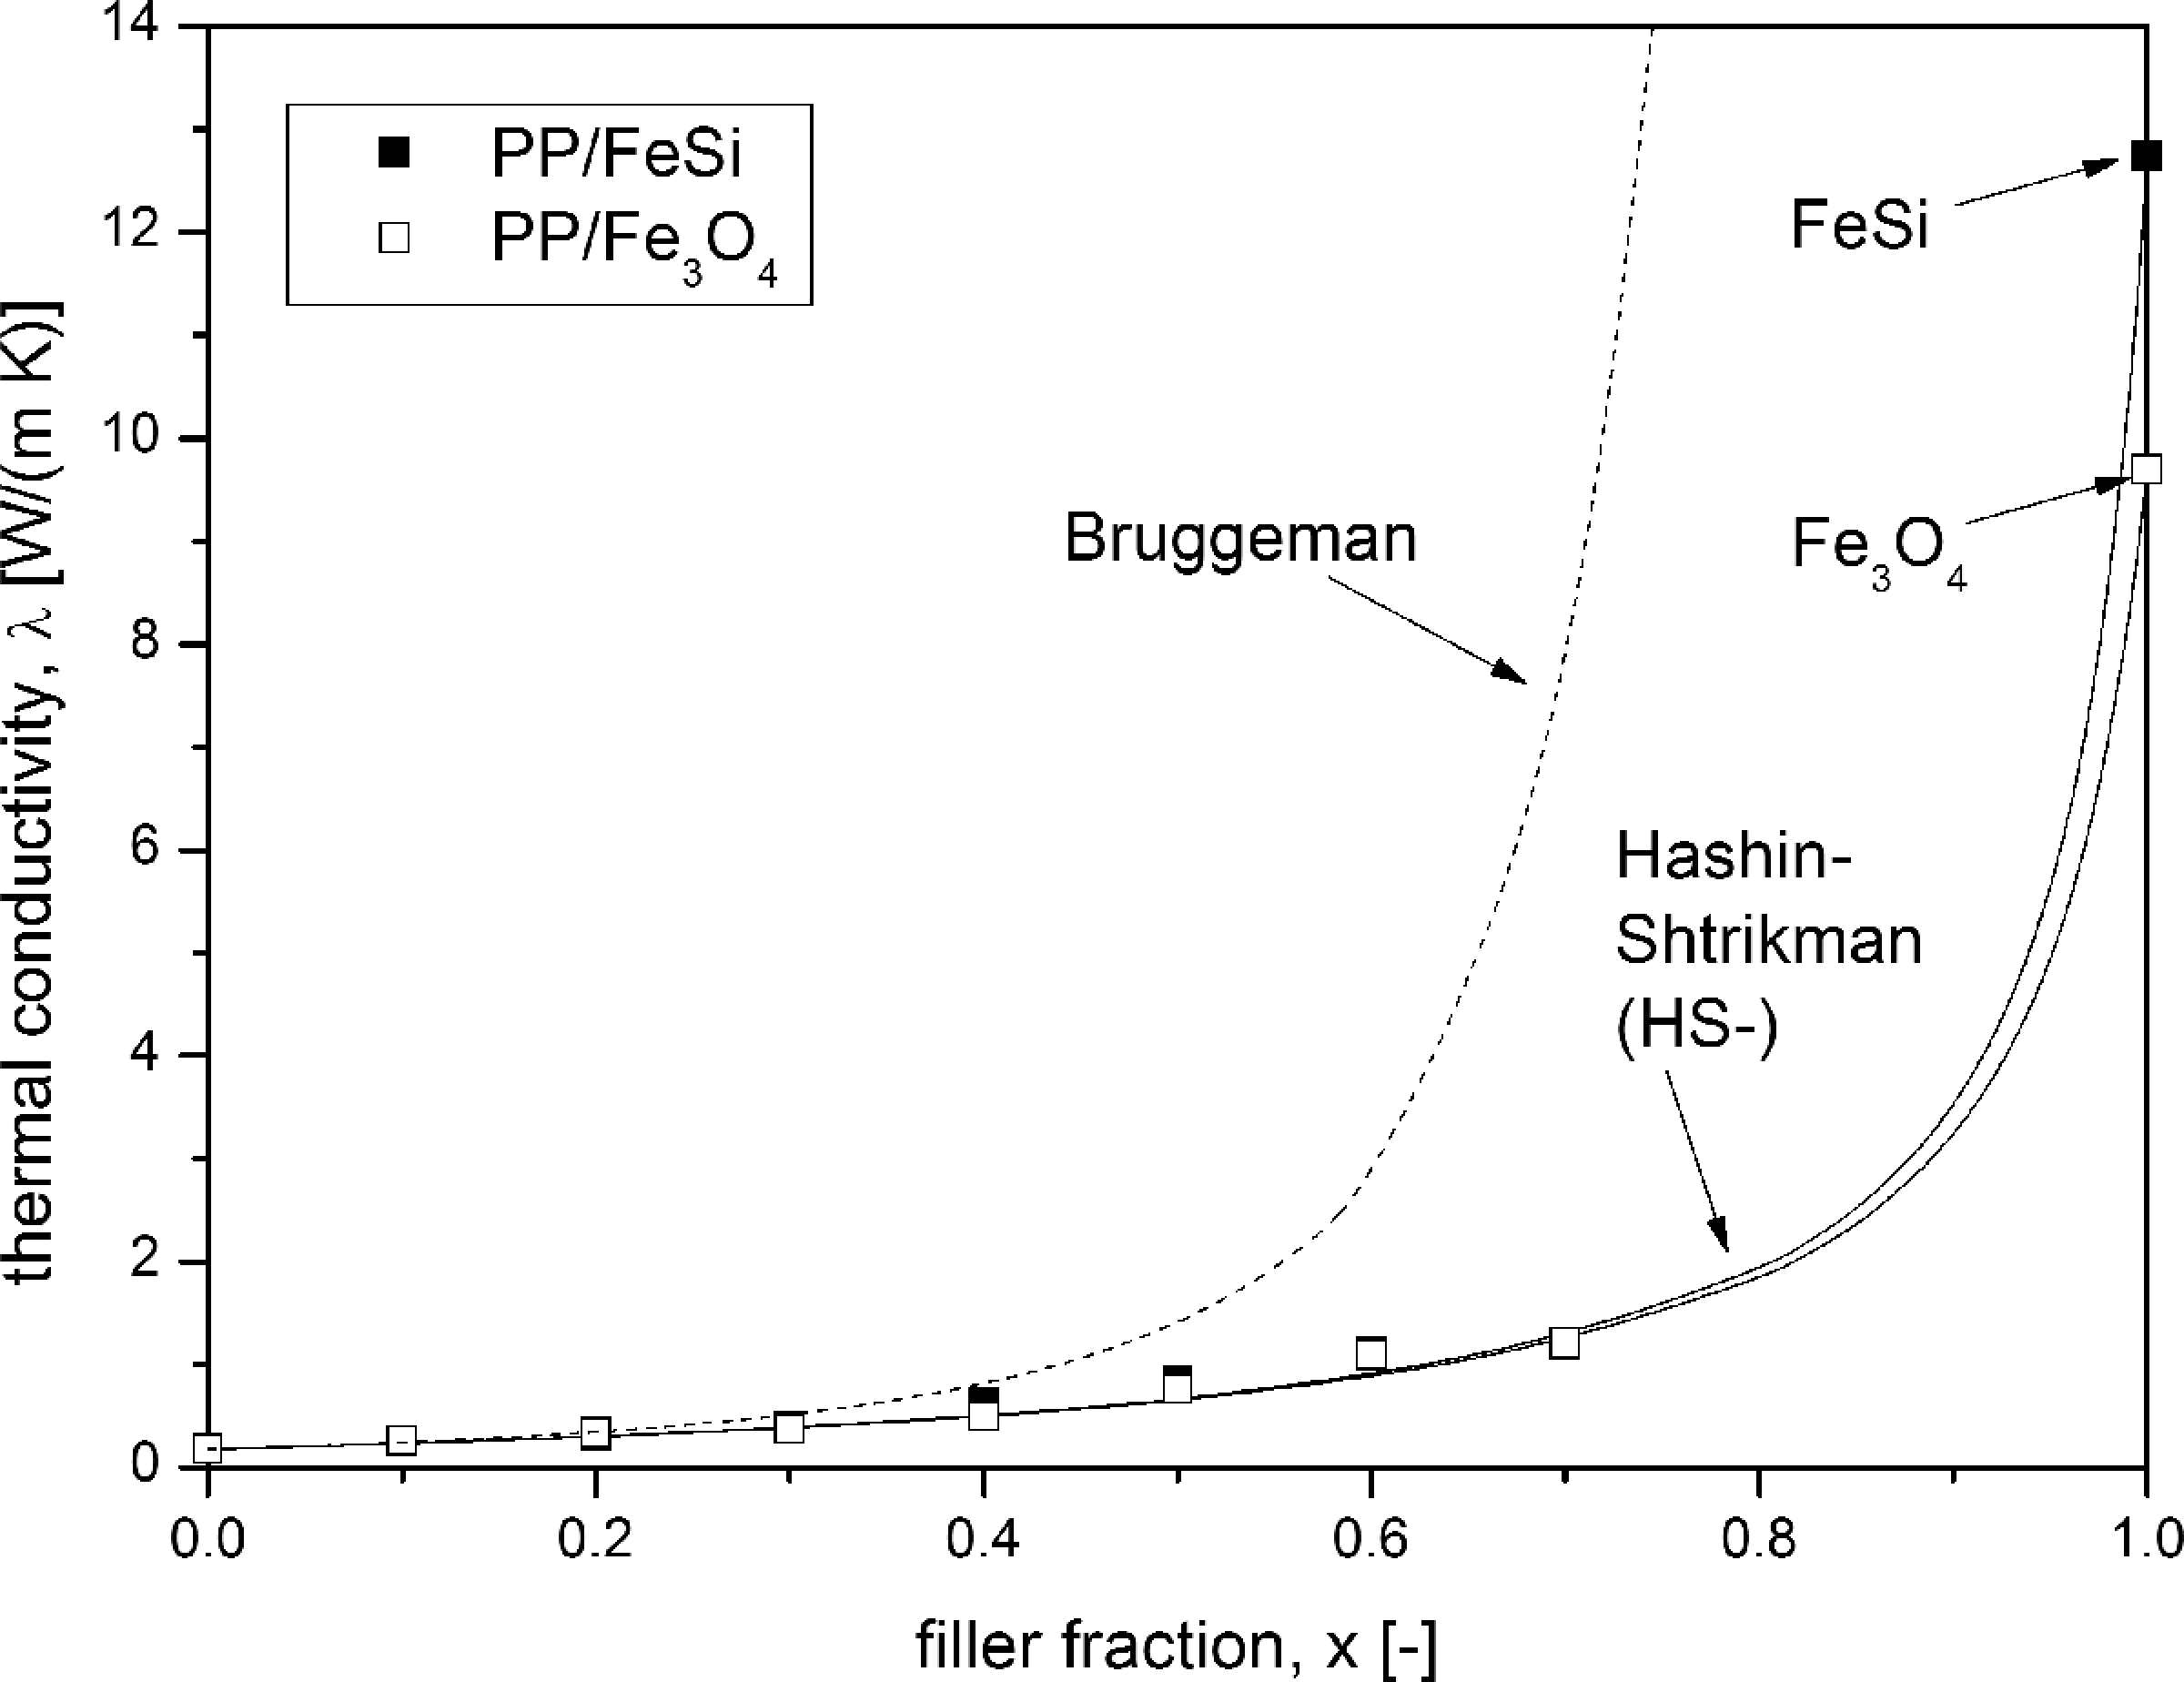
Experimental and theoretical results of thermal conductivity of PP/FeSi and PP/Fe3O4 composites versus filler fraction at temperature T = 323 K. FeSi: iron silicon; Fe3O4: magnetite; PP: polypropylene.
The experimental results correlate with the Bruggeman model at low filler fractions up to x = 0.3. At high filler fraction, the Bruggeman model shows a rapid increase in the thermal conductivity because of λ P → ∞. The lower boundary (HS−) of the Hashin–Shtrikman model corresponds to the experimental results at all examined filler fractions. Up to the filler fraction of x = 0.7, the thermal conductivity increases slightly. According to Hashin–Shtrikman (HS−), a steeper increase in λ C can be supposed for x > 0.7. Hence, the thermal conductivity of PP/FeSi and PP/Fe3O4 composites can be approximated by the lower boundary of the Hashin–Shtrikman model (HS−). Compared with the results of PP/Fe3O4 composites with filler fractions up to x = 0.45 given by Weidenfeller et al., 29 thermal conductivity λ show lower values up to x = 0.4 and a further increase in λ up to x = 0.7, according to the lower boundary (HS−) of the Hashin–Shtrikman model. An influence of the particle shape between spherical FeSi and irregular-shaped Fe3O4 particles was not clearly observable.
Razzaq et al. 7 obtained the thermal conductivity of Fe3O4-filled polyurethane shape memory polymers at filler fraction up to x = 0.4 and found a good correlation of the experimental results with the lower boundary (HS−) of Hashin–Shtrikman model. Therefore, the experimental results of thermal conductivity of the composite materials can be calculated from the data of thermal conductivities of the filler material and the matrix by the theory of Hashin–Shtrikman (HS−) at an extended range of filler fractions up to x = 0.7.
The results can be used to approximate the thermal conductivity at each filler fraction between x = 0 and x = 0.7 for the examined PP/FeSi and PP/Fe3O4 composites and equal composite systems to characterize, for example, the cooling behavior of the composite material, while processing in injection molding or for process simulation.
Figure 7 shows the magnetic permeability of PP/FeSi and PP/Fe3O4 composites in comparison with the theoretical values calculated according to the models of Hashin–Shtrikman (HS−) and Bruggeman. Basis for the calculation in the Bruggeman equation was the magnetic permeability of the polymer μ T = 1. Basis for the calculations using the model by Hashin and Shtrikman also was μ T = 1 and μ FeSi = 5000 and μ Fe3O4 = 35 for FeSi and Fe3O4 particles, respectively.
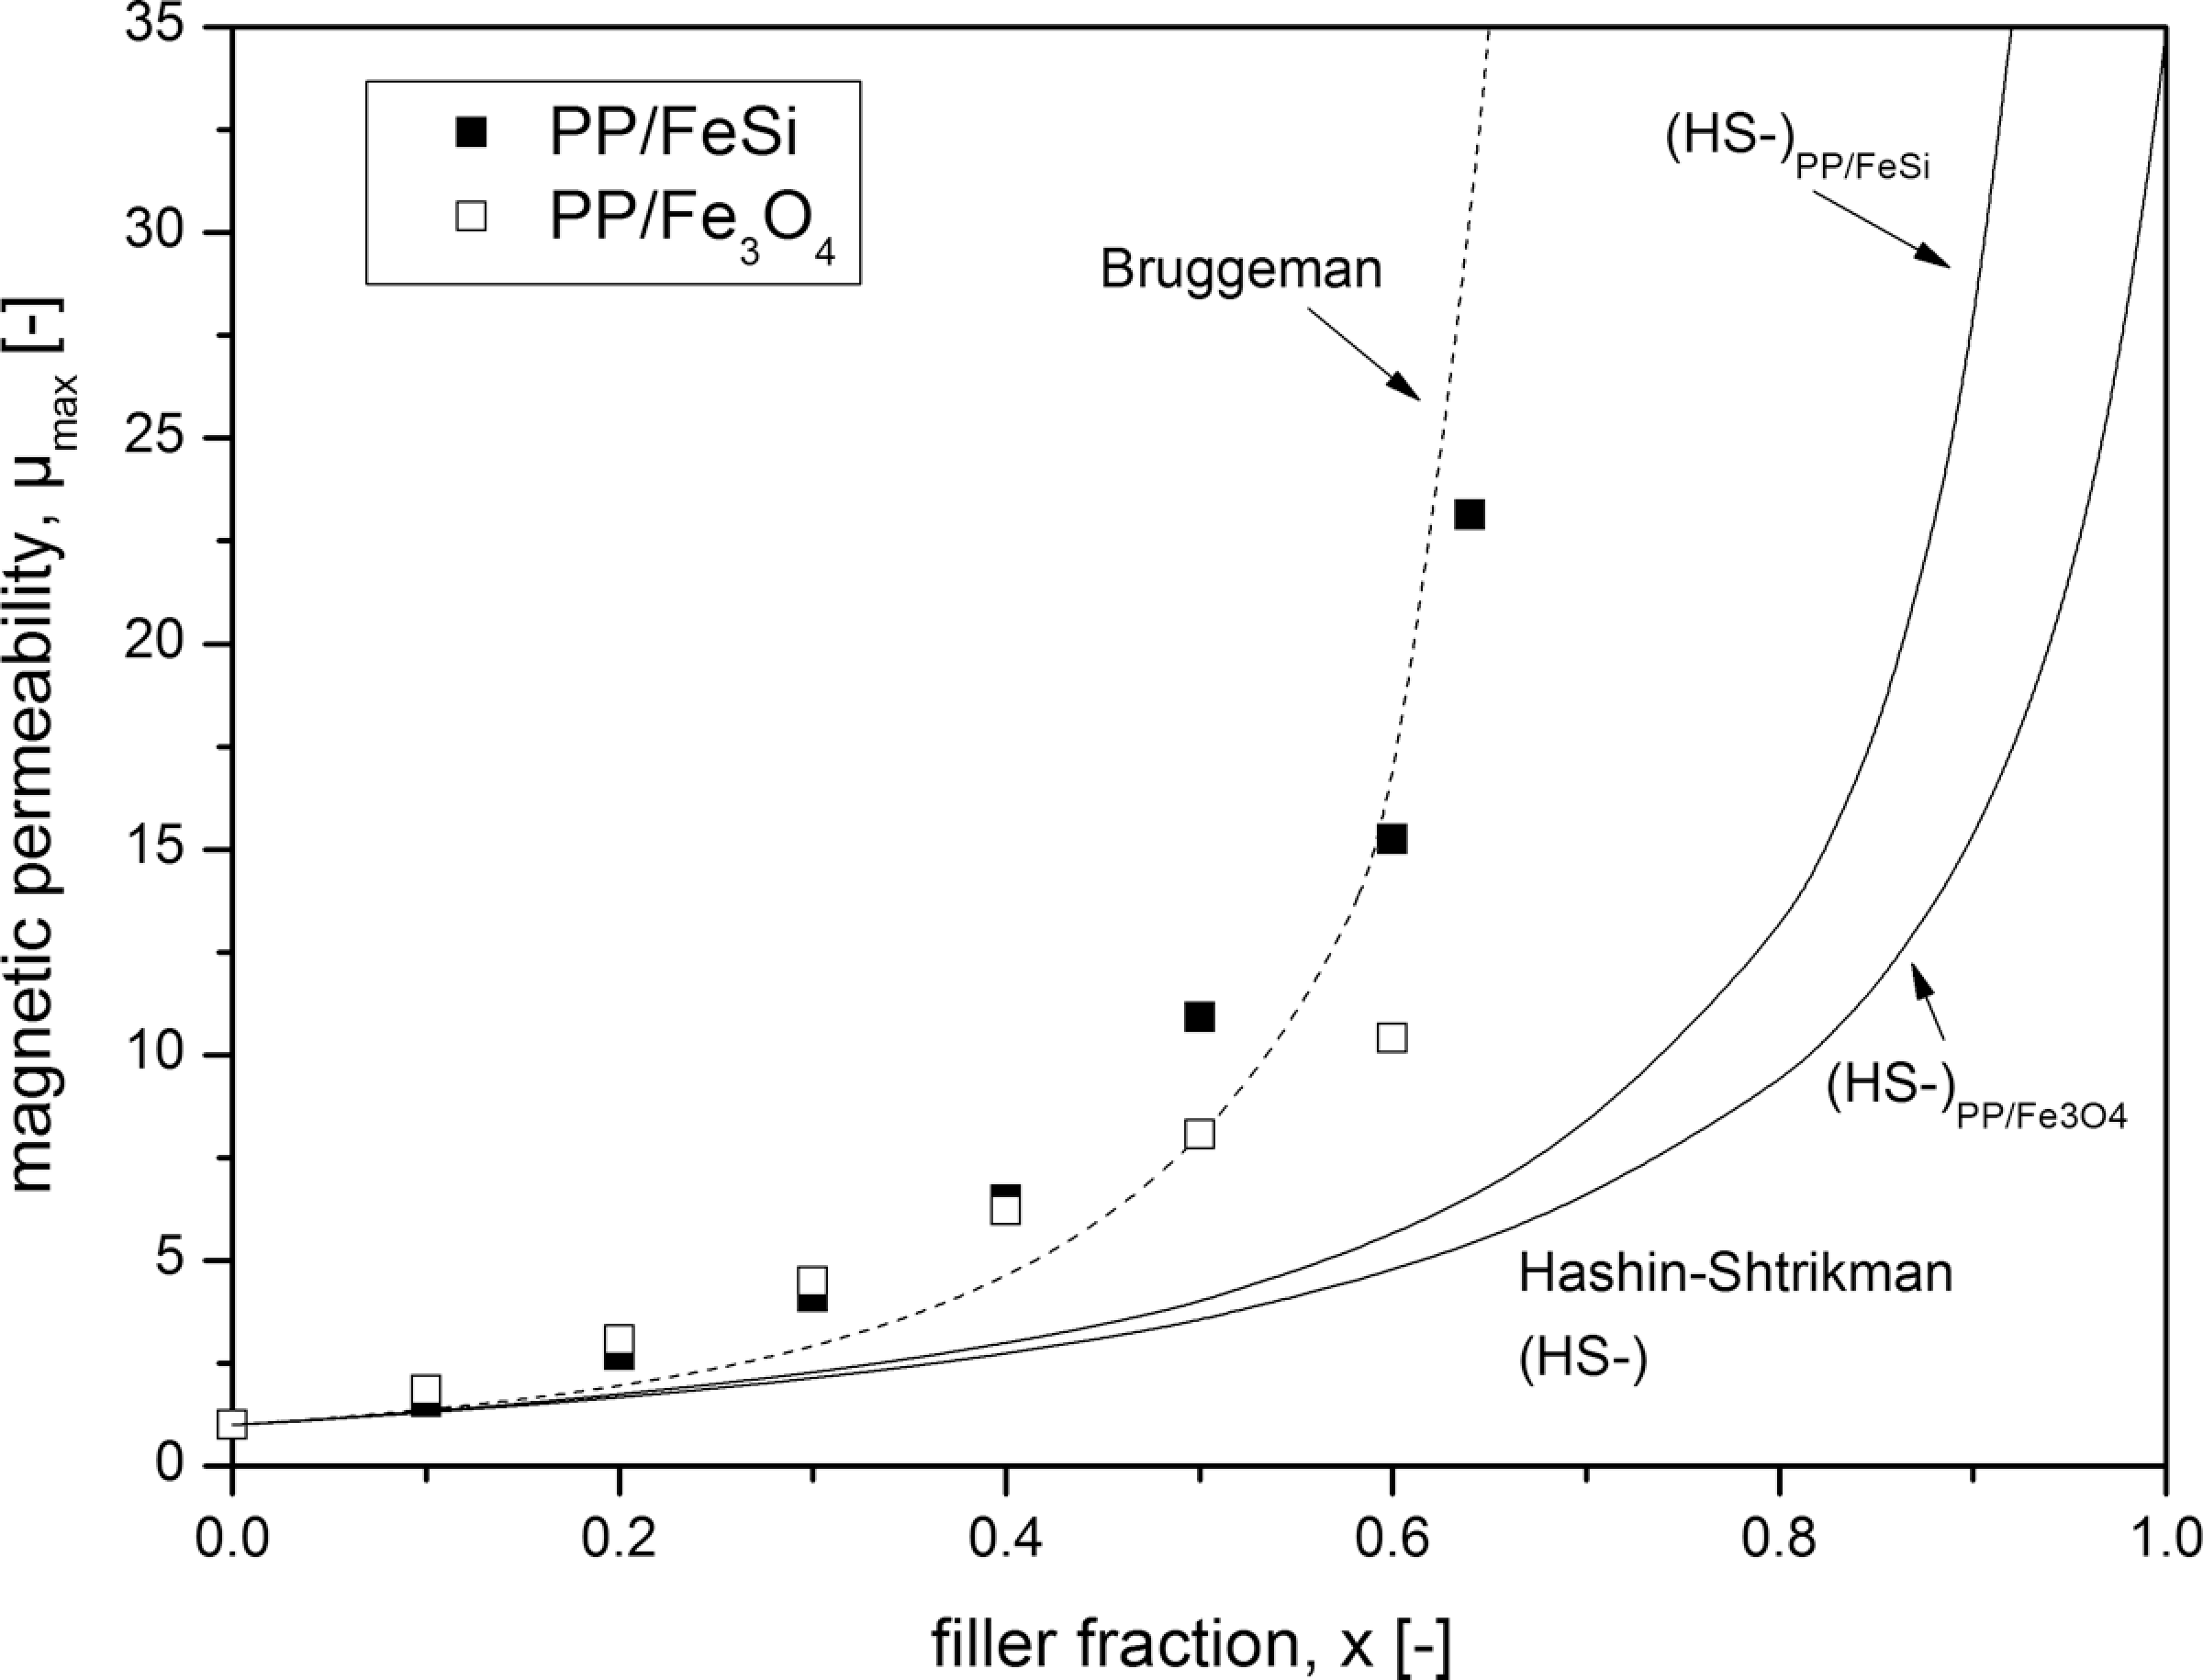
Experimental and theoretical results of magnetic permeability of PP/FeSi and PP/Fe3O4 composites versus filler fraction. FeSi: iron silicon; Fe3O4: magnetite; PP: polypropylene.
The magnetic permeability μ max in experimental values of PP/FeSi increases nonlinearly from μ max, T = 1 of PP up to μ max, C = 23.1 for PP + 70 vol% FeSi (x = 0.7) following an exponential-like curve. In contrary, the increase in the magnetic permeability of PP/Fe3O4 composites seems to follow a linear rule from μ max, T = 1 up to μ max, C = 10.4 for PP + 60 vol% Fe3O4 (x = 0.6). It has to be stated that the increase is not linear in real. It just seems to be linear due to the wide scale of magnetic permeability caused by PP/FeSi composites.
Typically one may expect a percolation threshold in magnetic properties, which can not be found in Figure 7. To affect permeability, the influence of percolation is not strong enough due to high inner demagnetization. However, as already has been shown in the past, a percolation point in magnetic composites exist, leading to a sudden change in the outer demagnetization factor but without affecting permeability in such a way that a sudden increase in permeability can be observed due to the ever present inner demagnetization factor. 24
Of course, also percolation behavior exists in magnetic composites. When the critical distance of particles is reached and below 2.7 times the particle radius, a distortion of the magnetic field takes place. This happens at a filler fraction of about x = 0.2. 22
Additionally, referring to Anhalt and Weidenfeller, 23 the increase in permeability with filler fraction without inner demagnetizing fields would follow a square function, which course is changed by demagnetizing effects. This is due to the fact of dependence of polarization J and magnetic field H on filler fraction.
In Figure 7, it can also be seen that in case of PP/FeSi composites, the measured values of maximum permeability approximately fit the calculated values from the Bruggeman model. In case of PP/Fe3O4 composites, the experimental results seem to follow a linear rule with significant deviation from Bruggeman model at a filler fraction of x > 0.5.
This result is not surprising, since the permeability of FeSi is very much higher than that of Fe3O4 and can be assumed as infinite when compared with the permeability of PP. Therefore, the experimental results of PP/FeSi composite show a better fit to the Bruggeman model, where the permeability of the particles was assumed as infinite compared with the permeability of the polymer (μ max, P >> μ max, T). Consequently, magnetic permeability of PBSMC can be predicted from Bruggeman model on a condition that μ max, P >> μ max, T is given.
To verify the influence of the particle size on magnetic properties, the FeSi particles with a particle size of d < 106 μm and a mean particle diameter of d 50 = 58 μm were sieved into four particle size fractions with d 50 = 26, 47, 65 and 87 μm. The filler fraction was kept constant at x = 0.2 (20 vol%) in PP matrix.
Magnetic permeability was significantly affected by the particle size at the examined filler fraction of x = 0.2. The magnetic permeability μ max increases with mean particle diameter of the FeSi particles. This behavior can be approximated by a linear equation, shown in Figure 8.
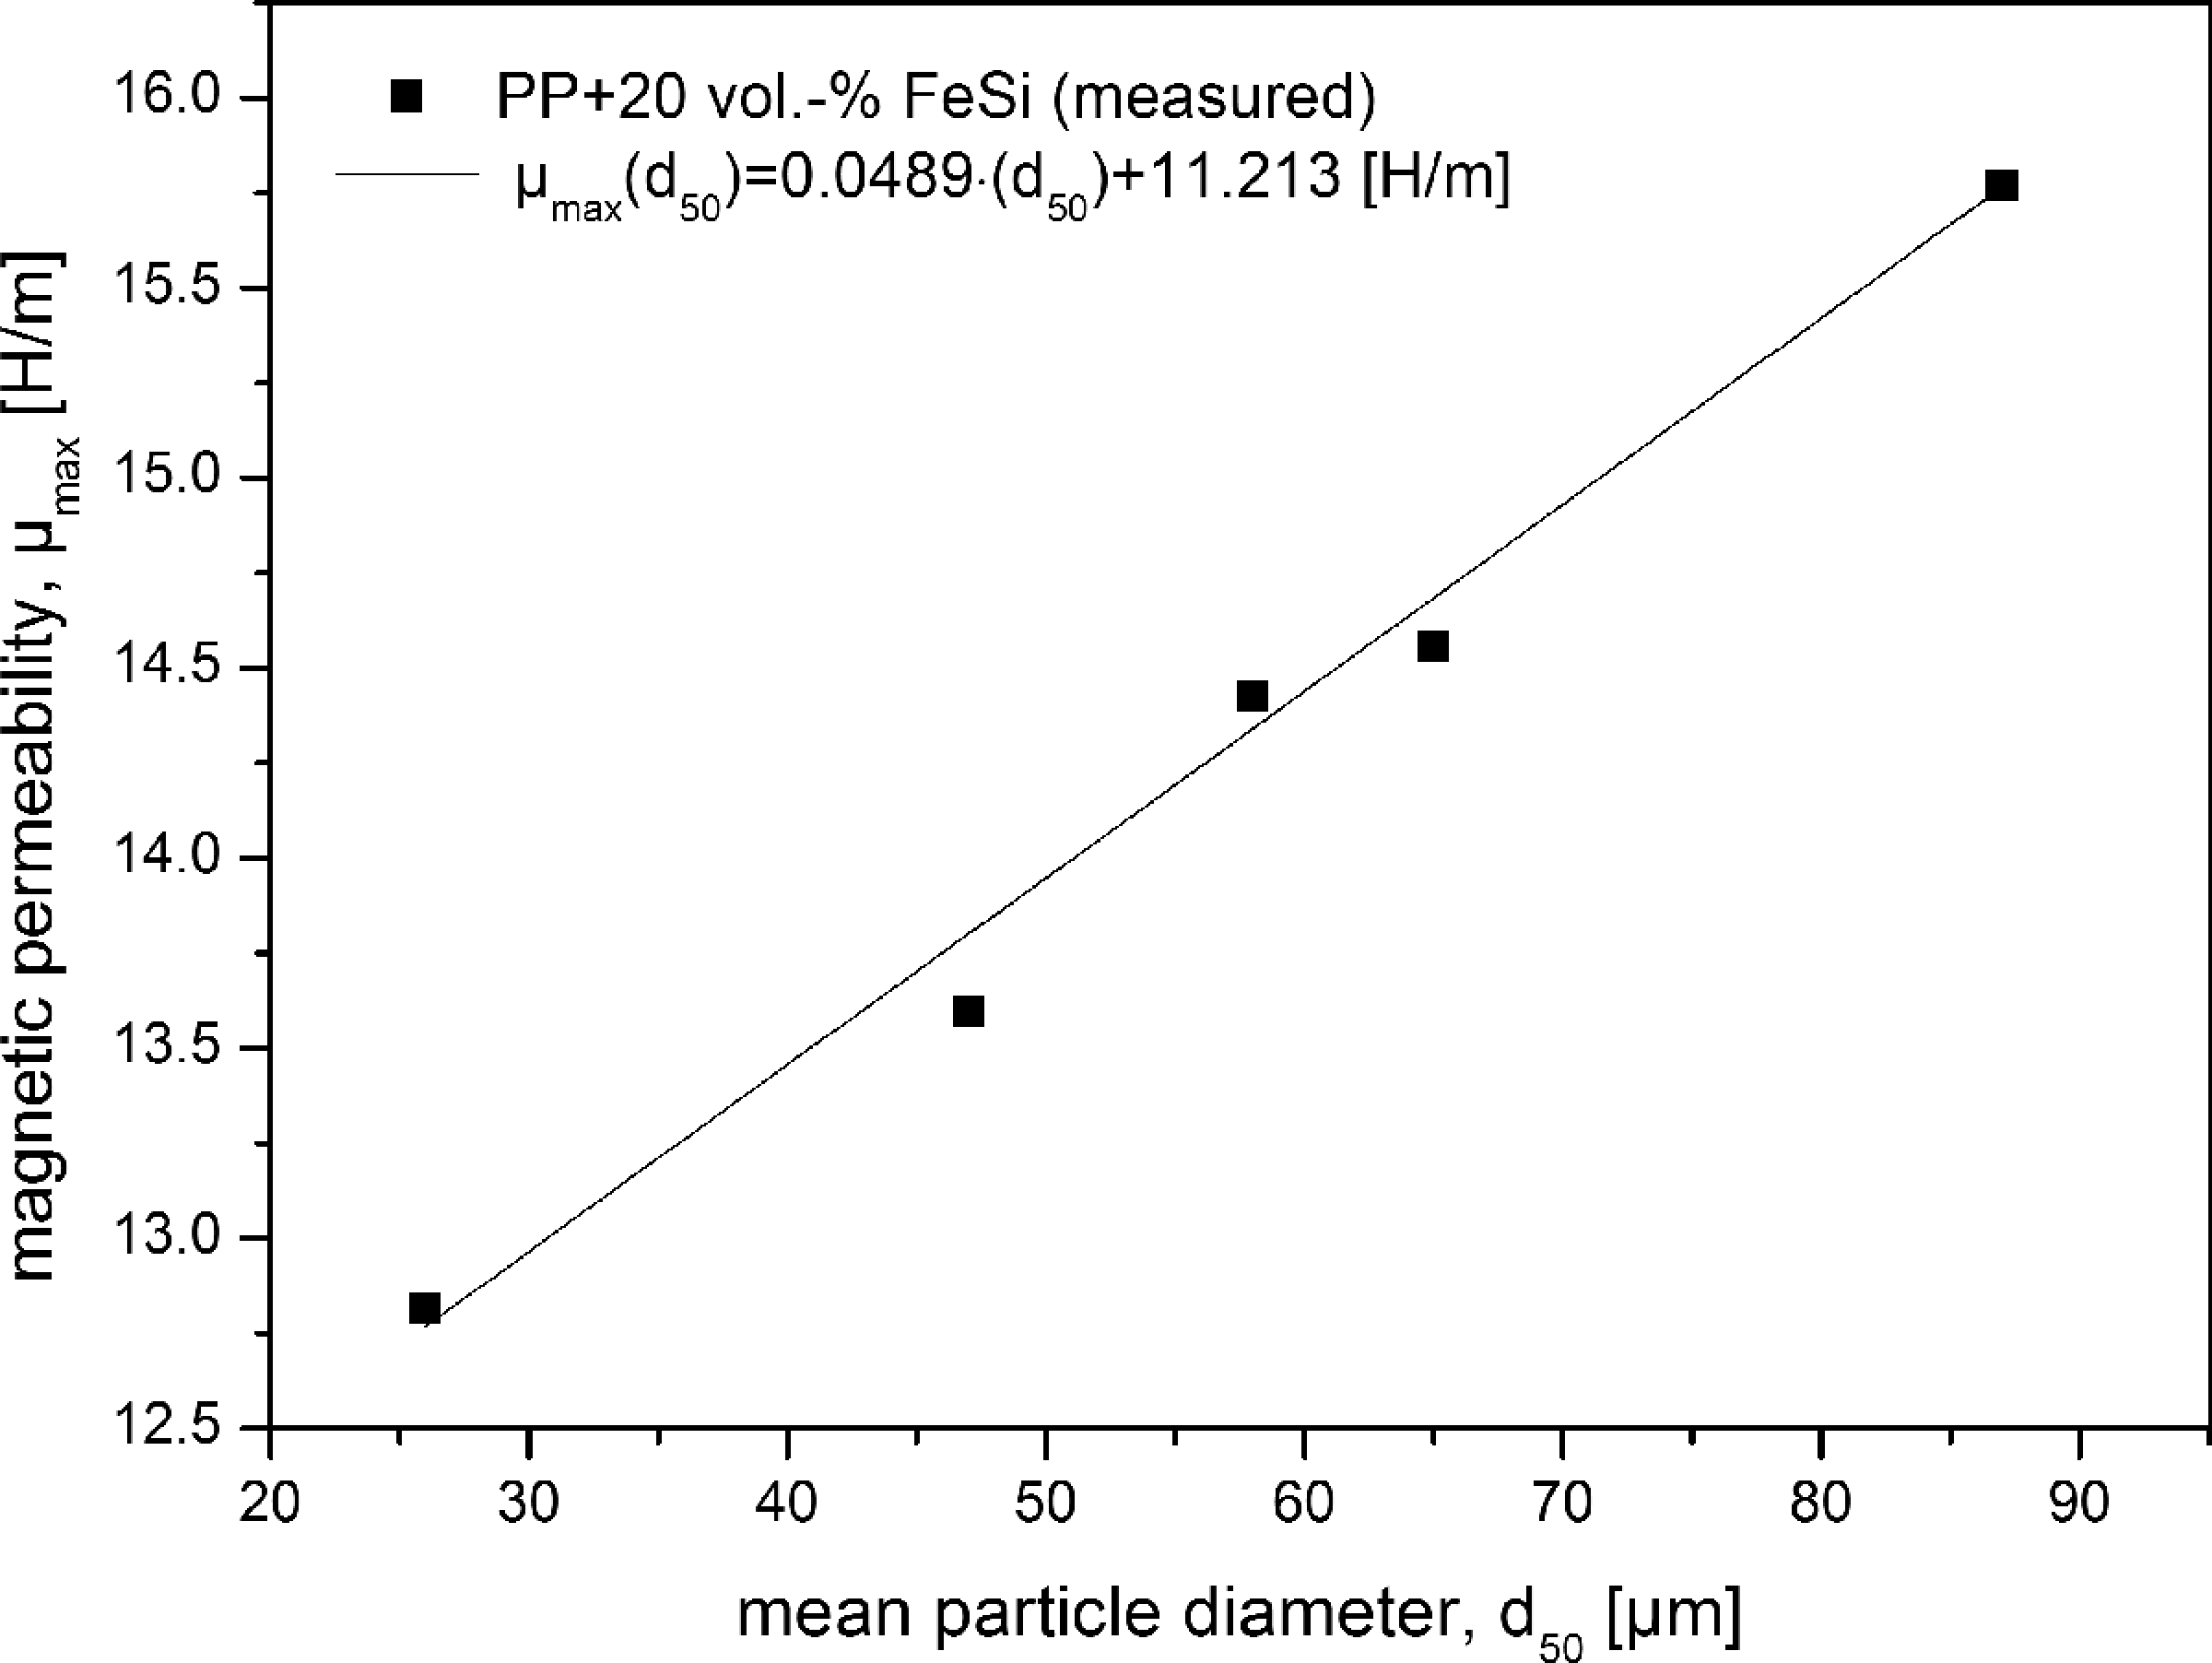
Influence of the mean particle diameter of PP + 20 vol% FeSi on the magnetic permeability. FeSi: iron silicon; PP: polypropylene.
Coercivity H C and loss dissipation P show a linear increase with inverse mean particle diameter d 50 (Figure 9). Both, dissipation and coercivity are affected by particle size at relatively low (x = 0.2) and high (x = 0.6) filler fraction in the same manner.
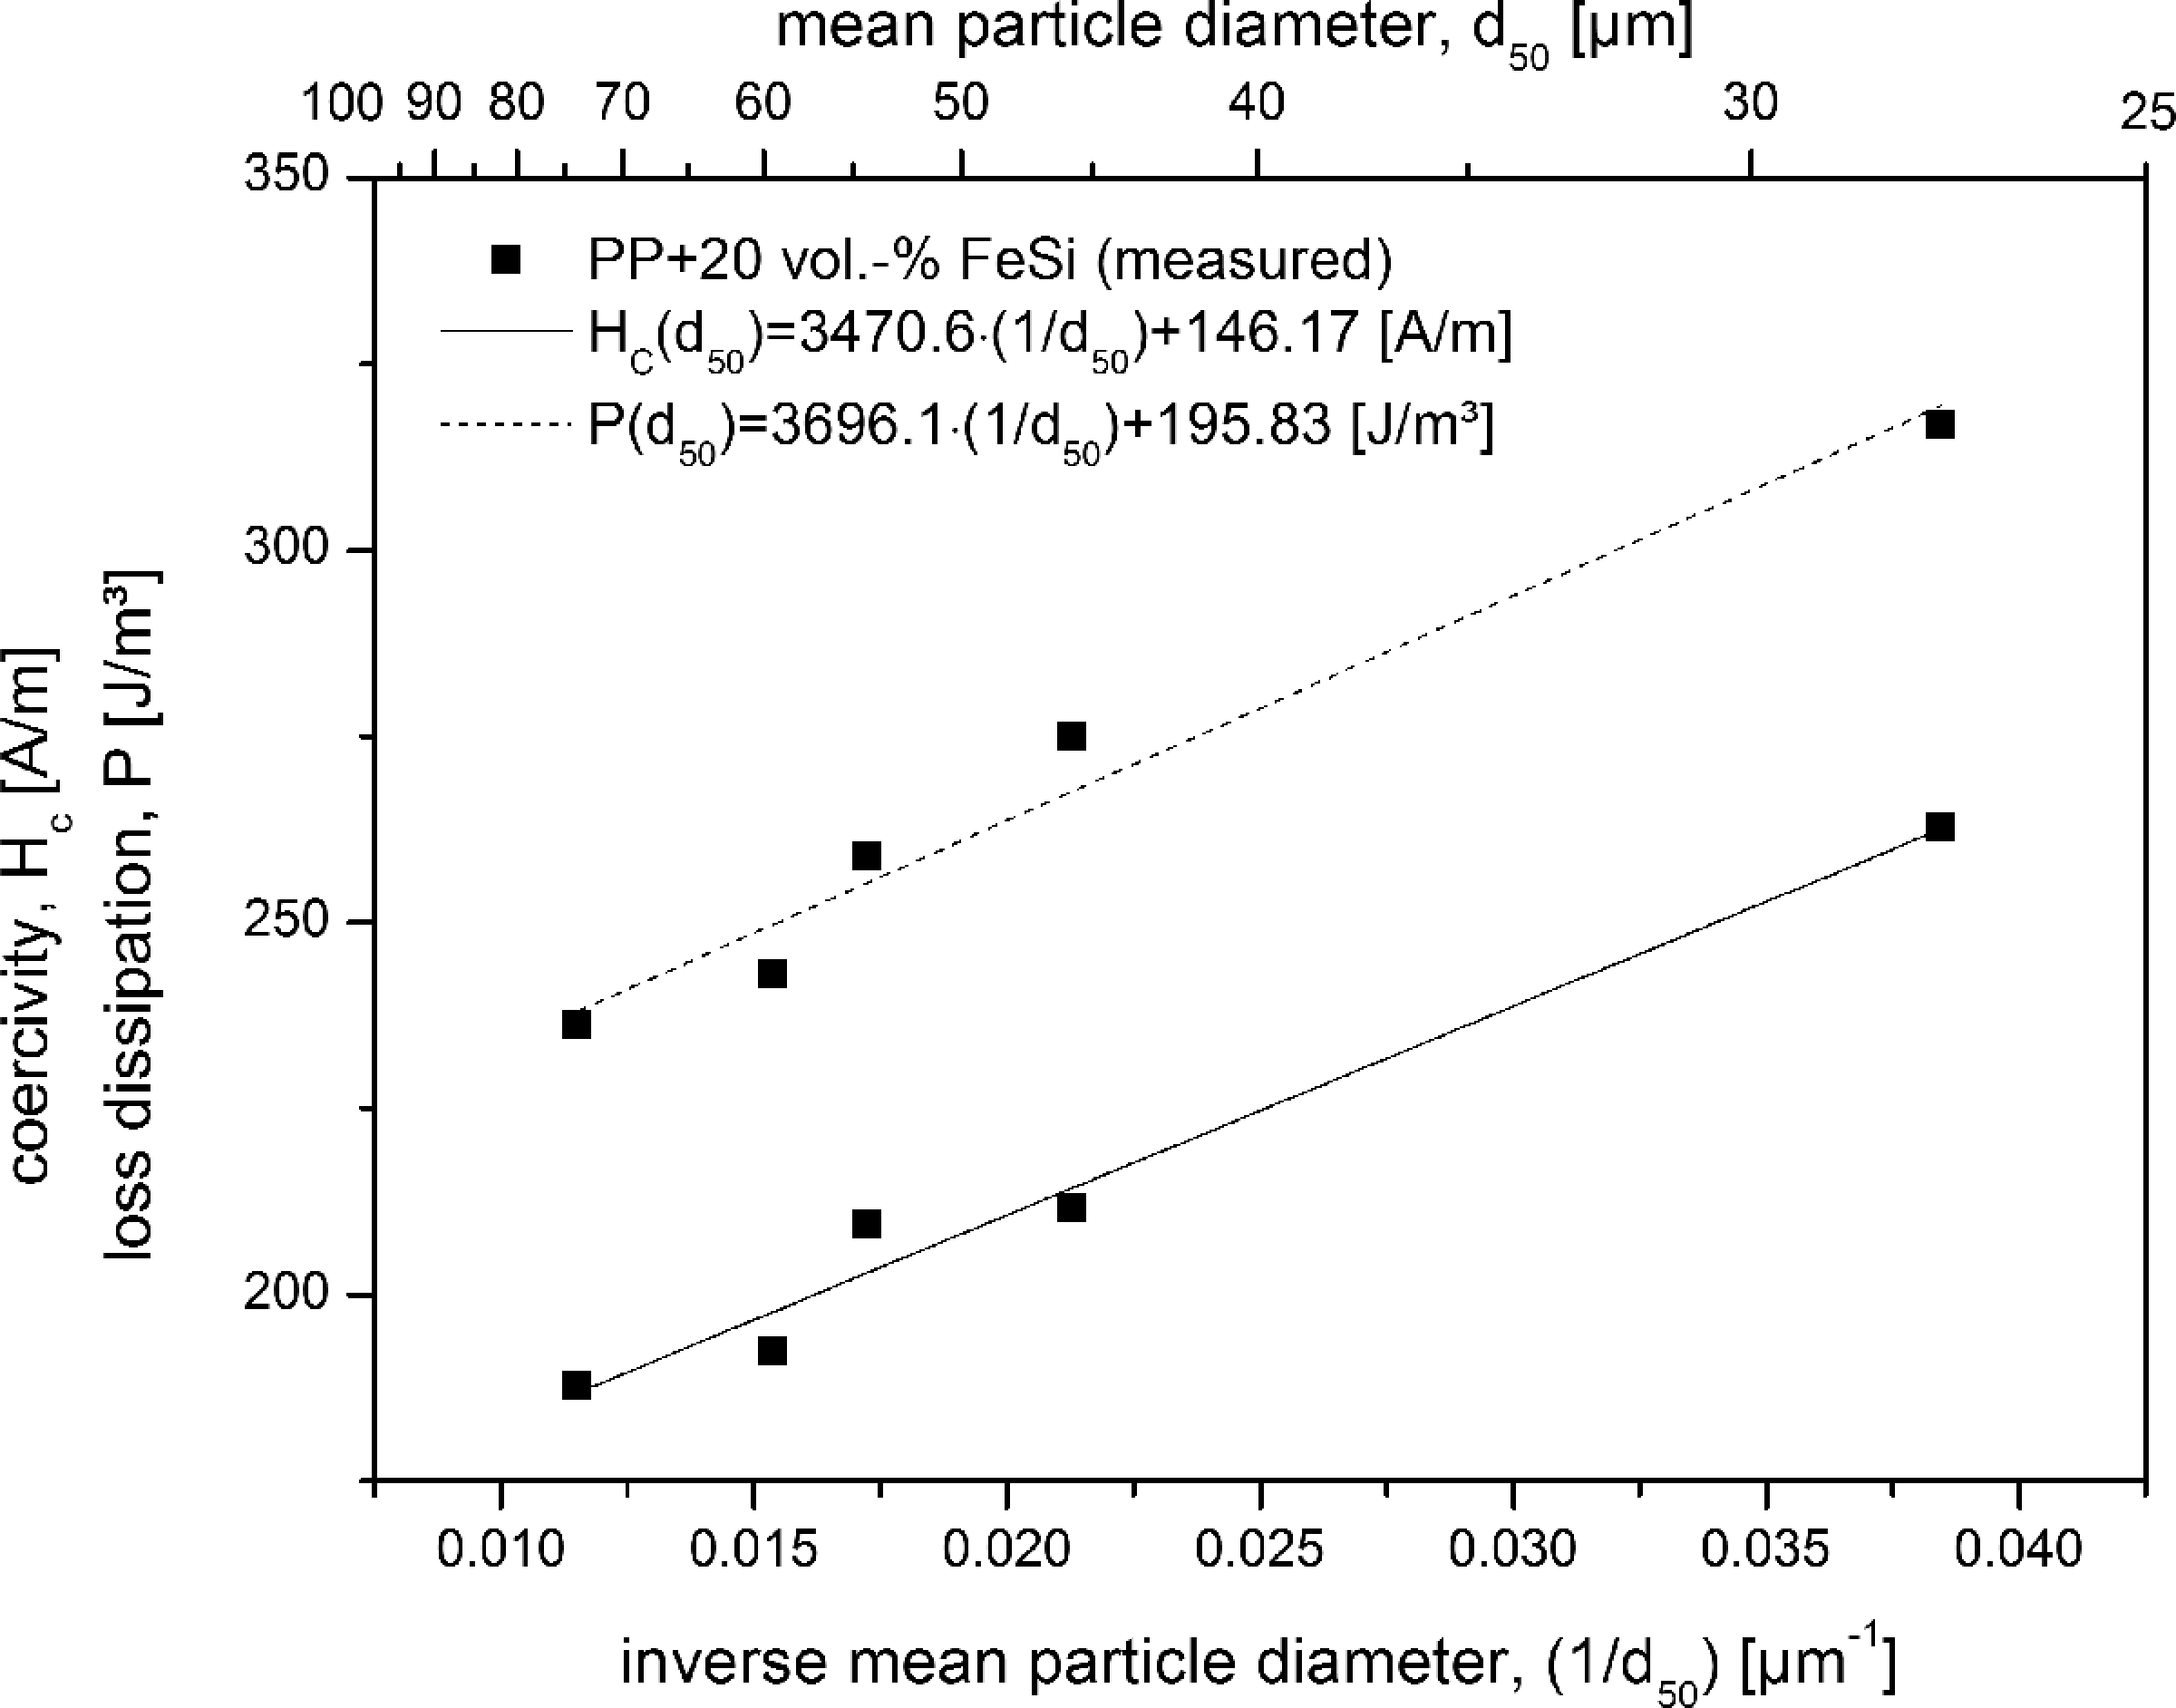
Influence of the (inverse) mean particle diameter of PP + 20 vol% FeSi on the coercivity and loss dissipation. FeSi: iron silicon; PP: polypropylene.
The mathematical correlations, shown in Figures 8 and 9, are summarized in the following equations


Due to the mathematical correlation of permeability μ and magnetic field H by
and loss dissipation P, magnetic field H and frequency f by
the relations in equations (3) and (4) were also found by Herzer 38 and are valid for the grain size dependence of soft magnetic metallic alloys with grain sizes above 0.2 μm approximately. Nevertheless, it has also been shown in the past that the particle size of soft magnetic particles is following these rules. 19 Thus, the grain size dependence of magnetic properties can be transferred directly to particle size dependence in soft magnetic composites.
According to the equations in Figure 9, an infinite mean particle size (d50 → ∞) results in a minimum of magnetic coercivity of H C,∞ = 146.17 A/m and a loss dissipation of P∞ = 195.83 J/m3. In reality, an infinity mean particle diameter does not exist. Typically, largest particle and grain sizes are in the range of several millimeters.
Hence, based on the results found in this work, filler size and filler fraction of PP/FeSi and PP/Fe3O4 composites can be optimized by theoretical approximation and correlation to improve the material properties regarding the required applications prior processing.
Conclusions
Objective of the present work was to determine the influence of filler fraction and filler material on the thermal and magnetic properties of microparticle-reinforced polymer composites at elevated filler fractions. Beyond percolation threshold, particle–particle interactions by direct contacts are shown in scanning electron micrographs of PP/FeSi composites at x = 0.5 (50 vol%) and x = 0.7 (70 vol%). Thermal conductivity and magnetic permeability of PP/FeSi and PP/Fe3O4 composites were measured at varying particle filler fractions up to x = 0.7.
The results show an increase in the thermal conductivity and magnetic permeability with filler fraction. The nonlinear increase in the thermal conductivity can be described by the lower boundary of the Hashin–Shtrikman model (HS−) at filler fractions up to x = 0.7. The Bruggeman model approximates the increase in magnetic permeability of composites with μ max, P >> μ max, T, for example, PP/FeSi composites with filler fraction of up to x = 0.7. FeSi particle-filled composites show higher values in thermal conductivity and magnetic permeability than Fe3O4 particle-filled composites according to the relationship of thermal and magnetic properties of the particle material. Results found in literature for filler fractions of up to x = 0.45 were extended up to x = 0.7.
At a constant FeSi filler fraction (x = 0.2), the magnetic permeability shows a linear increase with mean particle diameter. Magnetic coercivity and loss dissipation increase linearly with inverse mean particle diameter.
Footnotes
Funding
This research received no specific grant from any funding agency in the public, commercial, or not-for-profit sectors.