
Abstract
Nanocomposites composed of polyoxymethylene (POM) and synthetic boehmite alumina (BA) are produced by water-mediated (WM) technique. According to WM technique, an aqueous BA 25 and BA 220 nm dispersion was injected into the molten POM in a twin-screw extruder to prepare the related nanocomposite with 3 wt% BA content. The dispersion of BA was studied by scanning electron microscopy and transmission electron microscopy. The thermal, mechanical and creep properties of the composites were determined in dynamic mechanical thermal analysis and short-time creep tests, respectively (performed at various temperatures). The data indicate that an improvement in the stiffness of nanocomposites can be achieved. The POM/BA 25 nm composite outperformed the POM and POM/BA 220 nm composite with respect to the storage modulus and creep characteristics. This was attributed to the particle size effect of BA. Master curves of storage modulus versus frequency and creep compliance versus time were constructed by applying the time–temperature superposition principle. It was established that the Burgers model and the Findley power law are fairly applicable to the creep compliance results.
Keywords
Introduction
Research and development on polyoxymethylene (POM) has attracted increasing interest recently due to its excellent thermal and mechanical properties as well as chemical resistance (heat deflection temperature, creep resistance, high tensile strength and stiffness). 1 –3 In order to upgrade properties of POM composites have been recommended by dispersing the nanoscale fillers, such as zinc oxide, titanium dioxide (TiO2) and carbon nanofibers. 4 –7 Most of nanofiller-reinforced polymer composites show improvements in strength and stiffness with loss of elongation at break. Moreover, a number of experimental studies are reported on the influence of particle size on the viscoelastic behaviors, including electrical properties of various types of polymers. 6,8 –12 Yang et al 6 observed a strong decrease in the compliance of polypropylene modified by TiO2 nanoparticles by loading small-sized nanoparticles.
Various preparation methods of polymeric nanocomposites can be followed in three main groups (in situ polymerization, solution/dispersion and melt blending techniques). 13,14 To avoid agglomeration phenomena with the incorporation of nanofillers during melt blending is a problematic issue. The shear forces accommodated in the polymer melt during processing may also be helpful to support the dispersion of the filler. However, a shearing force of the polymer processing equipment, for example, extruder, is not always enough to break up large agglomerates, and thus, the resulting filler dispersion may remain further on poor dispersion. A great challenge, especially when performed nano-scale particles are incorporated into thermoplastic by water-mediated (WM) melt compounding, whereby the water swelling/water dispersion capability of some nanofillers. 15 This proposed WM extrusion melt compounding is a very effective process being simple and cost efficient for producing thermoplastic nanocomposite. A further benefit of this method is that the expensive chemical modification of the nanofillers can be avoided.
The goal of this study is to explore the potential of the WM melt compounding technique to disperse boehmite alumina (BA) in a POM using a twin-screw extruder. For comparison purpose, POM/BA nanocomposite was used for different BA particle sizes. The BA dispersion in POM was assessed by scanning electron microscopy (SEM). The thermal and mechanical properties and creep responses of the POM/BA nanocomposites were determined and compared with those of the pure POM in three point bending load mode.
Experimental
Materials and preparation of composites
Granulated POM (Hostaform C 9021, Ticona GmbH, Frankfurt, Germany) was utilized as polymeric matrix for all the composite systems. Its volumetric melt flow rate (at 190°C/2.16 kg) was 8 cm3/10 min. Two types of water dispersible BA (AlO(OH); Disperal® P2 and Dispal®11N7-80 of Sasol GmbH, Hamburg, Germany) served as fillers. The nominal particle size of BAs (P2 and 11N7-80) in water was 25 and 220 nm, although that of the BA powder as delivered was about 45 and 40 µm, respectively. P2 (BA 25 nm) has aluminum oxide (Al2O3) content of 72 wt% and specific surface area is 260 m2/g. 11N7-80 (BA 220 nm) has Al2O3 content of 80 wt% and specific surface area is 100 m2/g (according to suppliers’ information).
POM containing BA 25 and 220 nm composites were prepared by WM compounding in a twin-screw extruder, as reported previously. The beauty of this WM technique is that the fine nanoscale dispersion of performed particles during melt blending has been achieved. 15,16 Characteristic SEM pictures taken from the composites produced by the WM technique in Figure 1(a) and (b) shows that the BA particles are homogeneously dispersed in the POM matrix. The transmission electron microscopy (TEM) picture in Figure 1(c) confirmed a well dispersion of the BA. However, the BA particles are still aggregated in the related nanocomposites. For the compounding of the composites, a special mixing screw of the corotating ZSK 25 P8 extruder (Werner & Pfleiderer, Stuttgart, Germany) was used. First, BA particles were dispersed in the water at an ambient temperature under continuous mechanical stirring for 30 min to obtain an aqueous BA slurry, in which the alumina content was 30 wt%. The BA content in the composites was 3 wt%. The POM-based composites were compounded at an output rate of 10 kg/h, barrel temperatures between 150 and 190°C, and a rotor speed of 200 r/min. The aqueous BA slurry was stirred constantly, while injected into the extruder at a rate of 1 L/h using a pump (Nemo® Pumpe, Netzsch, Waldkraiburg, Germany). The water was eventually degassed in the degassing and compression zone of the screw, and the evaporation was completed using a vacuum pump.
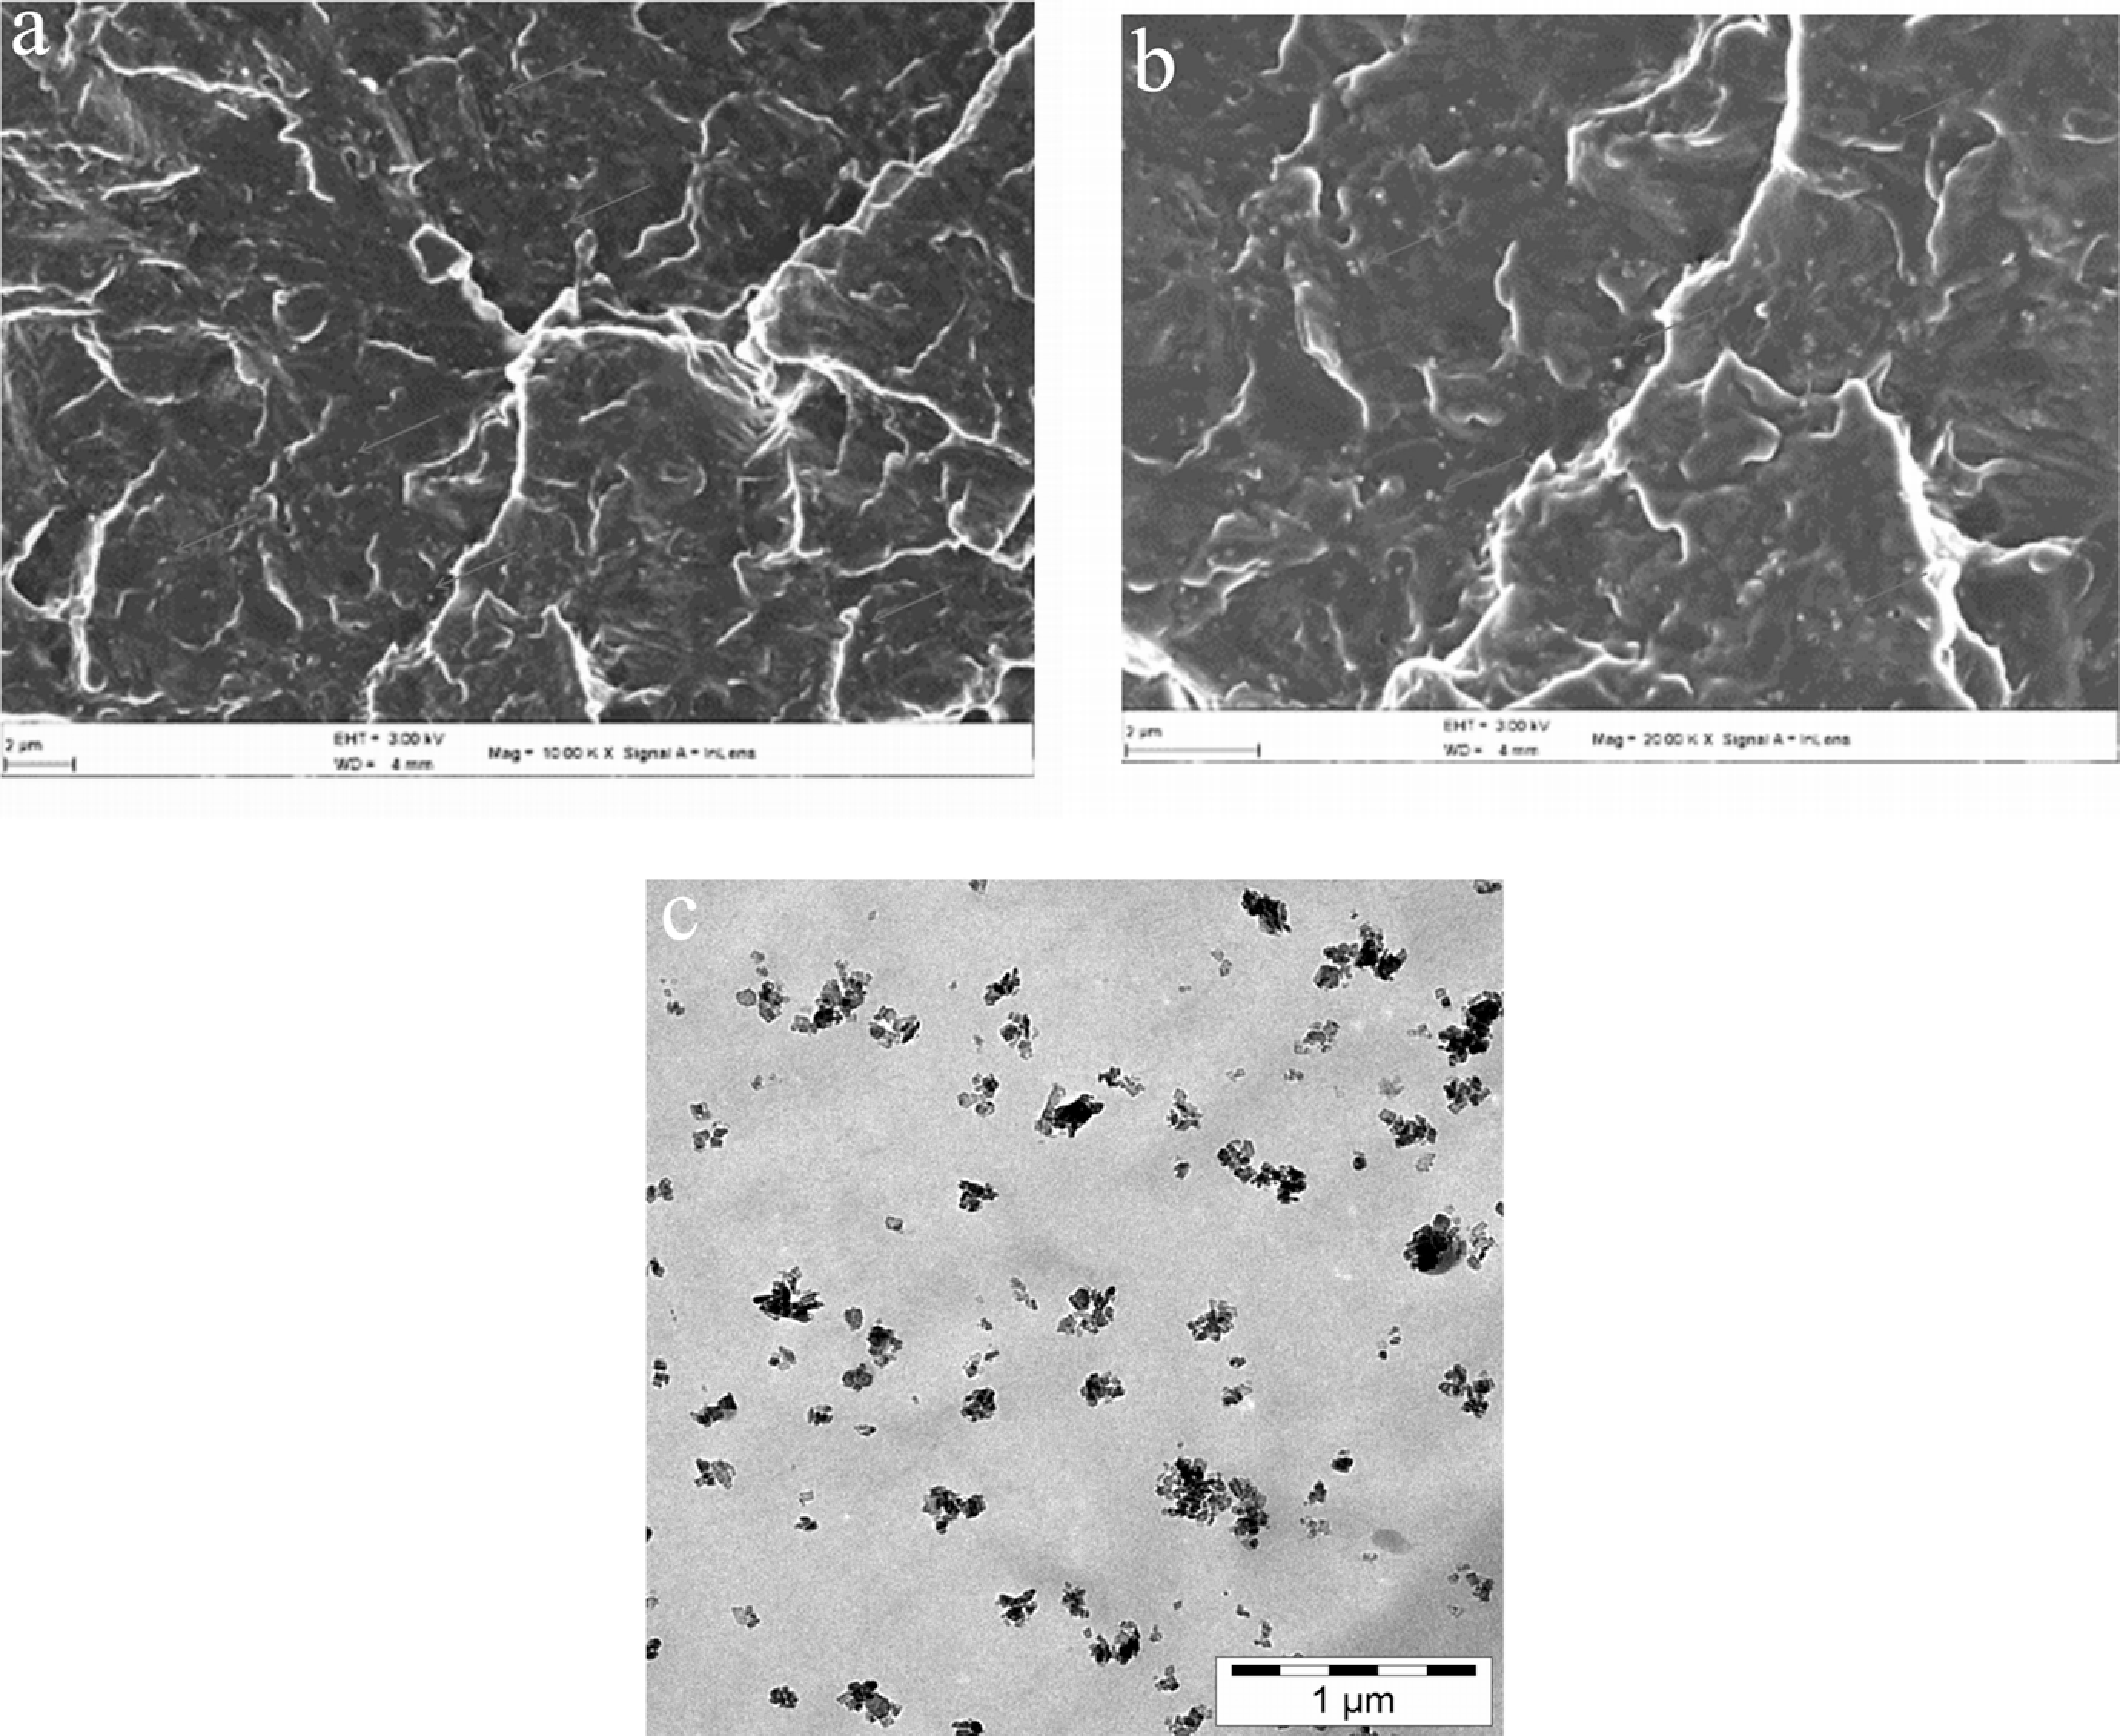
SEM pictures taken of (a) ×10,000, (b) ×20,000 magnification and (c) TEM picture from POM containing 3 wt% BAs. SEM: scanning electron microscopy; TEM: transmission electron microscopy; POM: polyoxymethylene; BA: boehmite alumina.
The granulated materials were injection molded into the specimens (100 × 10 × 4 mm3 length × width × thickness) by an automatic injection molding machine (Alburg Allrounder 320 S, Lossburg, Germany). The barrel temperature of the injection molding machine was set at 200°C and that of the mold at 90°C. The injection pressure was kept constant (700 bar), and for the injection, speed of 55 cm3/s was selected. For the cooling time, 20 s was chosen.
Morphology detection
The fracture surfaces of compression-molded specimen were subjected to SEM inspection in a Supra™ 40VP SEM (Carl Zeiss GmbH, Oberkochen, Germany). The surface was carbon coated prior to SEM inspection performed at low acceleration voltage. TEM measurements were carried out with a Zeiss LEO 912 Omega TEM (Oberkochen, Germany) by applying an acceleration voltage of 120 kV. Thin sections (about 50 nm) were cut at room temperature with a Diatome diamond knife (Hatfield, Pennsylvania, USA) using an Ultracut E microtome (Reichert and Jung, Vienna, Austria).
Dynamic mechanical thermal response
Dynamic mechanical thermal analysis (DMTA) was performed in three point-bending mode at the frequencies of 0.1, 1 and 10 Hz at all isothermal temperatures, using a DMA Q800 apparatus (TA Instruments, New Castle, New Jersey, USA). The storage and loss moduli (E′ and E″) along with mechanical loss factor (tanδ) were determined as a function of the temperature (T = −100°C + 150°C). The strain applied was 0.1%. The specimens were cooled to −100°C. The temperature was allowed to stabilize and then increased by 5°C, kept 3 min isothermal, until 150°C. The specimen dimensions were 10 × 50 × 4 mm3 (width x length x thickness).
Creep response
Short time creep test was made in three point-bending mode at different temperatures using the above DMA apparatus. In order to avoid a misinterpretation of creep measurements it is important to make sure that the molecular structure of the polymer does not change during the experiment. The effect of applied stress is enough that the creep behavior is considered to be linear in this range of applied stress. First, the isochronous stress-strain curve of POM was constructed after tests measuring the strain at various stresses as a function of time. The related data indicate that even under 7 MPa load the specimen is in the linear range (not reported here). In the subsequent tests all specimens were subjected to 7 MPa stress and the strain was recorded as a function of time. The temperature dependence of the creep response of the POM and its composites was studied in the range from −50 to 80°C. Isothermal tests were run on the same specimen in the above temperature range by increasing the temperature stepwise by 5°C and equilibrating the specimen at each temperature for 5 min. During the isothermal tests the duration of the creep testing was 15 min. The creep test was performed on specimen dimensions of 10 × 50 × 4 mm3.
Results and discussion
DMTA response
Figure 2 displays the trace of the storage modulus as a function of temperature for POM, the alumina-containing of 25 nm and 220 nm composites. The incorporation of BA 220 nm into POM matrix resulted in a considerable slightly increase in the storage modulus. The E′ versus T trace of the composite is enhanced by adding BA 25 nm compared to POM in the whole temperature range. Note, the E′ values of BA 25 nm composite were always higher compared to BA 220 nm composite. This can be attributed to the reinforcing effect of alumina particles size and nanoscale dispersed in POM matrix. A similar trend has been recently reported that the stiffness of mica filled PVC composite clearly indicate the dependence of varying particle size. 8
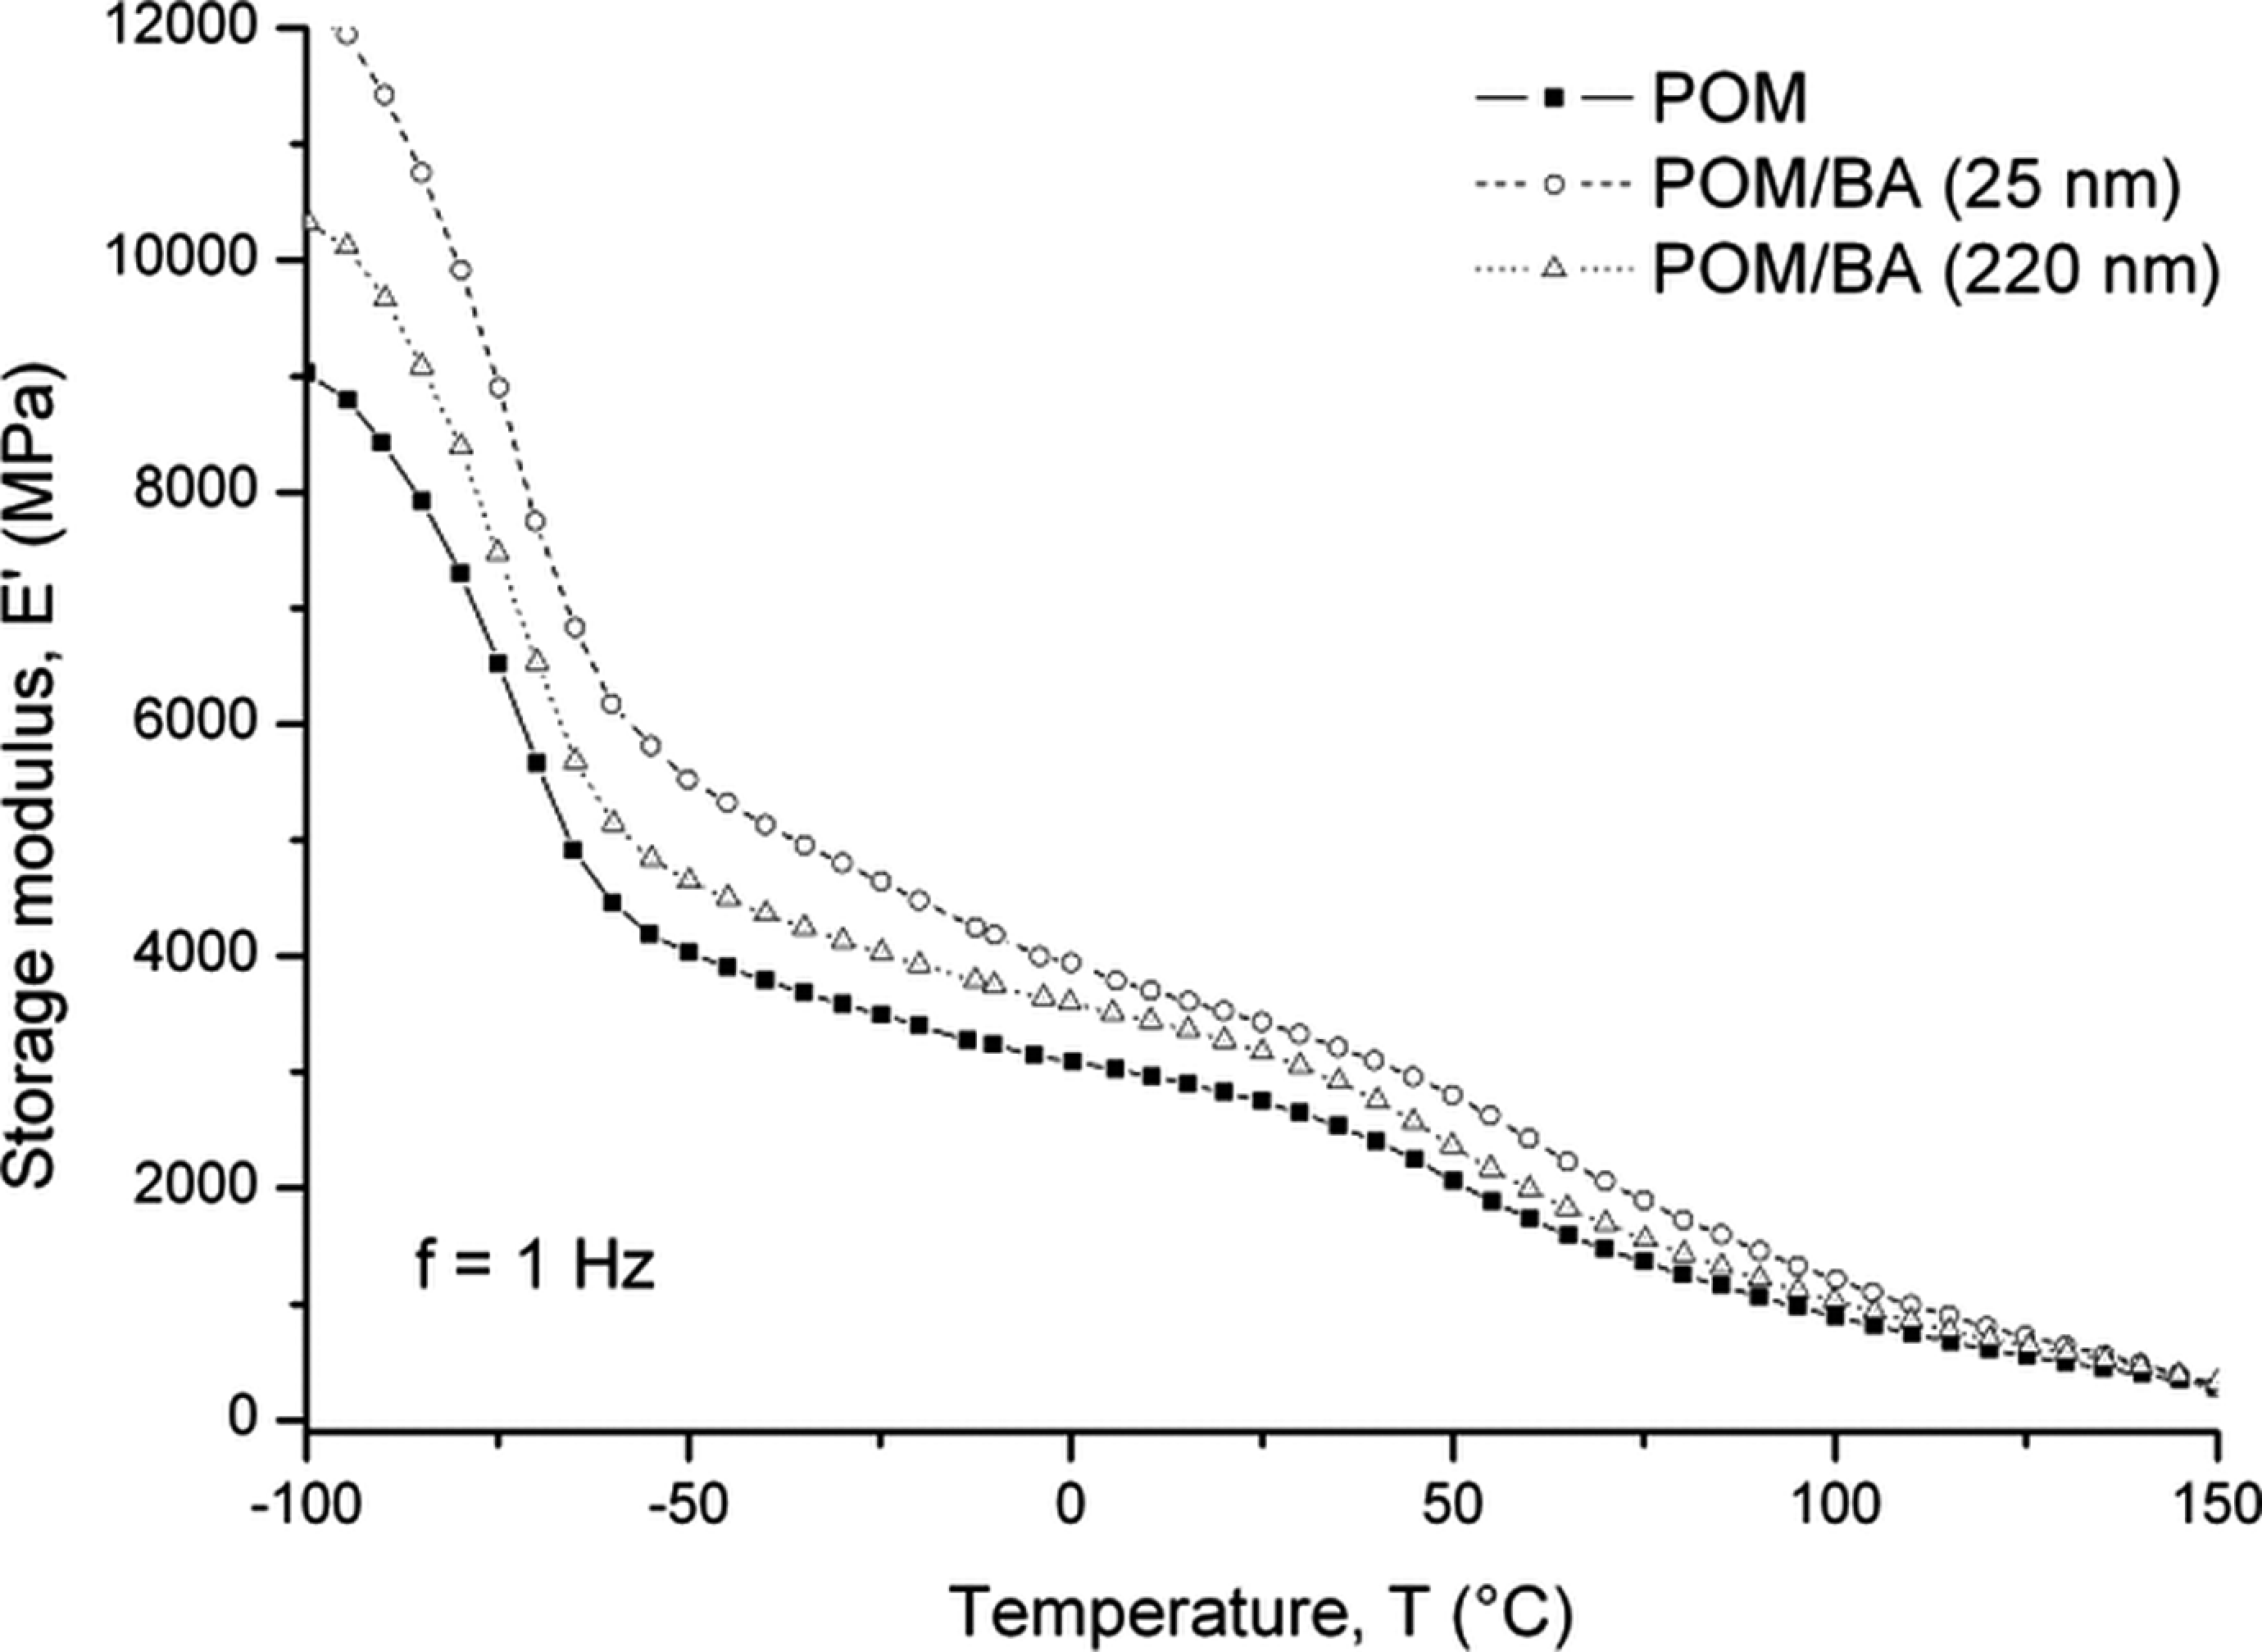
E′ versus T trace for the POM, POM containing 3 wt% of BA 25 nm and 220 nm. POM: polyoxymethylene; BA: boehmite alumina.
Figure 3 presents the combined Cole-Cole plots at 1 Hz for the POM, BA 25 and 220 nm composites. The specific Cole-Cole traces can be considered as occurring relaxation mechanisms which exhibited three transitions, namely γ−, β. and α relaxations of pure POM. The .γ relaxation is related to local motions of main chains within the POM amorphous regions. The latter β and α relaxations are usually attributed to the intra-chain molecular motions of long molecular segments in the disordered and ordered crystalline phases, respectively. 17 It is interesting to note that shifting of three transitions of composites to slower relaxation processes due to of alumina particles, especially in BA 25 nm indicates for the reinforcing effect. The relaxation mechanisms may also be affected by the alumina particles. Whether the related change may be traced to the particle size and its dispersion of the corresponding alumina requires further investigations.
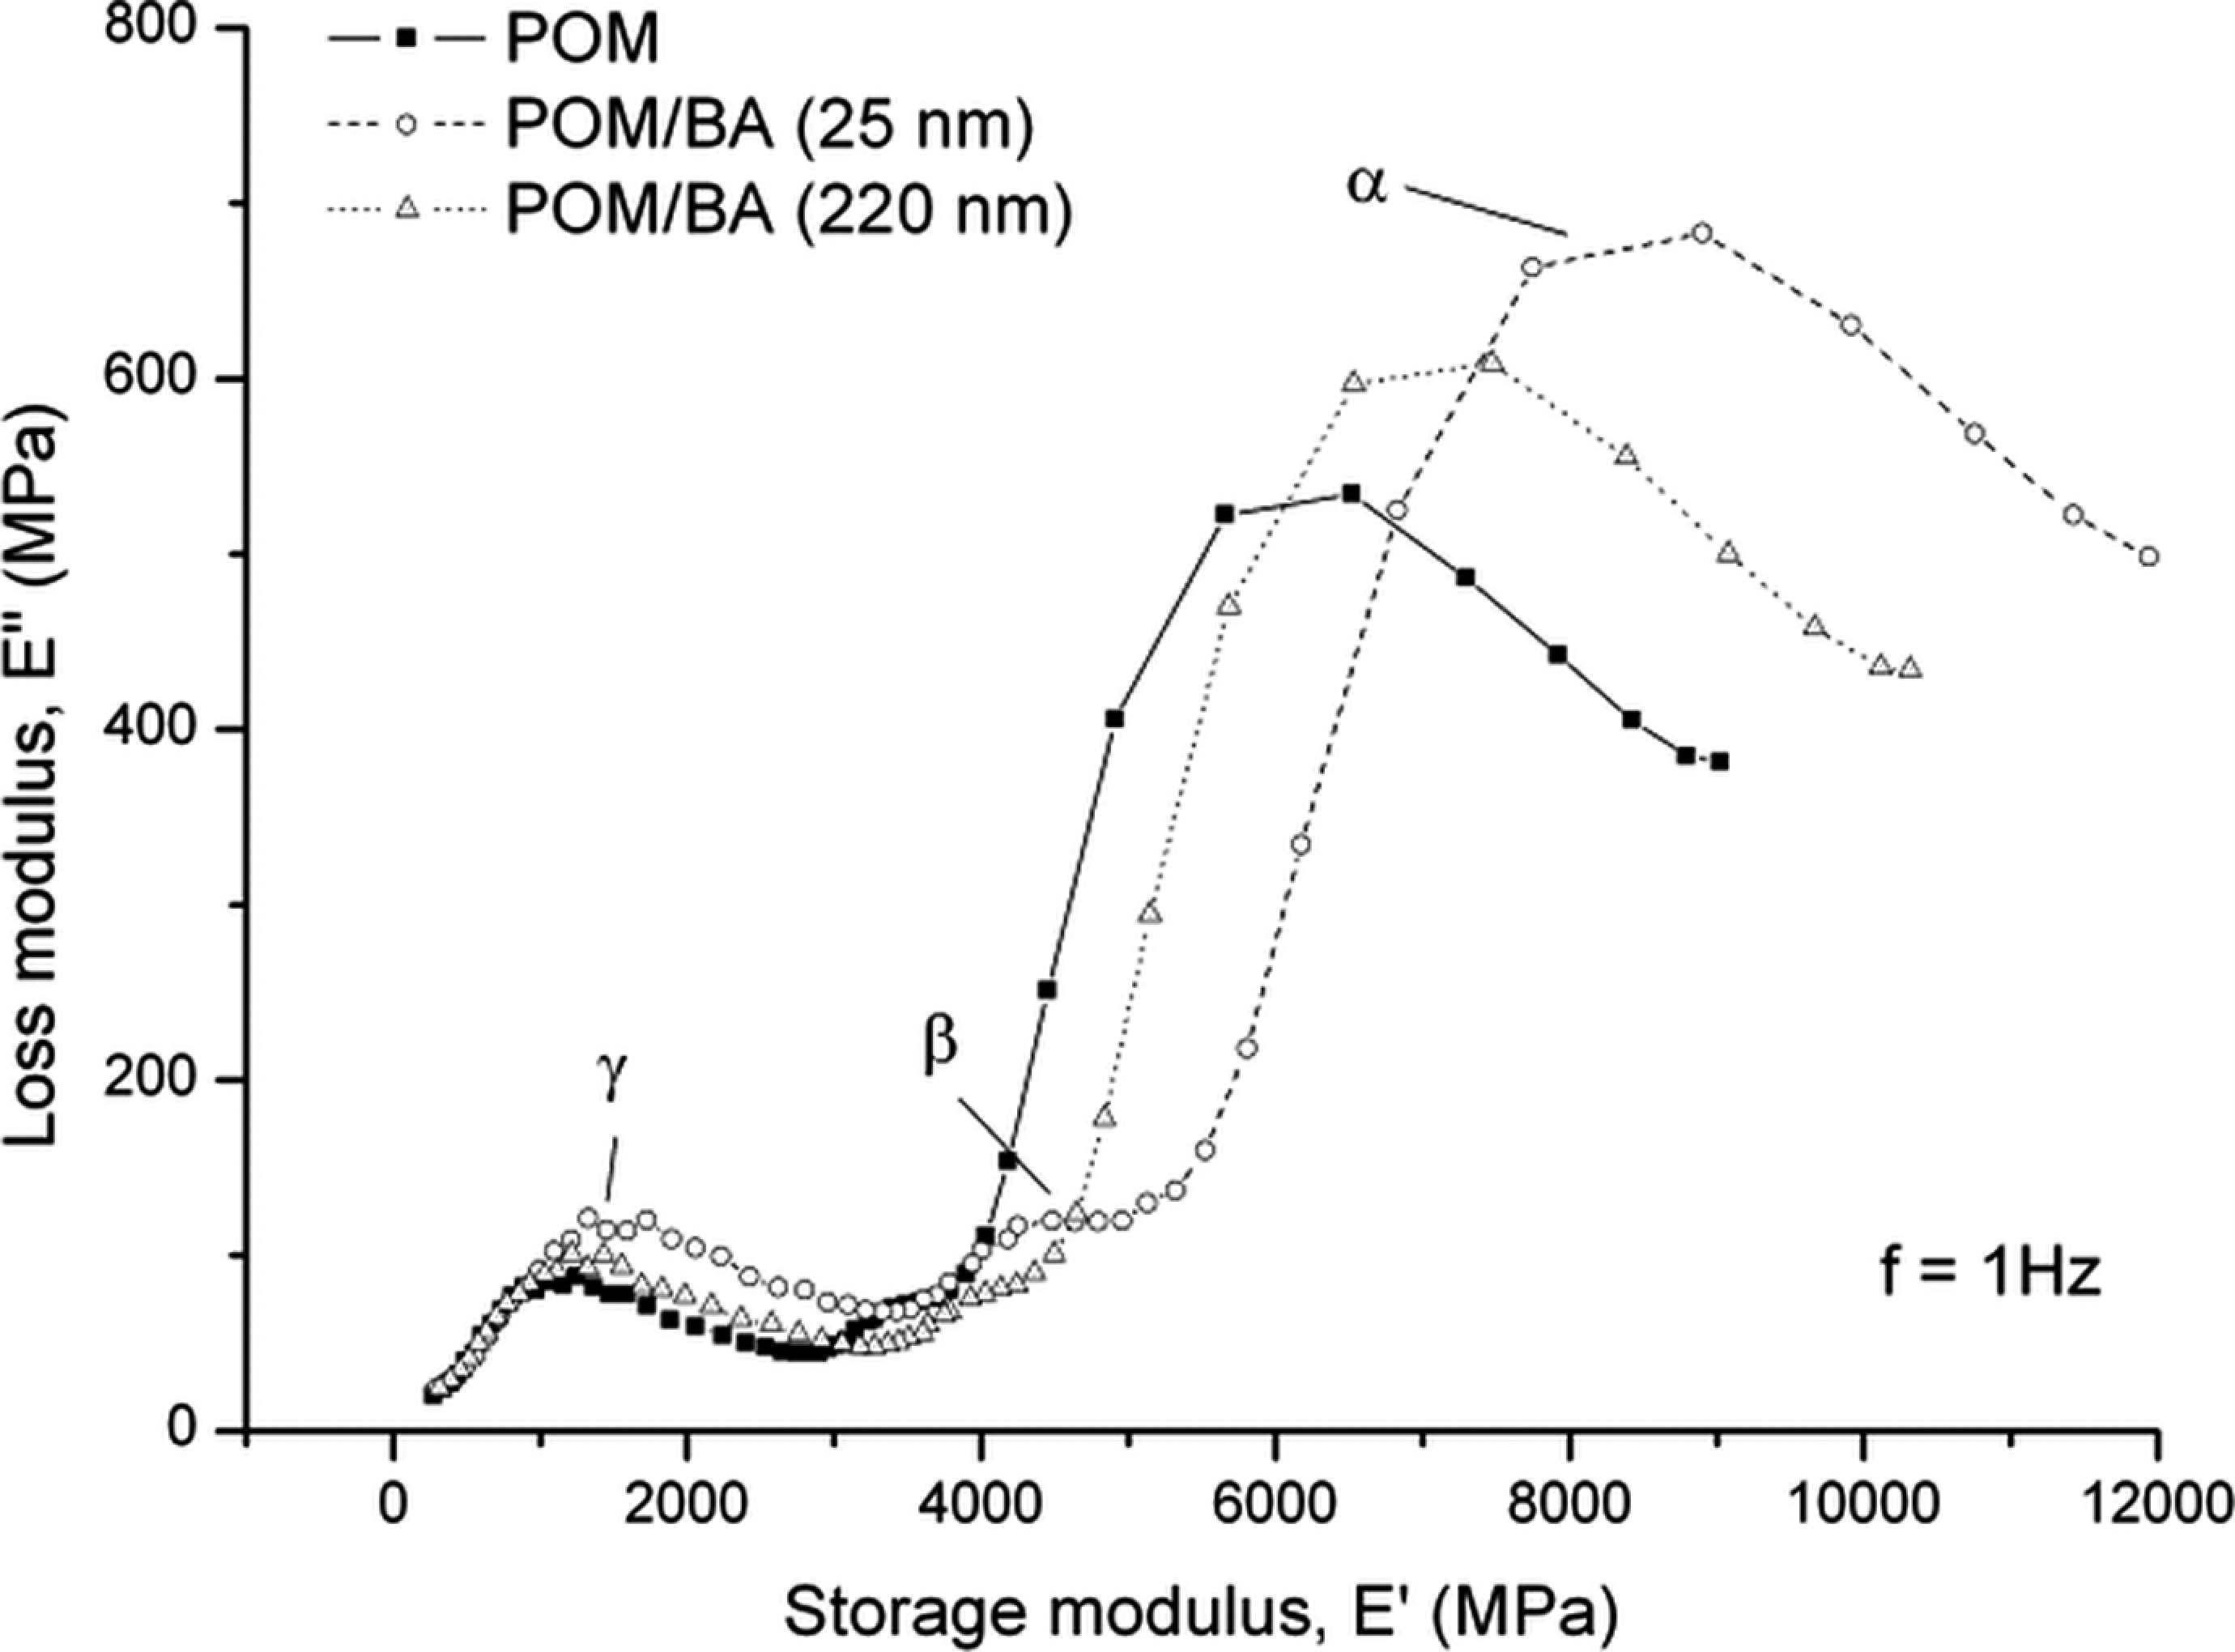
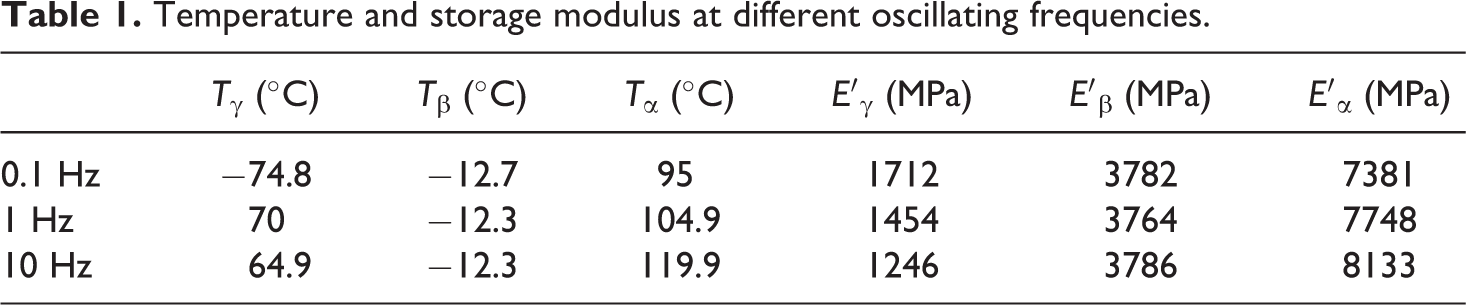
Cole–Cole plots for the POM, POM containing of 3 wt% of BA 25 nm and 220 nm. POM: polyoxymethylene; BA: boehmite alumina.
It is well known that the relaxation effects in pure POM exhibited three transitions from its tan δ spectra. Initially the .γ transition at low temperature is usually attributed to the glass transition (Tg). In term of increasing temperature these processes are attributed to the β and α. transitions. 18 Figure 4(a) and (b) demonstrate the effects of increased frequency on the relaxation processes of POM/BA 25 nm composite. The primary transition of nanocomposite is depicted in the tan δ. vs. T curve of 0.1 Hz located at around −74.8°C (compare Figure 4(a)). With increasing frequency was accompanied with a shift on the Tg (γ. transition) of POM/BA 25 nm composite towards higher temperature. The variation of tan δ and E′ at different frequencies for the POM/BA 25 nm composite is shown in Table 1. A remarkable difference influence of frequency was observed for both the γ and α relaxations of the composites (compare Figure 4(b)). The frequency increase shifted the position of the γ relaxation region to lower E′. The prominent change cannot be noticed for the β relaxation. However, the intensity of α relaxation further shifted toward E′ when the increase frequency is present. The E′ peaks corresponding to the α relaxation of 0.1 and 10 Hz were found to be at 7381 and 8133 MPa, respectively.
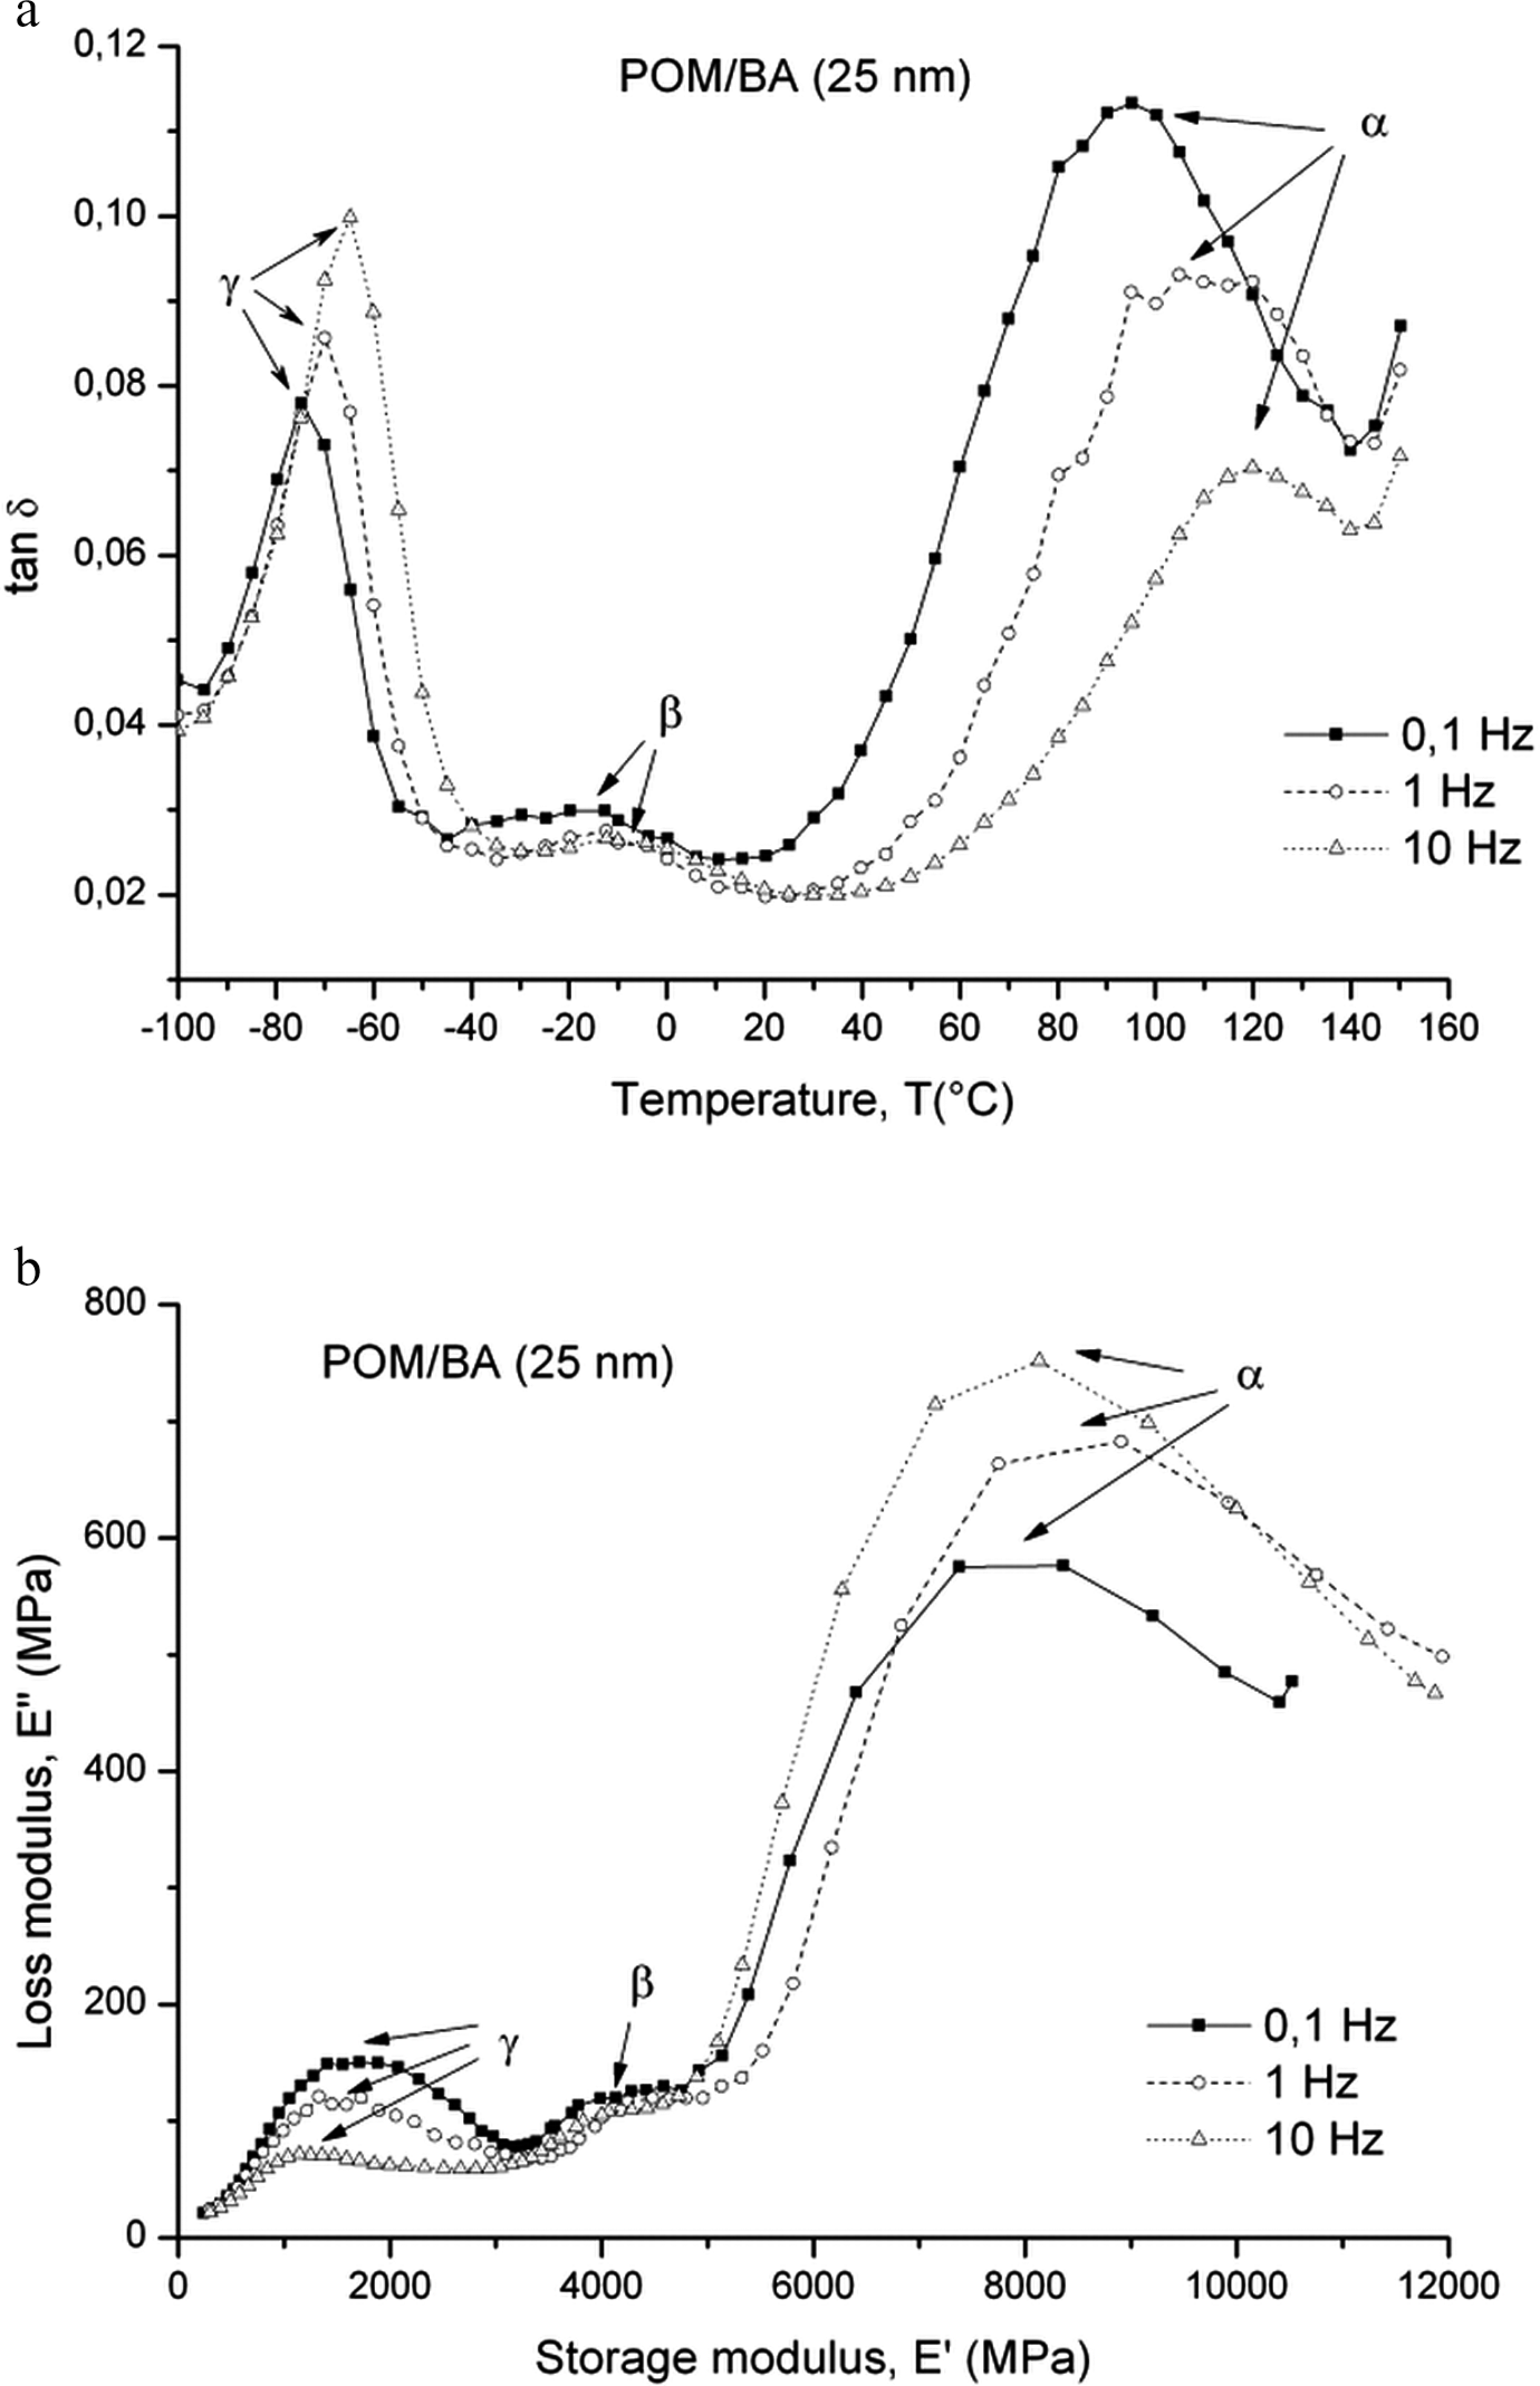
(a) Tanδ. versus T trace and (b) Cole–Cole plots for the POM/BA 25 nm composite at different frequencies. POM: polyoxymethylene; BA: boehmite alumina.
Temperature and storage modulus at different oscillating frequencies.
Master curves in the form of storage modulus versus frequency were produced by superimposing the storage modulus versus frequency traces using the time–temperature superposition (TTS) principle. A reference temperature (Tref = 25°C) was used for this superposition (shifting) process. The related shift factor (aT) used for the generation of storage modulus master curve is aT = E′ (T)/(E′ (Tref). Master curves of the storage modulus against frequencies created at a reference temperature of 25°C are shown in Figure 5 for the POM/BA 25 nm and POM/BA 220 composites. Note that the storage modulus master curve provides a useful prediction of the modulus over loading frequencies from 10−33 to 1017 Hz. From the master curve data, the storage modulus influenced by the primary particle size of the alumina, but the terminal region at lower frequencies is more dependent on the reinforcement effect of the BA 25 nm composite compared with the BA 220 nm composite, as expected.
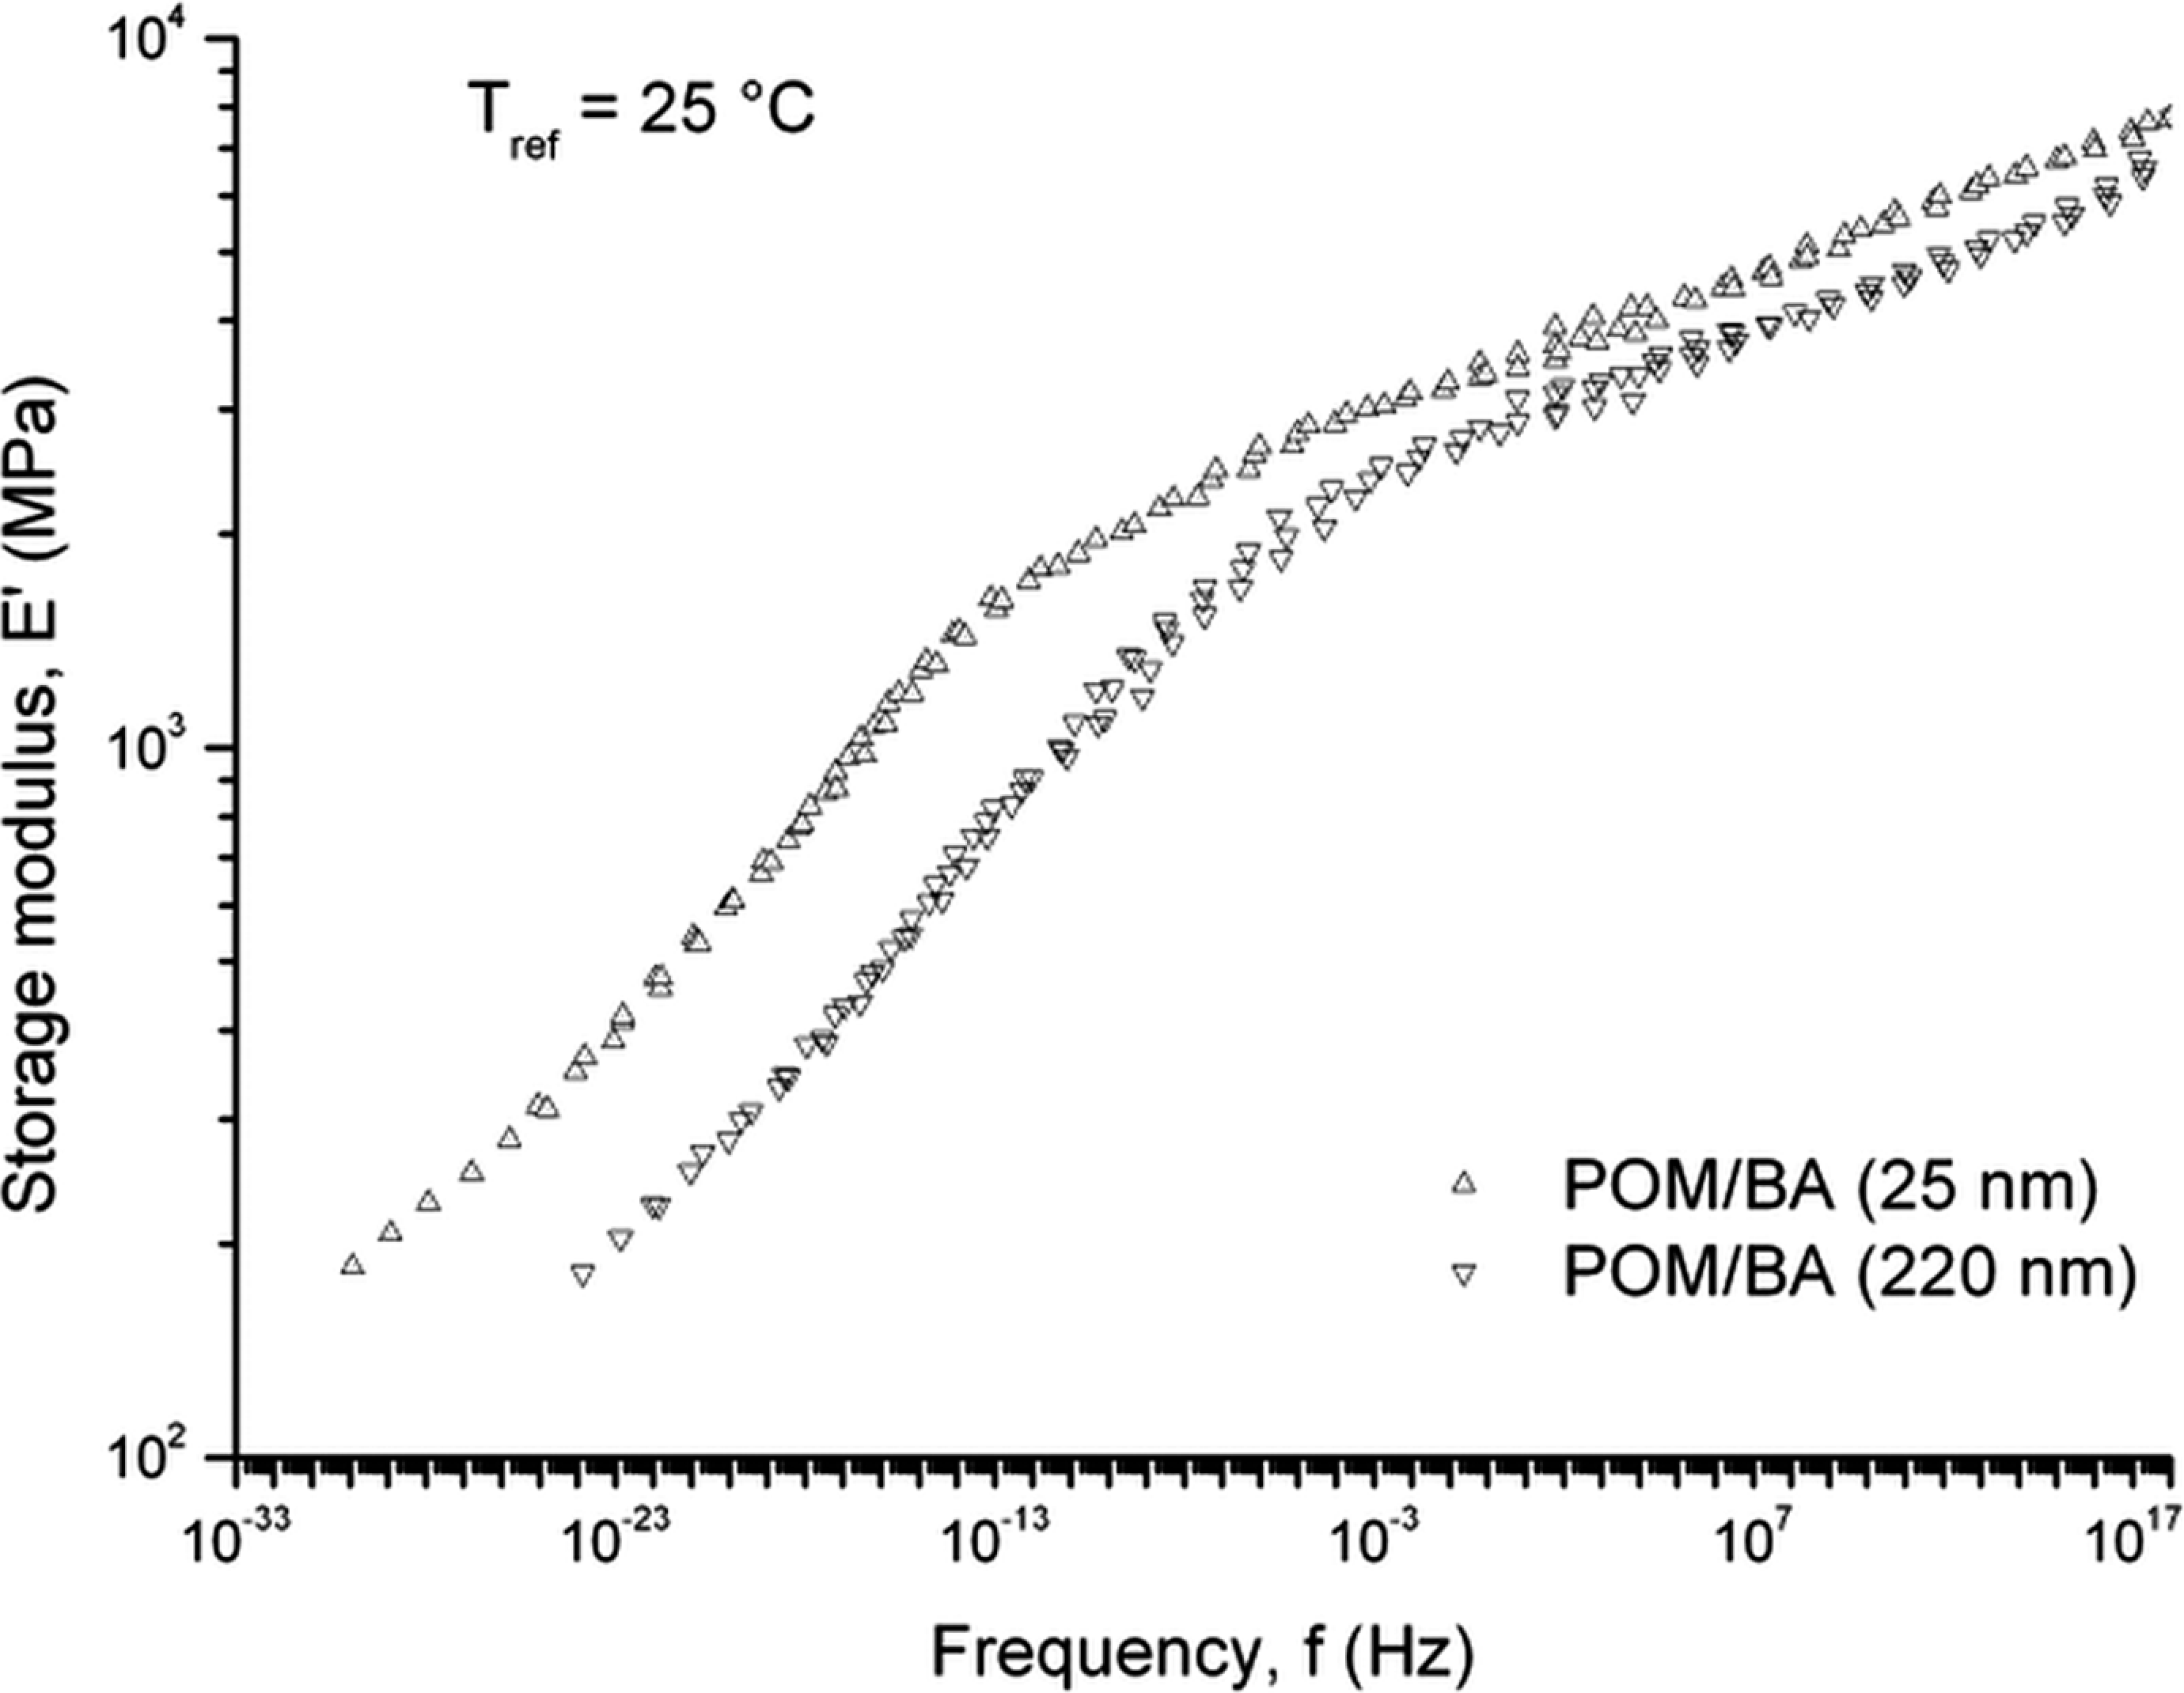
Storage modulus master curves (E′ versus f) constructed by considering the TTS and selecting T ref = 25°C for the POM/BA 25 nm and 220 nm composites. POM: polyoxymethylene; BA: boehmite alumina; TTS: time–temperature superposition.
Creep response
Typical tensile creep experiment, at the time, t = 0 a constant stress σ = σ0 is applied to the specimen and the strain deformation D is recorded as a function of creep time t. The time-dependent creep compliance in the linear viscoelastic regime can be calculated as

where D(t) is the viscoelastic creep compliance and ε(t) is creep strain at time, t.
In the nonlinear range the dependence upon the level of the applied load can be expressed by multiplying the linear parameters, so-called nonlinearity factors, which, of course, are load, time and temperature dependent. The nonlinear creep compliance is given by

where σ(t) is the real stress at time, t and T is temperature.
According to the linear-viscoelastic theory, the creep compliance D (t) can be written as:

where D0 describes the momentary elastic part of the compliance and μ0 the zero strain rate viscosity.
To accurately predict the experiment data, a Burgers model, consisting of Maxwell and Voigt–Kelvin units connected in series, is used to model the creep compliance behavior of polymeric materials of POM/BA nanocomposites. The creep compliance D(t) is calculated from the experimental using the software package of the DMTA device (Rheology Advantage Data Analysis), according to the following equation:

where τ k is the retardation time of a Voigt–Kelvin unit D k.
Figure 6(a) to (c) demonstrates the effect of increasing temperature on the creep compliance and simulated value using the Burgers model for the POM and the BA-containing of 25 nm and 220 nm composites. It can be clearly seen that with the increase in temperature the creep compliance increases for the POM and nanocomposites. The creep compliance indicates the temperature active softening of the POM matrix as a result of the highly increased mobility of polymer chains at the same applied load. Observations of temperature clearly indicate that the time-dependent deformation of these nanocomposites is much lower than that of pure POM. Strikingly, the nanocomposite with BA 25 nm has exhibited the lowest creep compliance at the whole evaluated temperature range. For the creep compliance value of BA 25 nm composite at evaluated temperature of 50°C was increased by ca. 20% compared to the pure POM (compare Figure 6(c)). This can be confirmed to the particle size effects. Such an observation of higher creep resistance is further substantiated by the small nano-scale distribution of BA, where a large fraction of the BA is supported to remain in the more restricted mobility of the POM segments with considerable time delay. The results of the Burgers model analysis presented in Table 2. One can see that the Burgers model constitutes a very good fitting of the experimental data of short term creep for each of the separately analyzed temperatures and composites. However, an effect of the temperature level on the values of parameters of the Burgers model was revealed. In order to take into account this effect in the physical model of the composites, a non-Newton viscosity was assumed and a non-linear characteristic of modulus of elasticity of the relaxing term. Since the increased temperature of the POM/BA 25 nm composite as a result of decreased polymer–BA interfacial strengths, reduced modulus, as revealed from the corresponding DMA tests (compare Figure 2). Besides viscosity data the creep compliances offer an insight into the elastic behavior of the nanocomposites. In spite of the lower viscosity and following from that the higher viscous deformation of the BA composite this composite material shows a smaller total deformation at short creep times which is due to the less pronounced elasticity, at least in the short time region (t closer to 0).
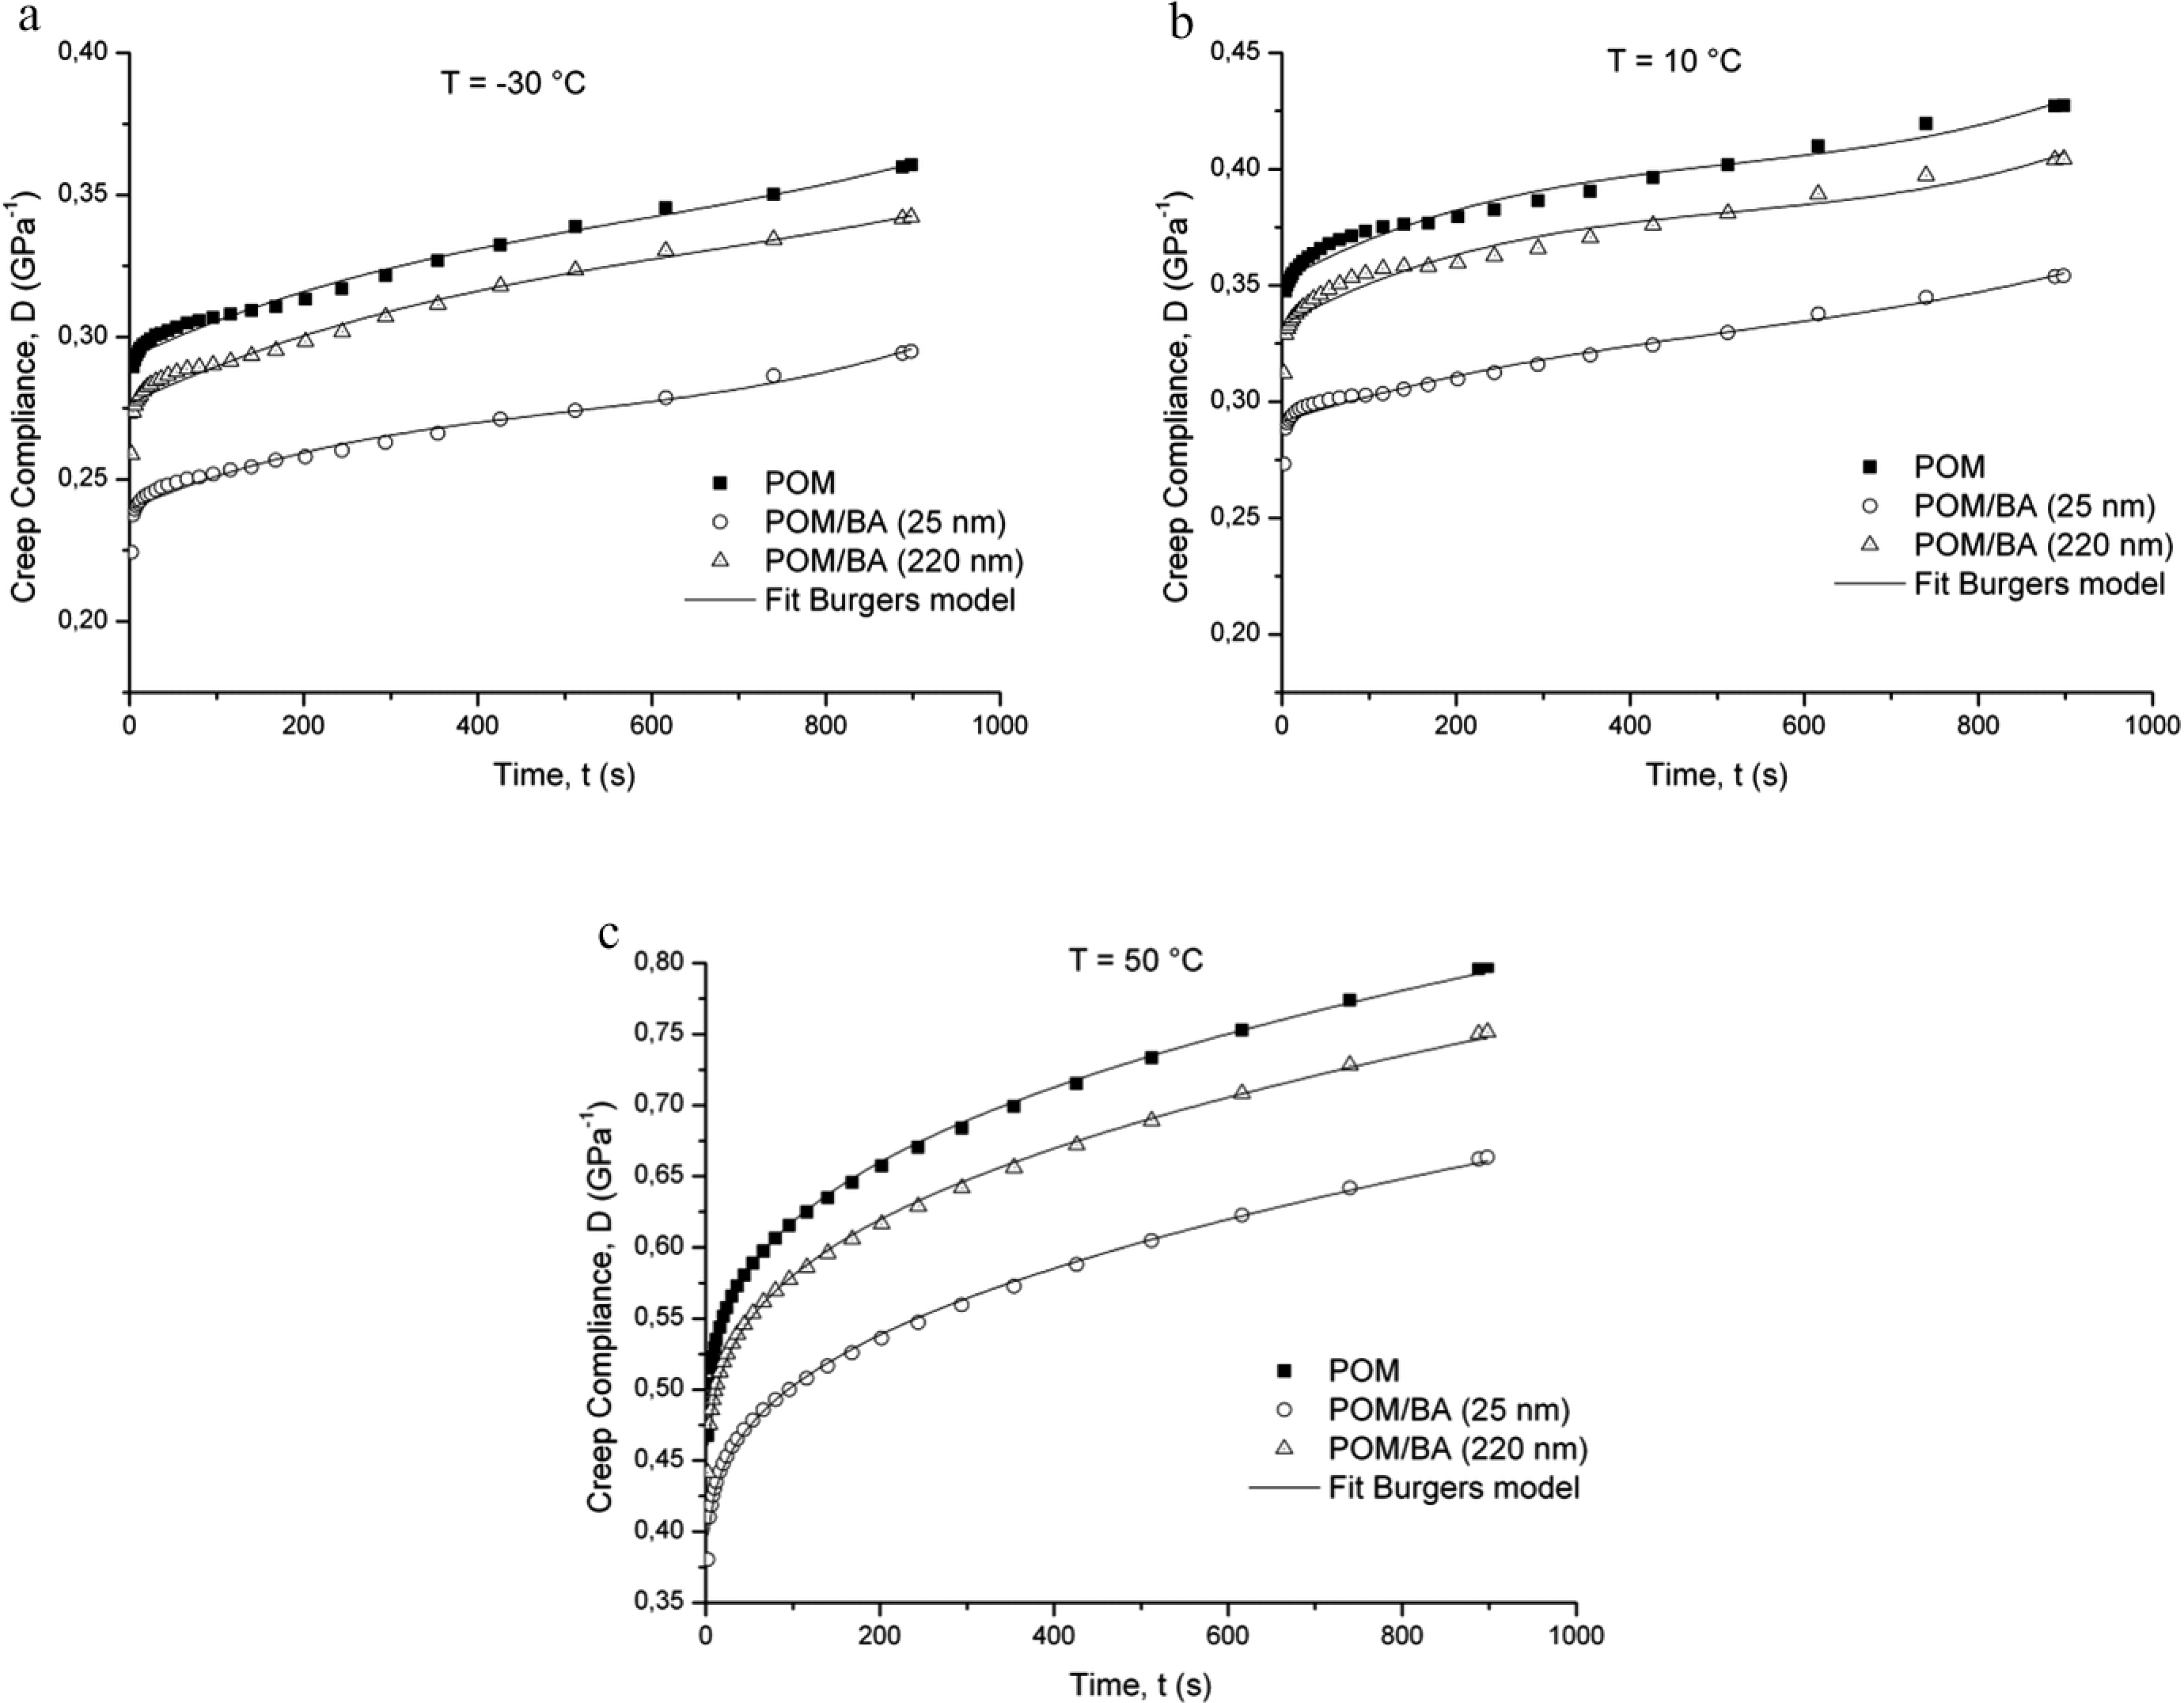
Effect of temperature and their fittings by the Burgers model on the creep compliance of the POM, POM containing 3 wt% of BA 25 nm and 220 nm (a) −30°C, (b) 10°C and (c) 50°C. POM: polyoxymethylene; BA: boehmite alumina.
Burgers parameters for the creep response of the POM/BA 25 nm composite.
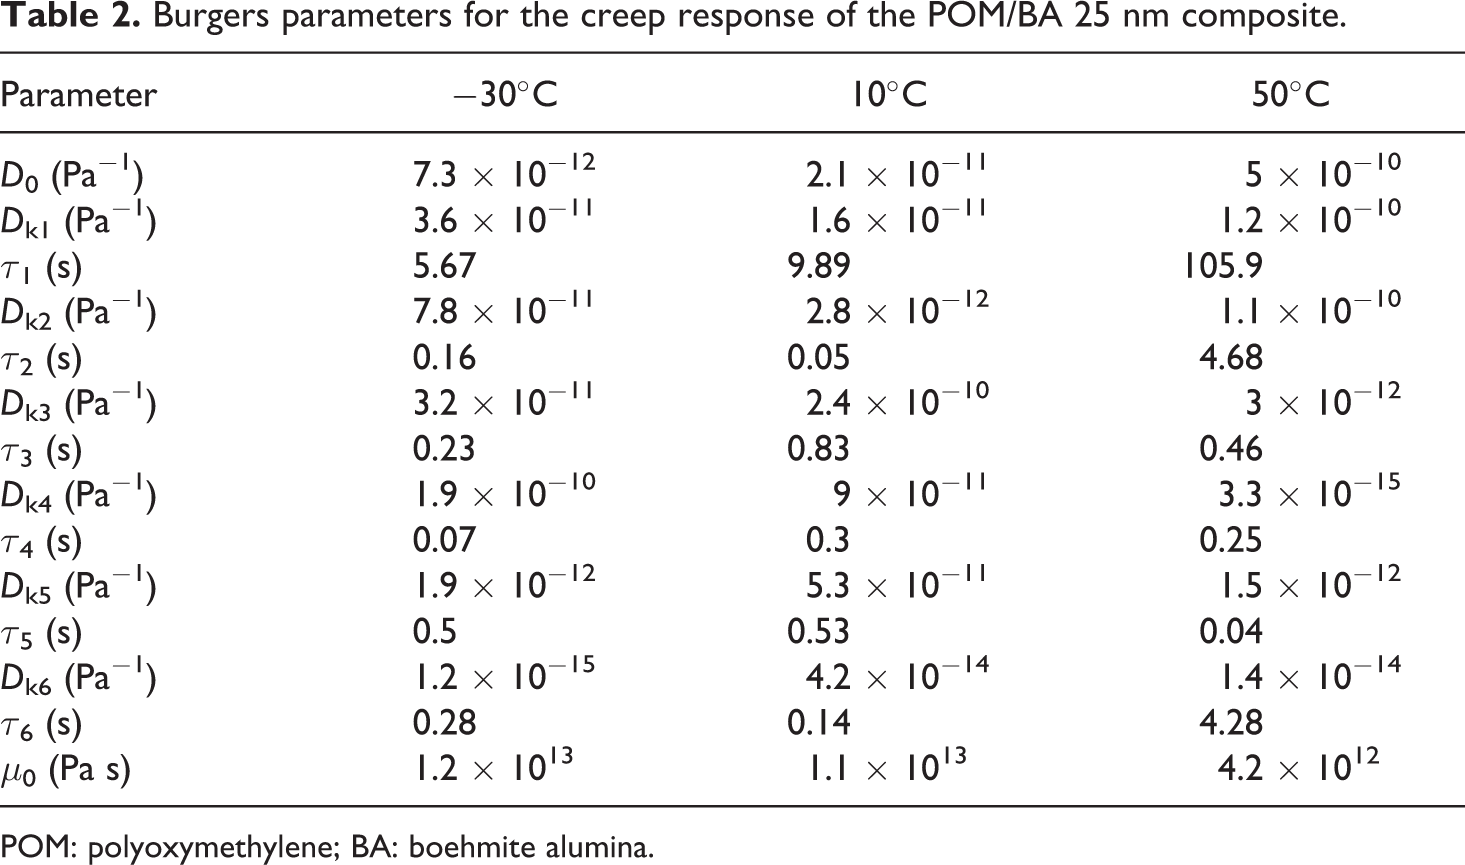
POM: polyoxymethylene; BA: boehmite alumina.
The creep compliances of POM/BA 25 nm and POM/BA 220 nm composites were measured at different temperatures and shifted according to the following equation: aT = D (t, T)/(D(t, Tref)., choosing Tref. = 25°C as the same reference temperature of DMA test. To describe the viscoelastic response of the creep master-curves, a constitutive model is required. There are a variety of equations that have been used to model the viscoelastic behavior of polymeric materials. Simple model, known as Findley power law can be applied assuming linear viscoelastic behavior. 10 For the resulting creep compliance (D) vs. time master curves, the Findley power law is adapted for fitting the experimental data. Note that the related power function is given:

where n is a stress independent constant, DF0 is the time-independent compliance, and DF1 is the coefficient of the time-dependent term.
In Figure 7, the master curves and their fitting by the Findley power law equation of the creep compliances D(t) of POM/BA 25 nm and POM/BA 220 nm composites at the reference temperature of 25°C, are plotted as a function of the creep time, t. Incorporation of BA 25 nm particles decreased the creep compared to the BA 220 nm composite. Note, the time-independent compliance (DF0) of the BA 25 nm composite is lower than that of BA 220 nm composite. This was expected based on the reinforcing effect of the smaller size of alumina. Figure 7 also shows that the application of TTS to the created master curves of BA 25 nm and 220 nm composites for long term allows for analysis of primary and secondary ranges of creep (initial and steady state creep, respectively) but not included a tertiary range (fracture creep). A very good consistency of computational characteristics with experimental ones for both the primary- and secondary ranges of creep has been achieved. However, the Power law model provided a prediction within the steady state creep at least until 139 days while for longer time duration the calculated data may show considerable deviation from the experimental results.
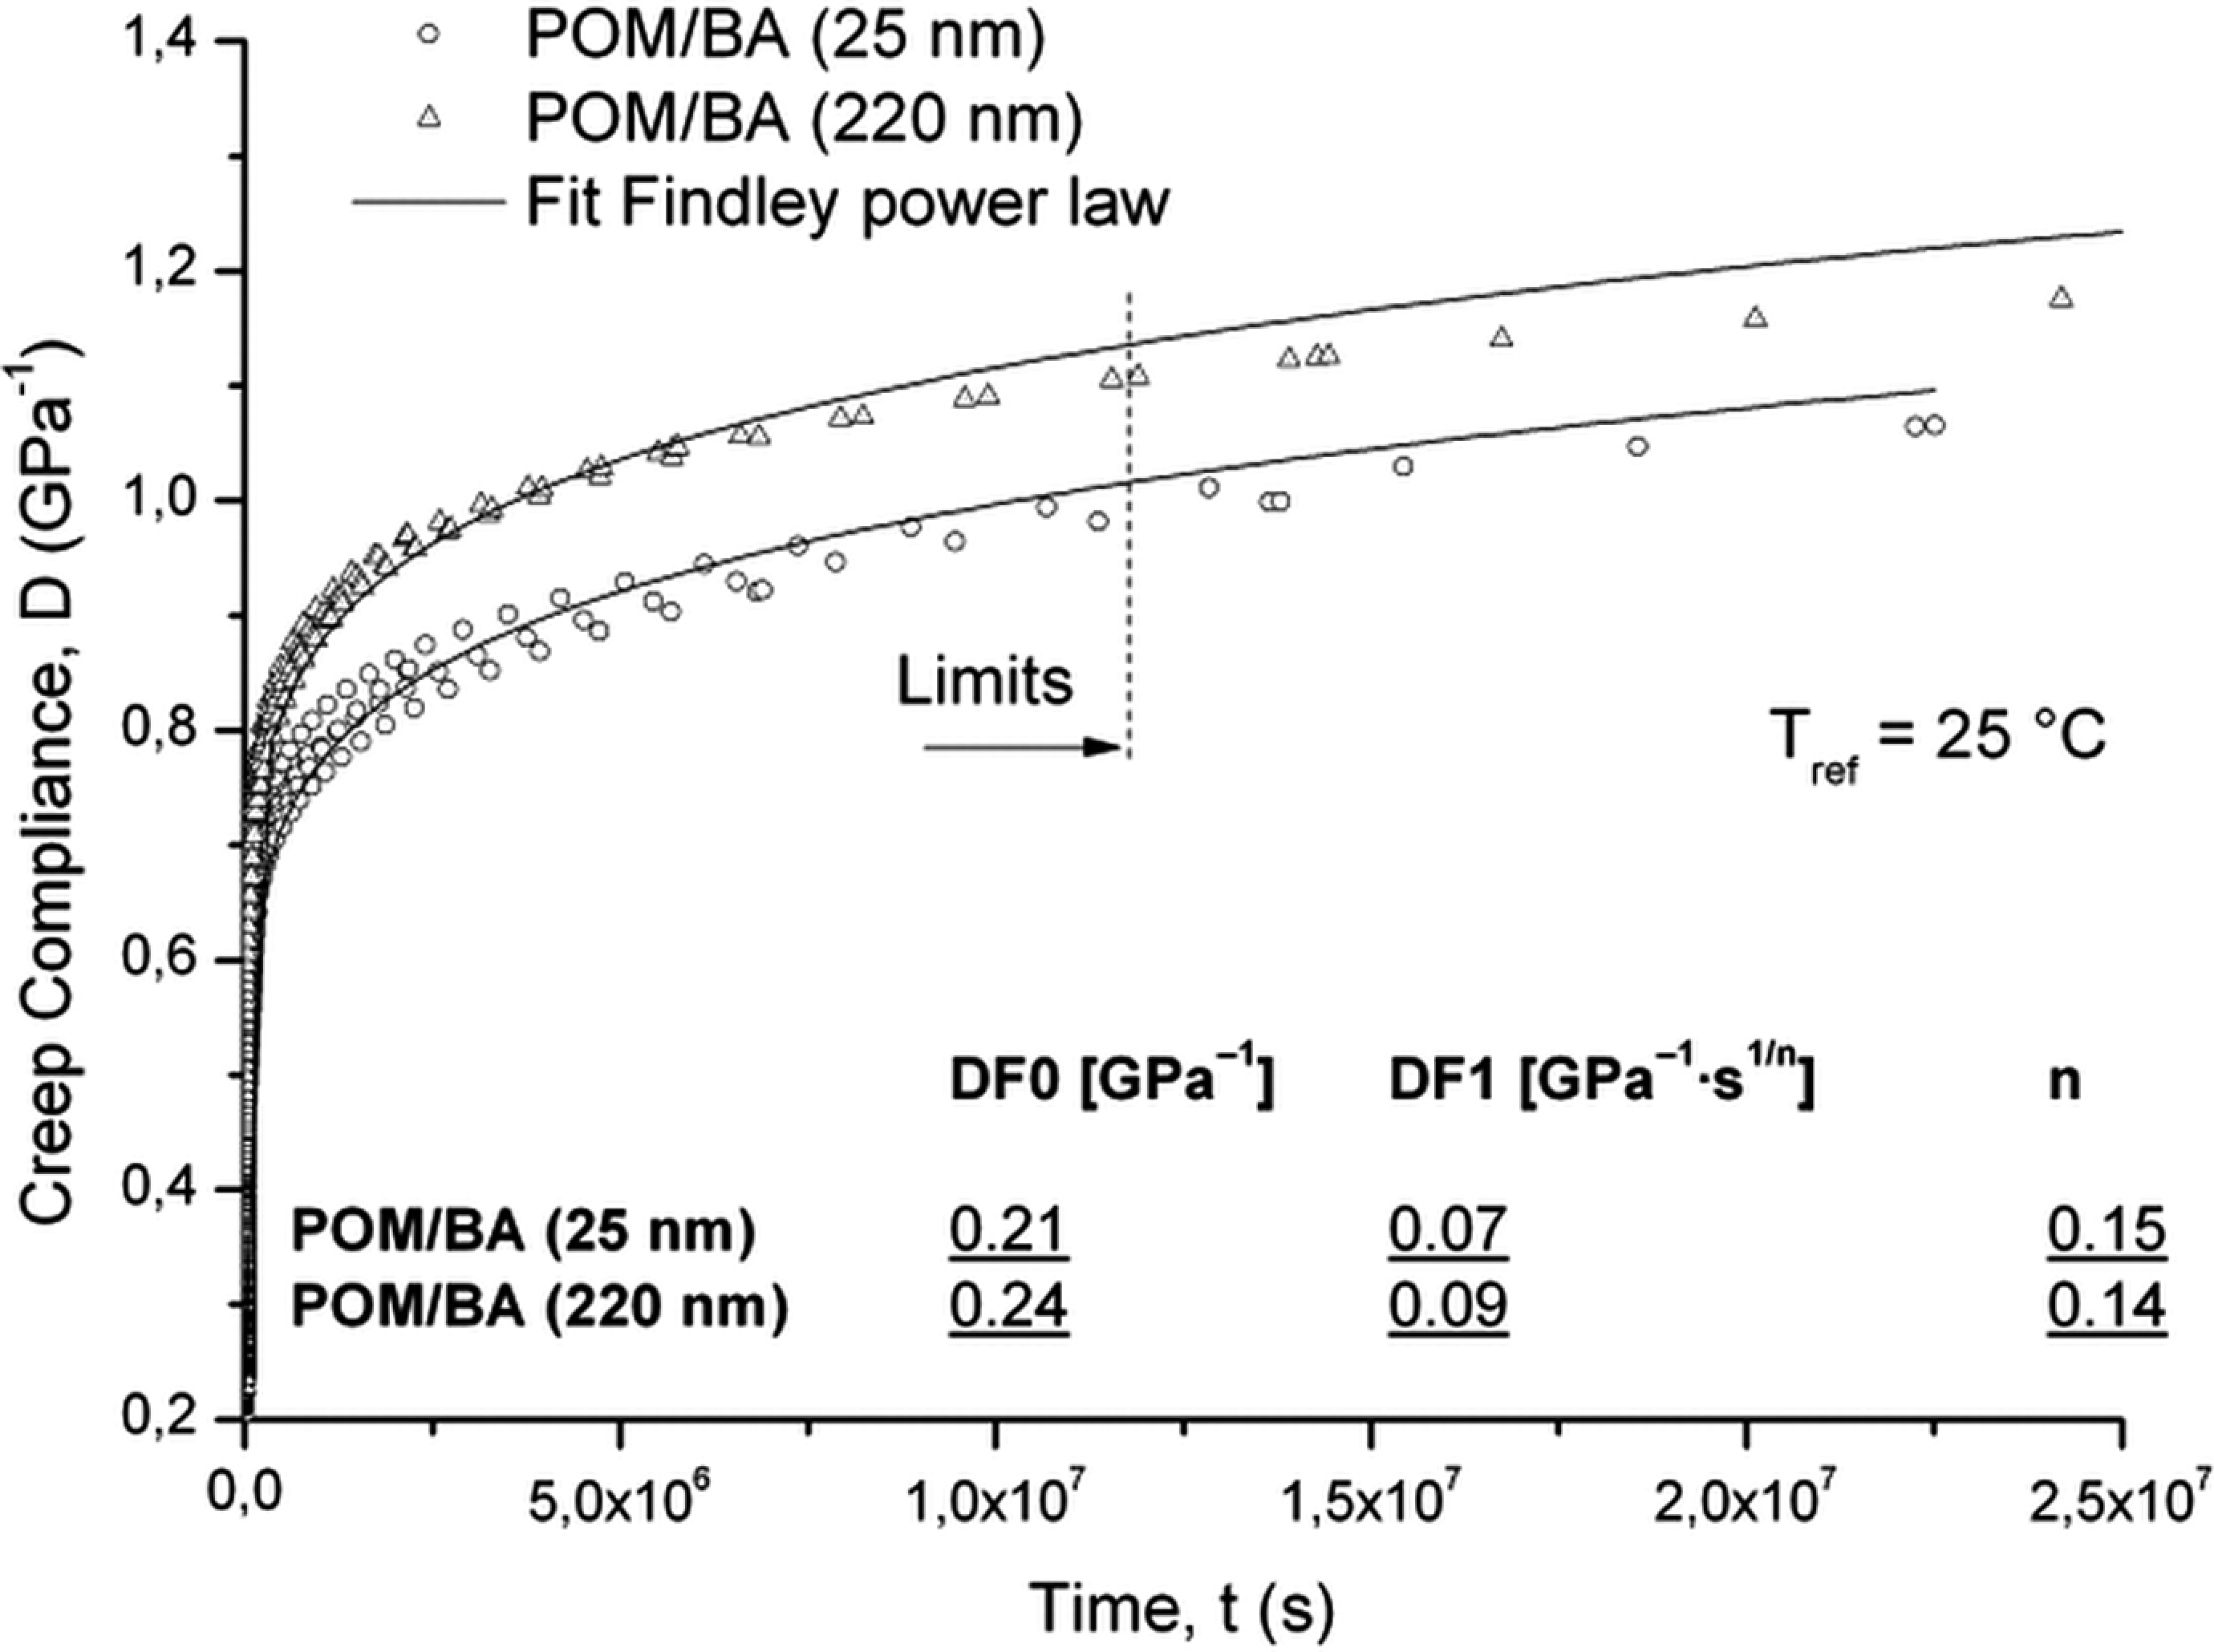
Creep master curves (compliance versus time) constructed by considering the TTS and selecting T ref = 25°C and their fittings by the Findley power law equation. TTS: time–temperature superposition.
From the creep master curves it follows that the composites obey the TTS principle. The shift factors are linked with TTS via the Arrhenius function. 19 From the shift factors for the creep compliances of the POM/BA 25 nm, the activation energy of 111.8 kJ/mole can be calculated. The activation energy of POM/BA 220 nm is calculated as 110 kJ/mole. Comparing these activation energies with those from the DMA (Activation energy values were derived from DMA: POM/BA 25 nm = 306.4 kJ/mole and POM/BA 220 nm = 259.7 kJ/mole), a fair agreement can be noticed for the nanocomposites. One can see that the values of activation energy obtained by Arrhenius equation, similar trends to the DMTA results at the same reference temperature and load (three point bending). The increase in activation energy with BA 25 nm filling suggests that the mobility of the POM chains was more reduced in POM nanocomposites than that of with BA 220 nm.
Conclusion
This work devoted to study the effects of particle size on thermal, mechanical and creep properties of a POM and its BA reinforced nanocomposites. The BA was introduced in the POM in 3 wt.% via WM melt compounding using a twin-screw extruder. Based on the results the following conclusions can be drawn:
Incorporation of BA enhanced the modulus of POM. The modulus of the POM/BA 25 nm composite was markedly higher than that of POM/BA 220 nm composite. The particle size of BA was reflected in the DMTA response.
Incorporation of BA particles into the POM matrix resulted in a considerable decrease of the creep compliance. This can be attributed to the reinforcing effect of BA. Moreover, the Burgers model could well describe the creep compliance vs. time traces for POM and its composites at the whole evaluated temperature range.
Based on the TTS principle experiments master curves in form of strange modulus vs. frequency and creep compliance vs. time were constructed. The related master curves of creep compliance could be satisfactorily described by the generalized Power law, at least until a given time threshold in the steady state creep.
The activation energies are calculated for the nanocomposites with the help of Arrhenius equation. The activation energy for the BA 25 nm composite was found to be higher than BA 220 nm composite in both DMA and creep tests.
Footnotes
Funding
This research received no specific grant from any funding agency in the public, commercial, or not-for-profit sectors.