
Abstract
The thermoplastics within wood–plastic composites (WPCs) are known to experience significant time-dependent deformation or creep. In some formulations, creep deformation can be twice as much as the initial quasi-static strain in as little as 4 days. While extensive work has been done on the creep behavior of pure polymers, little information is available on the mechanical effects of mixing polymers with large amounts of wood-based or other bio-based fillers. As producers seek to develop structural WPC products that may be subjected to sustained loads, it is imperative that this creep behavior be understood. We characterized the quasi-static and time-dependent deformations of seven WPC formulations (primarily polypropylene, and polyethylene) in tension and compression. The quasi-static, mode-dependent response of the material to a linearly increasing strain was found to be well described by an exponential function coupled with a linear term. For most formulations, significant differences between the tension and the compression behaviors were not exhibited below 50% of the tensile capacity. The long-term creep response of the material was found to conform well to a time-dependent power-law (Findley, Shapery, etc.) at various stress levels for both loading modes.
Introduction
Wood–plastic composites (WPCs) are produced by thoroughly mixing wood flour and thermoplastic resin at elevated temperatures and then extruding the composite through a die to form the desired shape. The WPC industry has grown rapidly since the mid-1990s and now consumes significant amounts of thermoplastics. In 2005, WPC manufacturers used over 600 million pounds of both recycled and virgin plastics, 90% of which was polyethylene. The remaining portion was primarily PVC and polypropylene. 1 WPC products in North America, 90% of which are extruded, are generally nonload bearing or lightly loaded. Residential decking and railings make up the vast majority of WPC production. Wood–plastic accounts for 14% of overall decking market with continued growth projected. 2 Given the success of these products, there have been substantial efforts to expand their use by developing structural WPC products. 3 Because of these efforts and the potential for continued growth, it is important to understand the time-dependent mechanical behavior of these materials.
The embedded wood particles in WPC material generally make up between 50% and 70% of the material by weight and affect the macroscopic performance of the composite by interrupting the polymer matrix at the microscopic level. 4 Despite the predominance of wood by weight and volume, it is generally accepted that these materials behave more like a polymer than wood. 5 –7 Although the mechanical behavior of WPCs has not been heavily researched and is not well characterized, WPCs, like unfilled polymers, are known to exhibit nonlinear viscoelastic behavior. 8 This means that their mechanical response is dependent on stress, temperature, and time among other variables. It has been shown that the time dependence, typically quantified as creep, is significant, 9 far larger than the creep exhibited by wood. After only 30 days, time-dependent deformation can be as much as three times the initial deflection. 10 Similar to their constituent polymers, WPCs are axially mode-dependent; their response to tension and compression stresses differs. This bimodal behavior is most likely due to hydrostatic pressure dependence of the component polymers. 11 Bulk compression reduces the material's available free volume, which will affect the deformation response of the polymer matrix when subsequent deviatoric stresses are applied. 12
As a replacement for wood in structural applications, WPCs experience flexure as the dominant loading mode. Because of this, the majority of published mechanical testing results have reported bending properties. 13–15 Creep testing has also been performed predominately in flexure for relatively short durations, usually for the purpose of comparing manufacturing parameters. 16–19 A few studies have conducted longer flexural creep tests up to 90 days. 9,10 Flexure response, however, is mechanically complex due to both the material’s bimodal behavior and its nonlinear constitutive response. One study by Haiar 20 investigated the difference between tension and compression behaviors and their effects on bending of WPC members. This study did not, however, include time effects. In order to truly understand the complex combination of tension, compression, and shear that occurs in this viscoelastic material during bending over time, both the quasistatic and creep behaviors of WPCs must be characterized for each mode. Once these behaviors and their relative relationships have been established, accurate models can be produced to optimize extruded cross-sections for flexural loads. Several studies have investigated the uniaxial creep response of WPCs, 8,21 –24 generally for a single formulation. The durations of these tests were 1 week or less, and only a few of the studies have described the data with a mathematical model.
Our objective was to investigate and quantify the axial quasi-static stress-strain, and long-term creep responses of WPCs. The material behaviors are expressed using mathematical and statistical models, and the behavior of each of the seven WPC formulations are described using their respective material constants.
Experimental testing program
Tension and compression tests were conducted on WPC coupon specimens under both monotonically increasing displacement (quasistatic) and creep conditions. Quasistatic tests were conducted at a nominal strain rate of 1% per minute. Creep testing was conducted at multiple stress levels for up to 3 years.
Materials
Numerous materials are currently used in the production of WPCs. We utilized a variety of polymers, wood types, manufacturers, and product cross-sections to sample a range of WPC behaviors. Details about the materials and the products are shown in Table 1. Formulations L and Z are research formulations produced by the USDA Forest Products Laboratory and the Wood Materials Engineering Lab at Washington State University, respectively. All other formulations were commercially produced extruded decking products. Ingredient percentages are by weight. Values not shown were not provided by the manufacturers.
WPC material and product properties.
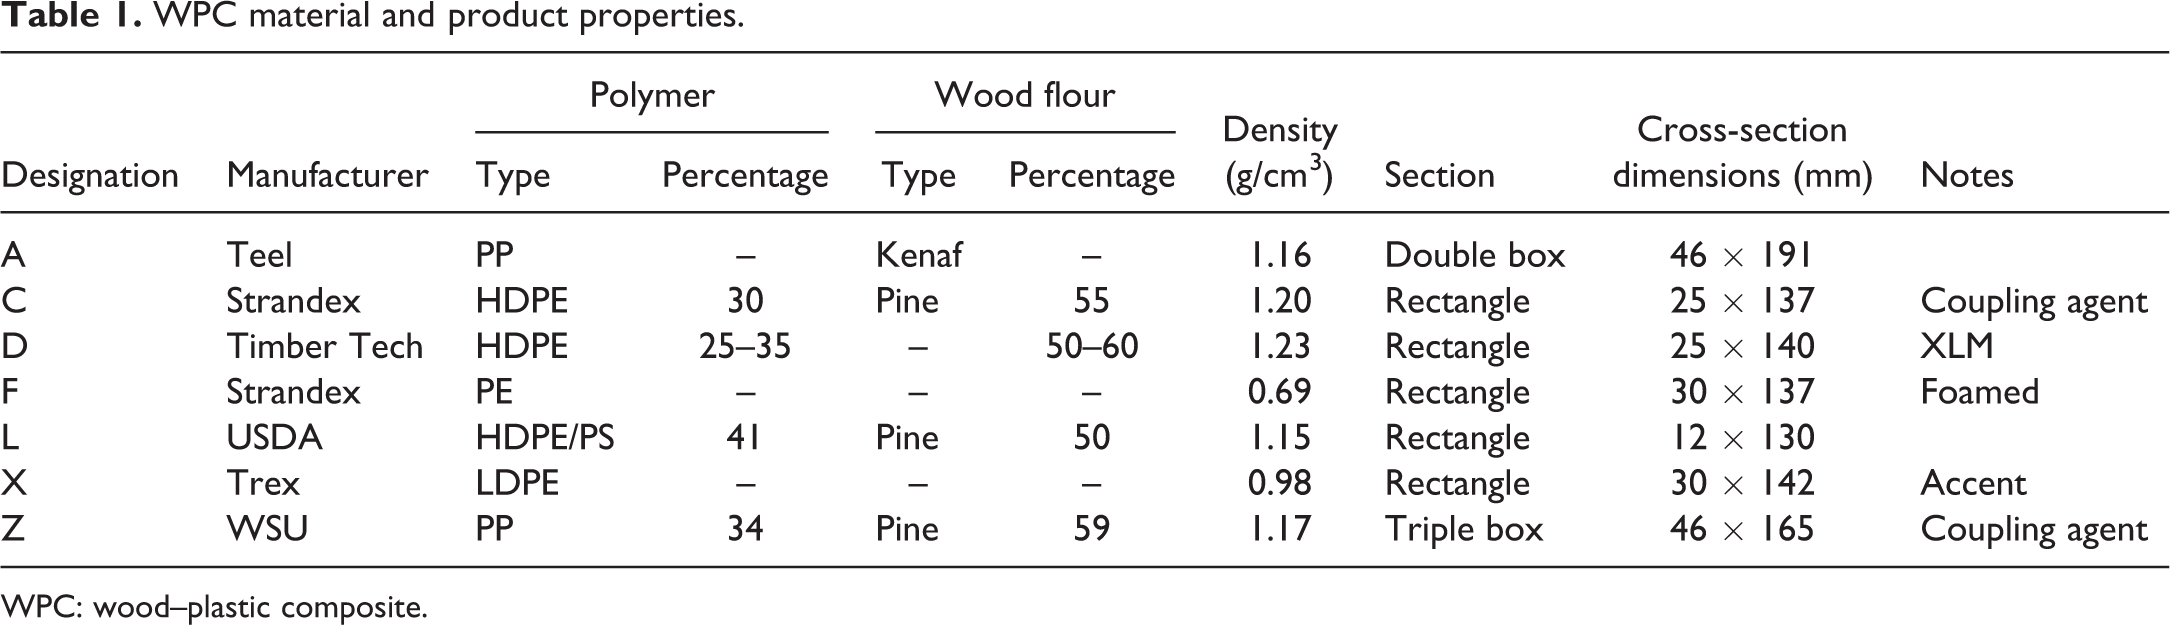
WPC: wood–plastic composite.
Specimens
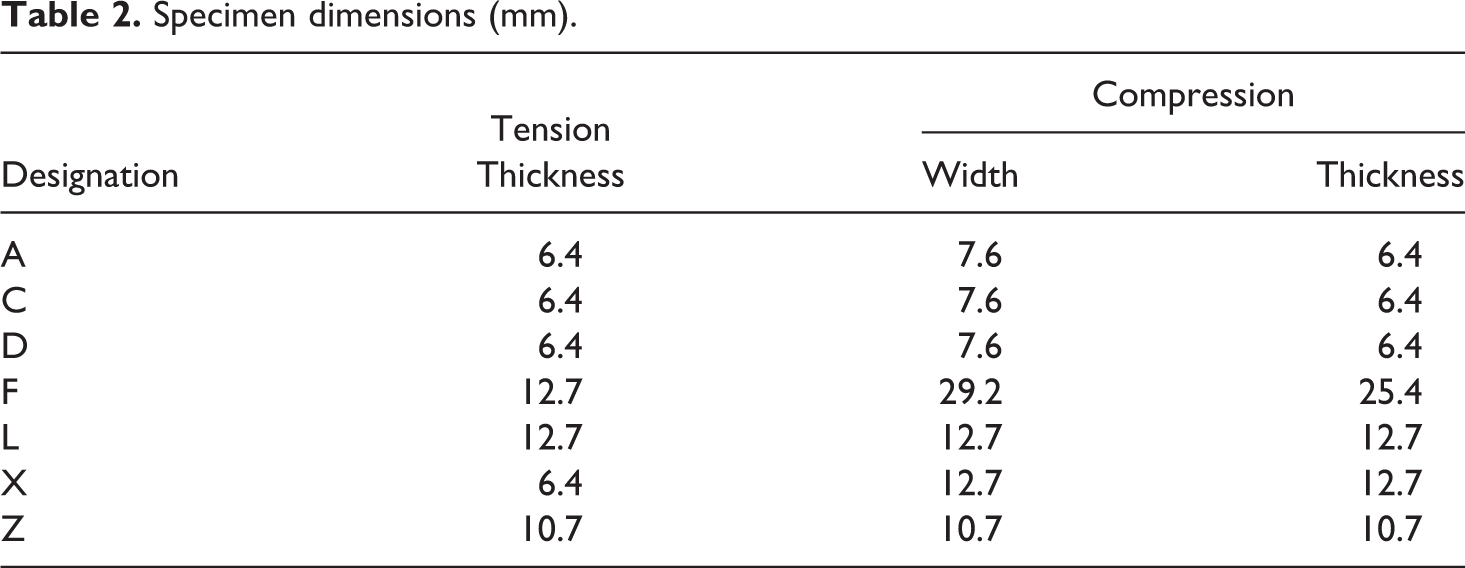
Replicate coupon specimens were used for both quasi-static ramp tests and long-term creep tests. The coupon specimens were cut and machined from full-size extruded WPC products such that the uniaxial stress applied to the coupon was parallel to the extrusion direction. The specimens were taken from the edgewise extreme fiber zones, those areas of the cross-section that would experience maximum strain if the boards were subjected to bending about the major axis. The tension specimens were type I dogbones with a 50-mm gage length as defined in ASTM D638. 25 The thickness of tension specimens varied in order to allow the testing apparatus to apply the required stress in the gage length. Research by Haiar 20 indicated that failure in prismatic compression specimens occurred at the boundary conditions due to local effects. To prevent this, specially designed dogbone compression specimens were used. The specimens were of similar dimensions to those in ASTM D695. The specimen gage length was reduced to 12.7 mm and the radii were reduced to 12.7 mm to reduce the unbraced length. The cross-sectional dimensions of each compression specimen were kept approximately equal, so that buckling was unlikely in either direction. The cross-sectional areas of the coupons were varied across the formulations in order to allow the testing apparatus to apply the appropriate load. Formulation F proved to be too compliant to resist buckling in the dogbone shape and larger prismatic coupons were used instead. The dogbone dimensions can be seen in Figures 1 and 2 and the cross-sectional dimensions of each formulation are shown in Table 2.
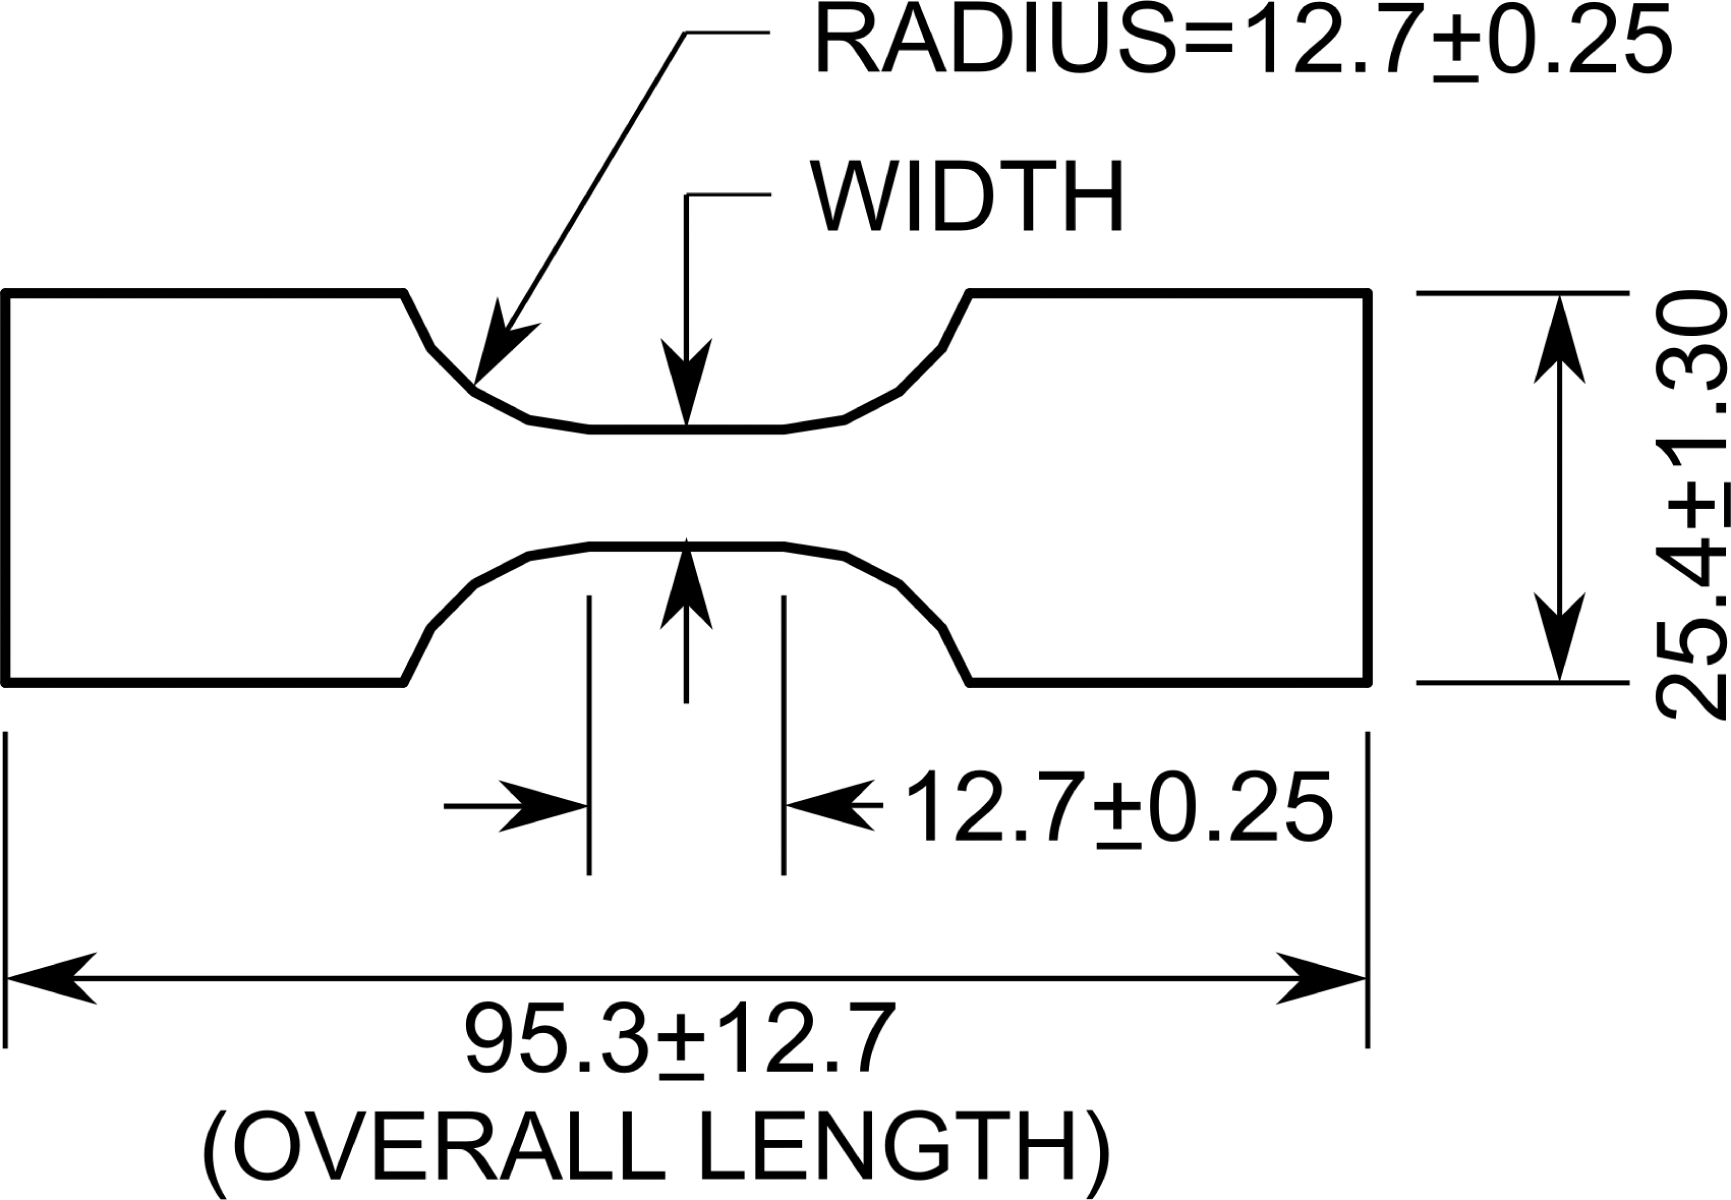
Compression coupon specimen (dimensions in mm).
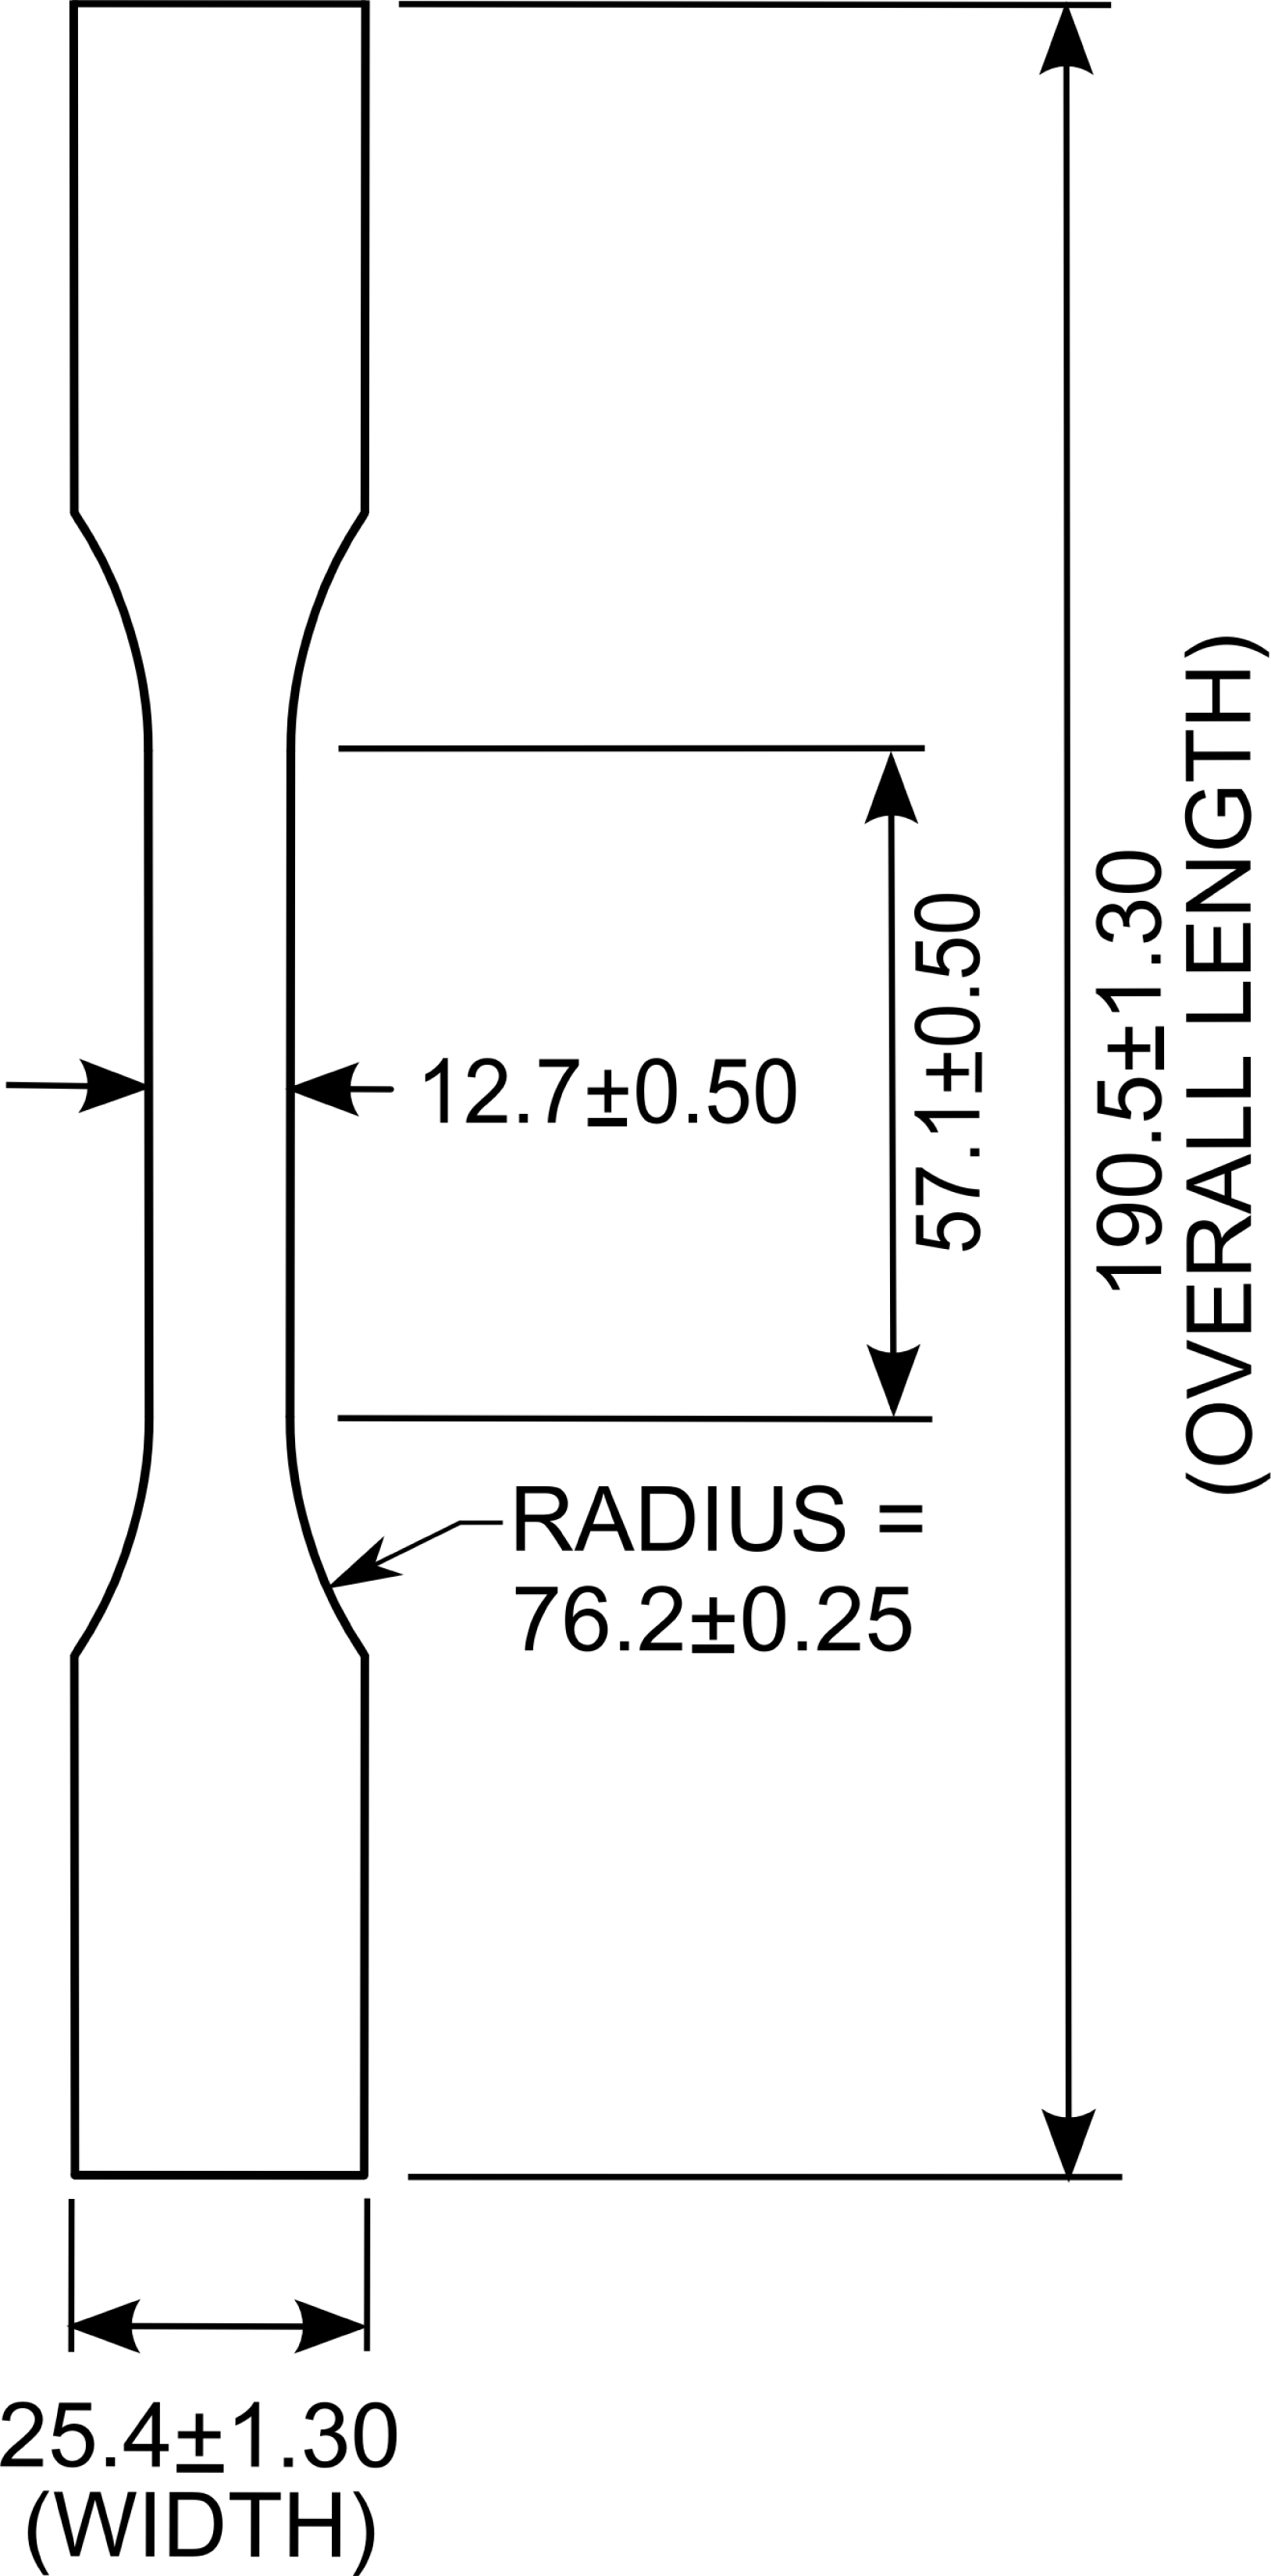
Tension coupon specimen (dimensions in mm).
Specimen dimensions (mm).
Quasi-static ramp testing
Uniaxial tests were performed on coupon specimens in both tension and compression to determine the short-term ultimate strength and the stress–strain response of each material. Both modes were tested under displacement controlled conditions with a target strain rate of 1% per minute using a servomechanical universal testing machine. Tension tests were conducted with self-aligning mechanical grips in accordance with ASTM D638. The compression coupons were tested according to ASTM D695, 26 using specially designed C-shaped steel grips that acted as loading platens and also secured the specimen in place to prevent buckling. A detailed discussion of this apparatus can be found in Hamel et al. 27 Deformations of the gage length in both the tests were measured using an extensometer with a 25-mm gage length for tension tests and a 12.5-mm gage length for compression tests. Test data were recorded using a computer-controlled data acquisition system at 5 Hz.
Determination of creep stress levels
The long-term creep tests were performed at two stress levels: 20% and 50% of the average ultimate failure stress in tension (
Uniaxial coupon specimen stress levels for creep tests (MPa).
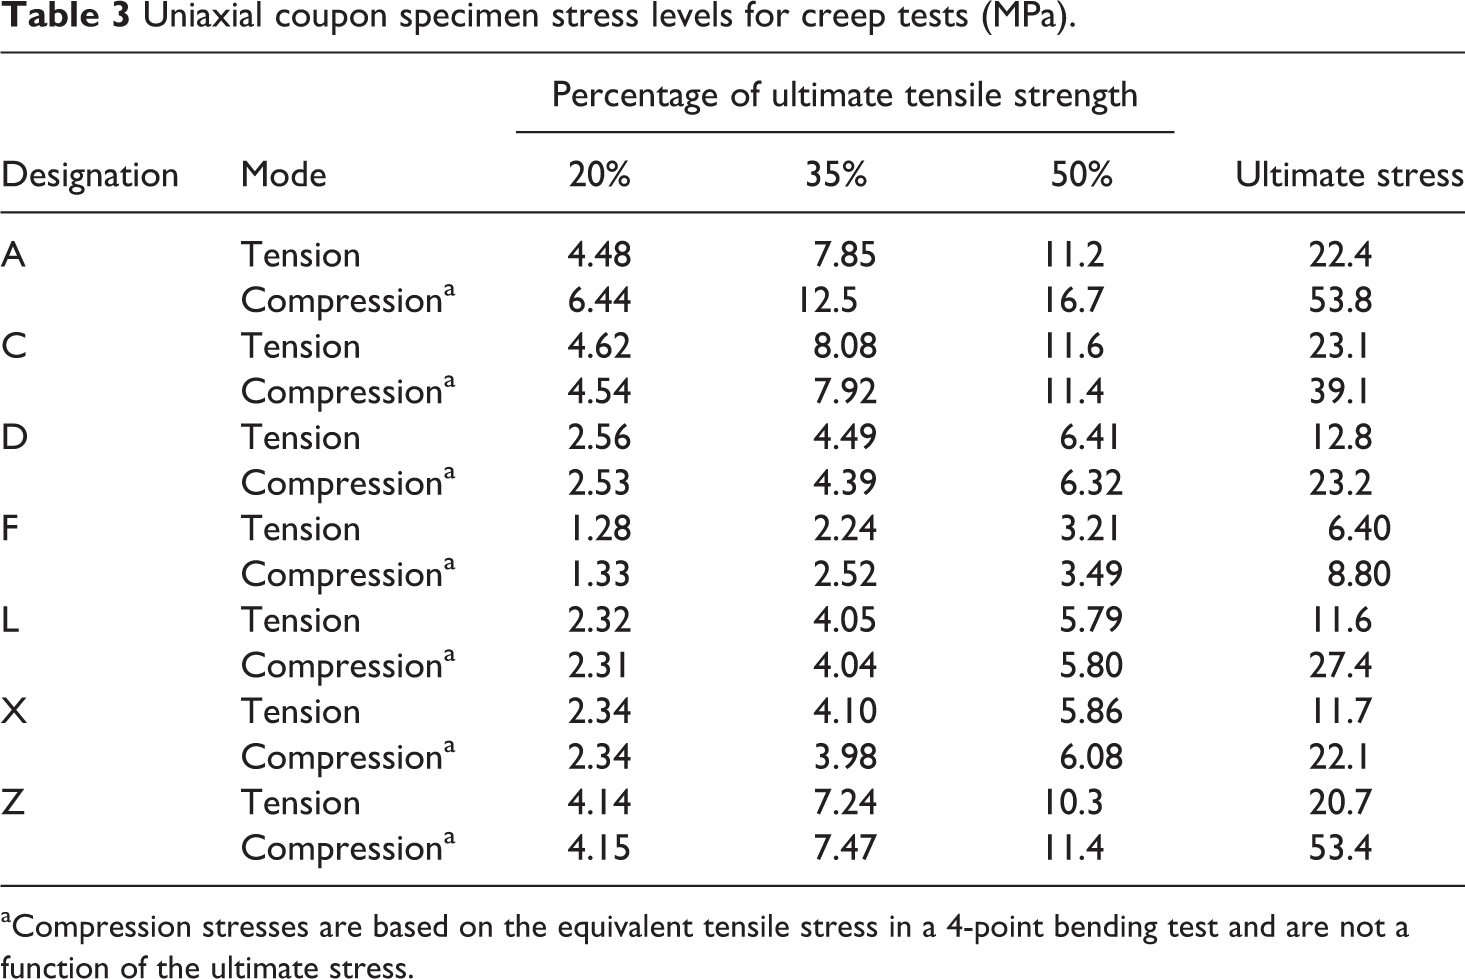
aCompression stresses are based on the equivalent tensile stress in a 4-point bending test and are not a function of the ultimate stress.
Long-term creep testing
Coupon specimens for tension and compression creep testing were identical to those described for short-term testing. The load was applied using steel grips attached to the piston rod of a pneumatic cylinder. The force applied by each cylinder was controlled by an electropneumatic regulator. For the tension setup, each pneumatic cylinder was loaded with two specimens, which were mounted using serrated grips. The load was applied at the center of a steel bar connecting the specimens such that an equal load was maintained in each specimen. In the compression setup, the load was applied directly to the grips by the piston rod and the serrated grips were hand tightened. Deformation data of each specimen were collected using two metallic foil strain gages (CEA-13-250UW-120) by Vishay Intertechnology, Inc. on opposing faces connected in a half Wheatstone bridge using Field Point strain gage modules produced by National Instruments, Inc. The gages were attached to the specimens at the midpoint of the gage length. Data for all creep tests were recorded with a data-acquisition program written using LabVIEW 8.2, a product of National Instruments, Inc.
Two specimens were tested for each condition and the results were averaged. All tests were conducted in a climate controlled room at 25°C and 50% relative humidity. Loads were applied as quickly as possible after the specimens were mounted in their grips. The specimens experienced strain rates during loading between 1% per minute and 3% per minute.
Applying mathematical models to experimental results
Constitutive equations to describe WPC behavior
A large variety of mathematical models have been used to describe polymer creep. Research on polymeric materials in the decades after World War II led to the development of linear viscoelastic theory, in which the constitutive equations are expressed as a convolution integral.31,32
Since using the integral approach is impractical for design purposes, materials are more commonly modeled using a theory presented by Schapery,
33
which describes the constitutive behavior of nonlinear viscoelastic materials based on thermodynamic principles. For creep response, Schapery’s model can be reduced to a hyperbolic sine and a time-dependent power-law.
17
The time- and stress-dependent strain is expressed as

where A
0, σ0, and n are material constants, t is the time from the start of loading, and B(σ) is some stress-dependent function. Several other authors have used the hyperbolic sine term to describe stress–strain behavior of WPCs due to a monotonically increasing load.
5,20,34
The derivation of a time-dependent power-law supports the widespread empirical use of this form after its introduction by Findley et al.
31
A few authors
17,21
have demonstrated the successful use of Schapery’s theory to describe both the quasistatic and time-dependent behavior of WPCs. Since the quasi-static ramp tests were conducted relatively quickly, the time-dependent term in equation (1) was negligible for these tests, and the “instantaneous” strain of the materials becomes


where σ is the axial stress expressed as a positive value and E 0, A 0, and σ0 are mode-dependent material constants. It was found by comparing the SD of the residuals, which is a normalized measure unaffected by the number of data points, that equation (3) provides a far better fit to the data than equation (2).
For a creep test at a particular stress level with an instantaneous step loading, the hyperbolic sine term in equation (1) becomes a constant strain and can be removed from both sides. The remaining creep strain is

As with the quasistatic strain, equation (4) is mode-dependent and the resulting material constants will be different for tension and compression.
Various functions have been used to describe the stress-dependent power-law coefficient B(σ), including a second hyperbolic sine expression.
31
A suitable formula for B(σ) can be discovered by examining the isochronous creep strain at time equal to one for each creep stress level. The resulting relationship reveals that B(σ) is a nonlinear increasing function, as shown in Figure 3 for formulation C. We find that a stress-dependent power-law, also suggested by Findley, adequately describes the data in this study, such that

Each data point in Figure 3 represents one creep test. The data points are regression fit to find the stress-dependent coefficient functions, B(σ), shown as lines in this figure. For this formulation, the resulting values at stresses below 12 MPa (50% of
We found that equations (4) and (5) adequately describe the creep strain for times greater than 1 h. However, for creep tests in which a specimen is loaded with an increasing load up to the desired level, and then the load is maintained at that level, there is no clear delineation in the strain response between the increasing and sustained loading. Instead, there is a gradual transition zone, which makes it difficult to objectively separate the quasistatic response, described by equation (3), and creep behavior modeled with equation (4). This problem was addressed by choosing a time-based definition for the commencement of creep. Based on the experimental loading times, a universal creep start time, t
0 of 0.01 h (36 s) was chosen as the beginning of creep behavior. In order to maintain a single time scale, the creep strain must be equal to zero at t
0. A convenient method to enforce this restriction and also account for the additional strain observed in the transition zone was to include an exponential term such that

where t 1 is the upper time limit of the transition effects. The transition behavior not accounted for by equation (4) was found to last several minutes and therefore t 1 was defined as 0.05 h (3 min) for all seven formulations. A 2 is an empirical value that is affected by both the transition zone behavior and the rate of loading at the start of the experimental test, the latter of which affects the total strain at t 0.
The complete expression used to describe the loading of specimen followed by creep is the sum of the quasistatic and creep strains

where t1 is equal to 0.05 h and the mode-dependent material constants are E 0, A 0, σ0, A 1, P, n, and A 2.
Statistical models to describe variation and correlation
In order to accurately describe the response of each material and determine its variation, the data were evaluated with a nonlinear mixed-effects (NLME) model as proposed by Lindstrom and Bates.
35
This approach evaluates the test data by including both fixed and random effects. The fixed effects represent the material parameters, while the random effects represent variations between the specimens and in the testing process. The variations are generally represented by normally distributed random variables with a mean of zero. For the short-term ramp tests, this takes the form


where ψ is the variance–covariance matrix that describes the variance of each random effect and their respective correlations. This can be expressed in matrix form
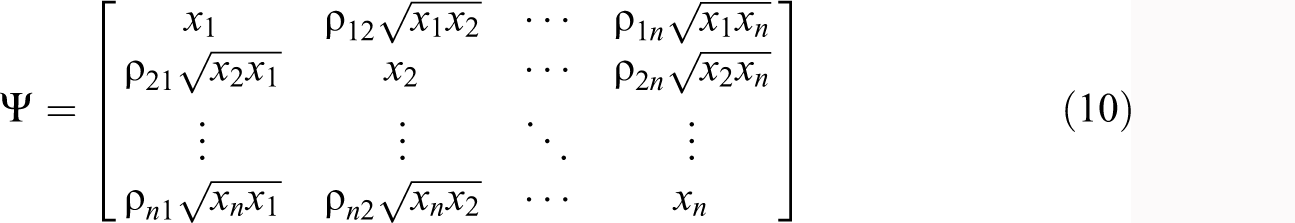
where xi is the variance of each parameter and ρ ij is the corresponding correlation coefficient between the two variances.
This model was solved using techniques outlined by Pinheiro and Bates. 36 Each quasistatic model was fit below 75% of the associated ultimate stress. This limit was imposed because it was shown by Zawlocki, 37 using dissipated energy, that damage accumulation at high stress levels is significant. Mechanical damage alters the material’s structure, increasing the macroscopic strain. This causes the observed behavior at high stresses to deviate from the stress–strain response that is captured by equation (6).
The statistical variation of creep response was also determined using an NLME model. In order to simplify this model, the transition effects, as expressed in equation (6), were neglected and the model was solved using creep data at times greater than 1 h. Because of the amount of testing required to generate the stress-dependency of the creep response, it was not possible to determine the specific pattern of variation in the stress-dependent power-law coefficient function, B(σ). This means that the random effects associated with each terms in equation (5) could not be separated. An analysis of the data revealed that the statistical model with the highest probability of accurately describing behavior assigns random effects to the P and n parameters only (no random effect is necessary for A
1). This is expressed in the following mixed effect model for long-term creep strain

where the vectors have the same definition as above and δc is the residual of each creep test.
Once the long-term creep parameters were determined, the transition effect constant, A 2 was found by regression analysis. Using the fixed effect values for A 1, P, and n from the NLME analysis, the value of A 2 was determined by regression fitting equation (6) to the data from each creep test between t 0 and t 1. The overall mode-dependent value and its variation were found by calculating the mean and SD of the A 2 values from all the tests of each mode and formulation.
Parameters for the material model
Material response parameters for constitutive response (resulting strain in microstrain).
COV: coefficient of variation.
Material response parameters for creep response (resulting strain in microstrain).
COV: coefficient of variation.
aEarly failure of the foamed formulation at higher stress levels caused the data to fit poorly to the proposed model, which is not expressed in the random effects.

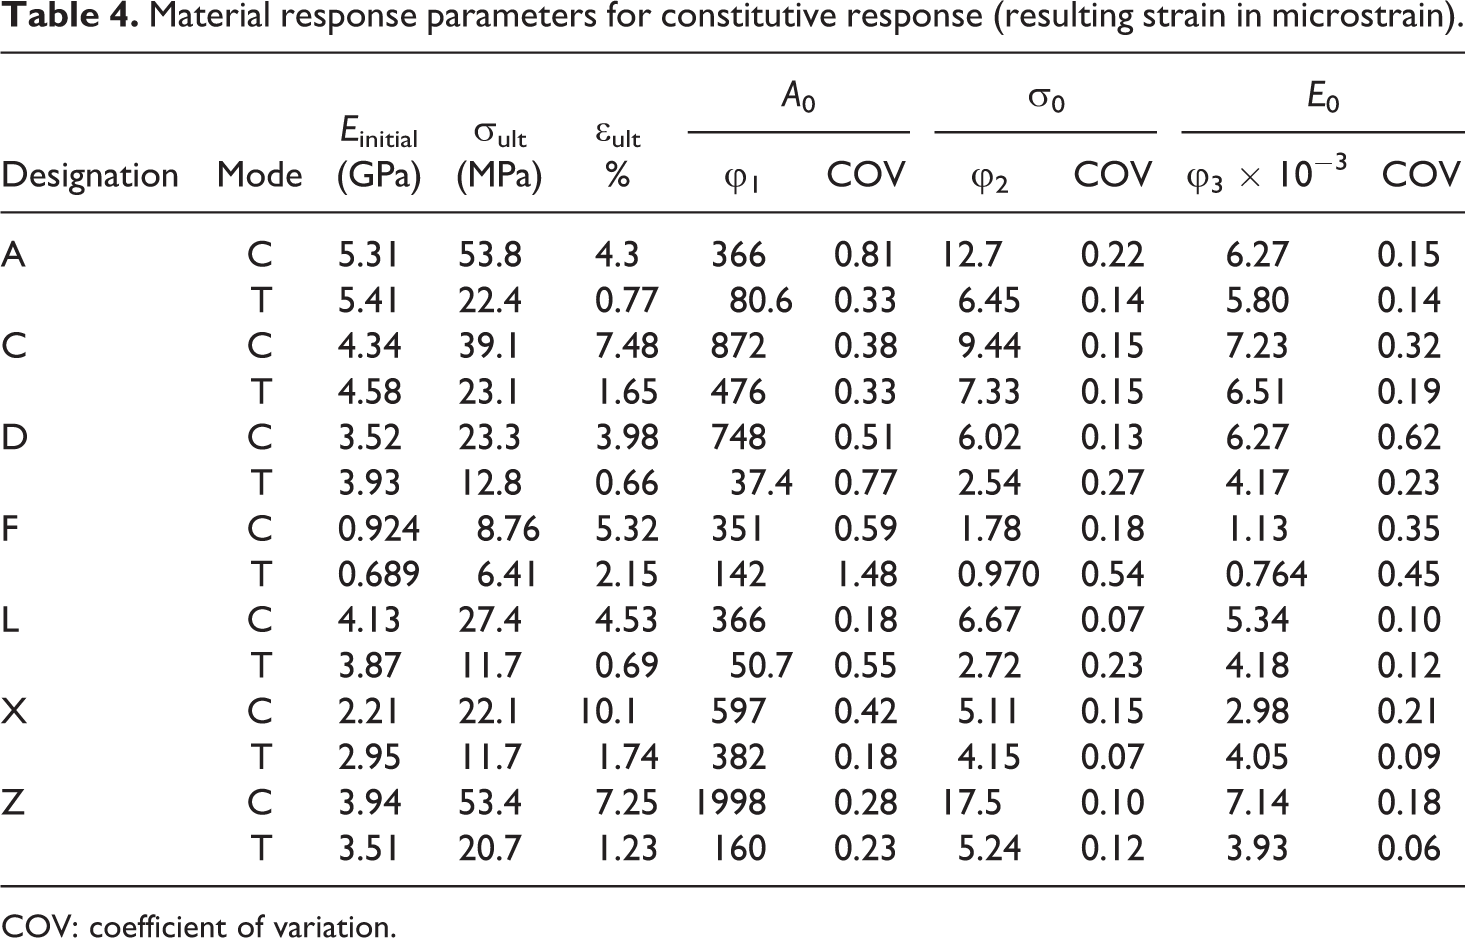
The covariance matrix, ψ, indicated that the three parameters in the quasistatic model (A 0, σ0, and E 0) are both highly correlated and have approximately the same correlations. In fact, an accurate model for all the materials can be described by setting all the correlation factors, ρ ij , in equation (9) equal to 0.9. Statistically, this allows equation (7) to more accurately predict the test behavior, without greatly increasing the number of parameters. Physically, it indicates that specimens with a low relative initial stiffness will continue to have a lower stiffness relative to other specimens throughout the entire stress range. This is reasonable since the stiffness is controlled at all stress levels by the molecular structure, which in turn is determined by manufacturing parameters, board location, etc.
The initial modulus of the material was determined by differentiating equation (3) and applying a stress of zero. The ultimate strength is the mean of the failure strengths of all specimens. The ultimate strain is calculated by taking the average of the strains at the maximum stress, which in all tension tests was close to failure.
There are several cross-formulation patterns in these results, which indicate that the stress–strain curves have similar shapes. For example, the ratio of the stress normalizing constant to the ultimate strength (σ0/σult) is similar for all formulations and well within the material’s variability (mean of 0.25 and an SD of 0.05). In addition, the E initial/E 0 ratio is approximately 0.9 for tension and 0.8 for compression across all formulations. The similarity of the stress–strain shapes can be further demonstrated graphically by normalizing the stress and strain responses by the ultimate strength and ultimate strain, respectively. This is shown (Figure 4) for the tension response of a representative specimen for all seven formulations. The deviation of each parameter (COV) is relatively small (<0.3) for all of the formulations except formulation F, the foamed polyethylene.
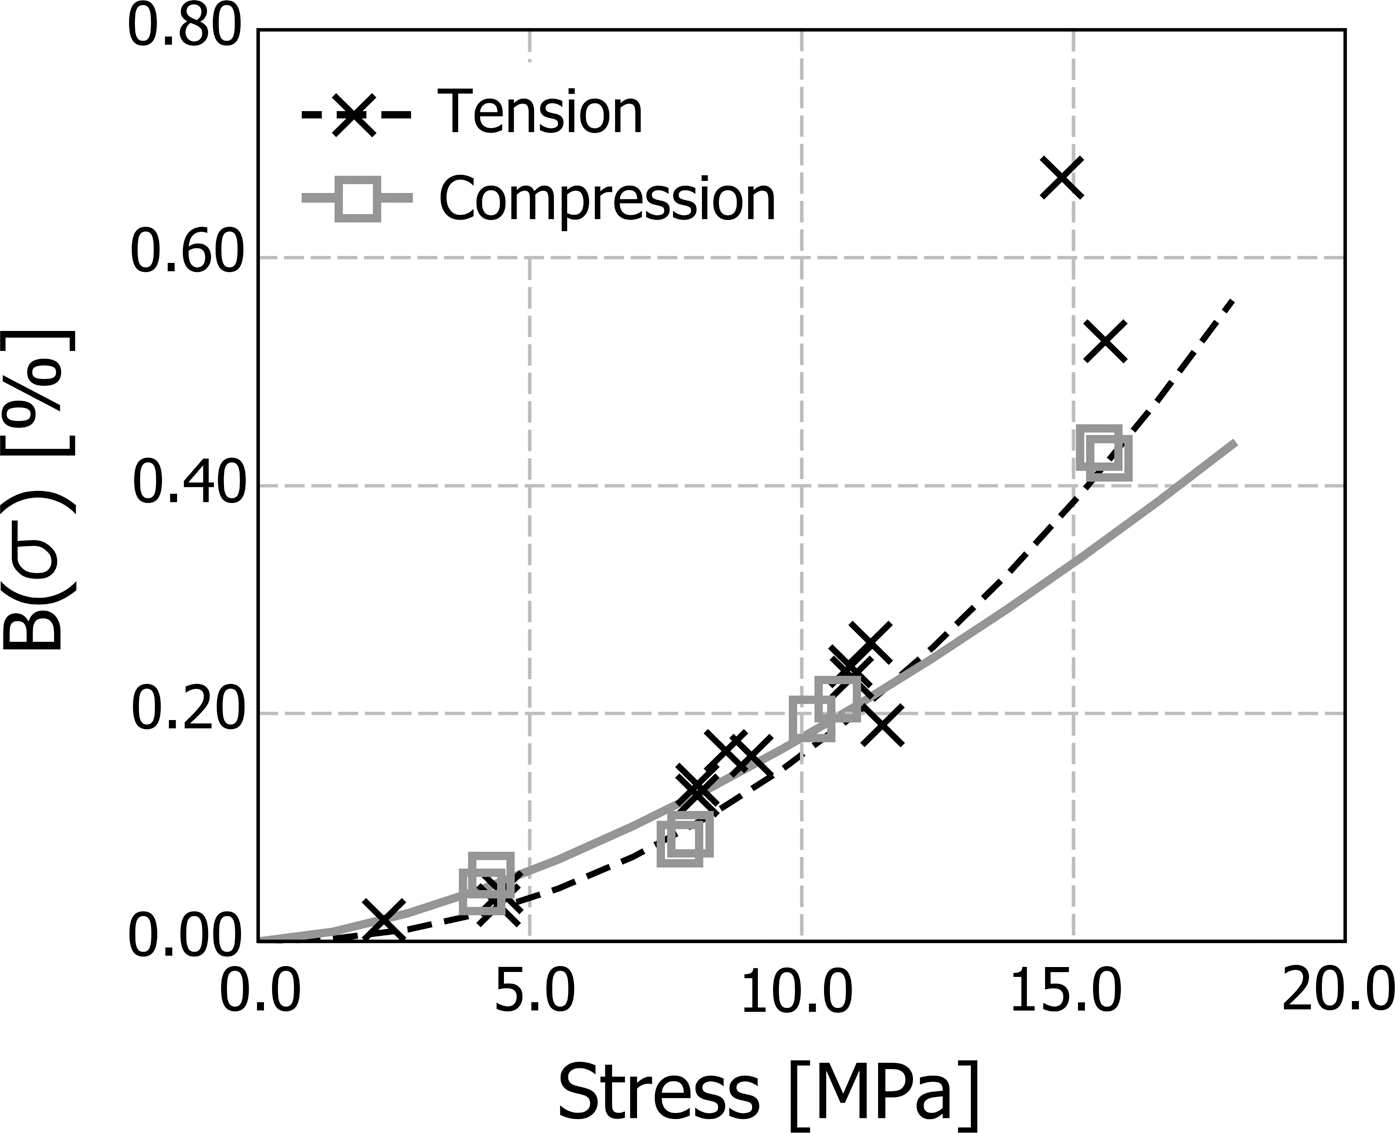
Stress-dependent power-law coefficients for tension creep of formulation C.
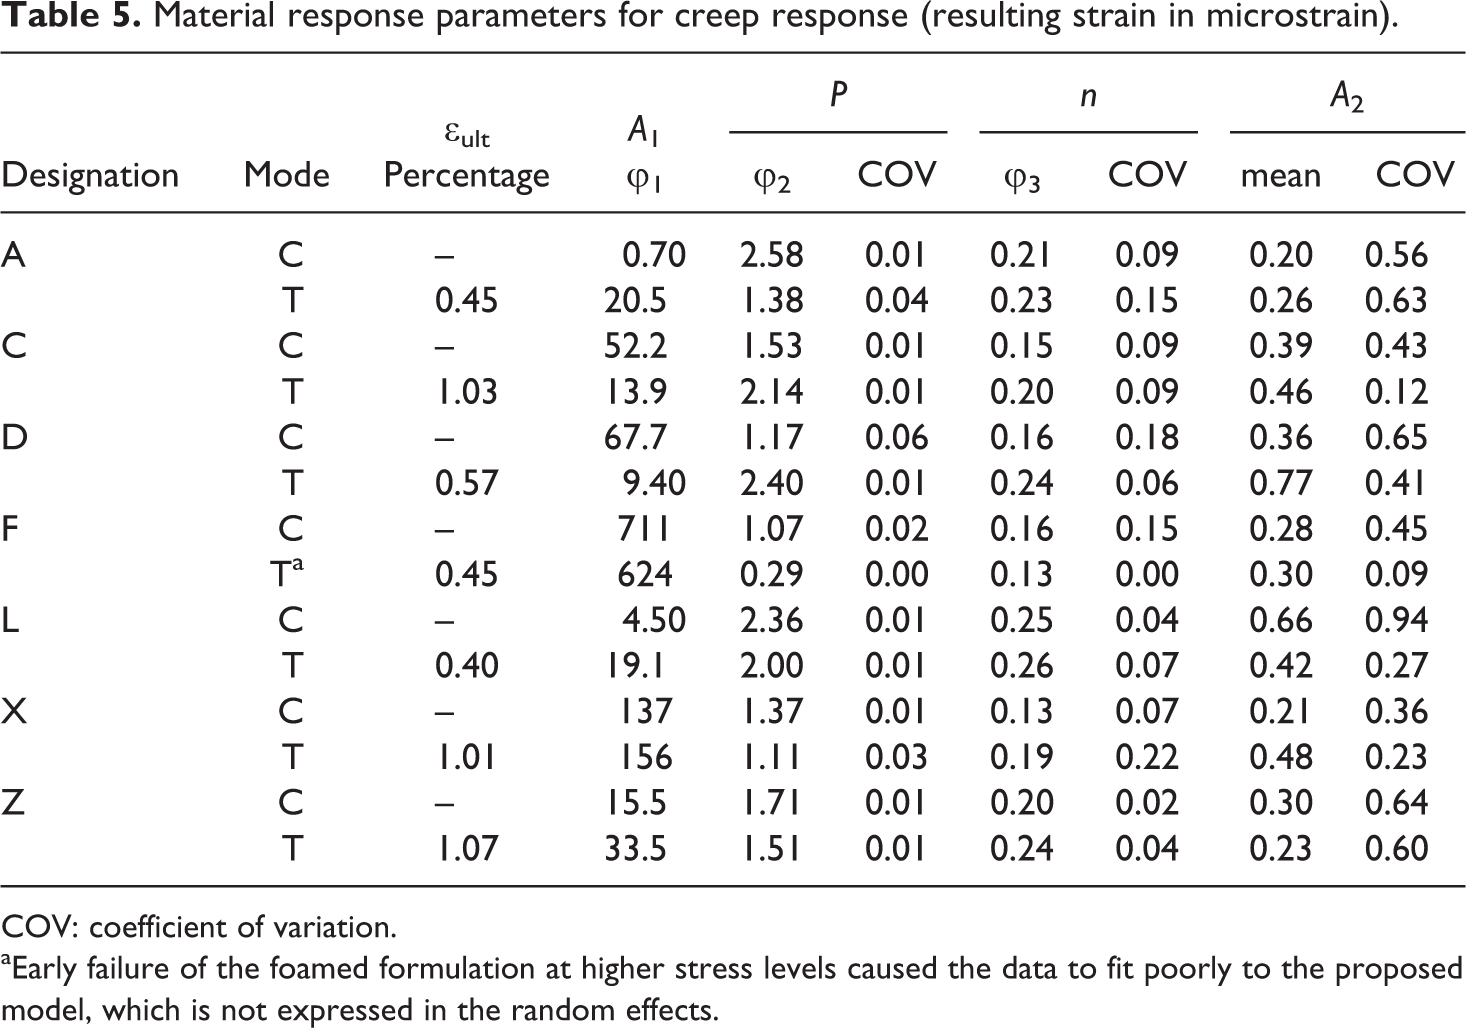
The results of the NLME analysis for the time-dependent responses, using equations (9) to (11), are shown in Table 5. The residual strain from each creep test, δc, was found to be negligible for this data. The ultimate strain values shown were recorded at creep rupture in the specimens loaded to 50% of their ultimate tensile strength. The lower stress level specimens did not fail within the 3 years of testing. The COV values for the transition zone constant, A 2, were determined by dividing the SD by the mean.
In order to determine the necessity of long-term creep testing, the NLME analysis was repeated using the first 90 days of the creep data. All of the time exponent values, n in equation (7), were within ±12% of the 3-year fixed effect value. The average percentage error for all the nonfoamed formulations was 6.8%, which is the same order of magnitude as the COV. 38
Response to monotonically increasing displacement
Results of the short-term monotonic ramp tests for a single formulation can be seen in Figure 5. Eight repeats of each test were conducted. The results of the mixed-effects model described in the previous section (equation (7)) are also shown. The statistical model is shown with only the fixed effects included, that is, the random effects are assumed to be zero. This method effectively describes the material’s predicted “average” response. Figure 6 shows a comparison of the calculated “average” response of all seven formulations using the same methodology. We note that the two modes of each formulation are relatively similar, particularly at loads below 50% of the ultimate tensile strength. The two materials with the highest stiffness are formulations A and Z, which are both polypropylene based. Formulation F is significantly softer than all the other materials. As a foamed material, it is also the only material with a density that is significantly less than 1.0 g/cm3. It can be seen in Table 4 that the initial moduli for the two modes of each material are approximately equal, but Figure 6 shows that at the tensile failure strain, the compression modulus is greater than or equal to its tension counterpart in all seven formulations.
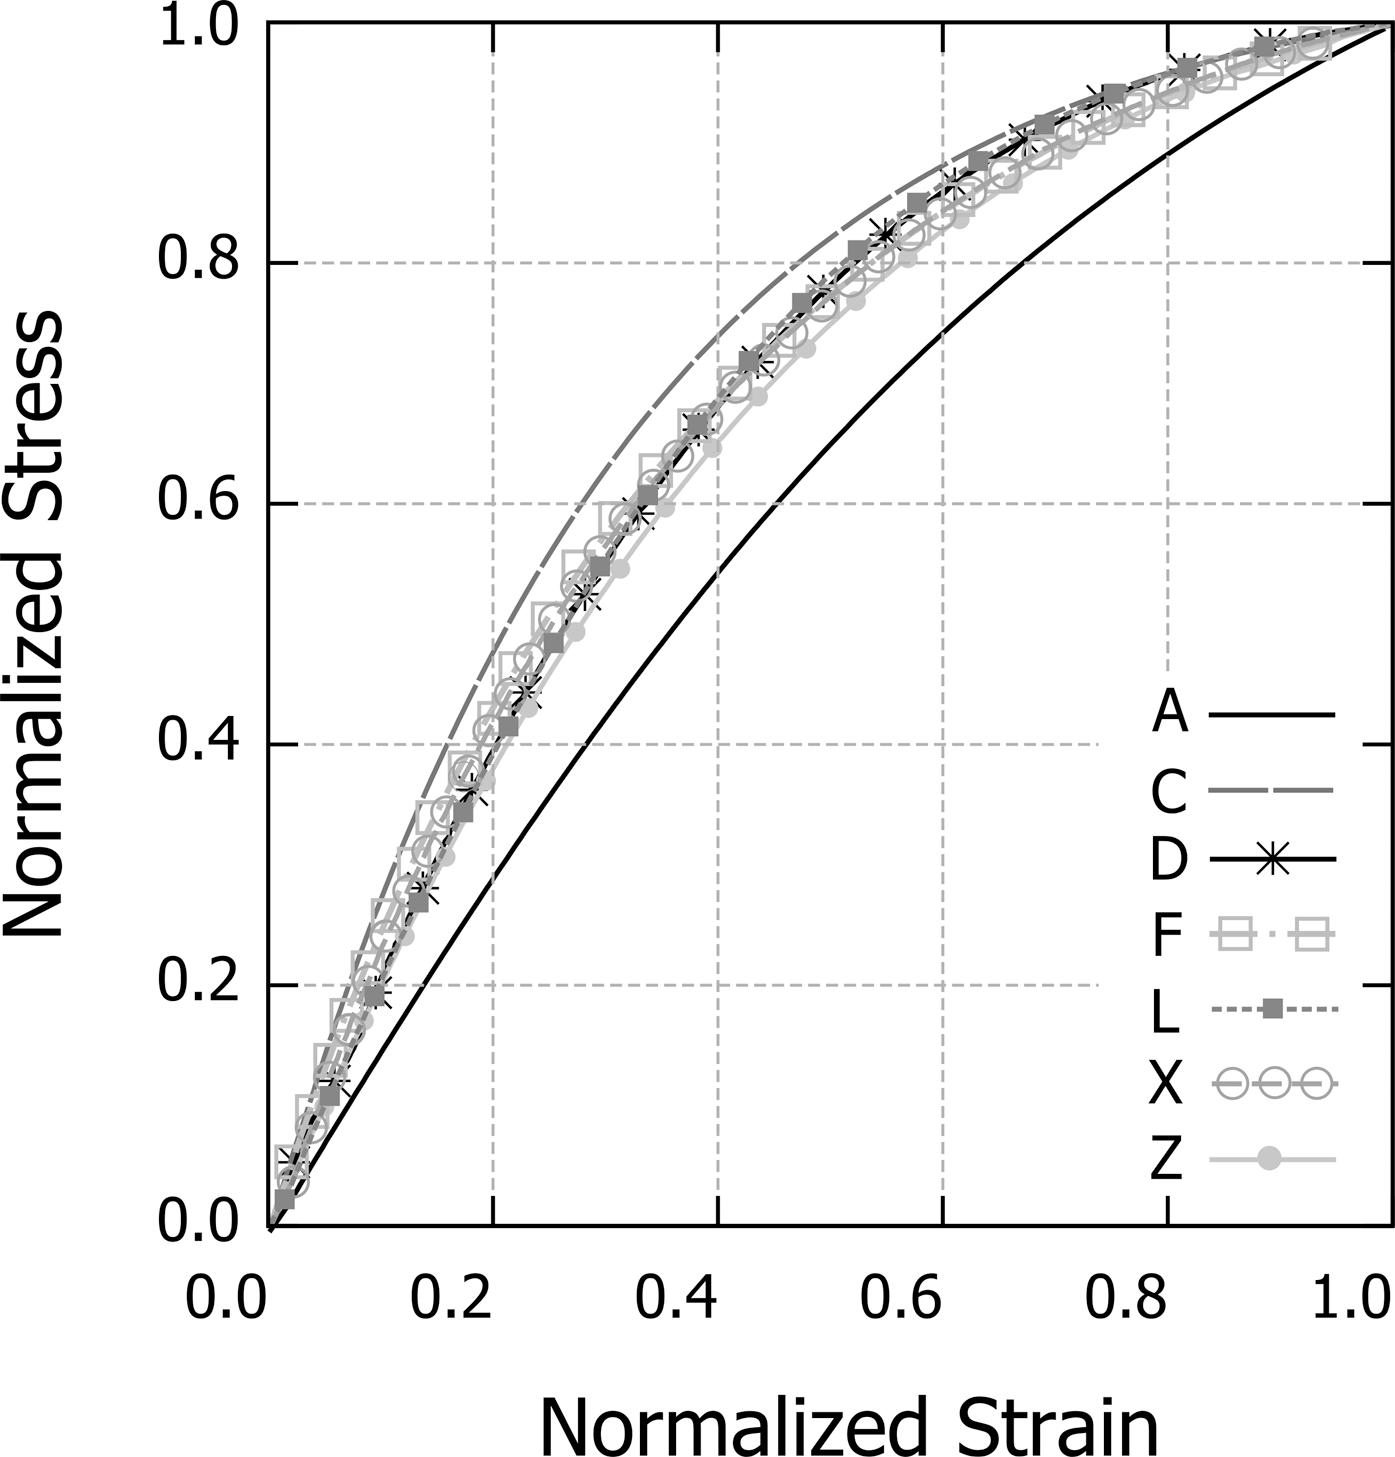
Normalized quasistatic stress–strain response of all seven formulations.
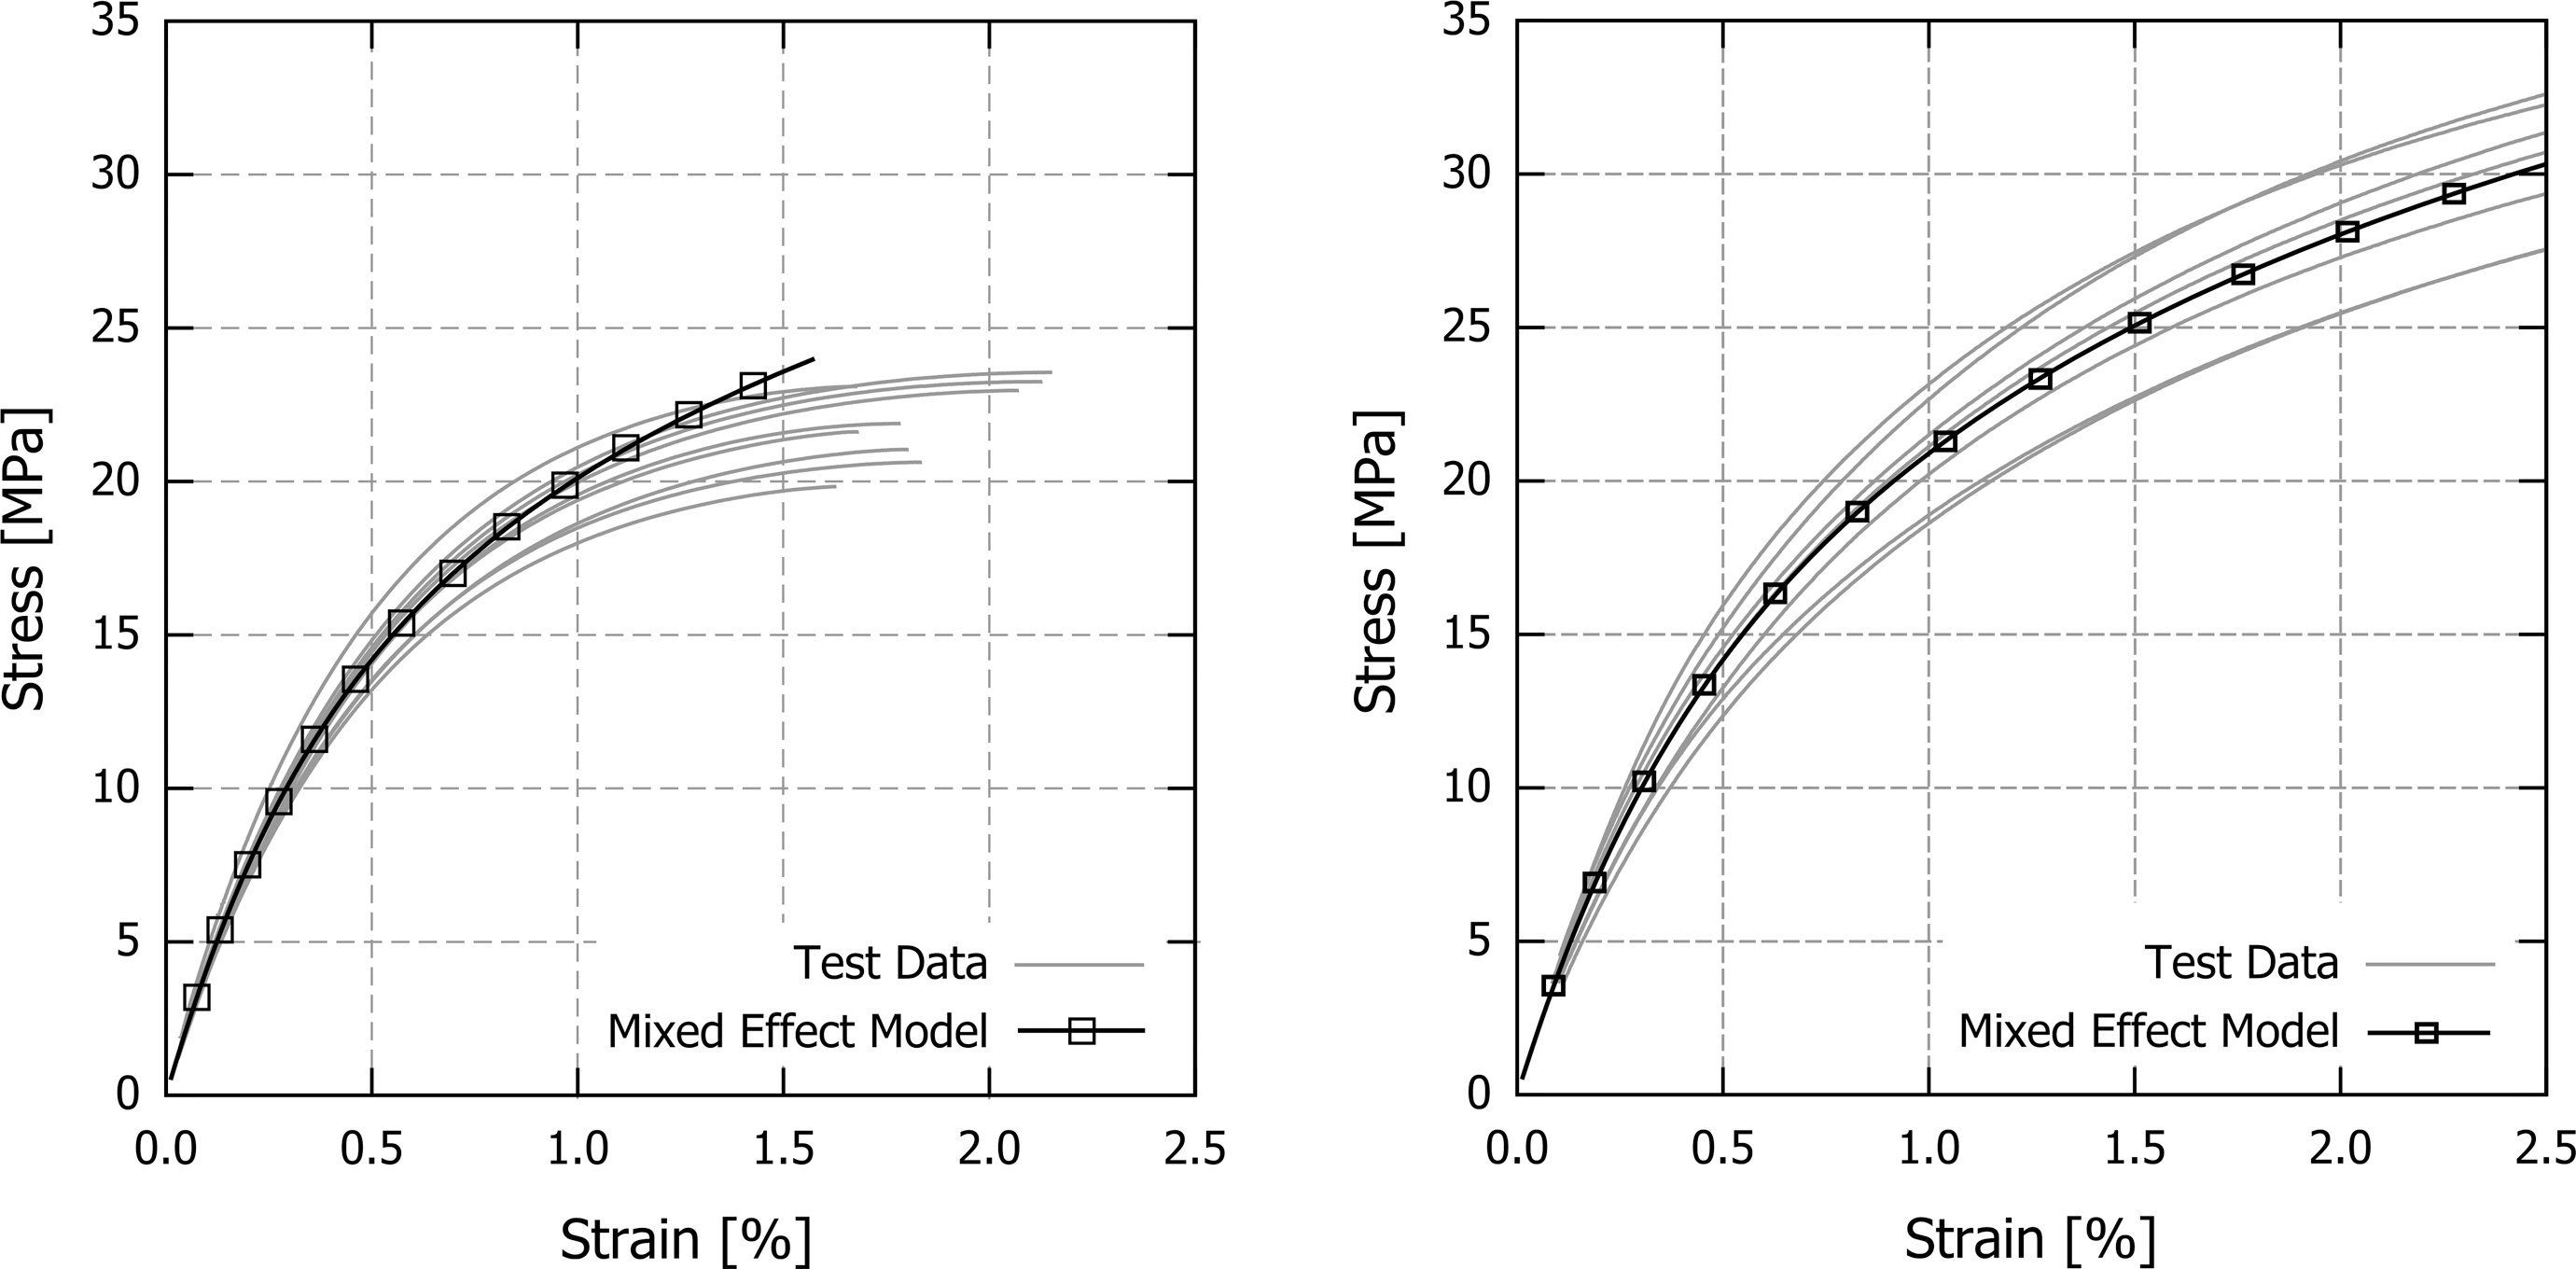
Quasistatic ramp response to (a) tension and (b) compression for formulation C.
Response to sustained loading
The creep response to tension loads at various stresses for formulation C are shown in Figure 7. The numerical model from equation (6) using the fixed effects from the NLME analysis and the average of A 2 for the material constants (neglecting statistical variations) for each stress level are also shown. From the figure, it can be seen that the test data were well described by the creep function. Because the A 2 term of equation (6) is negligible at times greater than 1 h, the figure also demonstrates the adequacy of equations (4) and (5) in this range. It can be seen in Figure 7 that the slope of the strain–time response in log space was relatively constant after about 10 h of creep. As noted, we found that the material constants in equation (7) were essentially unchanged if only 90 days of data were used instead of the full 3 years.
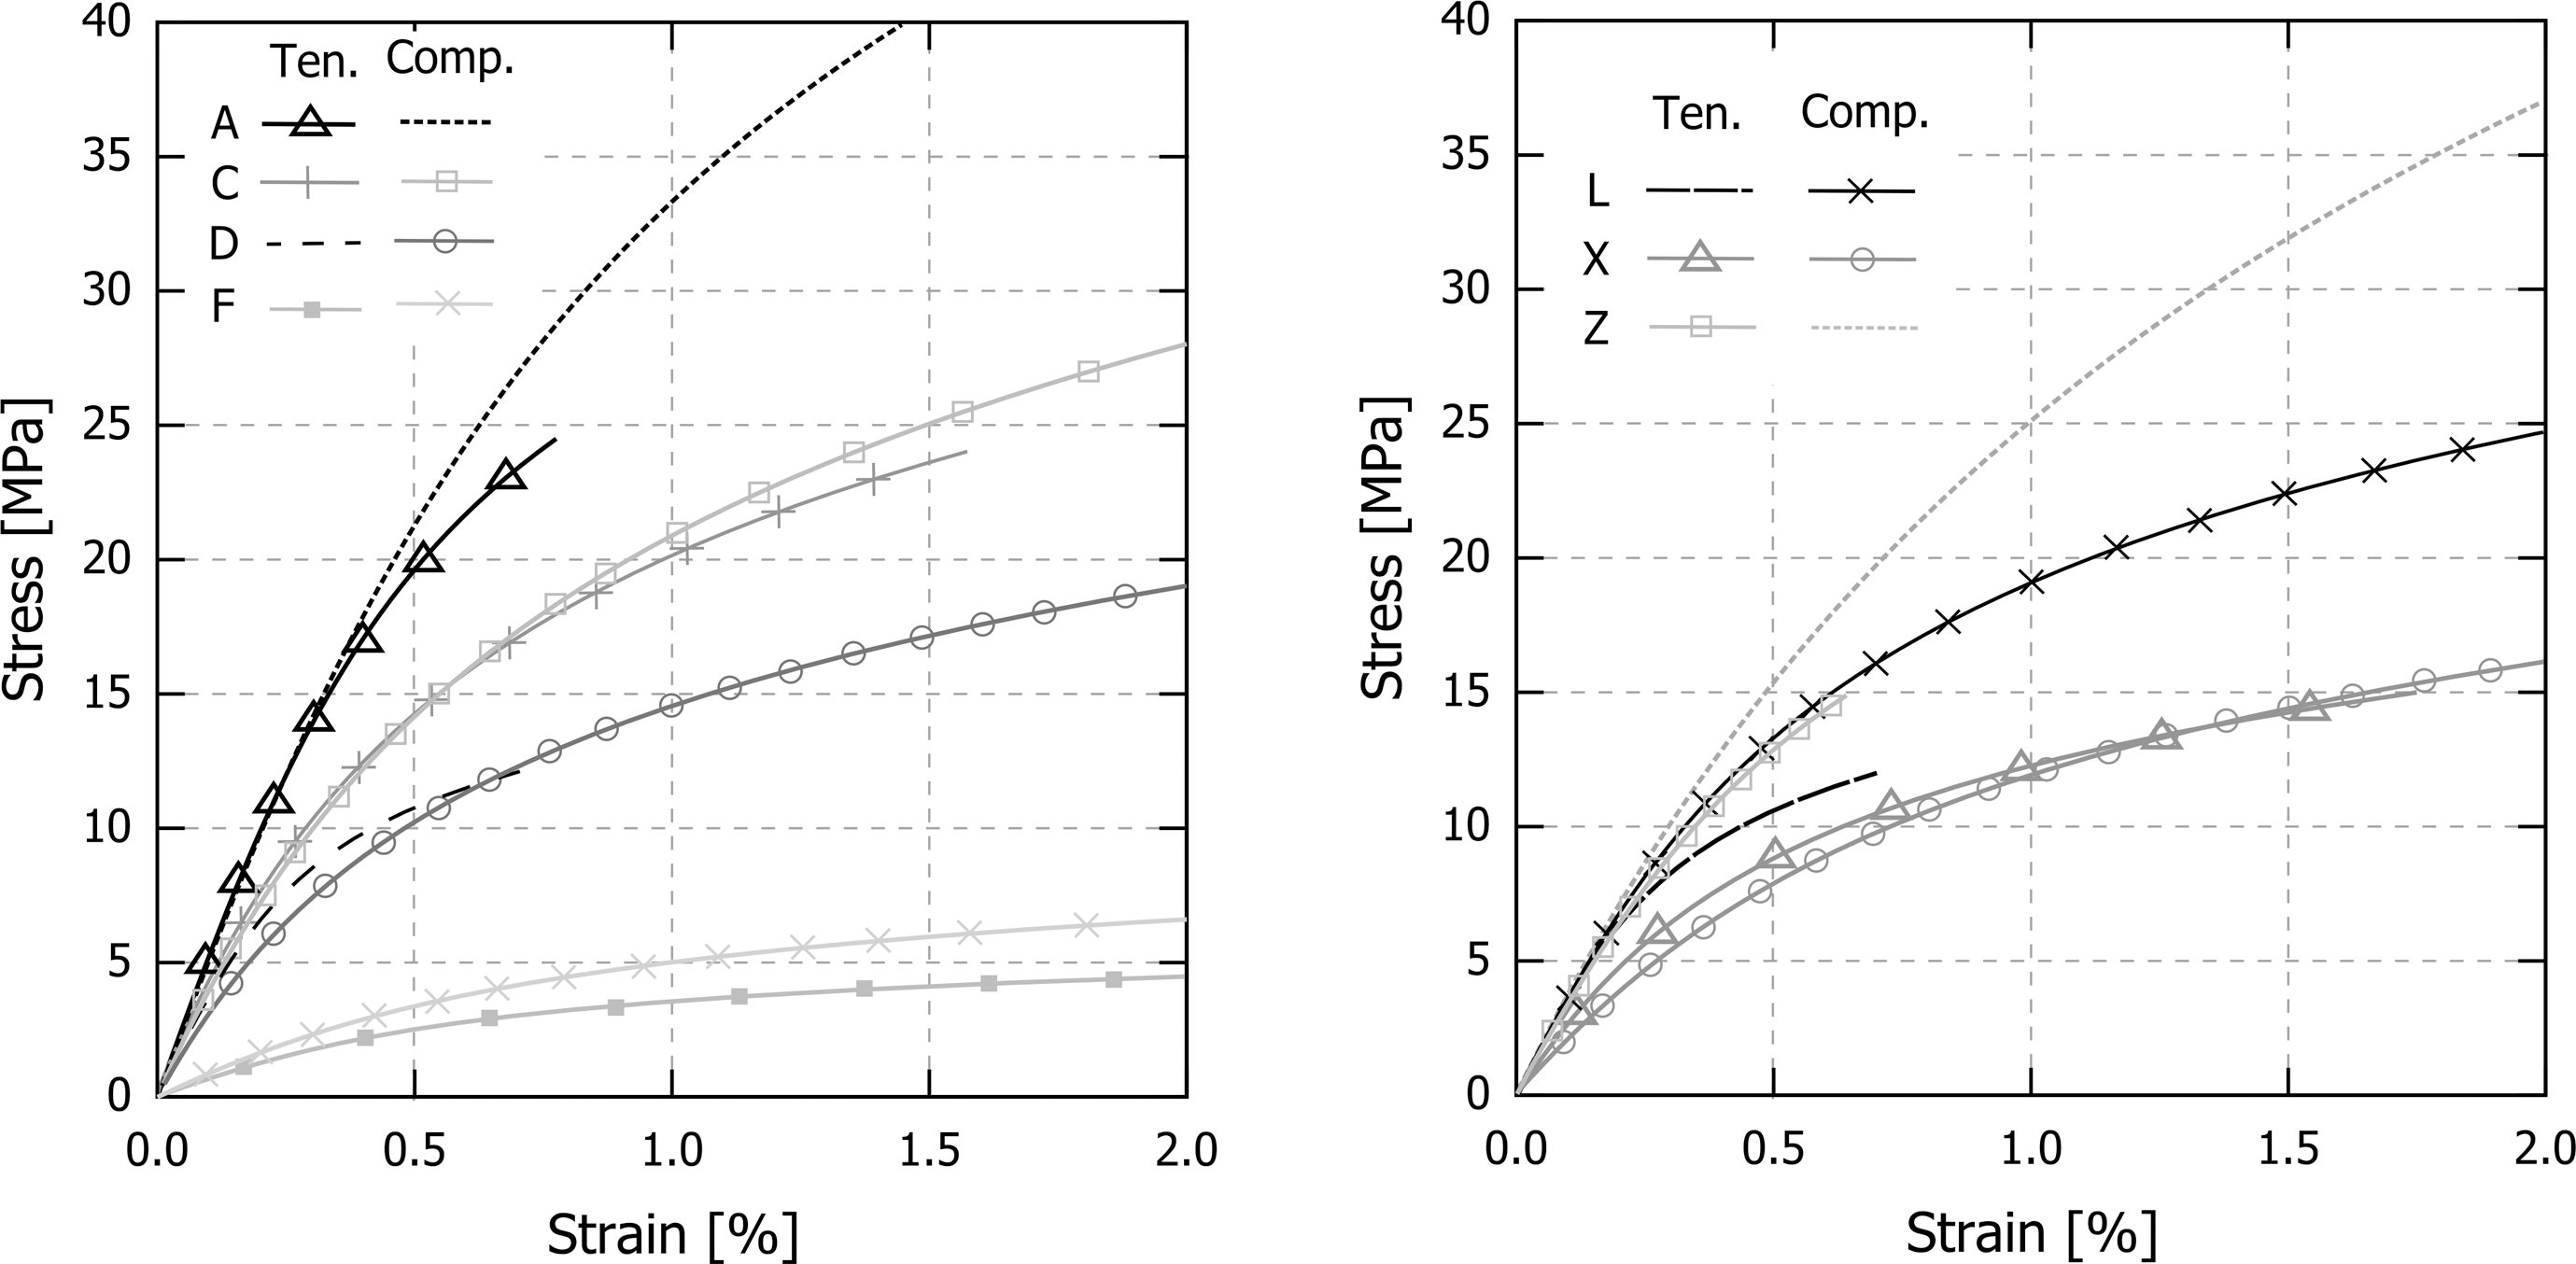
Average quasistatic tension and compression ramp response for (a) formulations A, C, D, and F and (b) formulations L, X, and Z.
Figure 8 shows the recorded data compared with the modeled response for the total time-dependent strain, as determined by equation (7), for four formulations. The remaining formulations are not shown for clarity. These specimens were ramp loaded to 20% of their ultimate tensile strength and then the load was held constant. As before, the figure shows the average of A 2 and fixed effects from the NLME to depict the “average” response.
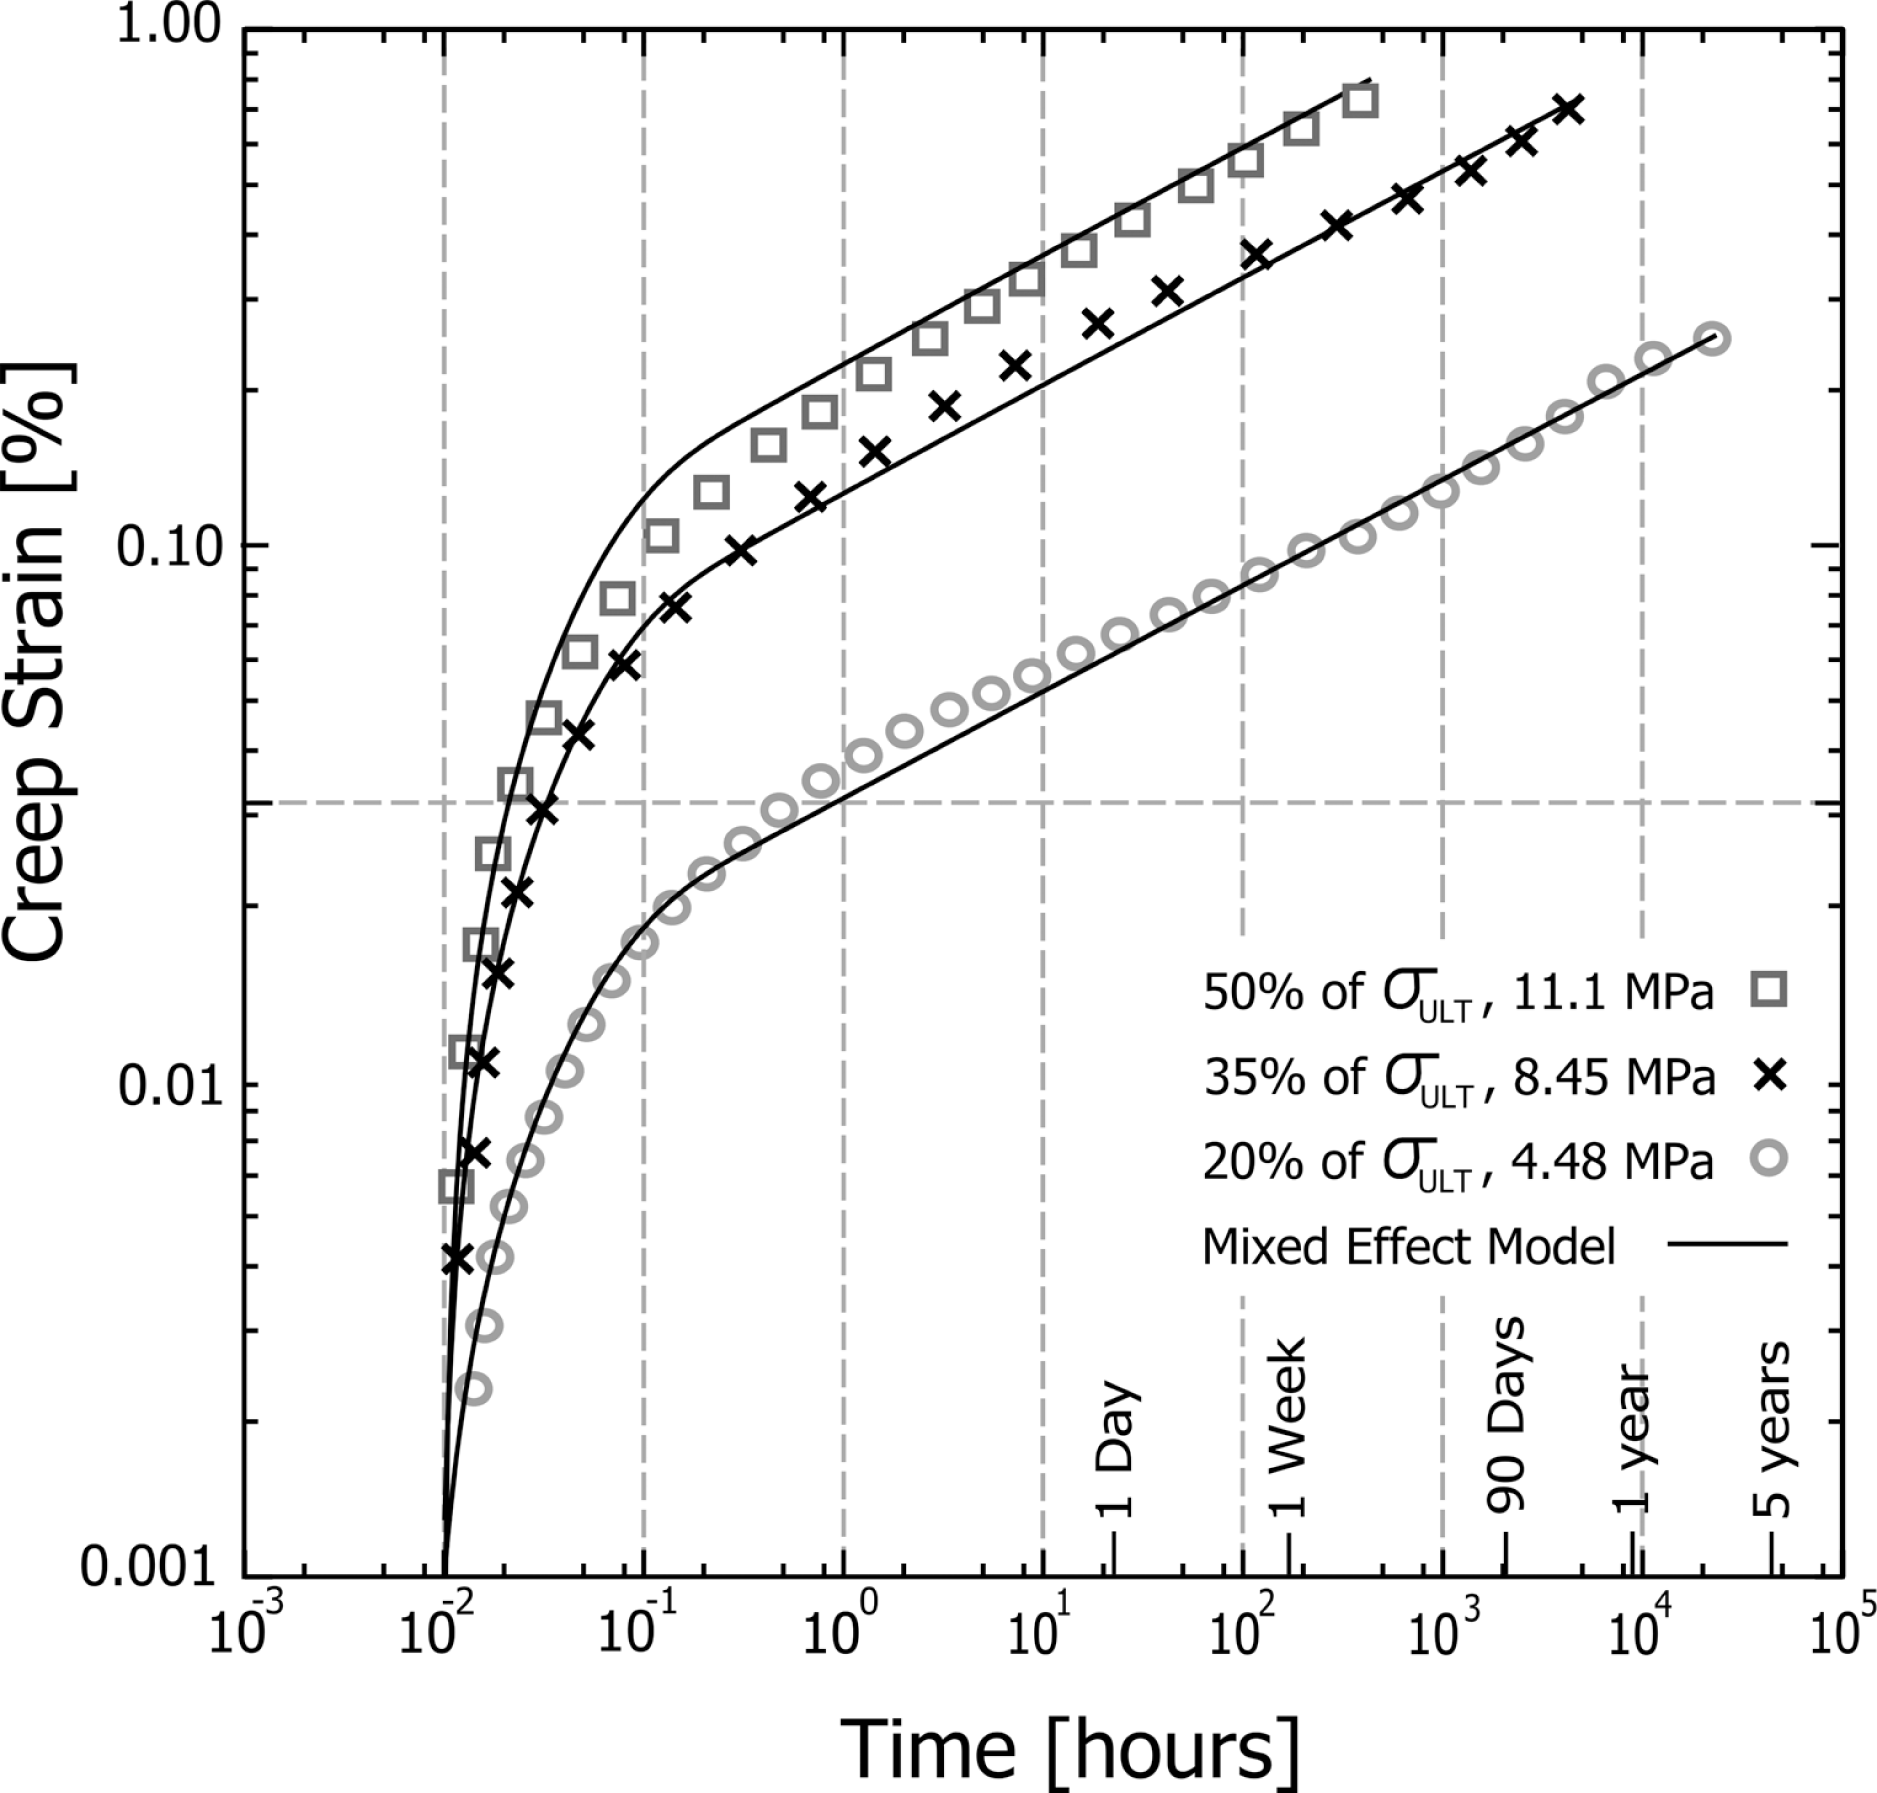
Creep response of formulation C in tension at three stress levels described by the proposed creep model (equation (6)).
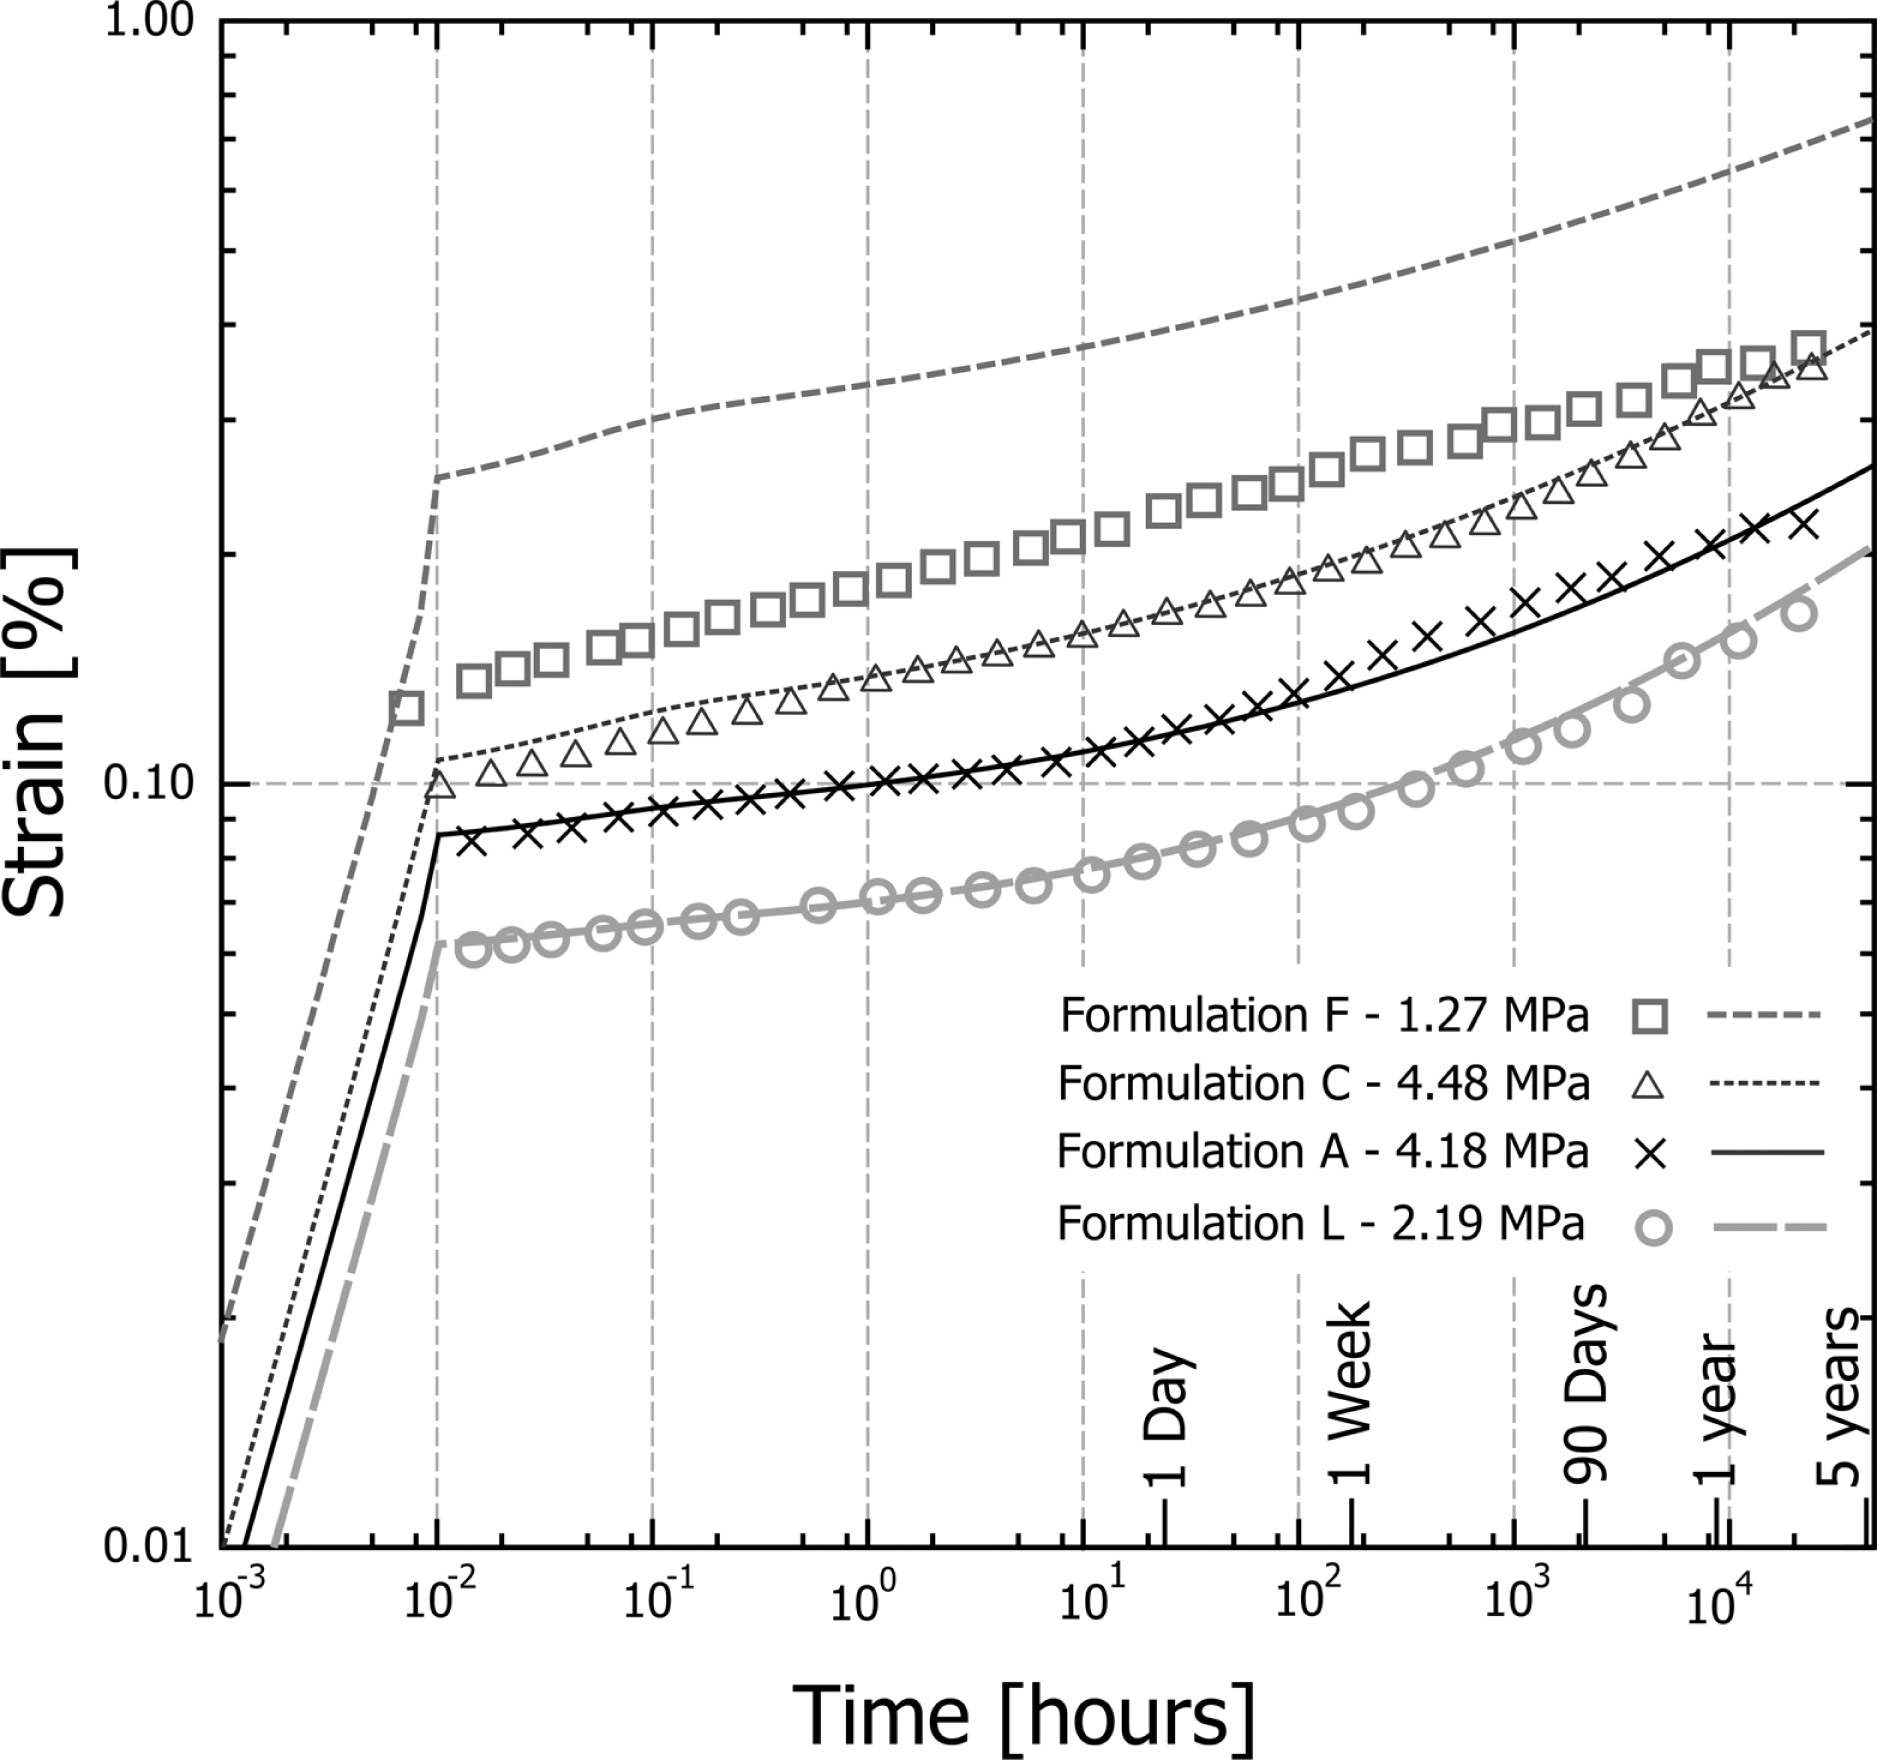
Time-dependent responses of several formulations in tension at 20% of σult and the corresponding model using fixed-effects constants.
Figure 8 shows that the creep response for all formulations is well described by the time-dependent model; however, the initial strain of formulation F is over-predicted. This is not necessarily due to the inaccuracy of the model but due to the large variation in the quasistatic response of this formulation, as can be seen from the parameter COVs in Table 4. The initial strain of the test at the conclusion of loading (t = 0.01) is within the two SDs of the average model value. It is possible that the modeled response for formulation F in Figure 8 accurately represents the average strain of the material, and the two tests shown were conducted on relatively stiff specimens.
Failure strain from applied tension
The strain at the maximum stress for each formulation can be seen in Table 4, and the ultimate strain at rupture during tension creep can be seen in Table 5. Unlike neat polymers, the maximum strains occur at less than 2% across all formulations. With the exception of formulation F, the creep rupture strains were found to occur between 60% and 85% of ultimate quasistatic strain (loaded at 1% per minute). The average of this proportion across all formulations was 68%, with most of the commercial products near 60%. Creep testing at higher stresses revealed that the creep rupture strain was relatively consistent for a particular formulation and independent of the stress applied or time-to-failure. This is illustrated in Figure 9.
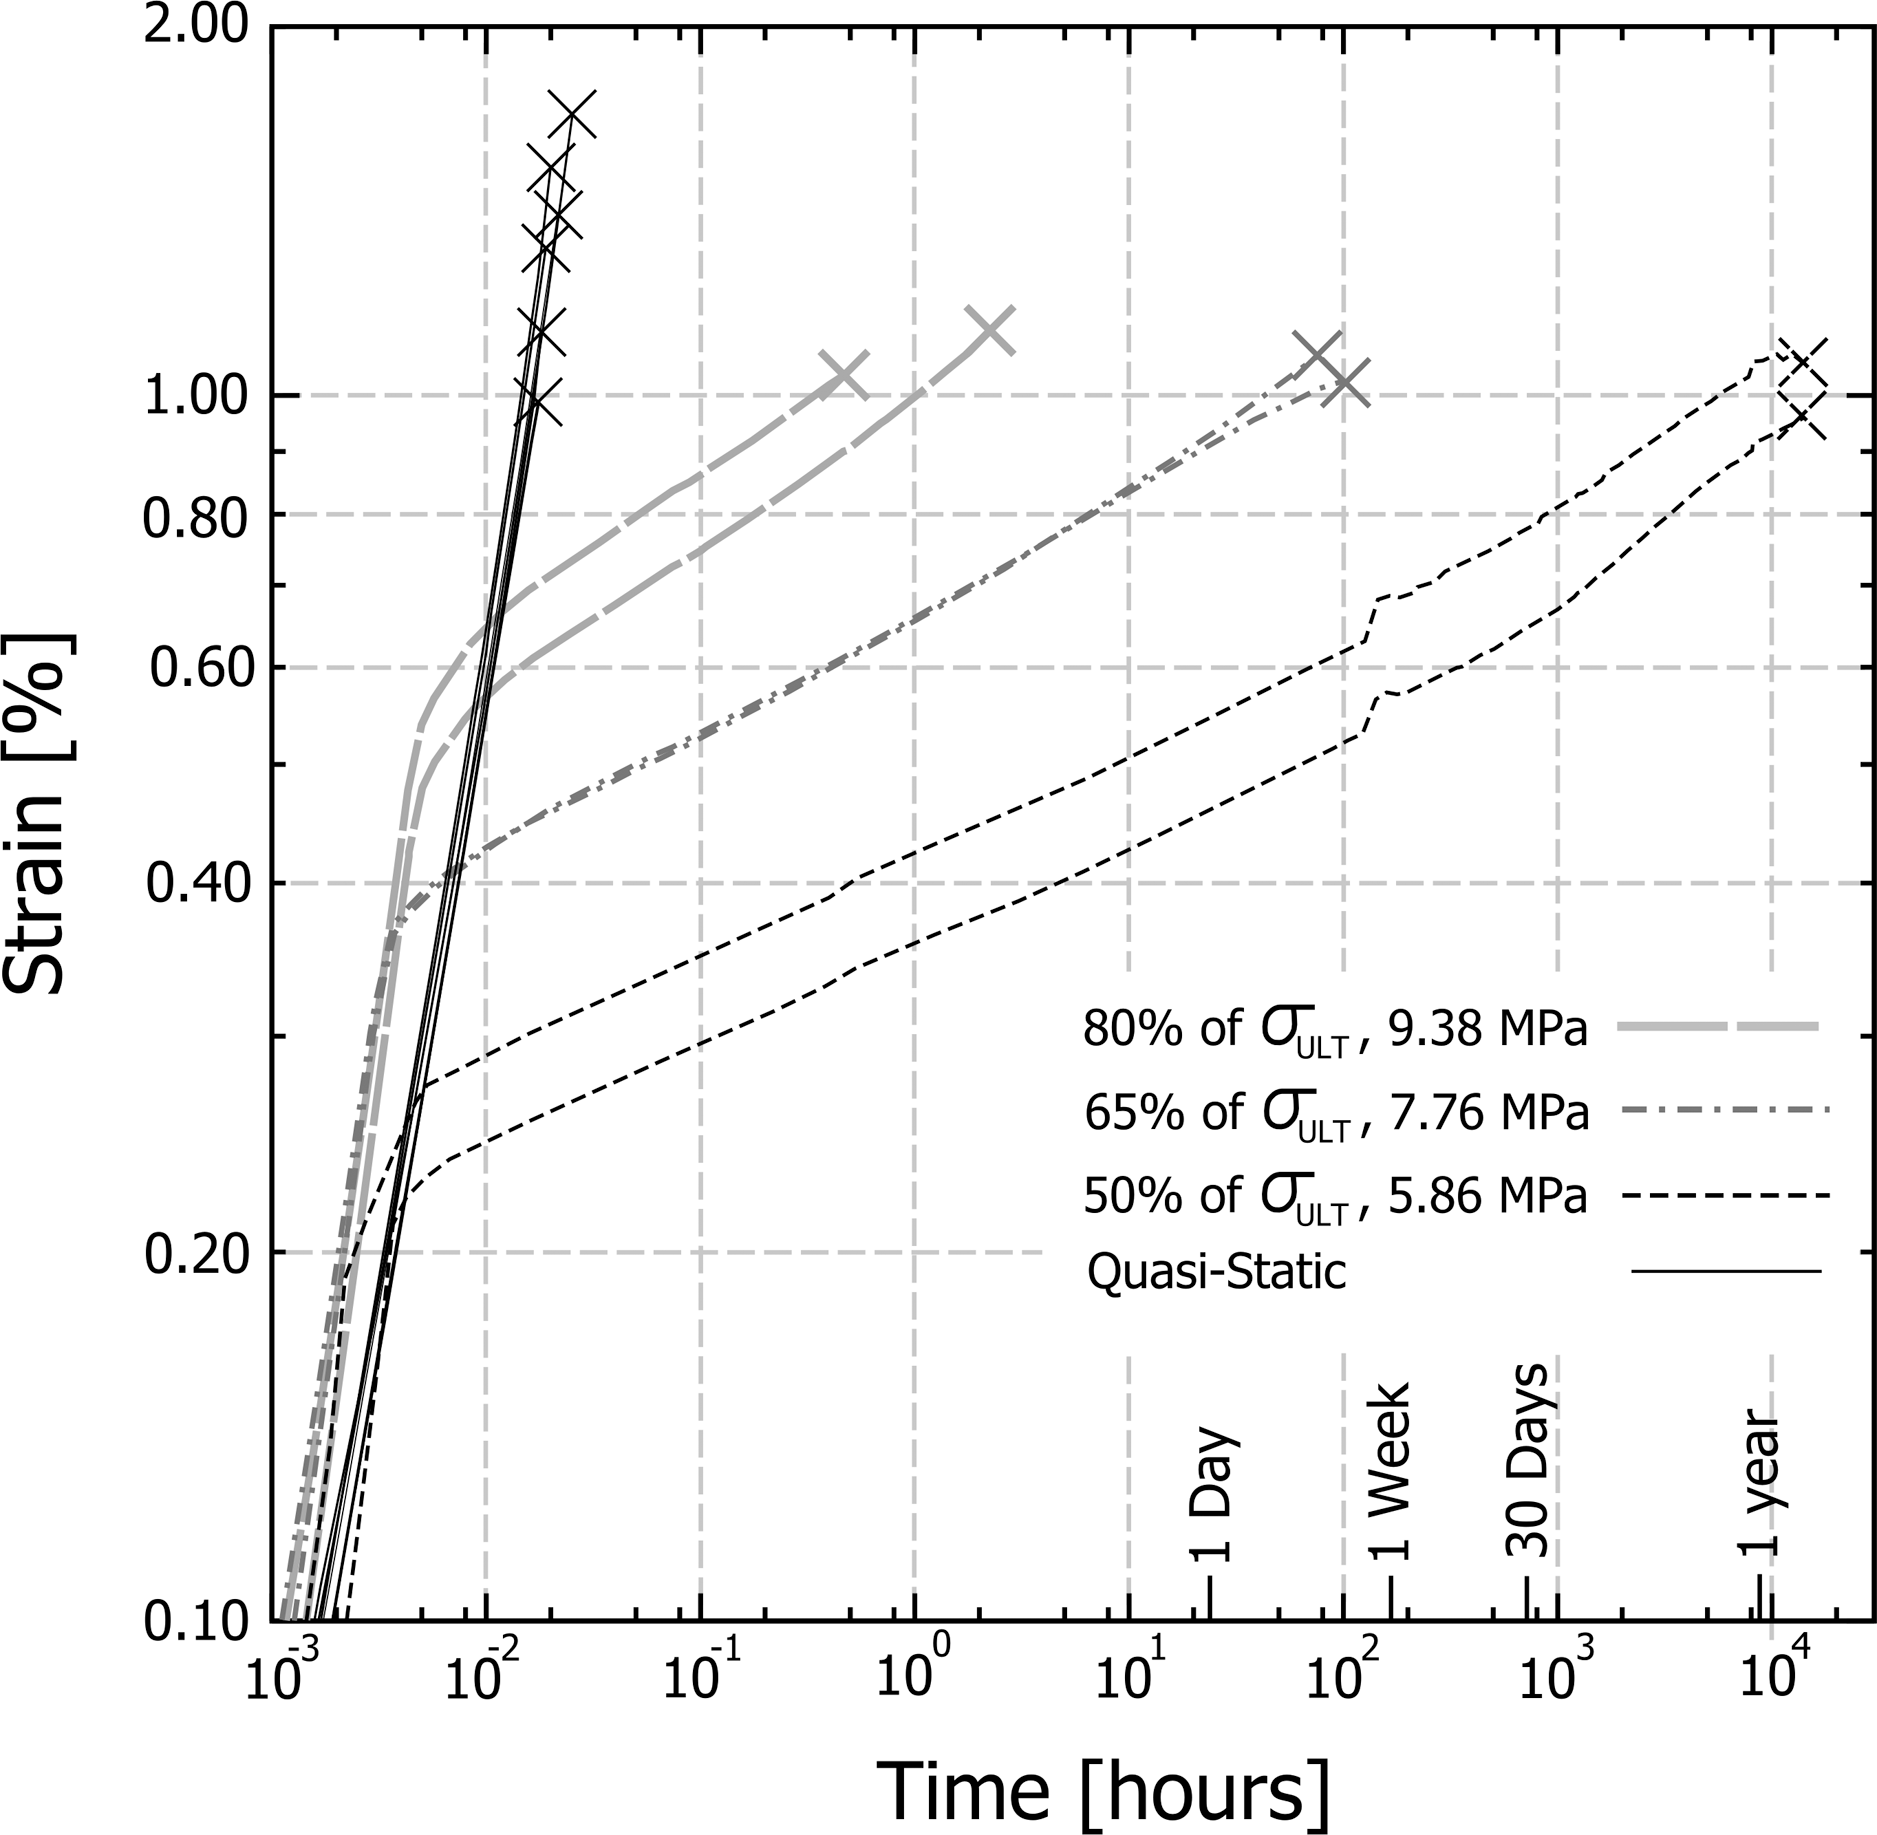
Quasistatic and creep responses to failure of formulation X loaded in tension at multiple stress levels.
Conclusions
The mechanical behaviors of the seven WPC materials in this study were investigated by applying a monotonically increasing displacement (ramp), and a constant applied load (creep) in both tension and compression. The responses were characterized using an exponential and linear sum for the quasi-static ramp response, a power-law for the time-dependent creep response beyond 1 h, and an exponential term for the transition zone in between. The variation of each material from the mathematical models was evaluated using an NLME statistical model.
We have shown that the bimodal mechanical response of WPCs to both quasi-static ramp and time-dependent creep below 50% of the ultimate tensile strength can be described by a mathematical model with seven material constants for each mode. The quasistatic response is defined by three parameters for each mode, which are different for each material. The ratios between the parameters, however, are similar across most formulations, indicating that the responses have a similar shape with different magnitudes. The tension and compression behaviors of each material differ, but the difference is not significant at stress levels below 50% of the ultimate tensile strength. We have also shown that the power-law time exponent does not vary with stress or time and can be determined with only 90 days of data, minimizing the time necessary to characterize the creep behavior of a WPC material.
Consistent failure strains at multiple stress levels during creep testing suggests that tensile failure of the WPC materials was caused by a strain limit instead of an ultimate stress. The materials’ tension failure occurred between 0.7% and 2.2% with the average failure occurring around 1.0% strain. Creep rupture occurred between 60% and 80% of the average quasistatic ultimate tensile strain when loaded at 1% per minute. The strain-dependent failure and power-law behavior offers a potential tool for predicting the time and stress of long-term creep rupture. Once a material’s behavior has been characterized with relatively short-term creep tests (less than 90 days), the long-term strain response and rupture time can be predicted at the imposed stress level.
With the exception of formulation F, the variation of the material behaviors was relatively low, which allowed the strength and stiffness to be reliably evaluated in standardized tests using established statistical tools. We have observed that some of the characteristic behaviors did not apply to formulation F, a foamed High Density Polyethylene. Without more information, it must be assumed that these conclusions are limited to WPCs with a strength, stiffness, and density greater than those of formulation F.
Footnotes
Funding
This work was supported by the National Research Initiative of the USDA Cooperative State Research, Education and Extension Service, grant number 2005-35103-15230.