
Abstract
The effect of temperature (T = 22°C, 30°C and 35°C) and relative humidity (RH = 34% and 66%) on mechanical behavior of natural fiber reinforced bio-based matrix composites subjected to tensile loading was investigated. Three composites were studied (a) polylactic acid (PLA) composite with 10% weight fraction of flax fibers; (b) PLA composite containing 5% viscose fibers (filaments of regenerated cellulose); (c) lignin-based composite with 30% of flax fibers. Elastic modulus, the nonlinear tensile stress–strain curves and failure were analyzed showing that all materials are temperature sensitive. The nonlinearity was analyzed studying modulus degradation as well as development of viscoelastic and viscoplastic strains. The modulus reduction in PLA-based composites starts after reaching the stress maximum and is not significant, whereas the modulus reduction in lignin-based composites starts before the maximum and it can reach 50%. With increasing RH these effects are slightly larger. The time-dependent phenomena were analyzed in short-term creep and strain recovery tests demonstrating significantly higher viscoplastic strain in lignin composites. Both viscoelastic and viscoplastic strains are larger at higher RH.
Introduction
In last years, competitive bio-based materials have been developed to reduce the dependence on nonrenewable oil-based plastics and composites. The data of market analysis 1,2 show that 50% of the total worldwide capacity of bio-based thermoplastics is for unmodified starch, whereas the rest of the market is split between polylactic acid (PLA), polycaprolactone (PCL), poly-3-hydroxybutyrate (PHB), and poly(3-hydroxybutyrate co-3-hydroxyvalerate) (PHBV). PLA is a well-known biodegradable, aliphatic polymer, which can be obtained from renewable resources, such as corn, sugar, cane, by fermentation of sugar (in various forms) and is mainly used in medical applications. Nowadays, PLA is also entering the packaging market due to its good barrier properties.
A relatively new actor in the composites world is lignin, which is one of the most common organic molecules on Earth covering 25–30% of the nonfossil organic carbon in various biomasses. Worldwide, chemical pulp mills generate approximately 50 million tons of lignin every year as a by-product of the pulp and paper industrial processes.
Bio-based polymers usually have inferior properties in comparison with the synthetic competitors and are sensitive to moisture and temperature changes. Reinforcement of these polymers with natural fibers (NF), such as wood or agrofibers, is a convenient choice for reaching acceptable performance in terms of mechanical properties. The commonly used NF are flax, hemp, kenaf, jute, sisal, ramie, and coir. The stiffness of bast fibers in longitudinal direction is comparable to that of glass fibers (for example flax fibers have stiffness 50–100 GPa vs. 72 GPa for E-glass fibers 3 –6 ). The direct benefits of use of NF in composites are light weight, reduced wear on the processing equipment, and lower impact on the environment. However, these materials are inherently hydrophilic, and as they are of natural origin, their mechanical properties are subjected to large variation.
Generally speaking, composites based on thermoplastic biopolymers (lignin, starch, and PLA) reinforced with NF are today established as engineering materials used in various industrial branches. 7,8 Natural additives are used to improve the properties of bio-based composites with regard to processing and performance. For example, cellulose-regenerated fibers increase impact strength without noticeable reduction in tensile properties of PLA composites. 9
Common processing methods and products of NF composites include injection molding of packaging material, extrusion of beams for decking, and compression molding of panels for automotive use. Other methods, such as rotational molding, have also been considered, but so far not widely exploited. The advantage of the good mechanical properties of the NF is perhaps best taken of in compression-molded products. However, this requires additional fiber processing to produce high-quality yarns.
Basic mechanical behavior of NF composites (elastic modulus, strength, strain to failure, impact resistance, etc.) has been studied by numerous researchers; an overview of some results can be found in reference 10–14. However, rather limited number of articles deal with inelastic and time-dependent properties, for example, study on flax/polypropylene (PP) and flax/starch composites, 15–17 and work on pulp fiber/formaldehyde. 18
The above referred sources show that in NF composites the mechanical properties of fibers and the matrix are inherently nonlinear and the composite exhibits complex time-dependent stress–strain behavior with loading rate effects and hysteresis loops. The phenomena dominating mechanical behavior include evolving microdamage (cracks, debonds, etc.) resulting in degradation of elastic properties and development of irreversible strains. Therefore, models for these materials should account for viscoelasticy and viscoplasticity as well as microdamage. Although this study does not deal with modeling, it is aimed at identification of mechanisms that later on should be accounted for in model.
In this article, a systematic investigation and comparison of mechanical behavior of three flax fiber reinforced composites are presented. The matrix for two of these composites is PLA. One composite is with flax fibers and one with viscose fibers (VFs) aimed to improve the impact strength. The third composite has lignin matrix.
Detailed analysis of the above phenomena and explanation of the similarities and differences in the general tensile behavior presented here will be published separately, see for example reference 19 for material model development of flax/PLA composite.
Materials and experiments
Materials
Thermoplastic lignin and PLA (Hycail HM 1011) were used in this study as matrices. The PLA has a glass transition temperature of 62°C, a melt temperature of 148°C, and a melt flow index of 8.94 g/10 min. Loose untreated 1-mm long flax fibers supplied by Ekotex Kotonia and 2-mm long VFs by Cordenka 700 Super 3 (manmade fiber, made of regenerated cellulose extruded from a solution of viscose) were used to reinforce the matrix. List of studied composites with specific details regarding their main constituents is given in Table 1.
Composites used in experiments.
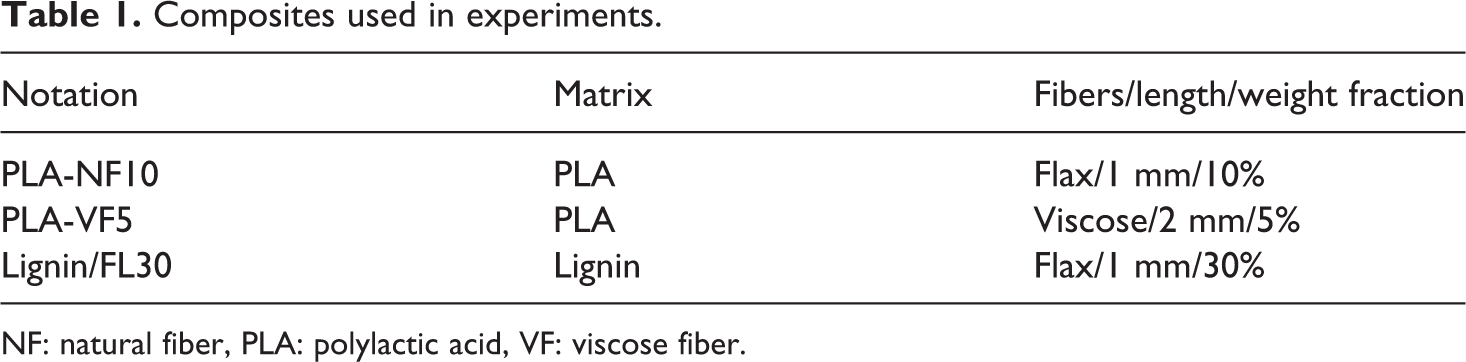
NF: natural fiber, PLA: polylactic acid, VF: viscose fiber.
In Table 1, fiber weight fractions are given. To determine fiber volume fraction, which is the most important parameter in micromechanical theoretical analysis, the densities of constituents have to be used and composite density has to be calculated using standard micromechanics expressions. For example, PLA density is ρPLA = 1.25 g/cm3, 20 lignin density ρLig = 1.4 g/cm3, 21 flax fiber density is ρf = 1.55 g/cm3, 3 and VF density is ρVF = 1.55 g/cm3. 21
Pelletizing, compounding, and injection molding
Samples were received from Tecnaro GmbH (Germany). According to supplier the main processing steps are as described below.
After mixing the raw materials: matrix (lignin, PLA), fibers, processing aids, flame retardants, and VF; the next step for lignin composites was direct pelletizing without heating to produce granules. For PLA composites, compounding of PLA with flax fibers was done in an extruder where the components were introduced via feeder. Constituents are heated up above the melting point of PLA in extruder and homogenized by screws. The extruder had a diameter of 24 mm and 8 controlled temperature zones which ranged from 150°C (next to the feeding segment) to 190°C (die adaptor). The flow rate for the compounding step was 5 kg/h with a screw speed maintained at 500 rpm. The output is continuous strand which is cooled in a water bath and cut in a granulator.
Granules were processed in an injection molding machine in order to produce dog-bone specimens. The specimen thickness was about 3.8–3.9 mm and width in working zone was 10.0–10.1 mm (length of working zone ≈70 mm). Total length (together with clamping part) of specimen was 150 mm and grip separation distance was 100 mm.
Experiments
Specimen conditioning. Specimens were kept in desiccators at fixed relative humidity (RH) for 2–3 weeks before testing and their weight was regularly measured in order to ensure saturation of moisture uptake. Two RH values of 34% and 66%were used. Since the RH was different during testing and conditioning, special care was taken to stabilize the moisture content in specimens during the test. Specimens were covered (wrapped in plastic) when necessary to prevent diffusion. In some cases humidifier was used to have the testing conditions similar as during conditioning.
Tensile tests
Tensile tests were performed on Instron 3366 machine equipped with 10 kN load cell, pneumatic grips, and extensometer with gauge length of 50 mm (Instron 2630-111). In all quasistatic tensile tests, the speed of tensile machine’s cross-head was 5 mm/min which roughly corresponds to strain rate of 5%/min. Tensile tests were performed at three different temperatures (T = 22°C, 30°C and 35°C).
Stress–strain curves were obtained in monotonic tensile loading until failure. In many cases, the stress first reached the maximum, whereas the failure occurred at higher strain but at lower stress. Therefore, the presented data include (a) loading curves; (b) maximum stress σm and corresponding strain ∊m (called ‘strain at maximum stress’); (c) strain and stress at failure, σfail and ∊fail. In some cases when the applied strain exceeded 10%, the test was stopped before the sample failure.
The elastic modulus was determined in a loading–unloading cycle, with the maximum strain value slightly above 0.2%, expecting that no damage and other irreversible phenomena will develop at these strains. The elastic modulus was defined by the slope of the stress–strain curve in the strain region 0.05–0.2%. The loading and unloading curves both being rather linear have slightly different slopes and, hence, two different values of the modulus may be determined. In the presented data the difference is small and the value obtained from loading curve is used to represent the elastic modulus.
Usually the slope of the unloading curve is preferred due to an argument that during unloading irreversible phenomena (damage) would not develop and thus the unloading is ‘more elastic’ than the loading. However, for time-dependent materials this reasoning does not hold: often the slope of unloading curve is even higher than for loading which definitely cannot be a result of increased elastic modulus. The change in slopes due to viscoelasticity can be as big (or even more significant) as due to damage and is not easy to account for. For example, if the specimen would be loaded to slightly higher strain which is still below the damage initiation threshold (0.25% instead of 0.2%), the unloading modulus determined in the same region as before, would be lower.
Tensile creep tests were performed using a creep rig with dead weights. In Figure 1, the picture on the top represents the load application sequence: creep load is applied in steps and in step k + 1 stress is applied instantly at t k and kept constant for time interval t k+1 − t k. The picture on the bottom (Figure 1) shows creep strain during loading interval and also strain recovery after load removal. The duration of strain recovery interval was at least 5 times longer than the loading interval. Creep strains (measured using extensometer) were recorded during the loading and also during the following interval of strain recovery after load removal.
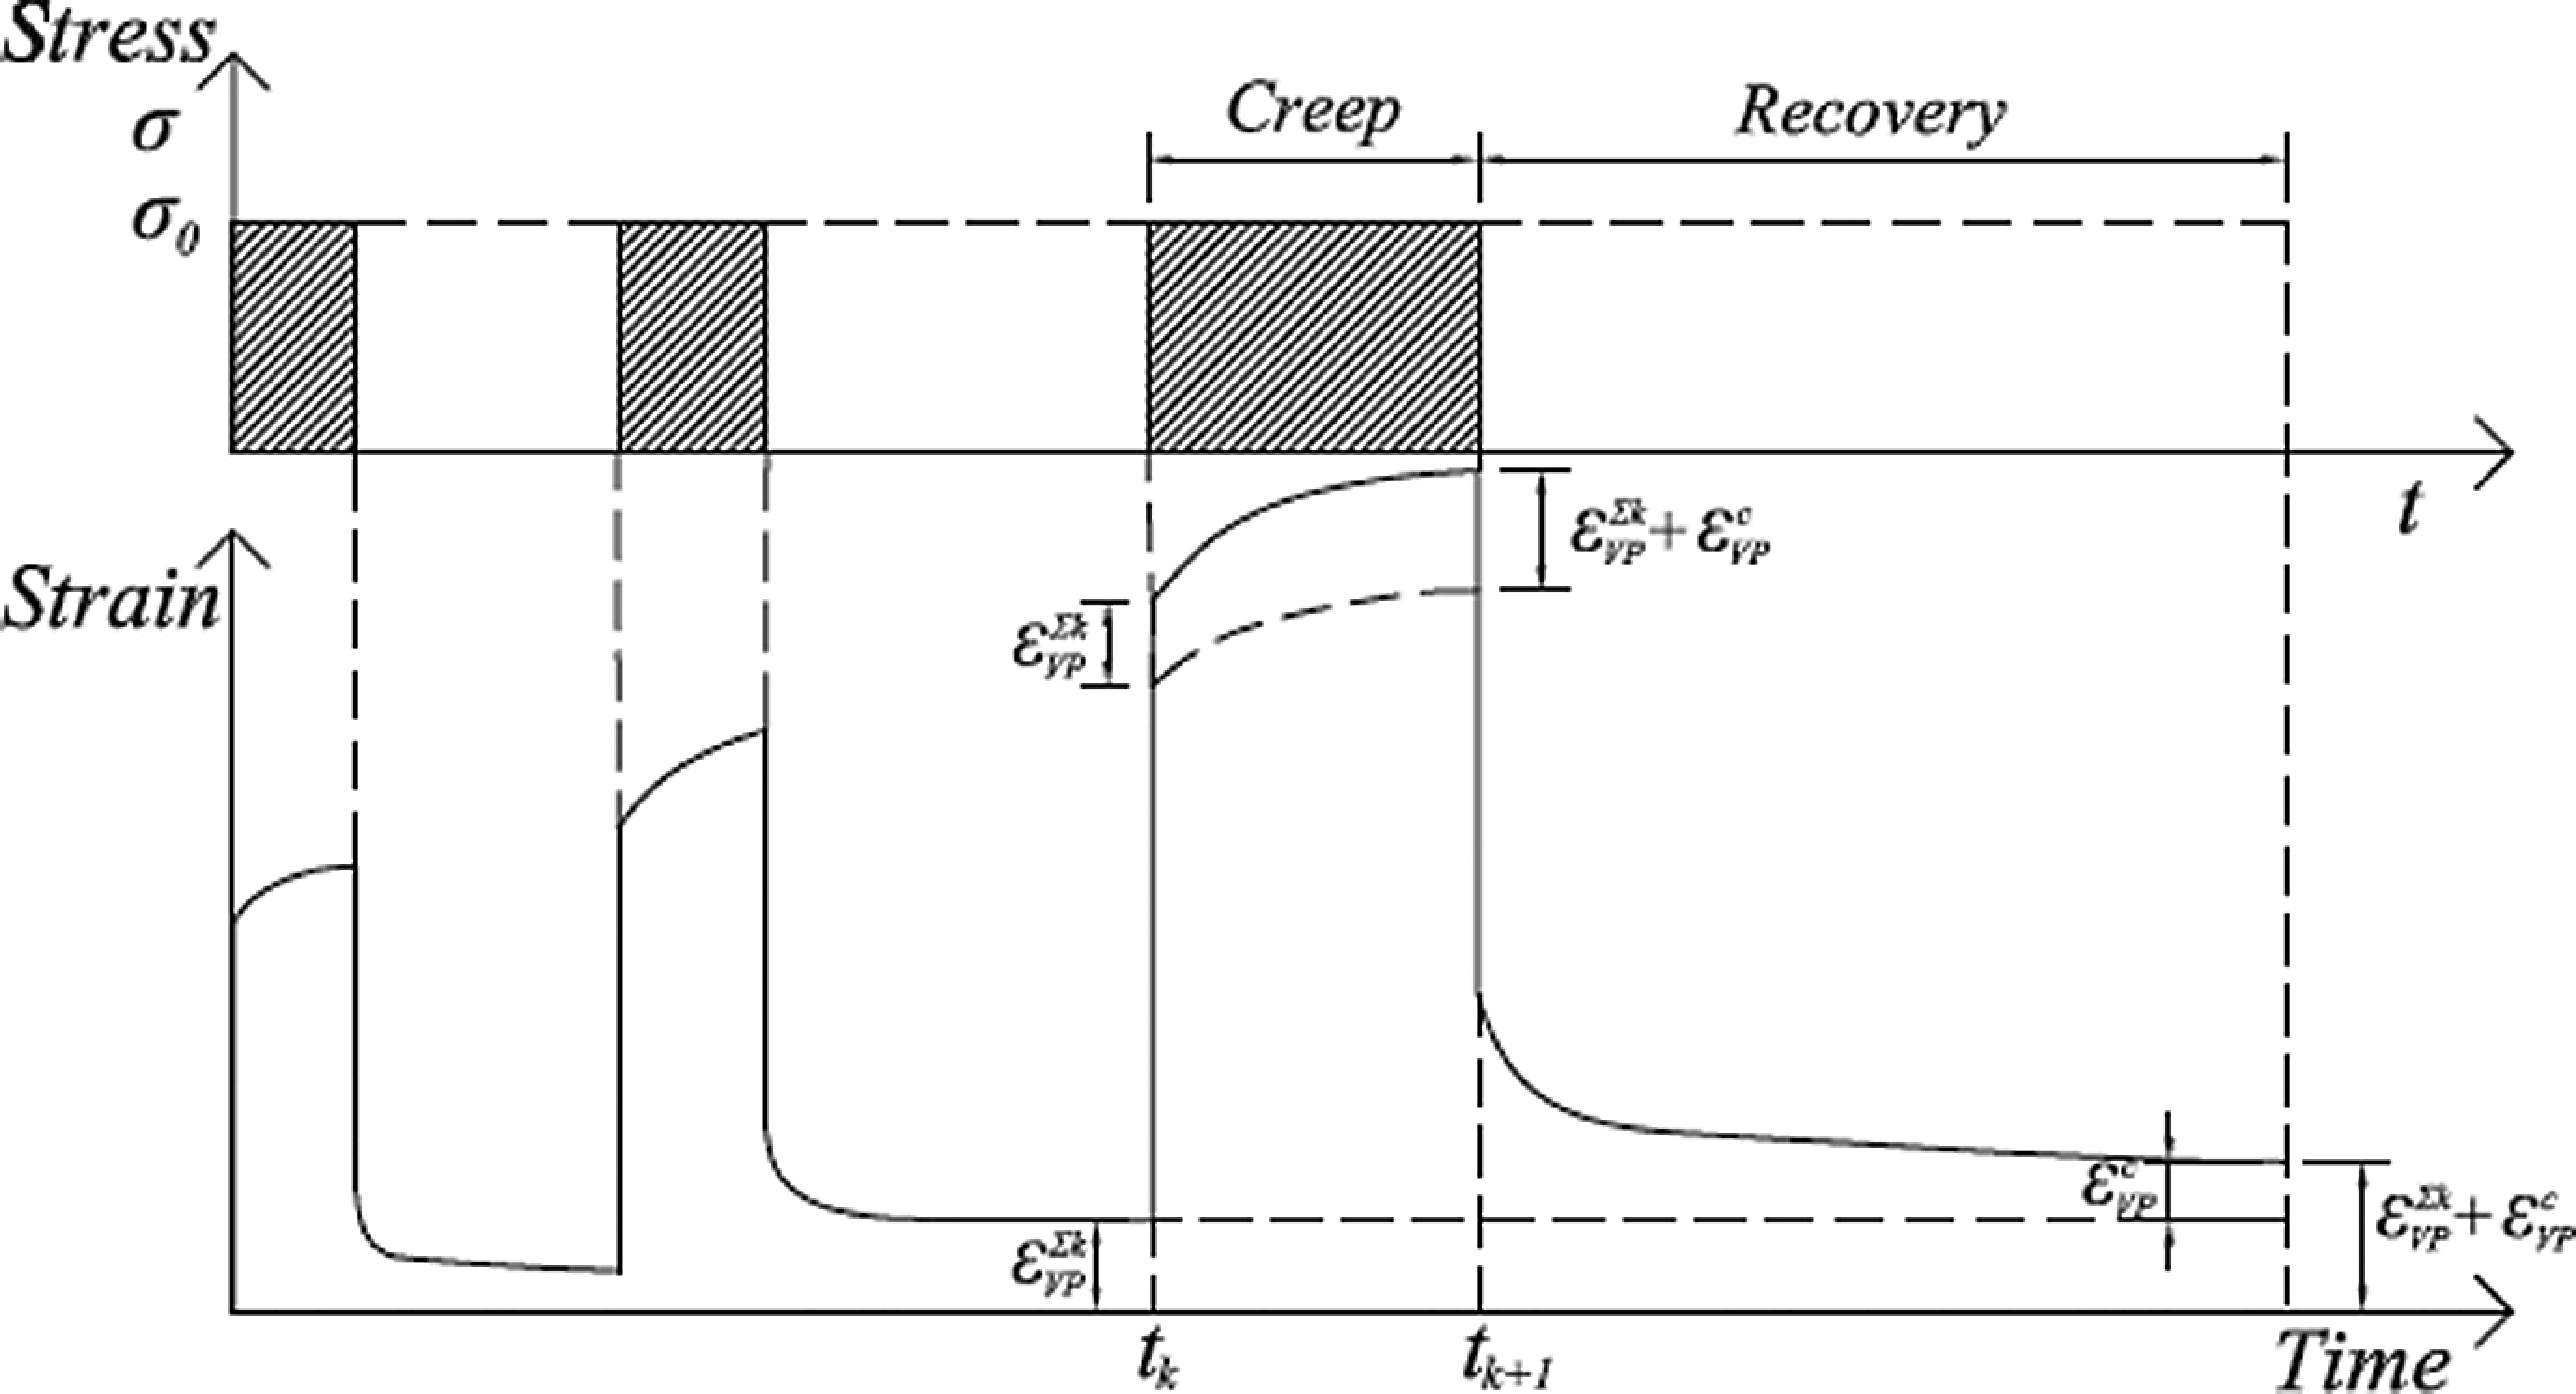
Schematic representation of strain development during creep test and after load removal where
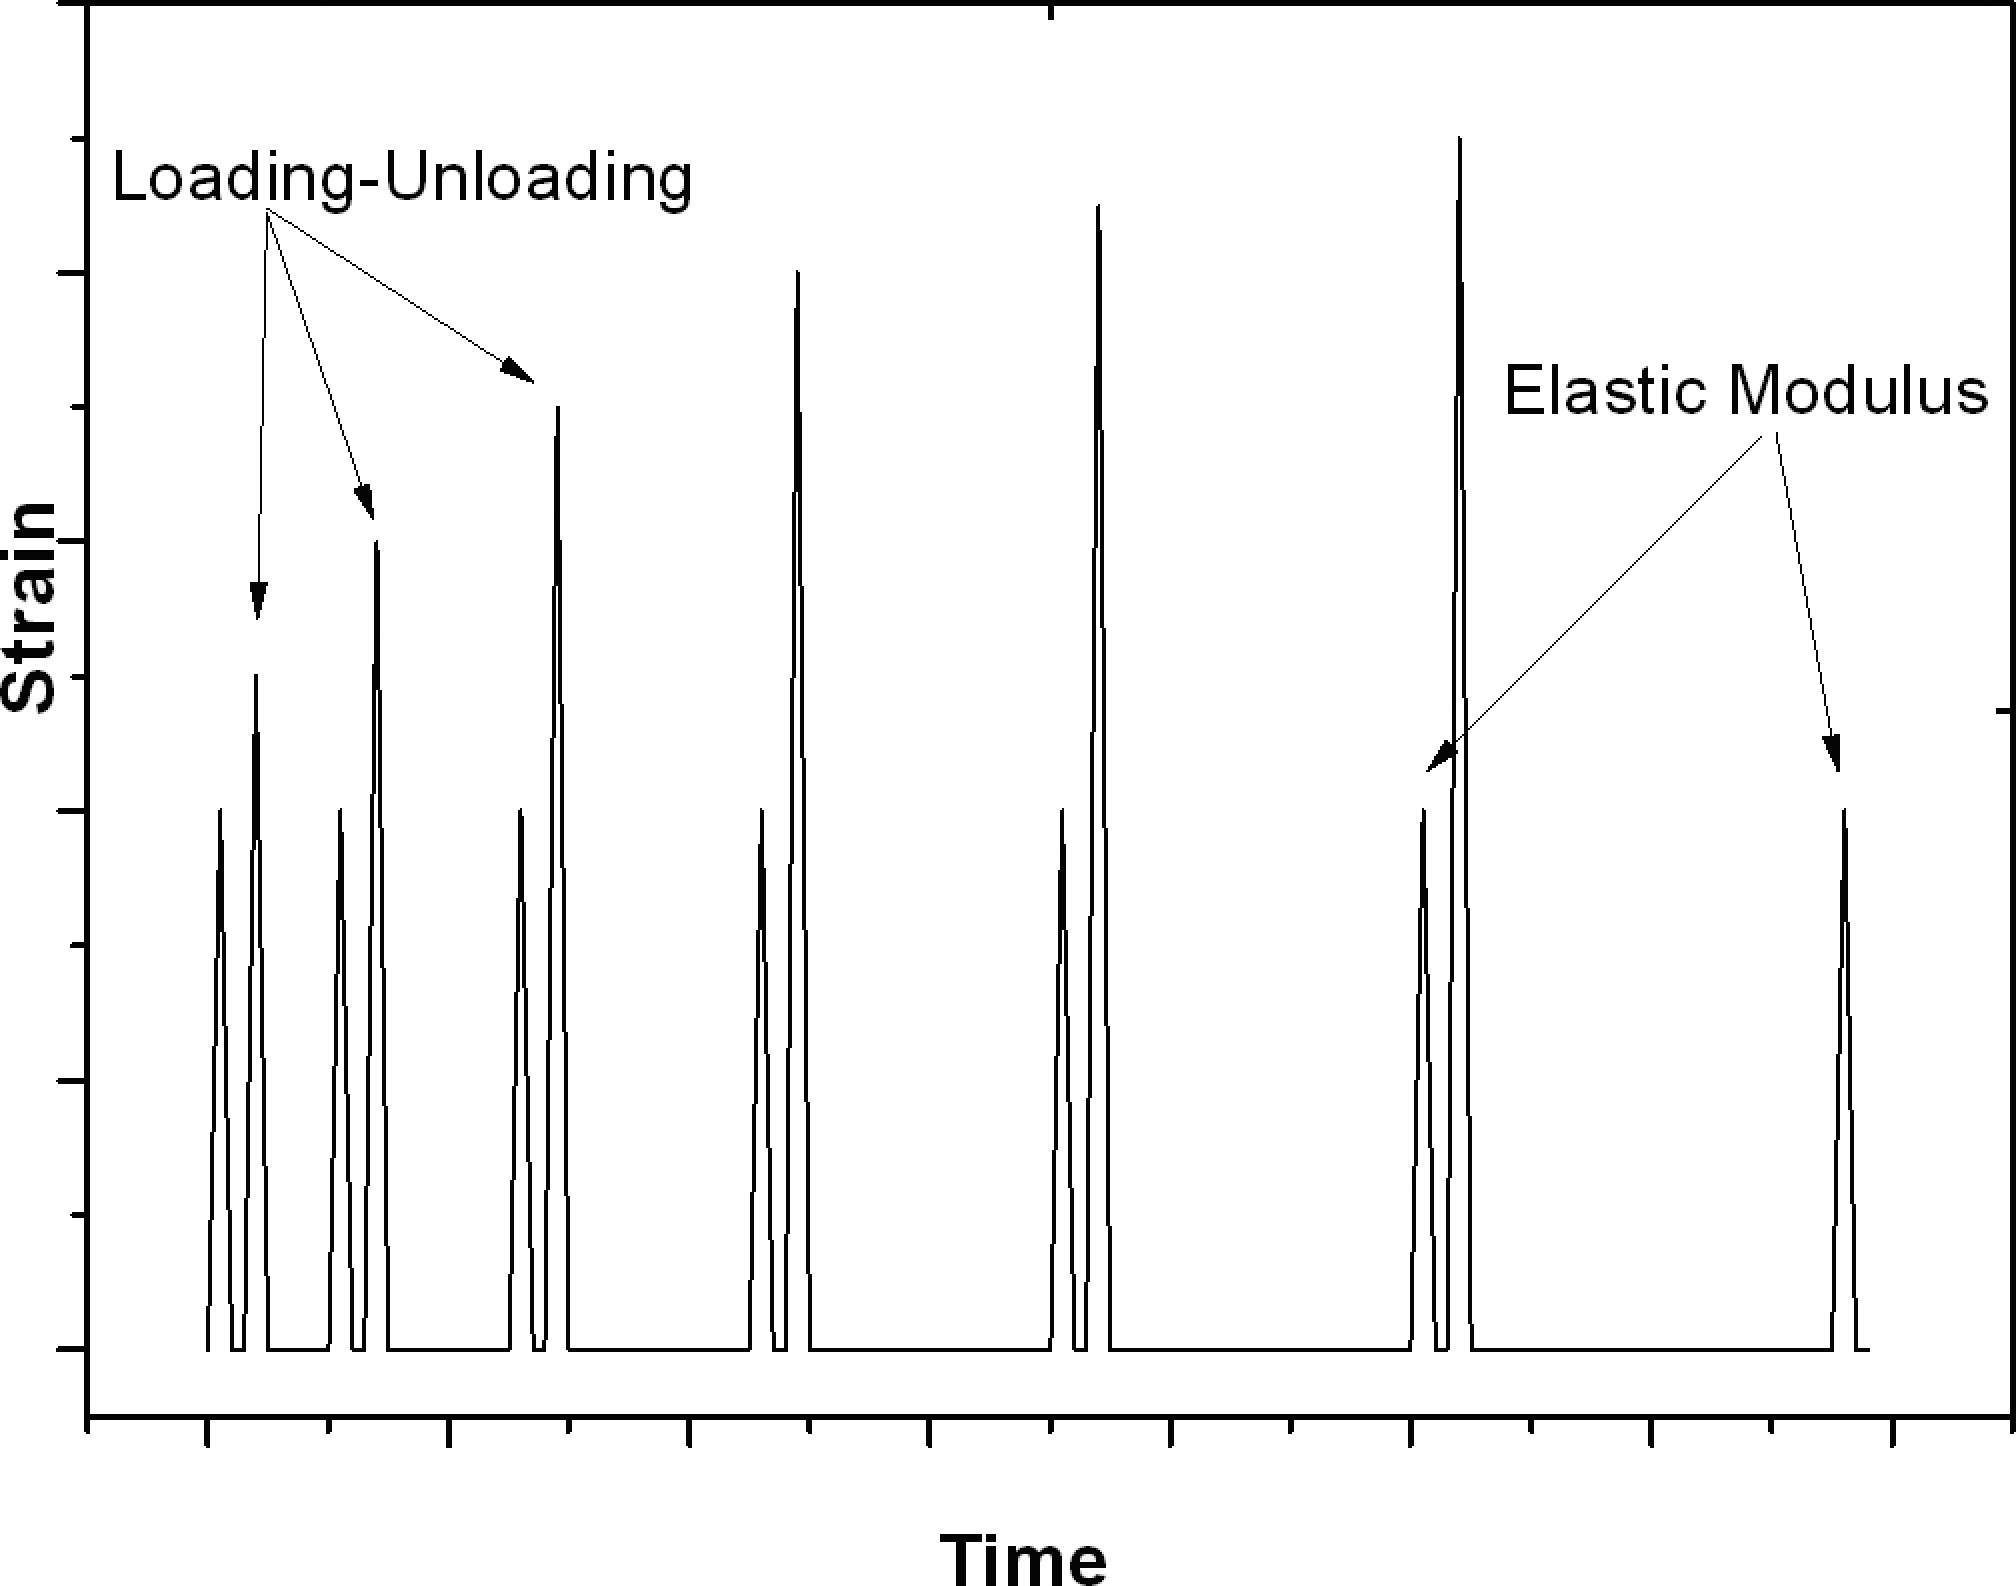
Schematic representation of strain dependence on time during displacement-controlled elastic modulus reduction test.
The irreversible strains at the end of the recovery period (if present) were analyzed as viscoplastic (VP). Creep tests used for determination of time and load dependence of VP strains were in multiple steps over the time intervals of 10, 20, and 30 min.
Microdamage caused stiffness reduction. After the specimen has been subjected to high stress levels, the elastic properties of composite may be degraded. The elastic modulus dependence on the applied maximum stress was measured to evaluate the significance of microdamage developing at high stresses. The loading ramp is shown in Figure 2. It consists of a sequence of steps each containing (a) loading/unloading in low-stress region for elastic modulus determination, duration of this step is t 1; (b) recovery for a time 5t 1; (c) loading up to certain high-strain level with following unloading to almost zero stress, the duration of this step is t 2; (d) recovery at almost zero stress level for decay of all viscoelastic effects during time 5t 2. Then the same sequence (a)–(d) was repeated for a higher level of applied maximum strain in step (c).
In some cases large irreversible strains developed after application of high stress: after unloading to zero stress and relatively large recovery period, still considerable residual strains were present. Therefore, in the modulus determination step (following unloading and recovery), it was not possible to use the strain region between 0.05% and 0.2%. Instead a corresponding stress region was used, which for each particular specimen was defined in the first step of modulus measurement where irreversible strains and damage were not present.
Stress–strain behavior in tensile tests with constant displacement rate until failure
Tests at room temperature (RT = 22°C)
The stress–strain curves until failure at RH = 34% are shown for all composites in Figure 3(a). The comparison between two RH values for PLA-NF10 can be seen in Figure 3(b). All composites showed the same trend in tensile tests at different RH values as presented in Figure 3(b). The results are stable and have high repeatability. The most important characteristics are elastic modulus, maximum stress and corresponding strain, and stress and strain at failure are given in Table 2.
Mechanical properties of composites for two values of relative humidity, 34% and 66%.a
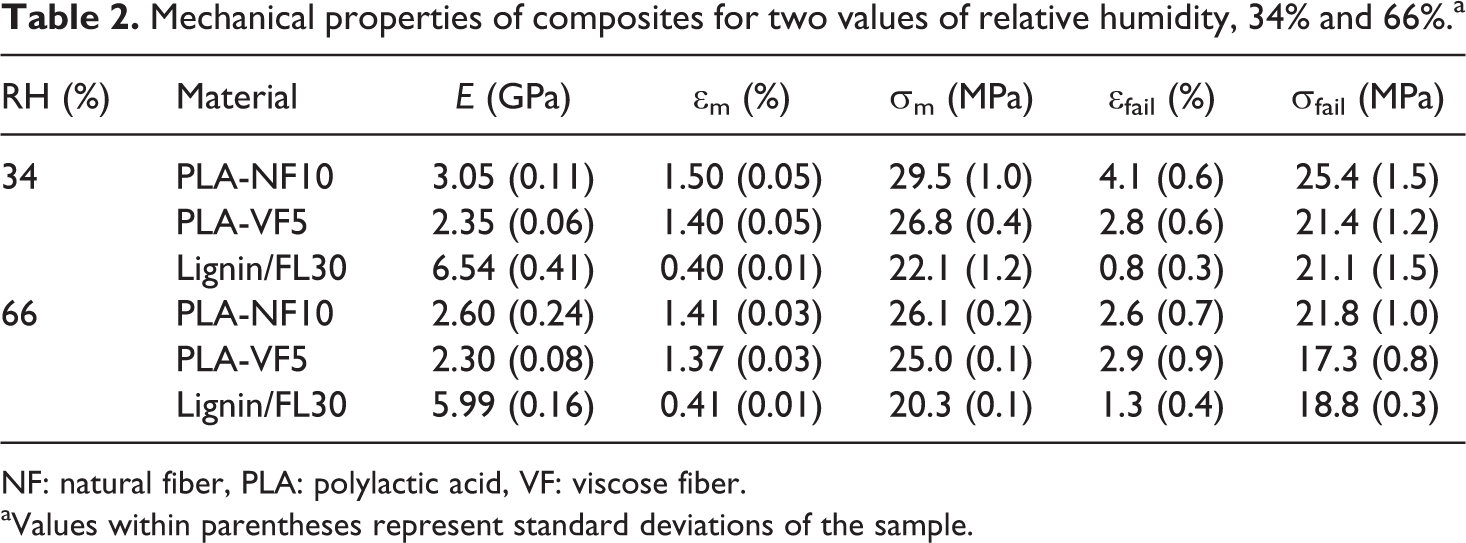
NF: natural fiber, PLA: polylactic acid, VF: viscose fiber.
aValues within parentheses represent standard deviations of the sample.
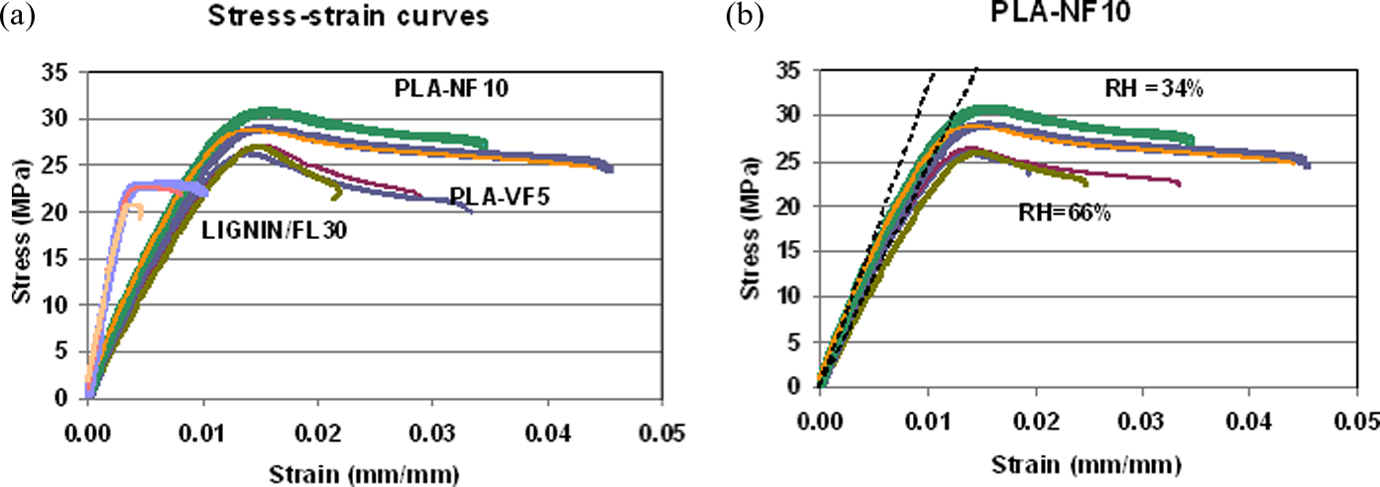
Stress–strain curves for (a) all composites at relative humidity (RH) = 34%, (b) polylactic acid composites with 10% natural fiber (PLA-NF10) for 2 values of RH 34% and 66%. Dashed lines represent assumed linear elastic behavior of material.
Experimental results
In spite of having 10 wt% of fibers with 1-mm average length before processing, the modulus of flax fiber/PLA ‘PLA-NF10’ composite given in Table 2 is not noticeably higher than the typical value of modulus of PLA 20 (not measured in this study). The assumed linear elastic stress–strain curve is calculated using initial modulus and shown in Figure 3(b). Comparing with the experimental nonlinear tensile stress–strain curve, one can see that the stress at maximum would be overestimated by 40–50% if the behavior is considered as linear elastic.
As shown in Table 2, RH (moisture) reduces σmax by 10–15% and only slightly affects ∊max. The stress to failure has decreased by about 20%, whereas ∊fail is more than 30% lower. The lower modulus at high RH may have the origin in the fiber as well as resin dependence on moisture.
Before processing VFs in the ‘PLA-VF5’composite are longer (2 mm) but with lower weight fraction (only 5%) than in the PLA-NF10 composite analyzed above. The stress–strain curves in Figure 3(a) exhibit the same features as the composite without VF. However, the stress–strain curves are systematically lower than that of PLA-NF10 which is also confirmed by the data in Table 2. The main qualitative difference is that stress–strain curve maximum is more distinct and the strain to failure at RH = 66% is larger than that at RH = 34%.
The slopes in Figure 3(a) appear rather constant almost until σmax is reached. However, similarly as it was for the PLA-NF10 composite, the σmax is significantly overestimated if the initial modulus is used to estimate stress at ∊max. The elastic modulus is slightly lower for PLA-VF5 composite because of its lower weight fraction and VF also has lower modulus (12–16 GPa) than flax fibers. Moisture has similar effect on this composite as for PLA-NF10. However, for PLA-VF5 the elastic modulus is reduced due to moisture only marginally and also maximum stress is lower by 5–6% only.
In the ‘Lignin/FL30’ composite with 30% weight fraction of 1-mm long flax fibers in the lignin matrix the elastic modulus is two times higher than for the two PLA matrix composites analyzed above, where the weight fractions were 10% of flax fibers and 5% of viscouse fibers. However, the maximum stress and stress at failure as well as corresponding strains are significantly lower. In addition, as shown in Figure 3(a), there is no clear maximum in stress–strain curves for the lignin composite.
Specimens with RH = 66% have 10% lower modulus than that of RH = 34%. The maximum stress is also reduced by 10%, whereas the corresponding strain is not changed and the strain to failure has significantly increased, most probably because moisture acts as a plasticizer.
It is noticeable that the scatter in data is lower for specimens conditioned at RH = 66%.
Analysis of the elastic modulus. Elastic modulus data can be compared with expectations following simple micromechanics expression for in-plane elastic modulus of short fiber composites with certain orientation distribution

In Eq (1) E f is the fiber modulus, E m is the matrix modulus, ηl is the length efficiency factor which is equal to one for long fibers and ηθ the orientation efficiency factor with a value of 3/8 for random in-plane orientation of fibers and 1/5 for random 3D distribution. If the orientations are preferably random in-plane, the value of ηθ would be between the two given above.
The fiber length is possibly reduced and fibers are partially damaged during manufacturing. 22 Since the fiber dispersion was good (no large fiber clusters observed during optical microscopy), the individual fiber aspect ratio (length versus diameter) is still rather large (flax fiber diameter is in the range of 10–30 μm) and the value of the length efficiency factor should be only slightly lower than 1. The value of ηl depends also on the stress transfer mechanism which is greatly dependent on interface quality.
Because the fiber length was less than 1 mm whereas the specimen thickness was 3.8–3.9 mm, the 3D random distribution is possible but not really due to the used processing method (injection molding) which usually leads to some preferred orientation. Although fiber orientation distribution is not available, we can speculate that some of the fibers having out-of-plane orientation component should lower the ηθ as compared with random in-plane case. On the other hand, flow is orienting fibers and the in-plane orientation distribution should be nonrandom with preference in the flow direction, which would increase the value of ηθ for this direction. The two described effects partially compensate each other and the effect of the orientation on modulus in the flow direction could be similar as in the random in-plane case.
In this section elastic constants are estimated using Eq (1) and the following rough assumptions:
in all composites the length efficiency factor is the same, ηl = 0.8;
the orientation efficiency factor, ηθ does not depend on fiber content, and we use ηθ = 0.37 which is very close to the value for random in-plane case;
axial modulus of flax fibers in all composites is the same, E f = 50 GPa. The viscous fiber modulus is 14 GPa;
the PLA modulus is 2 GPa, whereas for the lignin modulus two values (2 GPa and 3 GPa) are used.
Calculation results under these assumptions are given in Table 3. They show that the assumed values lead to composite elastic modulus which is in a reasonable agreement with experimental data in Table 2. The significantly higher modulus for lignin composite is mostly due to higher fiber content. Also, in order to come closer to experimental value, we had to assume that lignin modulus is not 2 GPa but rather 3 GPa. This value is similar to the values used in micromechanics of wood. In Ref 23, the lignin modulus reduces from 4.7 GPa to 3 GPa with the RH change from 34% to 66%. In Ref 24, the values 2–3.5 GPa were used.
Elastic modulus of composite according to the rule of mixture (1).a
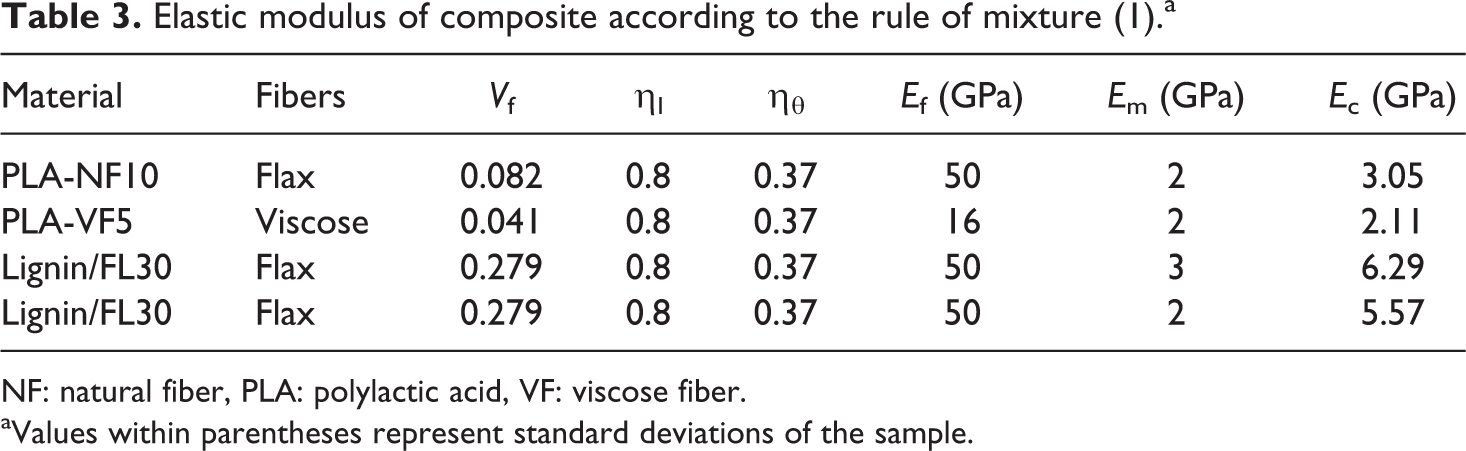
NF: natural fiber, PLA: polylactic acid, VF: viscose fiber.
aValues within parentheses represent standard deviations of the sample.
Certainly apart from higher lignin modulus, there could be other factors responsible for the change
differences in degradation of fiber (pelletizing instead of compounding, high-volume fraction) or different fiber length after processing;
different interface strength leading to improved stress transfer (for example ηl ≈ 1);
different fiber orientation distribution in high-fiber content composite.
Tensile tests at elevated temperature (T = 30°C and T = 35°C)
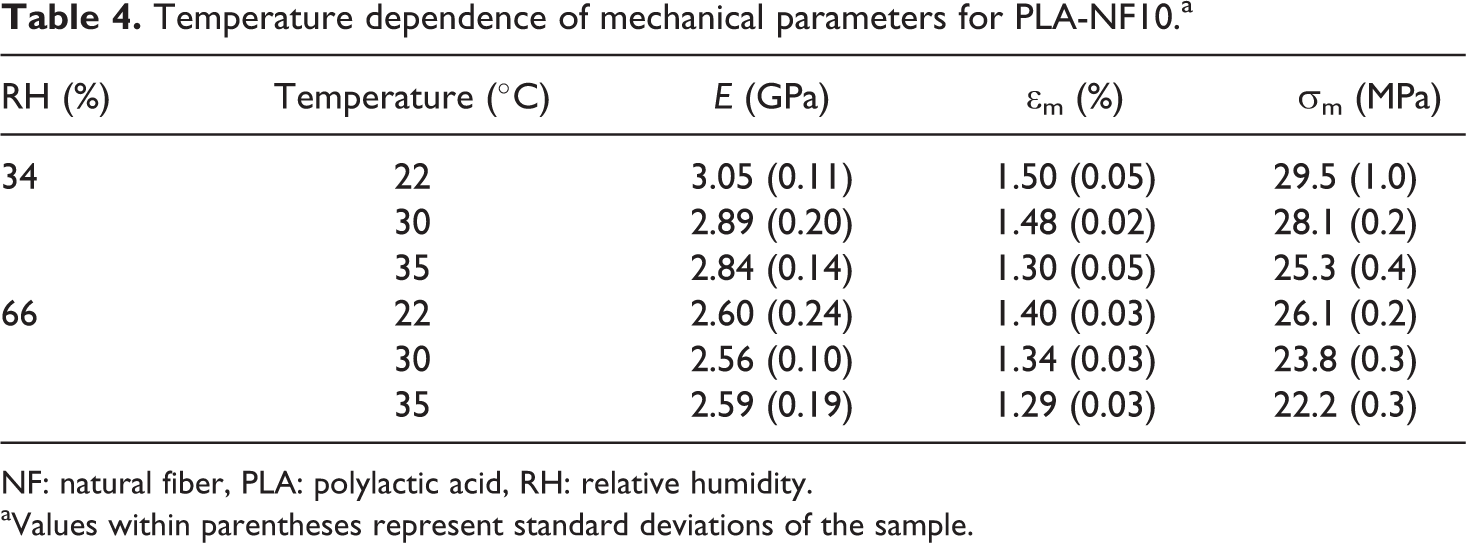
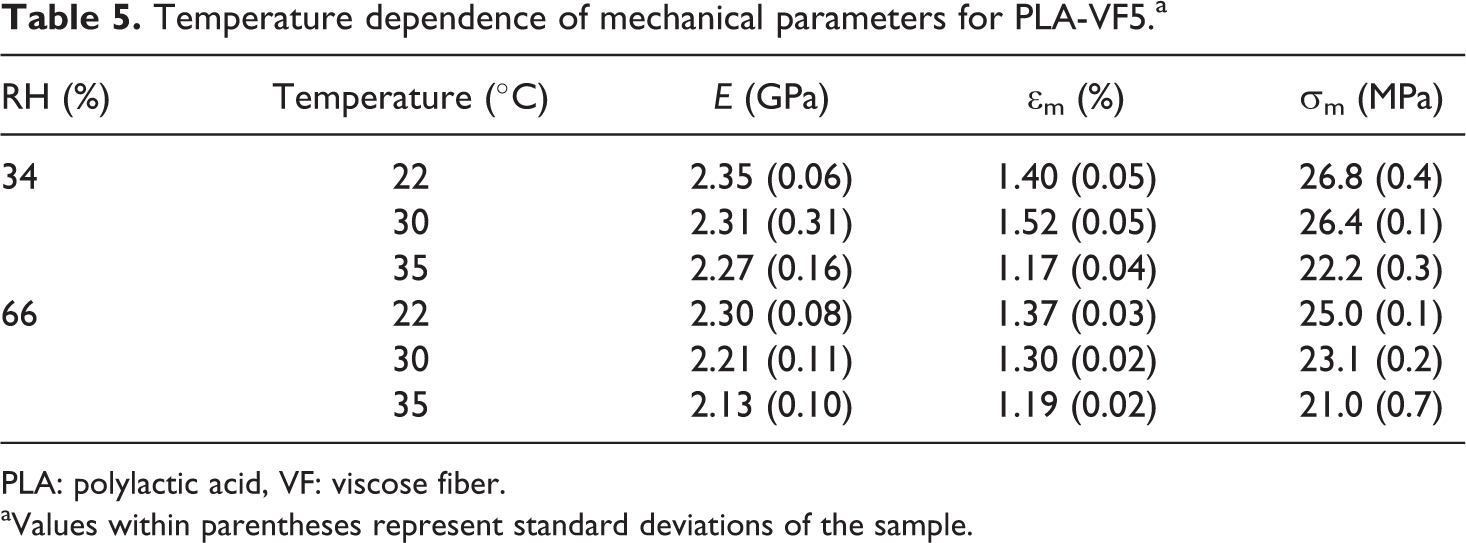
The results shown in Figure 4 illustrate the dependence of mechanical performance of PLA-NF10 composite on temperature. All composites at both RH exhibit the same features with increase in temperature as PLA-NF10 at RH = 34%. Tables 4–6 show the elastic modulus and the maximum stress value in the loading curve. Figures 5 –7 show normalized values of elastic modulus and σmax. Normalization is done with respect to composite properties at RH = 34% and RT.
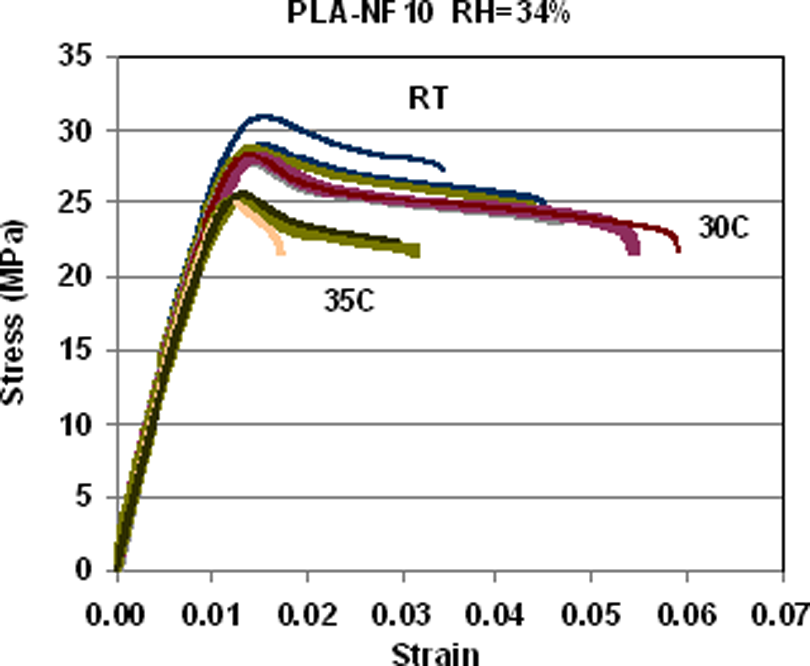
The effect of temperature on stress–strain curves for polylactic acid composites with 10% natural fiber (PLA-NF10) at relative humidity (RH) = 34%.
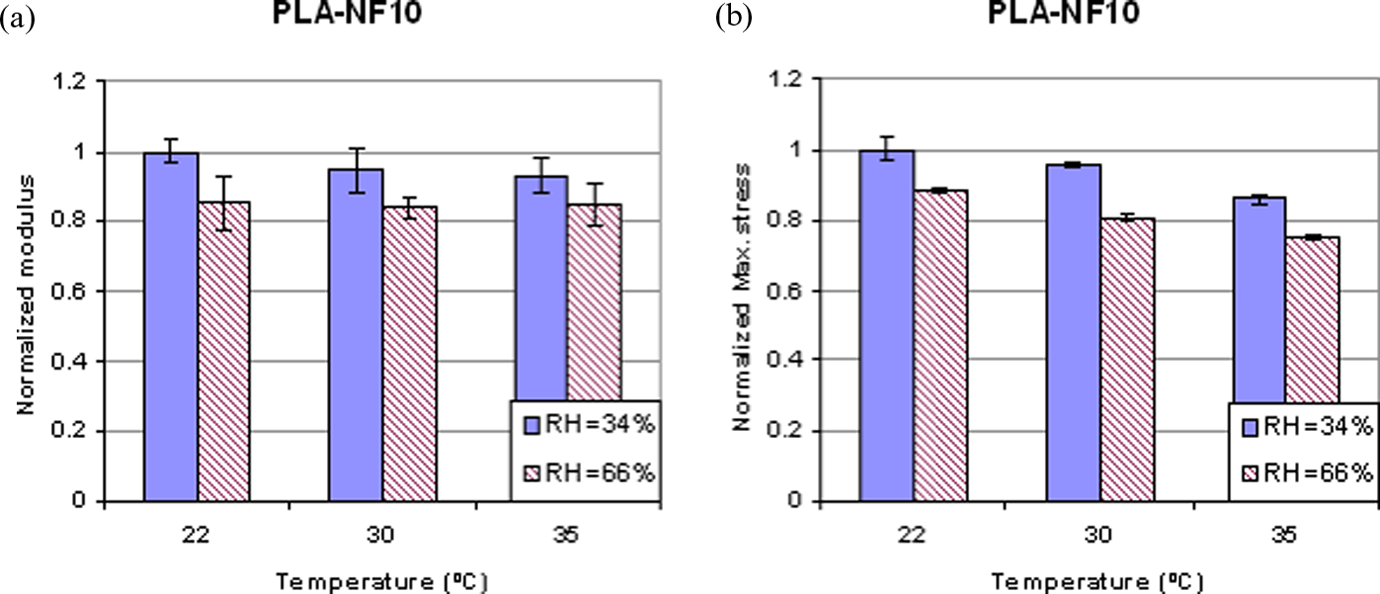
Normalized properties of polylactic acid composites with 10% natural fiber (PLA-NF10). (a) Elastic modulus and (b) maximum stress (normalized with respect to properties at room temperature (RT) and relative humidity (RH) = 34%).
PLA-NF10 composite. The elastic modulus at RH = 34% is decreasing with temperature by 6–8% when the temperature is changed from RT to T = 35°C. At RH = 66%, the modulus change is not statistically confirmed. At the same temperature interval, the maximum stress σmax decreases by 13% at RH = 34% and by about 15% at RH = 66%.
PLA-VF5 composite. At RH = 34%, the elastic modulus of this composite is less sensitive to temperature variations in the range from RT to 35°C, see Figure 6(a), than the PLA-NF10 composite. The maximum stress, σmax, in the range from RT to 30°C is almost not affected. However, when the temperature rises to 35°C, the difference is large with the σmax reduced by 17–19%, which is more than the reduction in the PLA-NF10 composite, see section PLA-NF10 composite.
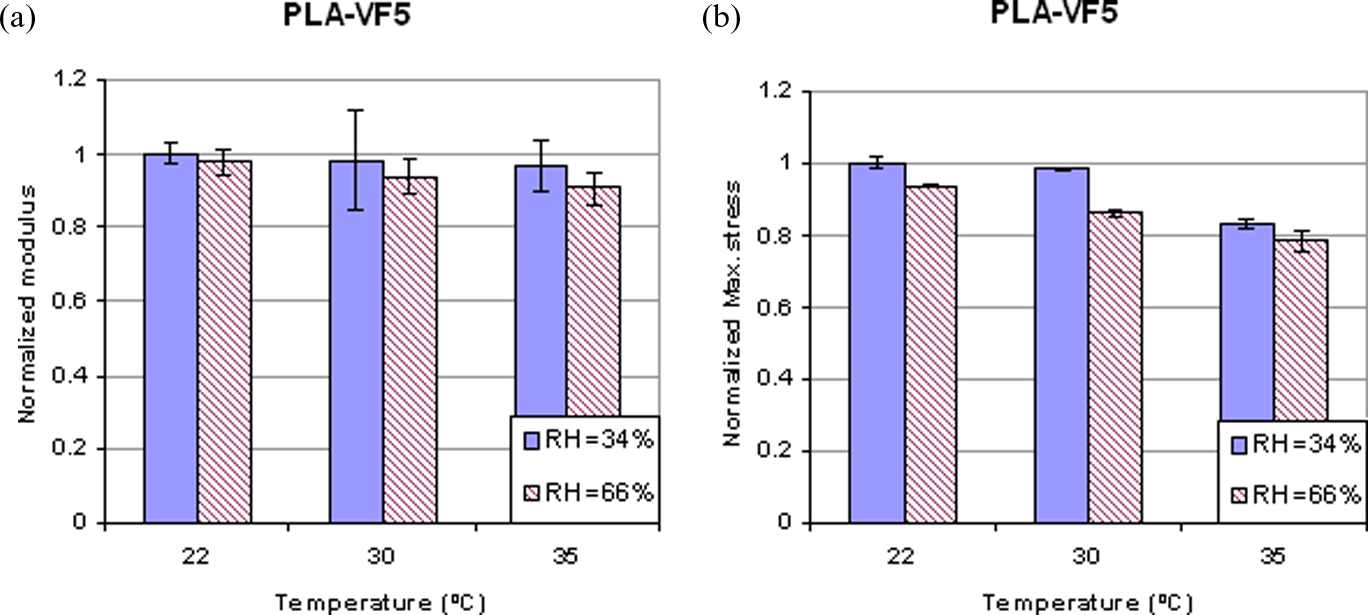
Normalized properties of polylactic acid composites with 5% viscose fiber (PLA-VF5). (a) Elastic modulus and (b) maximum stress (normalized with respect to properties at room temperature (RT) and relative humidity (RH) = 34%).
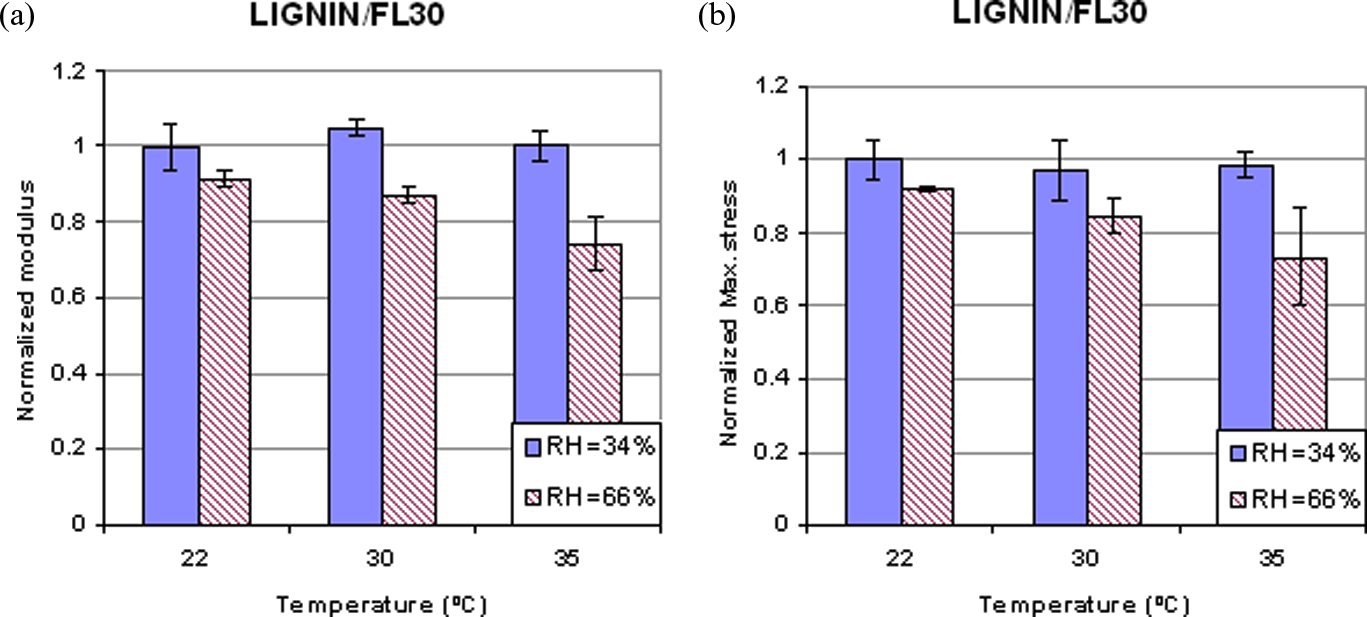
Normalized properties of lignin-based composite with 30% flax fibers (lignin/FL30). (a) Elastic modulus and (b) maximum stress (normalized with respect to properties at room temperature (RT) and relative humidity (RH) = 34%).
At RH = 66%, the PLA-VF5 composite is sensitive even to modest temperature changes, see Figure 6 at 30°C. There is 10% modulus reduction at 35°C. The σmax reduction at 35°C is almost the same as at RH = 34%.
All modulus and maximum stress values for PLA-VF5 in Table 5 are lower than for PLA-NF10.
Temperature dependence of mechanical parameters for PLA-NF10.a
NF: natural fiber, PLA: polylactic acid, RH: relative humidity.
aValues within parentheses represent standard deviations of the sample.
Temperature dependence of mechanical parameters for PLA-VF5.a
PLA: polylactic acid, VF: viscose fiber.
aValues within parentheses represent standard deviations of the sample.
Lignin/FL30 composite. For lignin/FL30 composite, the data scatter is larger and the trends are not so obvious. The elastic modulus at RH = 34% is not decreasing with temperature (see Figure 7, Table 6). The decrease in the maximum stress σmax with temperature at RH = 34% is also within the experimental scatter. The σmax values at different temperatures for individual specimens are overlapping.
Temperature dependence of mechanical parameters for lignin/FL30.a
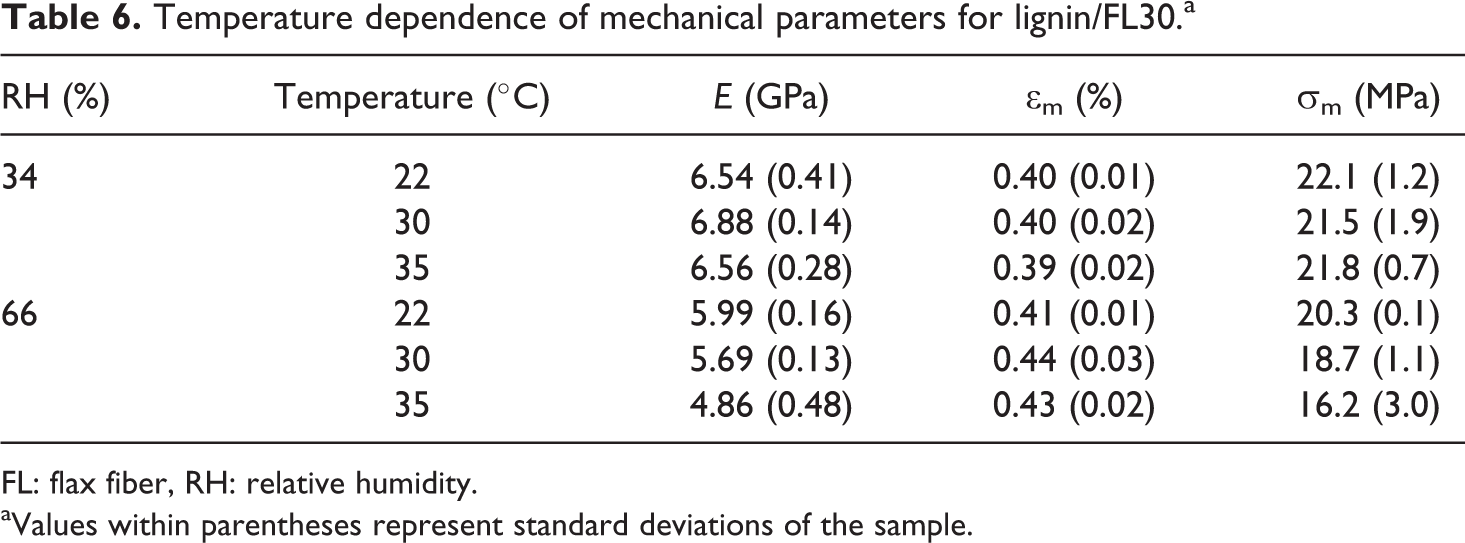
FL: flax fiber, RH: relative humidity.
aValues within parentheses represent standard deviations of the sample.
At RH = 66%, the differences are more distinct and the changes are statistically significant. The elastic modulus at 35°C is almost 20% lower than at RT. The σmax decrease at 35°C is almost 20%.
Summarizing the presented results the following statements are made:
The elastic modulus at RH = 34% of PLA matrix composites is slightly decreasing with an increase in the temperature. The lignin-based composite modulus does not decrease but actually slightly increases at moderate temperature change.
At RH = 66%, the PLA-NF10 composite elastic modulus does not change with increasing temperature, the modulus of the PLA-VF5 change by 10% and the modulus of the lignin/NF30 composite is reduced by 20%.
At RH = 34%, the maximum stress in the loading curve is affected by temperature change between RT and 35°C as follows: 13% reduction for PLA-NF10; 17–19% reduction by PLA-VF5; no change for lignin/NF30 composite.
At RH = 66%, the change in σmax with temperature is as follows: 15% reduction for PLA-NF10; 17–19% for PLA-VF5; and 20% reduction for lignin/NF30.
It seems that the combination ‘moisture + temperature’ is affecting lignin/NF30 composite at RH = 66% more than both PLA-based composites.
Elastic modulus degradation at high loads
Several microdamage events may take place when fiber-reinforced composites are subjected to high loads/strains, reducing elastic modulus in the loading direction and also affecting other thermoelastic constants. The most typical microdamage phenomena are fiber/matrix debonds, fiber bundle debonding from matrix, intrabundle cracks (cracks crossing bundles with the crack plane parallel to fibers and normal to the loading direction), matrix cracks bridged by several bundles, and finally fiber and/or bundle pull-outs and/or fiber breaks. Scanning electron micrographs (SEMs) of fracture surfaces of the three composites are shown in Figure 8. In the PLA matrix one can also see small particles—fire retardants. Fracture surfaces of PLA composites are relatively smooth as compared with lignin matrix composite. In contrast to PLA composites, flax fibers in lignin composites after pull-out have a large amount of residues on their surface. This is an indication that the fiber/matrix interface in PLA composites is relatively weaker. In all cases, the pull-out length is rather large. The particular sequence of mechanisms depends on fiber dispersion and elastic properties reduction which is more dramatic in case of clustered microstructures. For better dispersed reinforcement, the initial damage entities are small (comparable with fiber diameter) and difficult to observe using microscopy. On specimen edge many tiny cracks are observed, but it is difficult to determine whether they are just surface phenomena or represent the damage state in the material. Only in-situ observations under loading render reasonably reliable data but due to the very broad distribution of sizes and orientations, the quantification of damage entities is almost impossible.
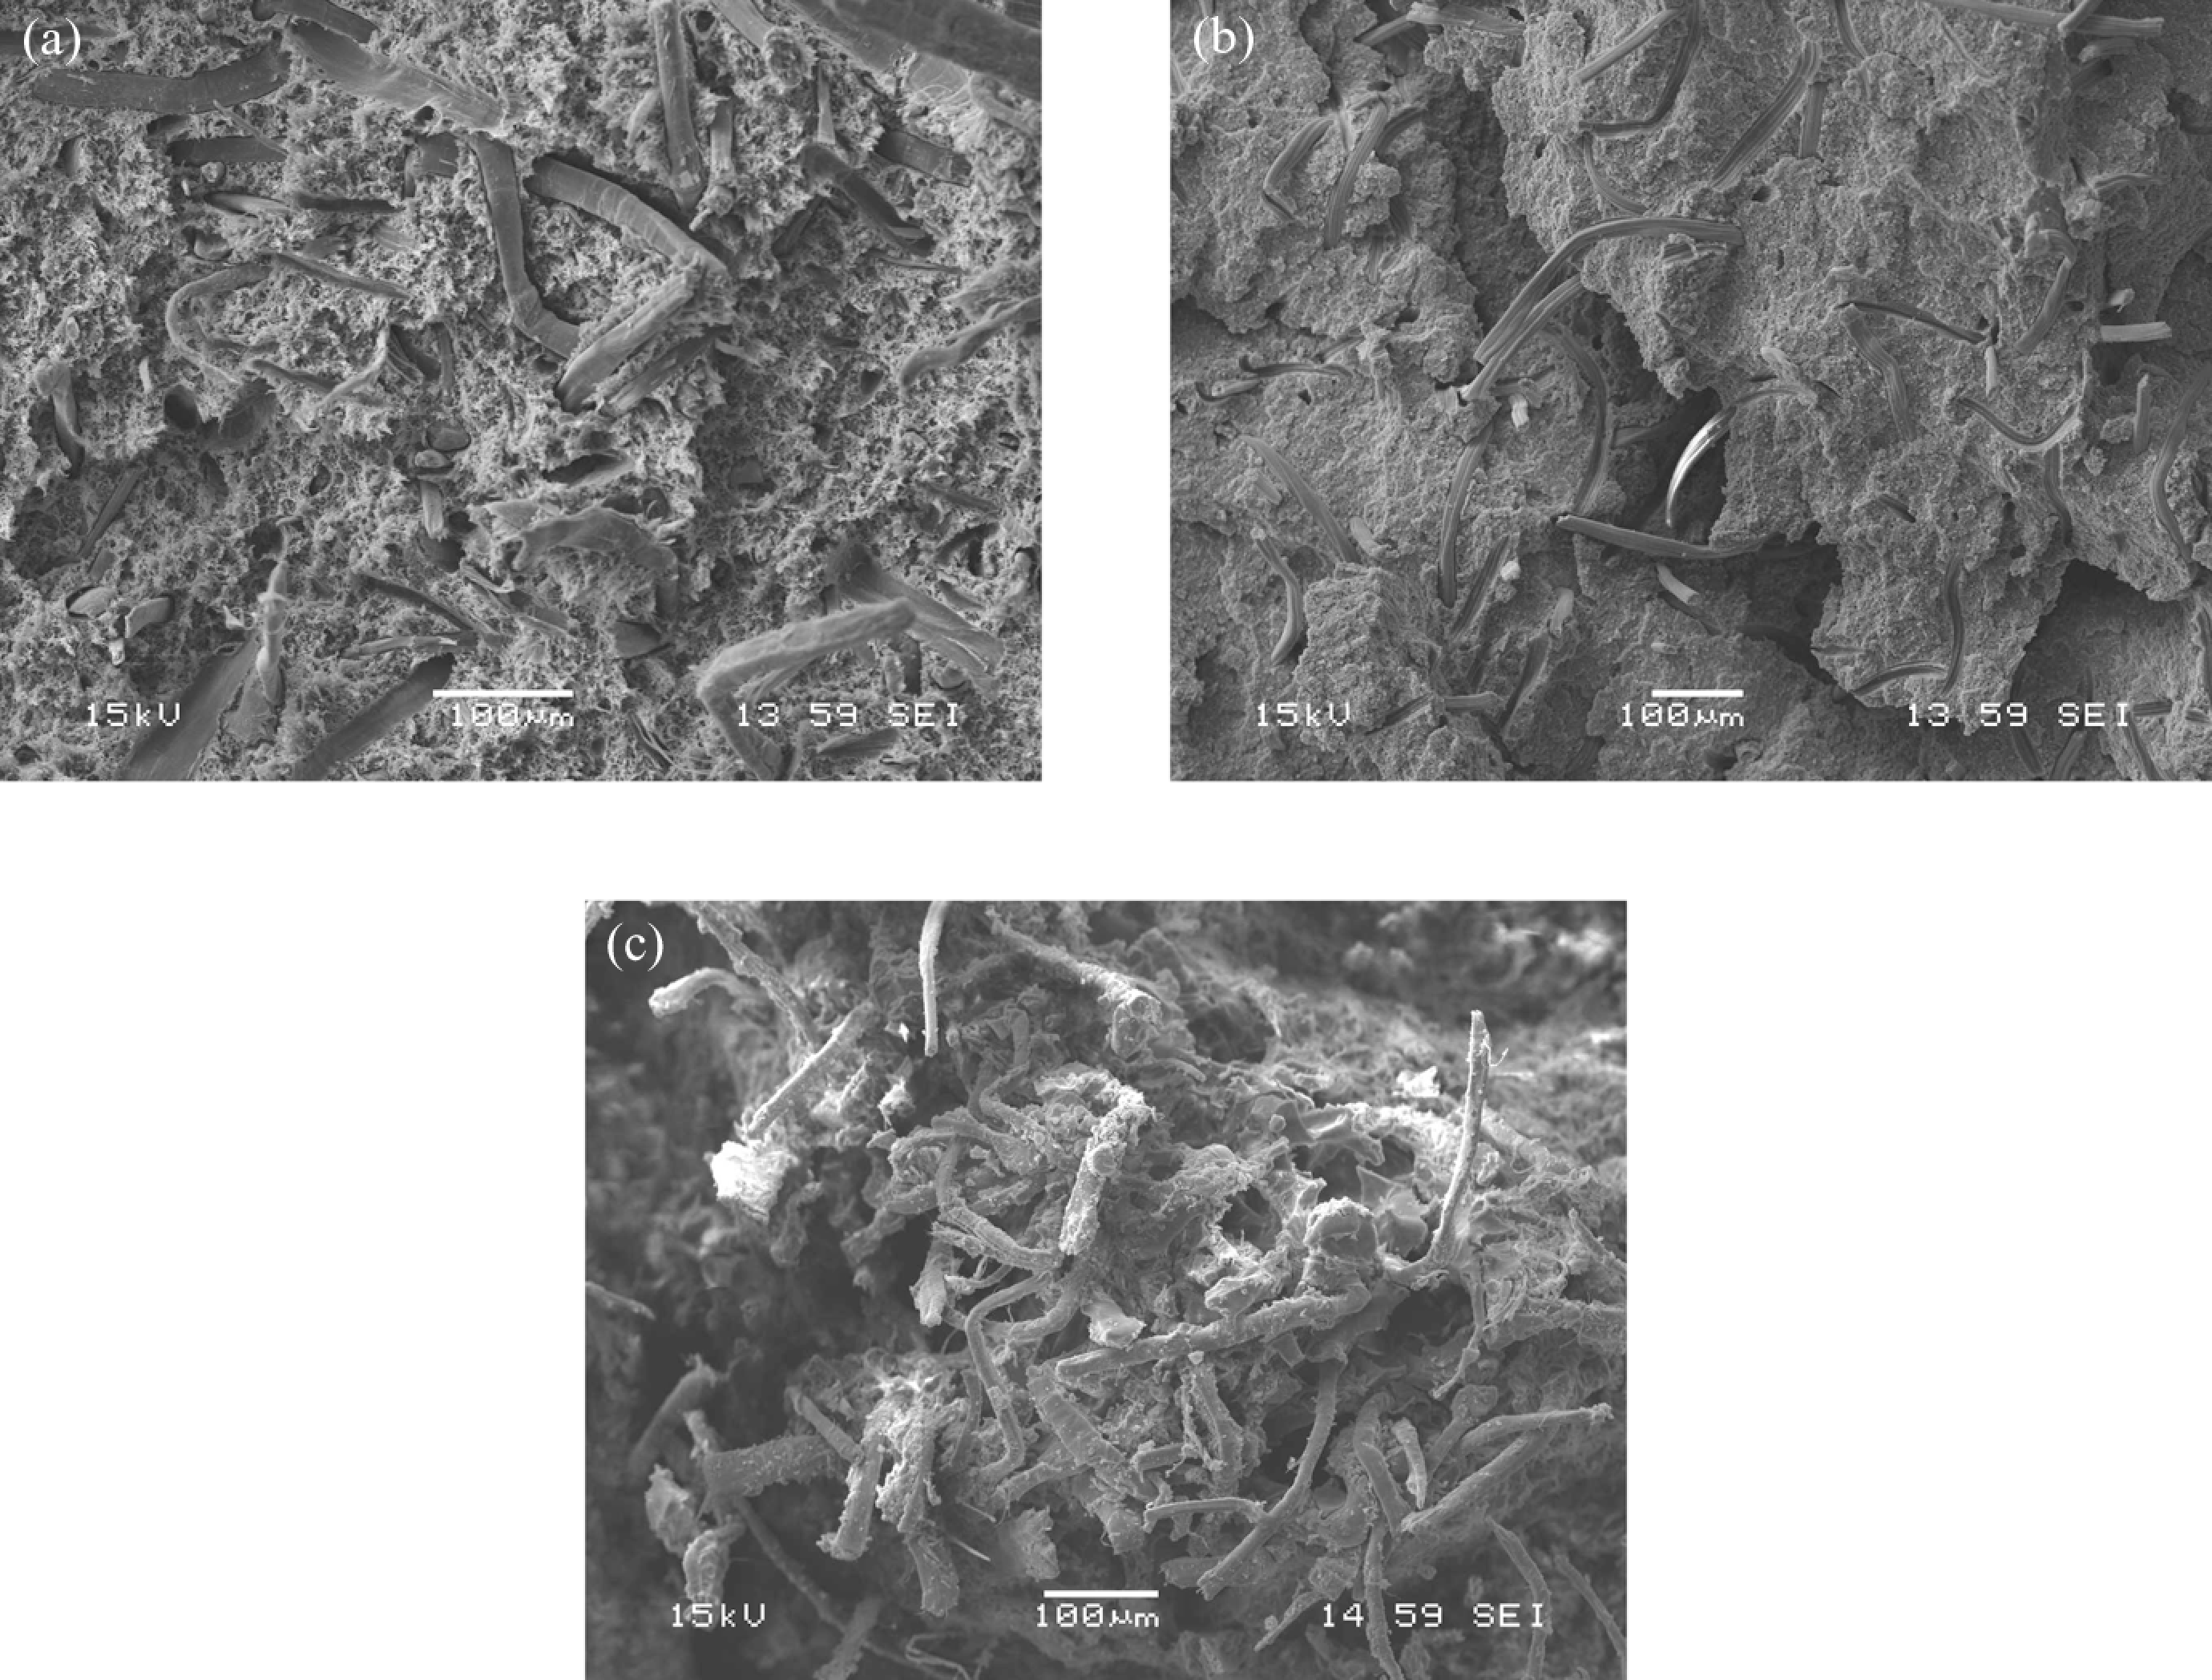
Scanning electron microscope (SEM) images of fracture surfaces of composites (a) polylactic acid composites with 10% natural fiber (PLA-NF10); (b) PLA composites with 5% viscose fiber (PLA-VF5); (c) lignin-based composite with 30% flax fibers (lignin/FL30).
An inverse method to evaluate the damage state is based on the measurement of residual elastic properties. The change in these properties can be linked with models describing the effect of different damage modes to estimate the extend of each damage. However, back calculation of the damage state from the elastic properties change is not unique due to the different damage modes developing simultaneously.
Therefore, by following the elastic modulus, reduction in the loading direction is used as an empirical parameter to characterize the overall damage without trying to identify specific damage modes.
In this section, we present the measurement results of axial modulus reduction obtained using the methodology described in the section on Microdamage caused stiffness reduction. Note that all these displacement-controlled tests were performed at room temperature. Normalized modulus after application of certain stress (corresponding to the reached strain maximum in Figure 2) is shown in Figures 9 –11. Normalization is done with respect to the initial modulus for the particular specimen.
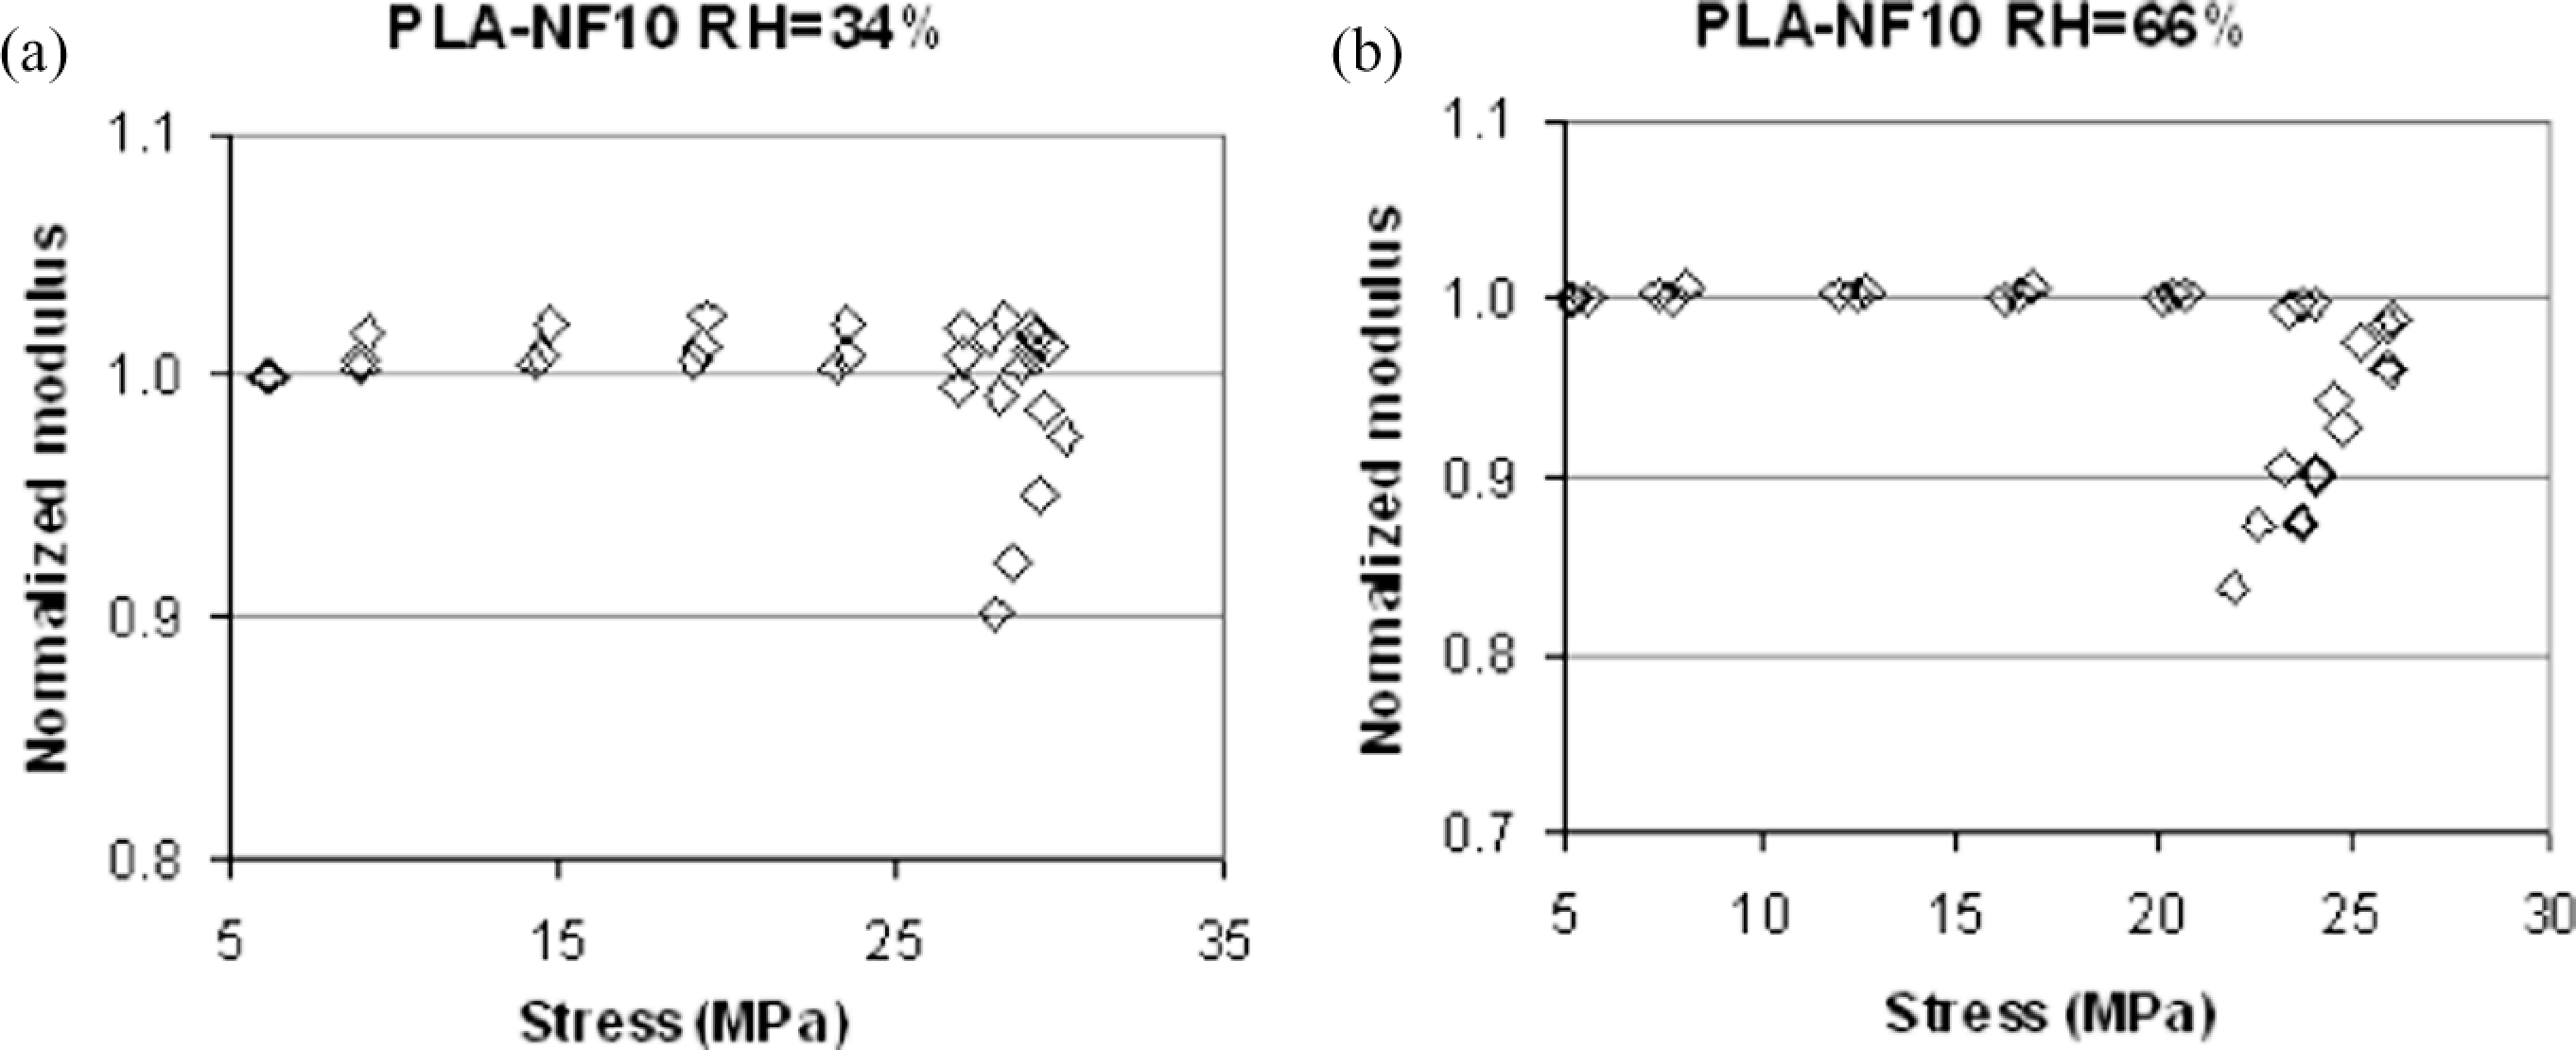
Elastic modulus reduction as a function of maximum applied stress for polylactic acid composites with 10% natural fiber (PLA-NF10) at (a) relative humidity (RH) = 34%; (b) (RH) = 66%.
Modulus is presented as a function of stress instead of strain because strain of inelastic materials in addition to elastic part contains transient viscoelastic term and VP strain. Their effect on damage is very complex and difficult to interpret.
In Figure 9(a), all three specimens conditioned at RH = 34% did not show any modulus change until reaching the maximum stress, σmax. After that two specimens had no modulus reduction until failure and only one started to show modulus reduction, which reached 10% before failure. For specimens conditioned at RH = 66% (see Figure 9b), there was no damage developed before reaching the maximum stress, σmax. Modulus reduction starts after stress exceeds σmax and reaches 15% at the end of the test.
The elastic modulus of PLA-VF5 composite with 5% VF is shown in Figure 10. For specimens conditioned at RH = 34%, the modulus reduction, if any, is very small not exceeding 1–2%. The elastic modulus of PLA-VF5 specimens conditioned at RH = 66% does not change.
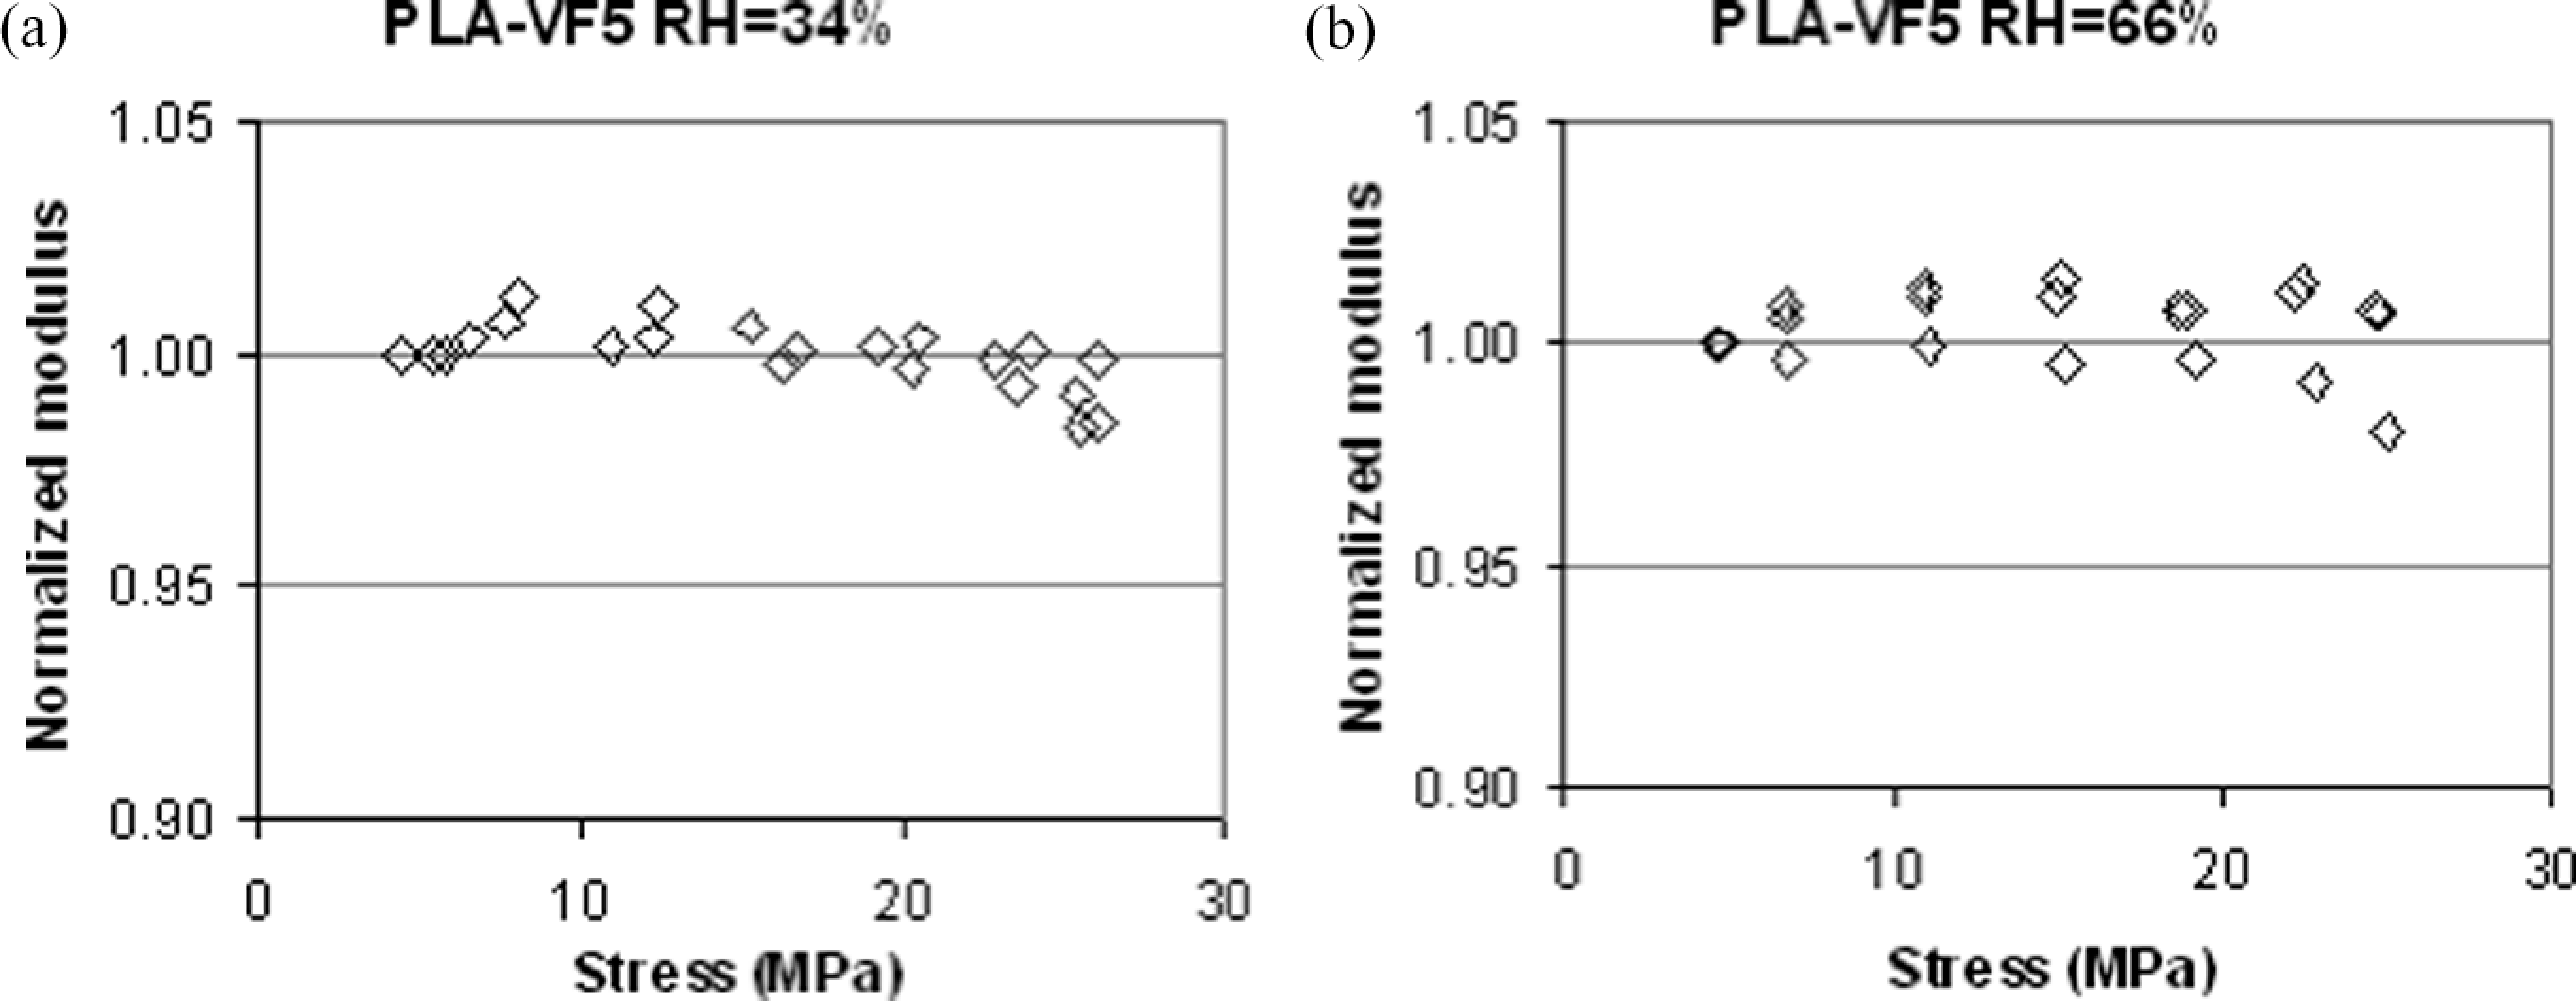
Elastic modulus reduction as a function of maximum applied stress for polylactic acid composites with 5% viscose fiber (PLA-VF5) at (a) relative humidity (RH) = 34%; (b) (RH) = 66%.
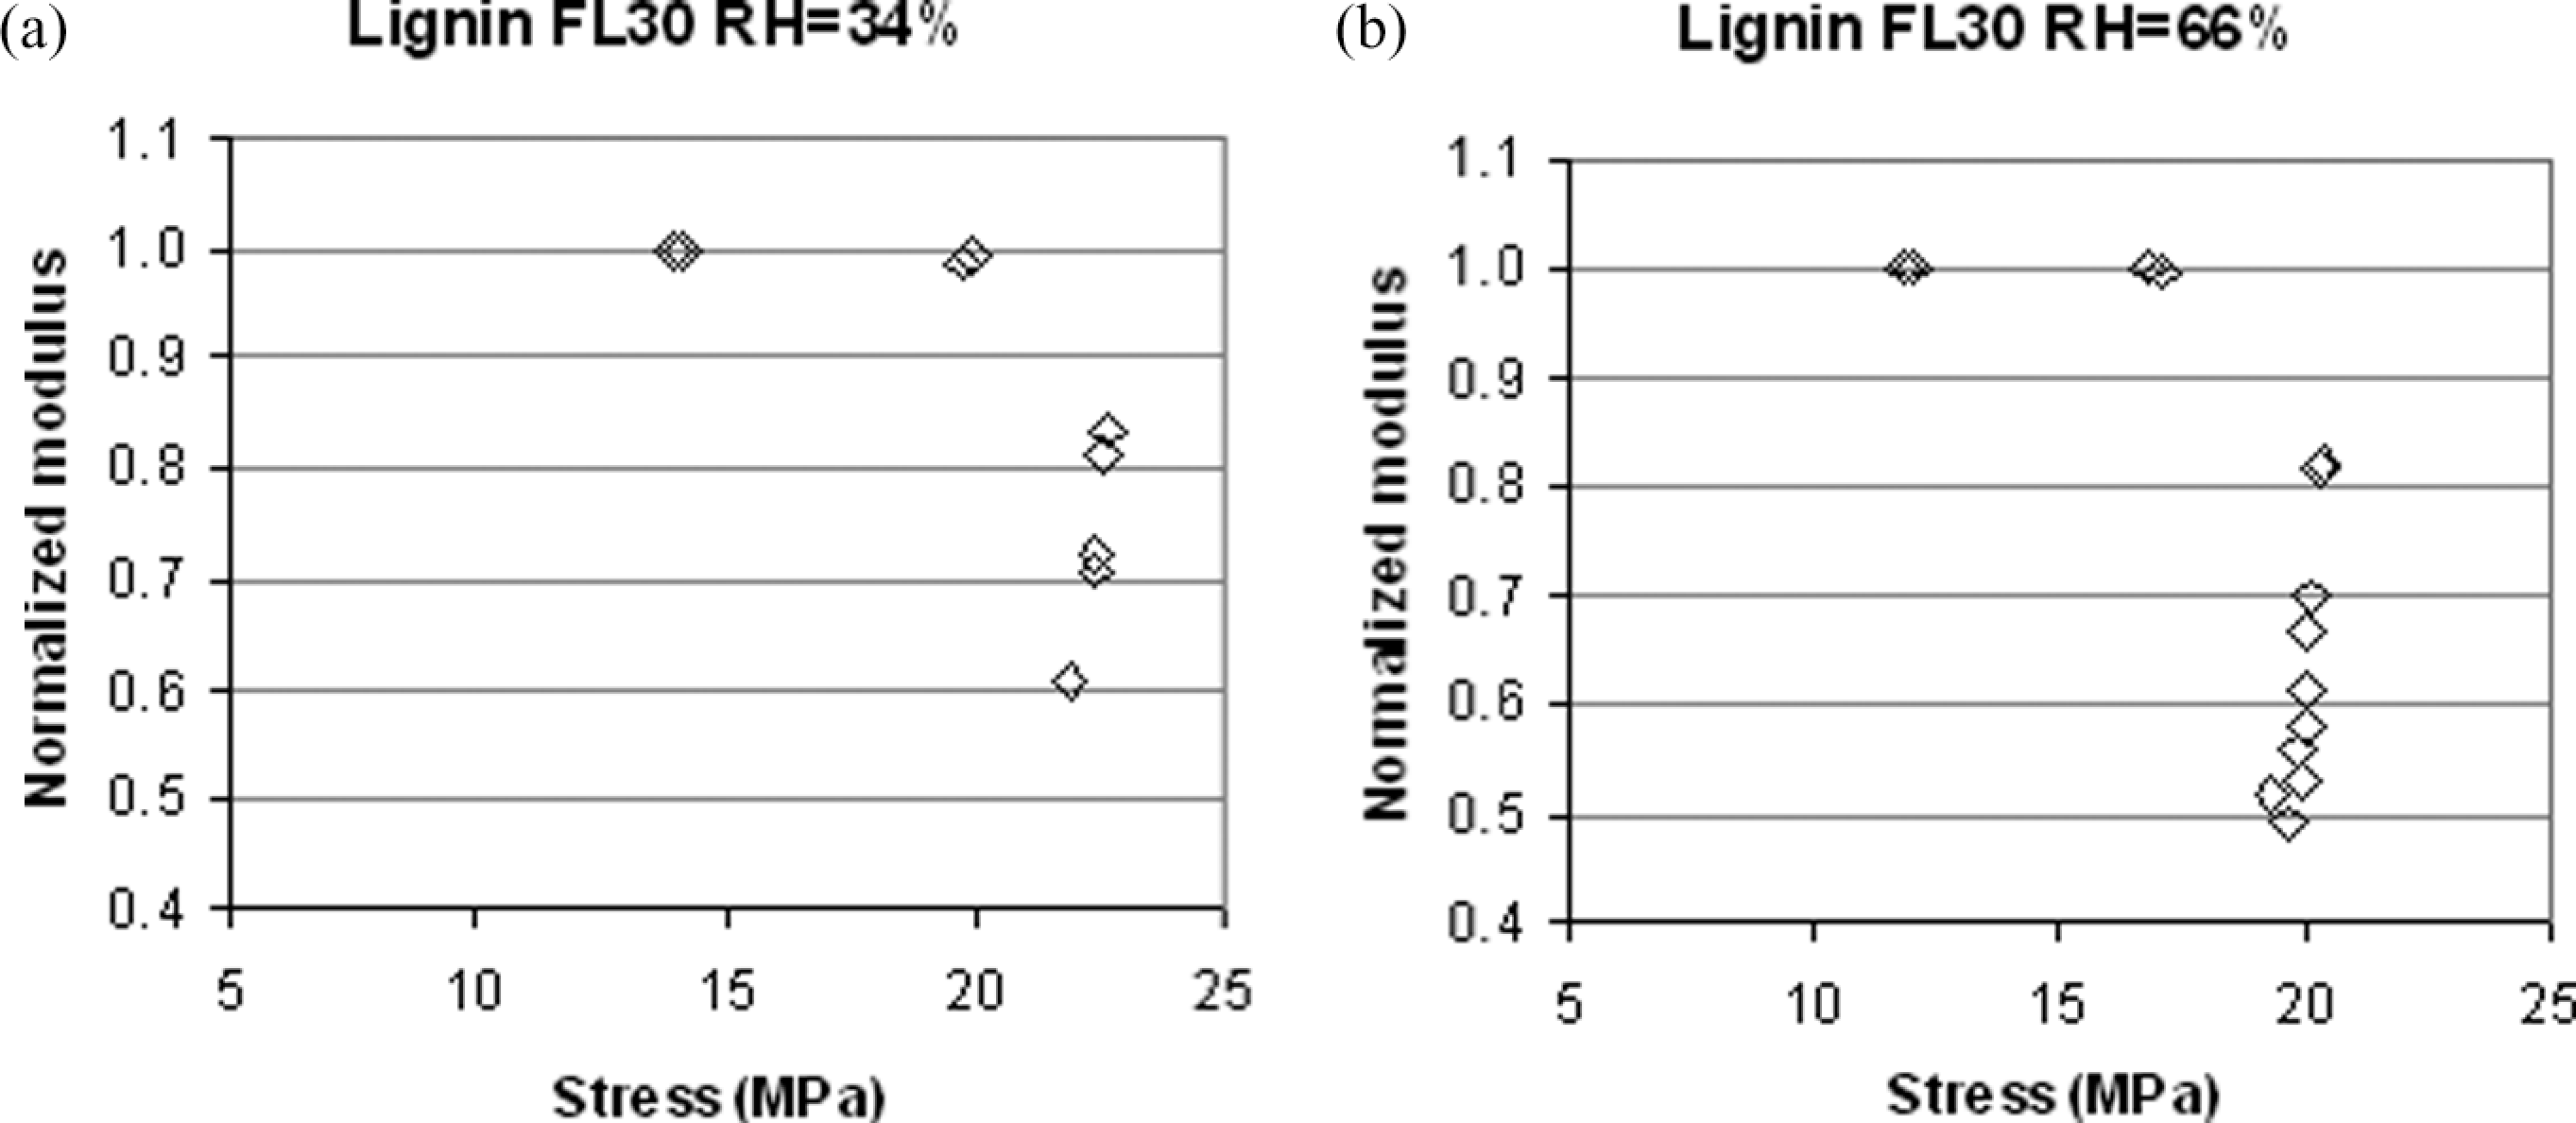
Elastic modulus reduction as a function of maximum applied stress for lignin-based composite with 30% flax fibers (lignin/FL30) at (a) relative humidity (RH) = 34%; (b) (RH) = 66%.
It seems that PLA-VF5 composite in comparison with PLA-NF10 has higher resistance to microdamage development. It could be due to the presence of more ductile VFs. The σmax for PLA-VF5 is lower because VF is more compliant than flax fibers in PLA-NF10 composite.
The elastic modulus reduction in Lignin/FL30 composite (see Figure 11) is much more dramatic. Reduction starts at stress 20% below the σmax reaching about 20% at σmax. The difference may be caused by much higher fiber content than in the PLA-based composites. The reduction before failure for RH = 34% specimens is 45% and even more (55%) for RH = 66% specimens.
Referring to Figure 3(a) where tensile loading curves of all three composites are shown, we may now conclude that the nonlinearity of PLA-based composites before reaching σmax is a result of viscoelasticity and viscoplasticity. In lignin matrix composite, these effects are superimposed by elastic modulus reduction. After σmax, the significance of the stiffness reduction on the loading curves is increasing, which partly explains the maximum in the stress–strain curves.
Creep test results
Strain development in a sequence of creep and recovery tests at three different stress levels 12, 15, 18 MPa is shown for PLA-NF10 composite in Figure 12(a) (RH = 34%) and Figure 12(b) (RH = 66%). After strain recovery, the permanent VP strains are rather small at RH = 34% for all stress levels. At RH = 66% and 18 MPa stress, the viscoplasticity becomes noticeably higher.
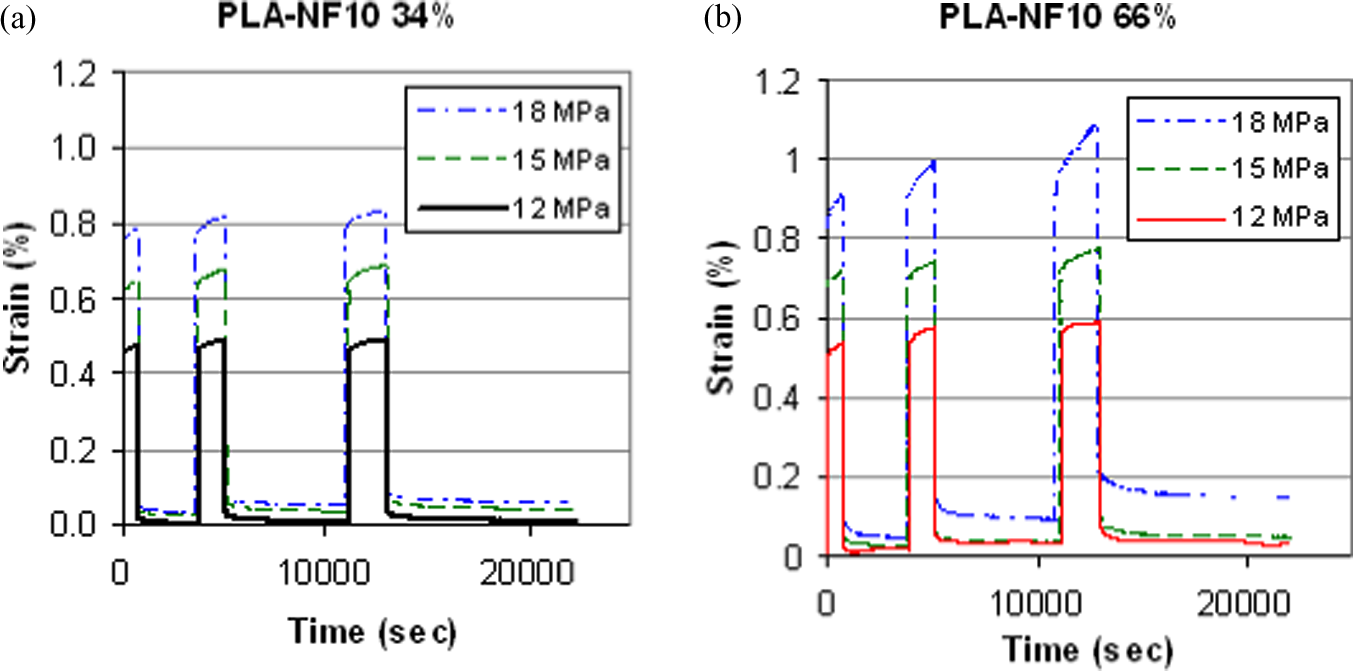
Strain in the sequence of creep and strain recovery tests at room temperature (RT) and (a) relative humidity (RH) = 34%, (b) (RH) = 66% for polylactic acid composites with 10% natural fiber (PLA-NF10).
The sequence of creep and recovery tests for PLA-VF5 composite leads to slightly unexpected results: even if the maximum stress before failure in this composite at RT (see Figure 3) was about 26 MPa; in creep all specimens failed at 16–17 MPa, as shown in Figure 13. The highest stress level at which it was possible to achieve systematic VP-strains is 15 MPa.
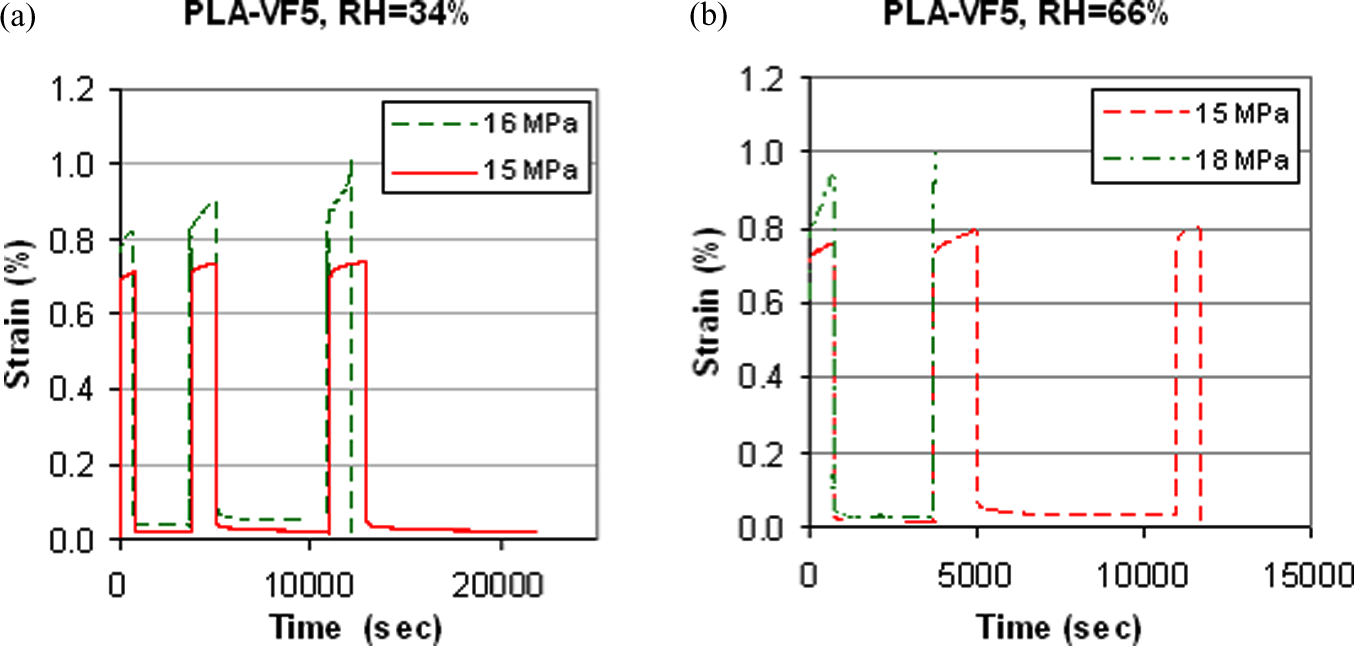
Sequence of creep and strain recovery tests for polylactic acid composites with 5% viscose fiber (PLA-VF5) at (a) relative humidity (RH) = 34% (specimen at 16 MPa failed in the third creep step); (b) (RH) = 66% (specimen at 18 MPa failed in the beginning of the second creep step, whereas specimen at 15 MPa failed during the third creep step).
The feature that specimens in a relatively short 1-h long creep test fail at stresses significantly lower than in the tensile test was also observed for PLA-NF10 composite. The corresponding stress values were around 18 MPa in creep and 26–29 MPa in tensile test.
VP strain development in lignin matrix composite reinforced with 30% flax fibers is shown in Figure 14. VP strains are very low at 12 MPa and they are drastically increasing at stresses higher than 14 MPa.
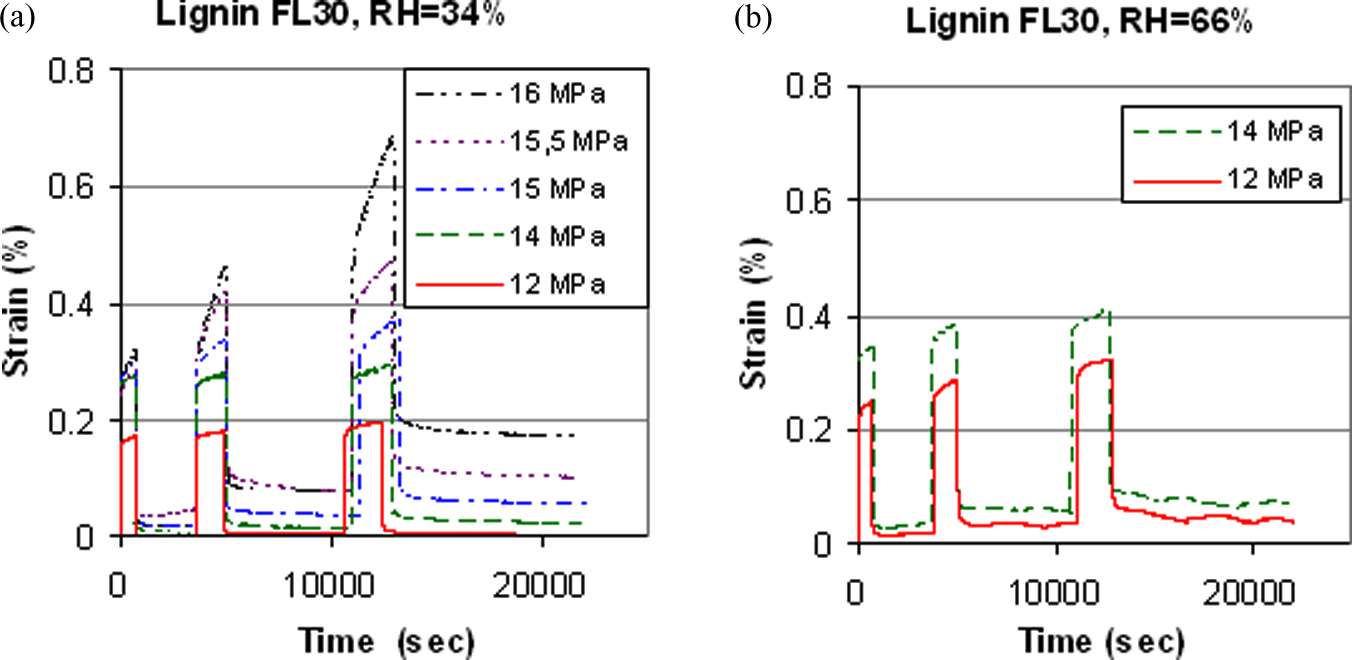
Sequence of creep and strain recovery tests for lignin-based composite with 30% of flax fibers (lignin/FL30) composite at (a) relative humidity (RH) = 34% and (b) (RH) = 66%.
For lignin composite conditioned and tested at high RH (RH = 66%), the VP strain data are limited to 14 MPa due to specimen creep failure. It was similar as was described for PLA composites: the maximum stress in tensile tests at RH = 66% was about 20 MPa; but in creep at more than 14 MPa, this composite failed after a couple of minutes.
The slightly waved shape of the strain recovery curves in Figure 14(b) is caused by the variation in the moisture content during the test. The RH in winter in the testing location (North of Sweden) is about 5–20% which is very different from RH = 66% required during testing and used during conditioning. The device ensuring RH = 66% during the test had a timer with a 60-min cycle and the variation in RH was between 55% and 75%. Since lignin is very sensitive to moisture changes, it rapidly responded to humidity variation during test. The average over a cycle was used as the value of the irreversible strain.
In Figure 15(a), the VP strains in PLA-NF10 and lignin-FL30 composites are compared at 12 MPa and in Figure 15(b) at 15 MPa.
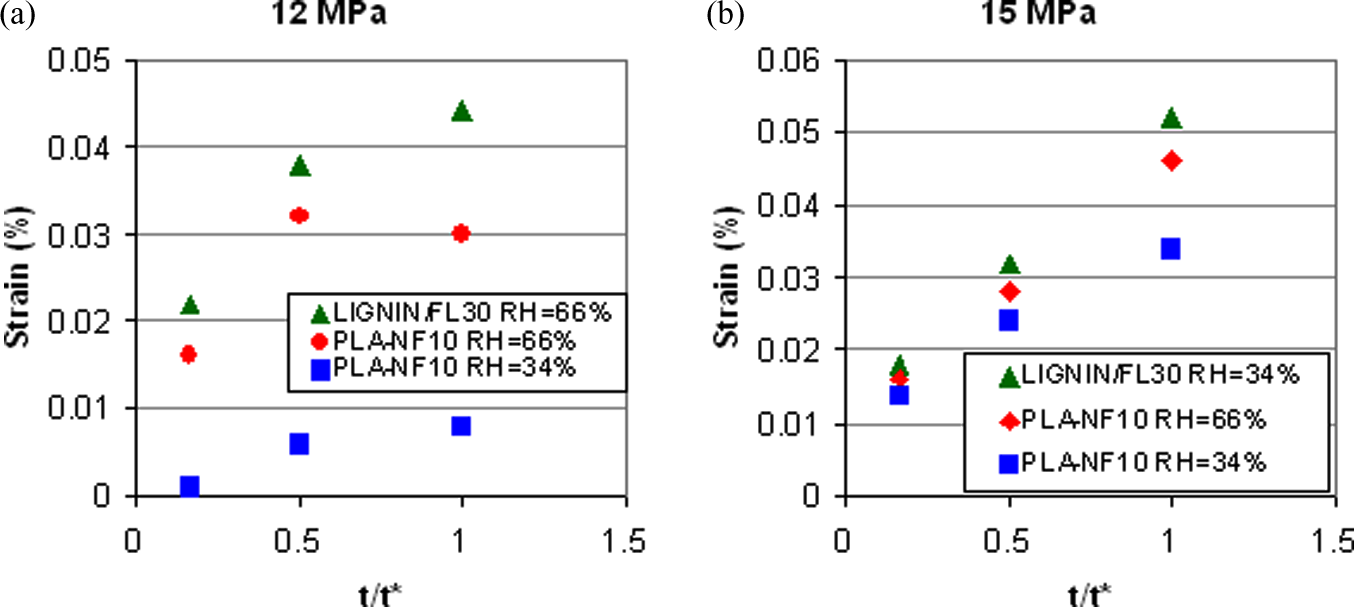
Viscoplastic strain development in creep tests: (a) at 12 MPa and (b) at 15 MPa (t* = 60 min).
According to Figure 15, VP strains are higher in lignin-based composites irrespective of the RH. The effect of humidity is relatively larger at the low-stress level (12–15 MPa).
More detailed analysis of viscoplastic and viscoelastic phenomena in PLA-NF10 composite reader can be found in Ref 19 where the model for this material is also developed.
Conclusions
The effect of temperature and RH on mechanical behavior in tension of flax fiber-reinforced thermoplastic matrix composites of bio-origin (PLA and lignin) has been studied experimentally. In one of the PLA-based composites, flax fibers were replaced by VFs.
If the behavior of materials is considered as linear elastic the stress at maximum would be overestimated by 40–50%. All materials are temperature sensitive in the studied temperature region between room temperature (RT = 22°C) and 35°C.
To explain the nonlinearity, stiffness degradation due to microdamage as well as development of viscoelastic and VP strains were analyzed at room temperature.
Microdamage accumulation in PLA-based composites is not significant—for composite with 5% VFs there is no modulus reduction at all whereas in flax fiber composites a small (less than 10%) reduction was observed after reaching the stress maximum. In the lignin-based composite the modulus reduction starts before the stress reaches the maximum and just before failure the degradation level can reach 50%. With increasing RH, these effects are slightly larger.
The time-dependent phenomena were analyzed in short-term creep and strain recovery tests demonstrating significantly higher VP strain in lignin composites. Both, viscoelastic and VP strains are significantly larger at higher RH.
Footnotes
Acknowledgements
Tecnaro (Germany) is acknowledged for supplying specimens for this study.
Funding
The work has been partly supported by the EU sixth framework program project. ‘New classes of engineering composite materials from renewable resources,’ BIOCOMP; contract grant number: IP 515769-2.