
Abstract
Almost all materials exhibit sensitivity of mechanical properties to temperature. Polylactic acid (PLA), an amorphous polymeric material, also exhibits this type of behavior. Because of its limited application in structural purpose, very few journals and articles study the ductile–brittle transition temperature (DBTT) of polymeric materials, especially PLA. It is necessary to determine DBTT to avoid brittle and catastrophic failure. This article determined the ductile-to-brittle transition of various PLA-based biocomposite. A comprehensive database was developed to determine the DBTT of PLA, PLA-20KF, PLA-20KF-5Clay, and PLA-5Clay. Impact tests were carried out on unnotched standard specimens at temperatures ranging from −5°C to 28°C. The result shows that higher percentage of filler namely PLA-20KF and PLA-20KF-5Clay show lower impact strength and no significant decrease in impact strength with temperature. In contrast, lower percentage of filler such as PLA and PLA-5Clay shows better impact strength and comparatively sharp decrease in impact strength with temperature. Dynamic mechanical analysis (DMA) and fractographic analysis confirmed these statements that brittle fracture was observed in higher percentage of filled biocomposites whereas comparatively ductile fracture in lower percentage of filled biocomposites.
Introduction
Nowadays the use of polymer materials in structural application has been increased significantly. They have to be stiff and strong for structural application. Glassy polymers usually show this type of properties. The main problem of that kind of materials is temperature sensitiveness. In a certain temperature region, they become brittle as glass. This region is usually known as ductile-to-brittle transition region. Not all materials show this region. Usually body-centered cubic (BCC) polymers, Hexagonal Close Pack (HCP) and almost all polymer materials show this behavior. 1
Polylactic acid (PLA) is a rigid thermoplastic polymer that can be semicrystalline or totally amorphous, depending on the stereopurity of the polymer backbone. 2 The physical characteristics of high-molecular-weight PLA are to a great extent dependent on its transition temperatures for common qualities such as density, heat capacity, and mechanical and rheological properties. In the solid state, PLA can be either amorphous or semicrystalline, depending on the stereochemistry and thermal history. For amorphous PLAs, the glass transition (Tg) determines the upper use temperature for most commercial applications. For semicrystalline PLAs, both the Tg (∼58°C) and melting point (Tm), 130° −230°C (depending on structure) are important for determining the use of PLA across various applications. Both of these transitions, Tg and Tm, are strongly affected by the overall optical composition, primary structure, thermal history, and molecular weight. Above Tg, the amorphous PLAs transition from glassy to rubbery and will behave as a viscous fluid upon further heating. Below Tg, the PLAs behave as a glass with the ability to creep until cooled to its β transition temperature of approximately −45°C. Below this temperature, PLA will only behave as a brittle polymer. 3–7 PLA shows high stiffness and modulus and when incorporated with filler materials shows much higher properties than PLA itself.8,9 PLA and its composite is a strong candidate to become a structural material. Like all polymer materials, PLA and its composites are also sensitive to temperature. They also go through the ductile–brittle transition temperature (DBTT) region.
Kenaf fiber (KF), which is extracted from the Hibiscus cannabinus L plant, is receiving attention through the combination of its fibers with thermoplastics and sometimes combined with the filler materials to develop new types of composites and hybrid composite. Apart from its lower cost, KF is also low in density, nonabrasive, and biodegradable and has fairly good mechanical properties.10–12 KF, which is derived from renewable resources, is suitable for use in automotive applications, building, appliance, and so on.
The ductile-to-brittle transition is characterized by a sudden and dramatic drop in the energy absorbed by a material subjected to impact loading. This transition is practically unknown in face-centered cubic (FCC) metals but is well known in BCC and polymer materials. 13
Moving through from very low temperature, where the molecule of the polymer materials is tightly compressed, and the material go through solid state transitions. While the material warms and expands, the free volume increases and the localized bond (bending and stretching) and side chain movements occur. This is referred to as the gamma transition, T γ, which may also involve associations with water. 14 As the temperature and the free volume continue to increase, the whole side chains and localized groups of four to eight backbone atoms begin to get enough space to move and the material starts to develop some toughness. 15 This transition, called the beta transition T β, is not clearly visible sometime. Often it is the T g of a secondary component in a blend or of a specific block in a block copolymer. 16
While heating continues, the T g or glass transition will occur, where the chains in the amorphous regions begin to coordinate large-scale motions. This is due to the commencement of melting in amorphous region. Since the T g only occurs in amorphous material, in a 100% crystalline material T g would not be seen. Continued heating leads to Ta* (Slippage temperature) and T ll (Movement temperature of coordinate segment). The former occurs in crystalline or semicrystalline polymer and is due to the slippage of the crystallites past each other. The latter is a movement of coordinated segments in the amorphous phase that relates to reduced viscosity. These two transitions are not accepted by all, and their existence is still a matter of disagreement. Finally, melting occurs wherever there is a large-scale chain slippage leading to the flow of material. This is referred to as the melting temperature, T m. For a cured thermoset, nothing happens after the T g until the sample begins to burn and degrade because the cross-links prevent the chains from slipping past each other. 17
One of the primary functions of impact test is to determine whether a material experiences a ductile-to-brittle transition with decreasing temperature and, if so, the range of temperatures at which it occurs. The DBTT is dependent on the temperature of the impact energy absorbed. 1 During the impact test, the energy lost by the pendulum during the breakage of the specimen is the sum of the energies required (i) to initiate the fracture of the specimen, (ii) to propagate the fracture across the specimen, (iii) to throw the free end of the broken specimen, (iv) to bend the specimen, (v) to produce vibration in the pendulum arm, (vi) to produce vibration or horizontal movement of the machine frame or base, (vii) to overcome friction in the pendulum bearing and in the excess energy indicating mechanism, and to overcome windage, (viii) indent to deform of the sample plastically at the line of impact, and (ix) to overcome the friction caused by the rubbing the striking nose of the face of the bent specimen. 18
For relatively brittle materials, the fracture propagation energy is small in comparison with the fracture initiation energy, the indicated impact energy absorbed is, for all practical purposes, the sum of the items (i) and (iii) listed in the previous paragraph. For tough, ductile materials, the fracture propagation energy may be larger compared to fracture initiation energy. 19
An extensive examination of a fracture surface will reveal whether the failure occurred due to the ductile or brittle nature of the material. To the unaided eye, a brittle fracture surface has a grainy, salt, and pepper appearance. Examination with a scanning electron microscope (SEM) clearly reveals the cleavage appearance, river lines, and planar microcracks which are characteristic of brittle fracture. 20 Brittle fracture can occur intergranularly or transgranularly. Ductile fracture can be recognized by its dull appearance. Ductile fracture is usually transgranular and its fracture surfaces show a significant amount of plastic deformation between roughly spherical microvoids. 21 These statements are suitable for metal fractography. But for polymer matrix composites fiber pull out, stress whitening and microbuckling are the indications of ductile failure; whereas fiber cracking, matrix cracking and kink band are the indications of brittle failure. 22
In this article, an attempt was made to determine the DBTT for PLA and PLA-based biocomposites. This is done by a series of impact tests at different temperatures and the ductile and brittle fracture was figured out. Dynamic mechanical analysis (DMA) and fractography analysis strengthen the experimental results.
Experimental
Materials
PLA and three PLA-based composites were considered for observation. All the composites were made using PLA, kenaf, and nanoclay.
PLA: 3051D graded PLA produced by NatureWorks® (USA) was in pellet form. Its specific gravity is 1.24 g/cm3 and the crystalline melt temperature and glass transition temperature are 145–155 and 55–65°C, respectively.
Nanoclay: Nanomers® I.31PS was used as reinforcement, which was manufactured by Nanocor, Inc (St Louis, USA). It comes in powder form, with a mean size of 15–25 μm. It is an onium ion-modified montmorillonite designed for maximum compatibility and dispersion in a polyolefin matrix. In addition to the typical onium treatment, Nanomer I.31PS contains a silane-coupling agent to promote the properties of higher tensile strength. It contains 0.5–5 wt% aminopropyltriethoxysilane and 15–35 wt% octadecylamine.
Kenaf fiber: KF was obtained from Kenaf Natural Fibre Industries Sdn. Bhd., Kelantan, Malaysia. The stalk of the kenaf plant consists of two distinct fiber types. The outer fiber is called the bast and the inner fiber is the core.
Preparation and processing
All the composites that were produced underwent the extrusion process at 180°C followed by injection molding at 200°C. Before the extrusion, a rigorous manual mixing occurred. 100PLA was the only material that directly underwent injection molding without the extrusion process. BATTENFELD HM 600/850 injection molding machine was used for injection and Brabender twin screw extruder was used for extrusion. After completing the extrusion process, four different composites were obtained. They are listed in Table 1.
Compositions and names of composites
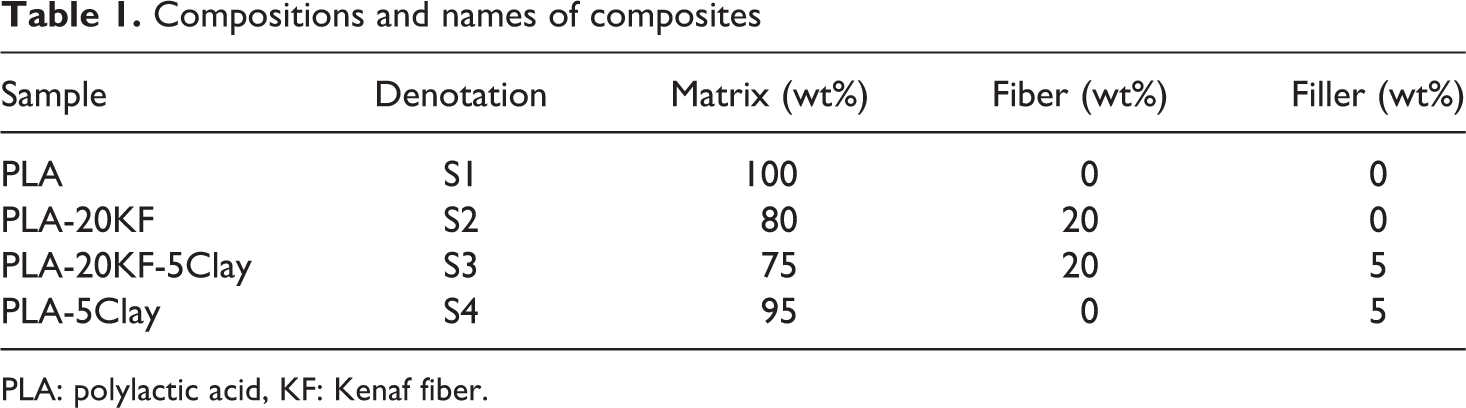
PLA: polylactic acid, KF: Kenaf fiber.
Apparatus and methods
The Charpy impact test for the unnotched specimens was carried out at four different temperatures (−5, 9, 20 and 28°C) using Simens SIMATIC OP7 Dynisco USA polymer test machine according to ASTM 256 standards. The dimension of the samples was 50 × 12.62 × 3.18 mm. Several samples of each composition were performed at all the four temperatures. The applied load was 4 kN. Fractography analysis was done for all the four PLA-based biocomposite using FEI QUANTA 200 SEM, and CM 12 PHILIPS transmission electron microscope (TEM) was used to observe the dispersion and interaction of fiber and filler. DMA was done using Perkin Elmer dynamic mechanical analyzer to measure the storage modulus, loss modulus, glass transition and β-transition phenomena. Because of the high hardness of PLA, three-point bend fixture was used for DMA, with a heating rate of 5°C/min. Temperature range was −80 to 100°C and frequency was 1 Hz.
Results and discussion
It is well known that brittleness is related to impact resistance. The two most common measures of that resistance are the charpy impact energy and the izod impact energy. The main differences between charpy and izod are—charpy determines the breaking energy per unit cross-sectional area, whereas izod determines the breaking energy per unit specimen thickness at the breaking point. The izod test is inherently less accurate than the charpy test because the specimen geometry of the former is not symmetric (half of the specimen inside a vise and half out), while in the latter there is symmetry with respect to the center of the tested specimen. 23
During the impact test, the energy absorbed by the breaking specimen is calculated as the difference between the height of the pendulum at its release and height of its swing, minus a correction factor of its direction. Then the charpy impact strength is calculated by dividing the absorbed energy by the cross-sectional area, whereas for izod strength the absorbed energy is divided by the thickness. In this article, the charpy impact test was carried out to determine DBTT.
From Figure 1, it can be inferred that for all the four samples, the impact strength increased with temperature. This is because, at high temperature the polymer chains are loosely bound to each other and the entangles between chains are not so intensive. Reversely it can be said that at low temperature the polymer chains become much more rigid and failed to absorb more energy.
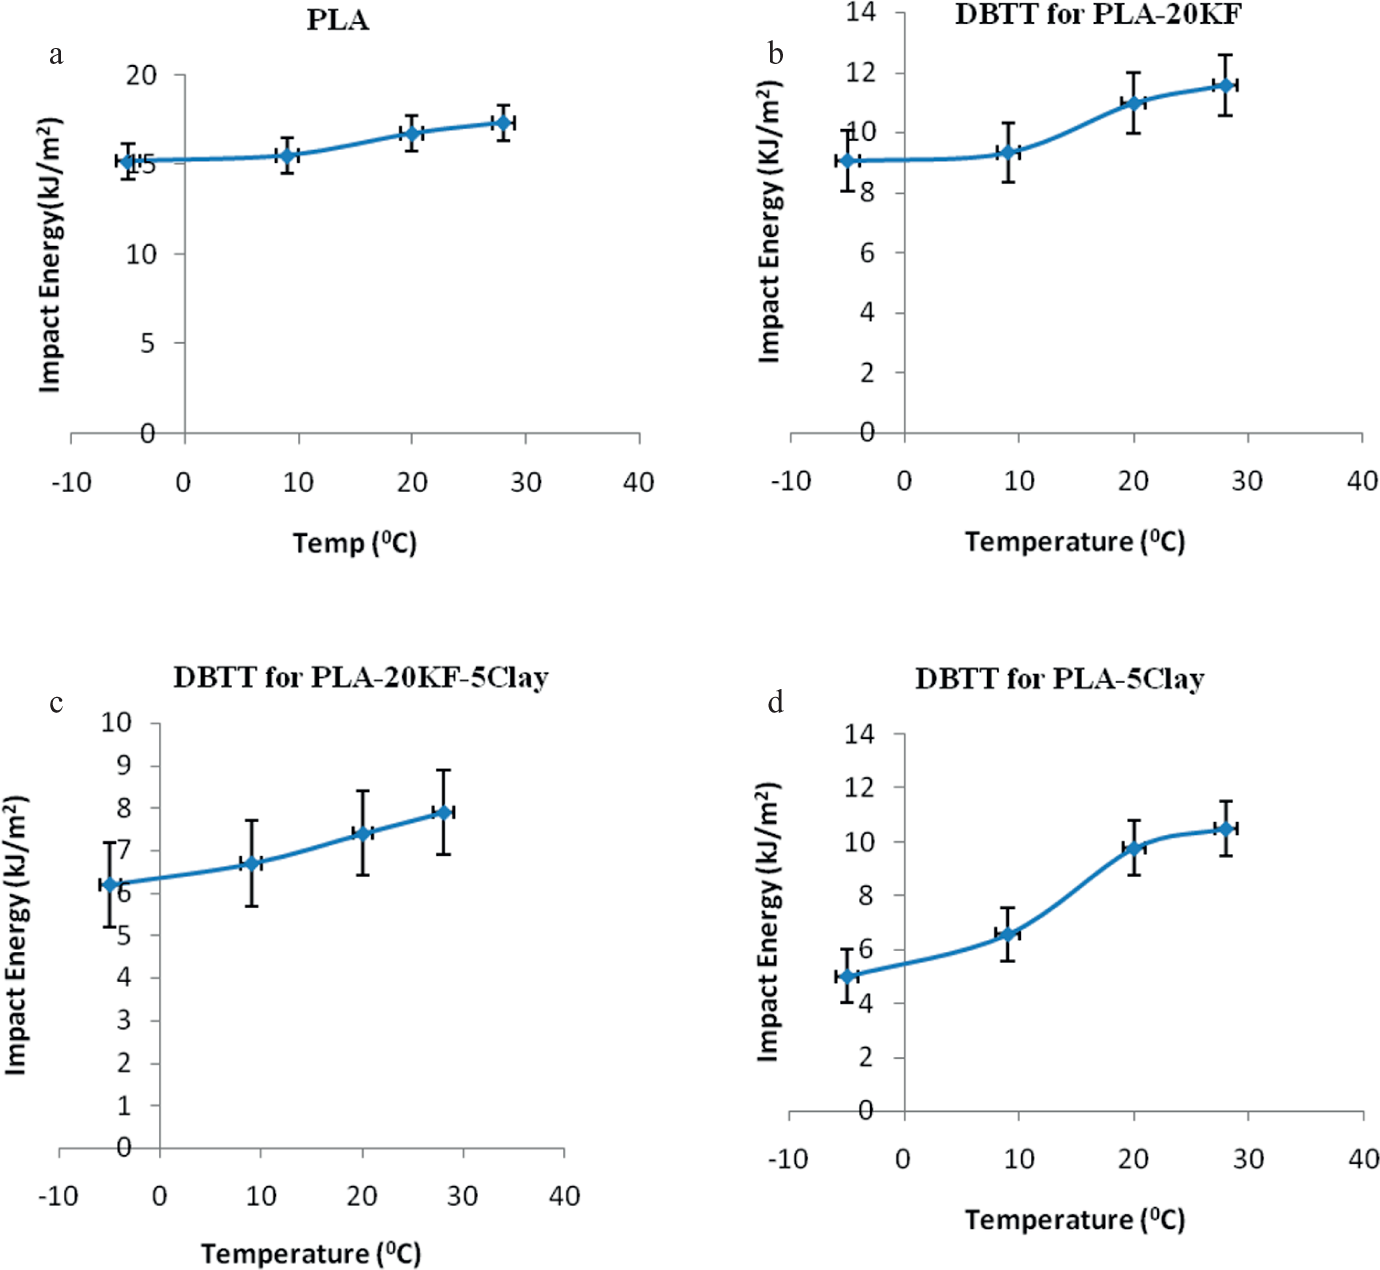
Impact energy versus temperature curve for (a) polylactic acid (PLA), (b) PLA-20 Kenaf fiber (KF), (c) PLA-20KF-5Clay, and (d) PLA-5Clay.
Again it can be observed that the impact strength decreased when the percentage of filler materials is increased. This is because the filler materials acted as obstacle for the movement of the polymer chains. So, higher percentage of filler materials creates more obstacles which lead to less movement of polymer chains and finally less absorption of energy. S3, which has highest amount of filler materials, shows lowest impact strength; whereas S1, with no filler materials, shows the highest impact strength. For S4, the impact strength is quite different than other samples. This is because S4 contains only 5% of nanoclay, which has very high aspect ratio and acts significantly different than microfiber-reinforced composite.
From fractographic and morphological observation, it can also be inferred that whether the fracture is ductile or brittle. Figure 2 represents the SEM fractograph with a magnification of ×500 for all four samples. From Figure 2(b) and (c), it can be seen that the fiber cracking and fiber breakdown are accompanied with little debonding and fiber pull out. High amount of fiber cracking indicates brittle fractures which support the experimental value. Figure 2(b) and (c) also shows the craggy distribution of the matrix (PLA) which indicates that the matrix was hindered by the fiber during movement, hence dictate for brittle fracture. Figure 2(a) and (d) represents the fractograph of S1 and S4. In Figure 2(a), the beach marks are quite larger than that of Figure 2(d). Because of nano-size of the clay, it is difficult to observe them in SEM fractograph. Well-dispersed nanoclay in the matrix hardened the composite as well as increased the brittleness. Due to its high aspect ratio, nanoclay shows higher strength and moderate impact energy at room temperature.
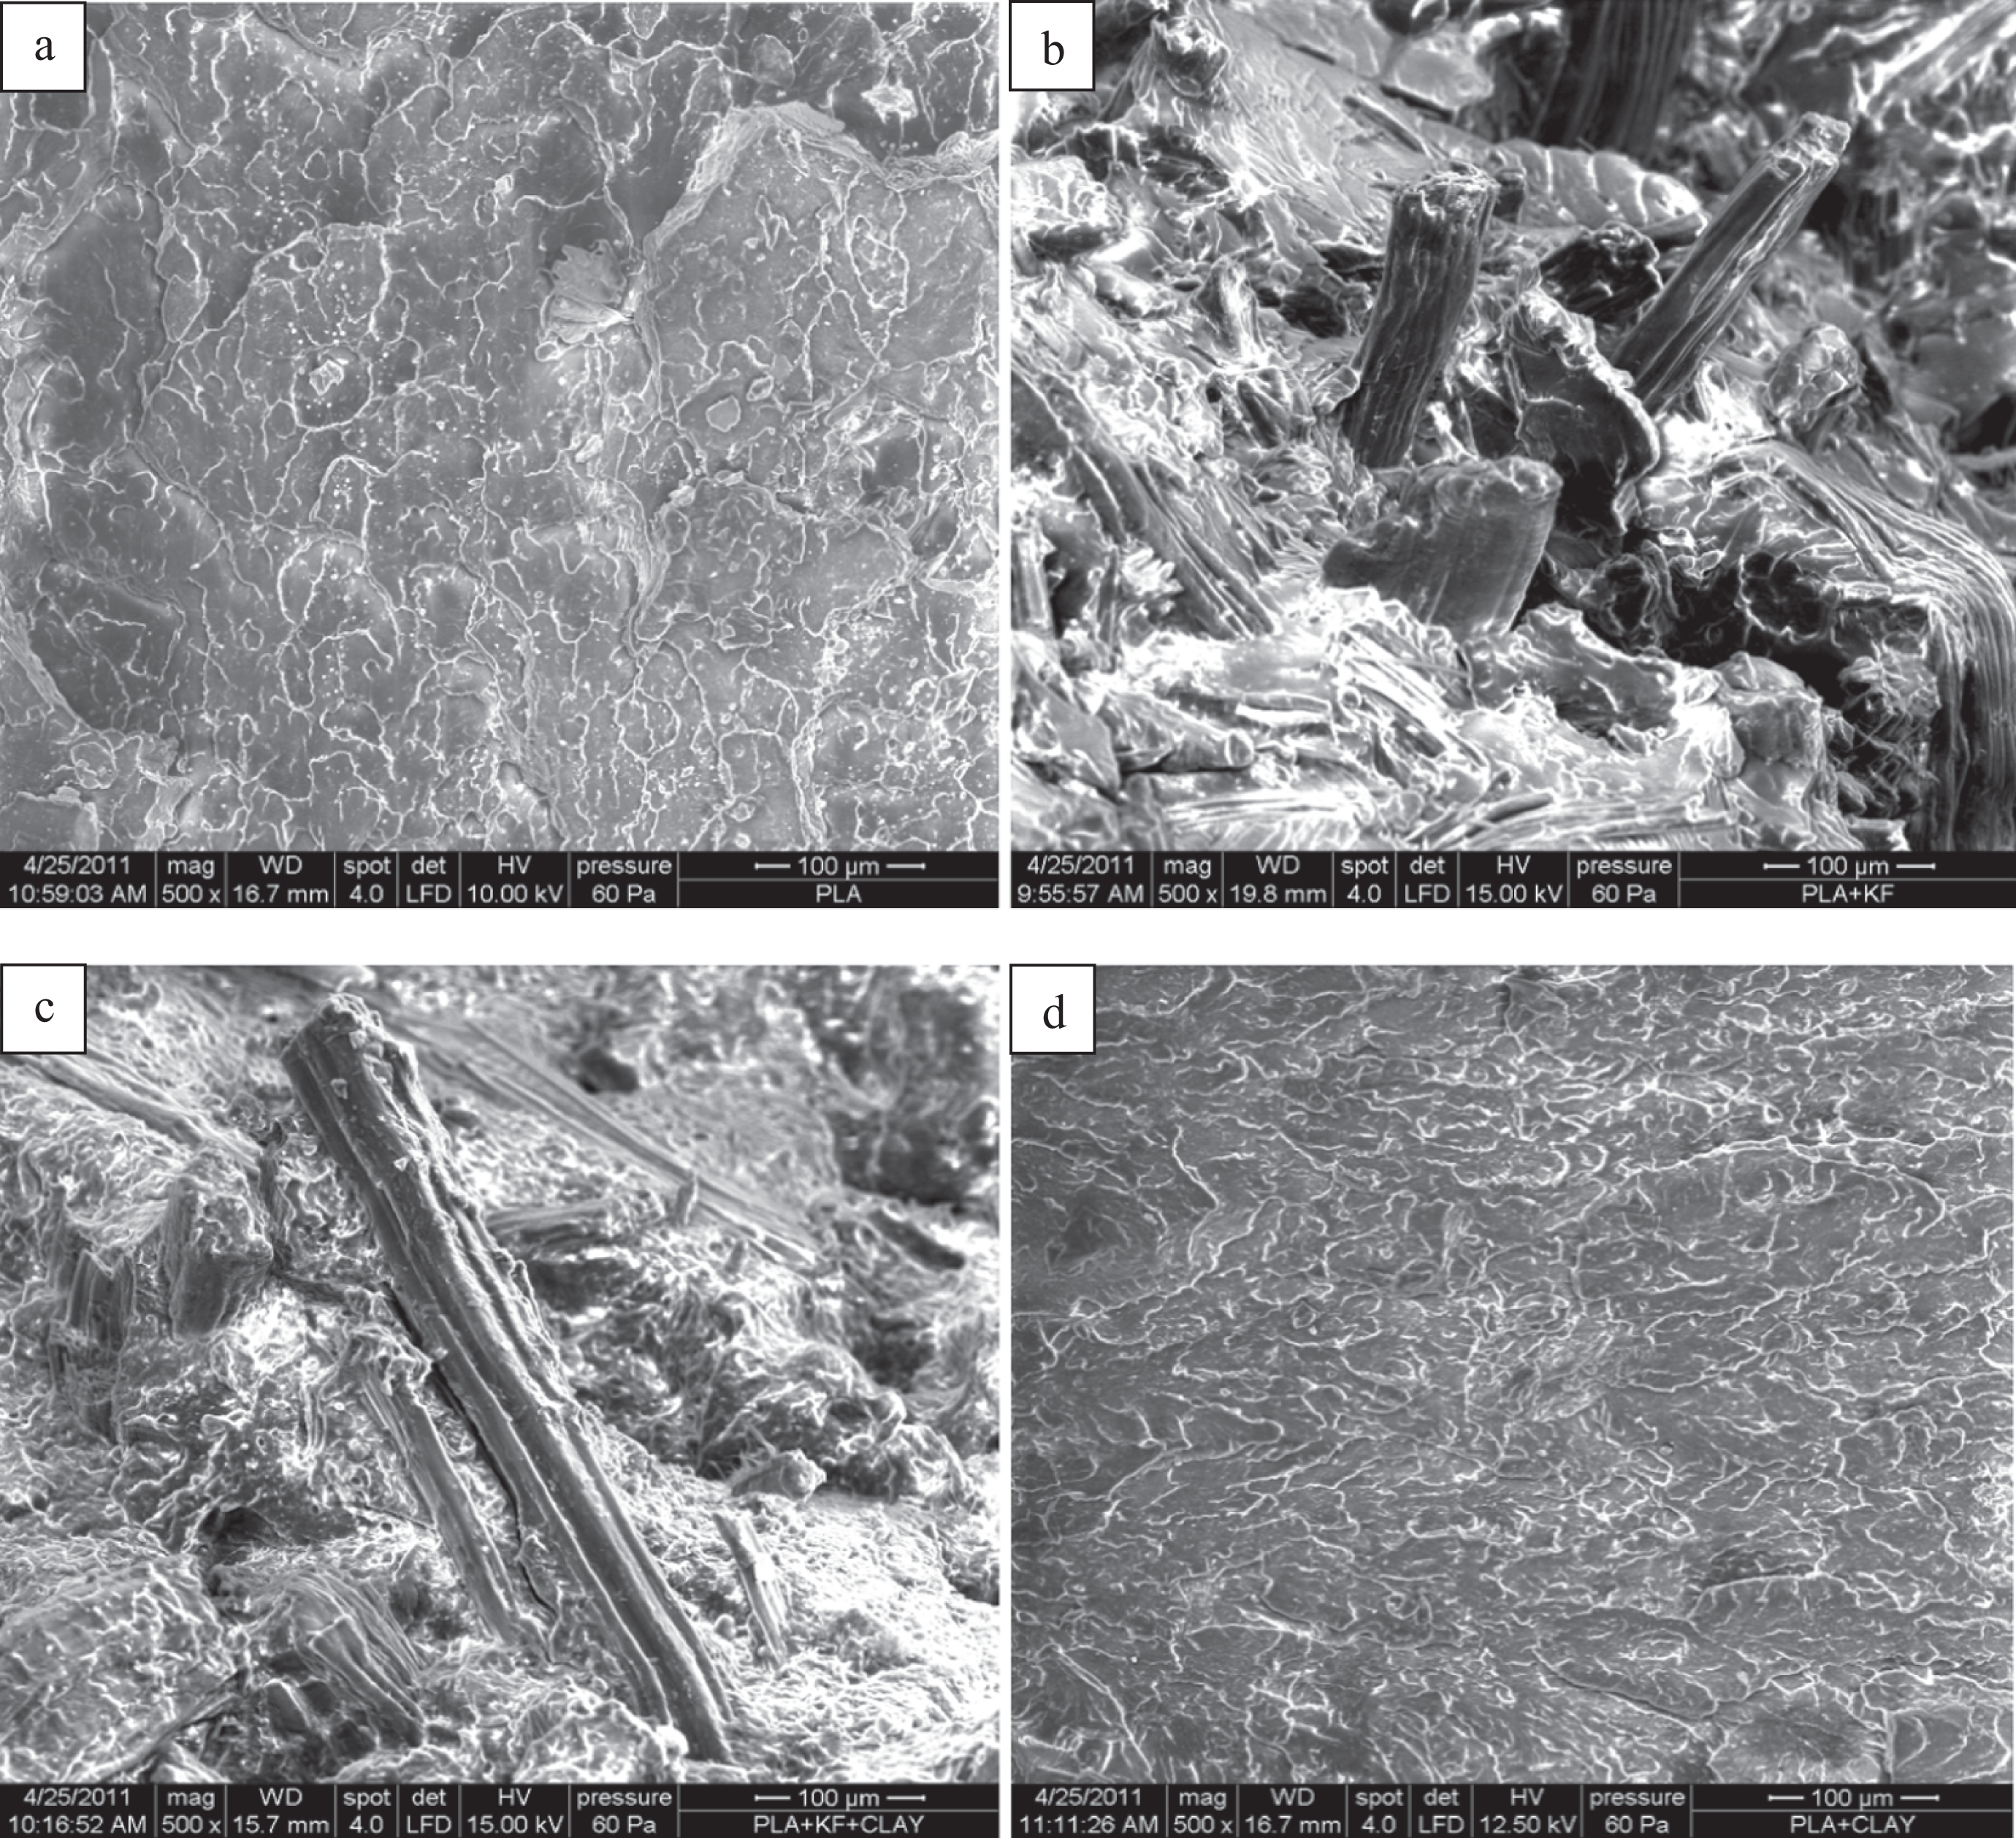
Scanning electron microscope (SEM) fractograph of (a) polylactic acid (PLA), (b) PLA-20KF, (c) PLA-20 Kenaf fiber (KF)-5Clay, and (d) PLA-5Clay.
Now a question may arise—S3 also contains nanoclay, then why does it show less impact strength? To know the answer it is necessary to observe the dispersion of nanoclay and the interaction of fiber and nanoclay. Figure 3 shows the TEM image at ×8800 magnification for all the four samples. In Figure 3(a) only PLA is observed, whereas Figure 3(b) shows PLA matrix and kenaf short fiber in TEM image. Figure 3(d) indicates well-dispersed nanoclay in PLA, though there are some agglomeration of nanoclays. The uniform distribution of nanoclay in the matrix makes the composite comparatively tougher. As can be seen in Figure 3(c), most of the nanoclays adhere to the fibers and they are not well dispersed in the matrix. The combination of fibers with nanoclays hardened the composite and finally decreased the impact energy.
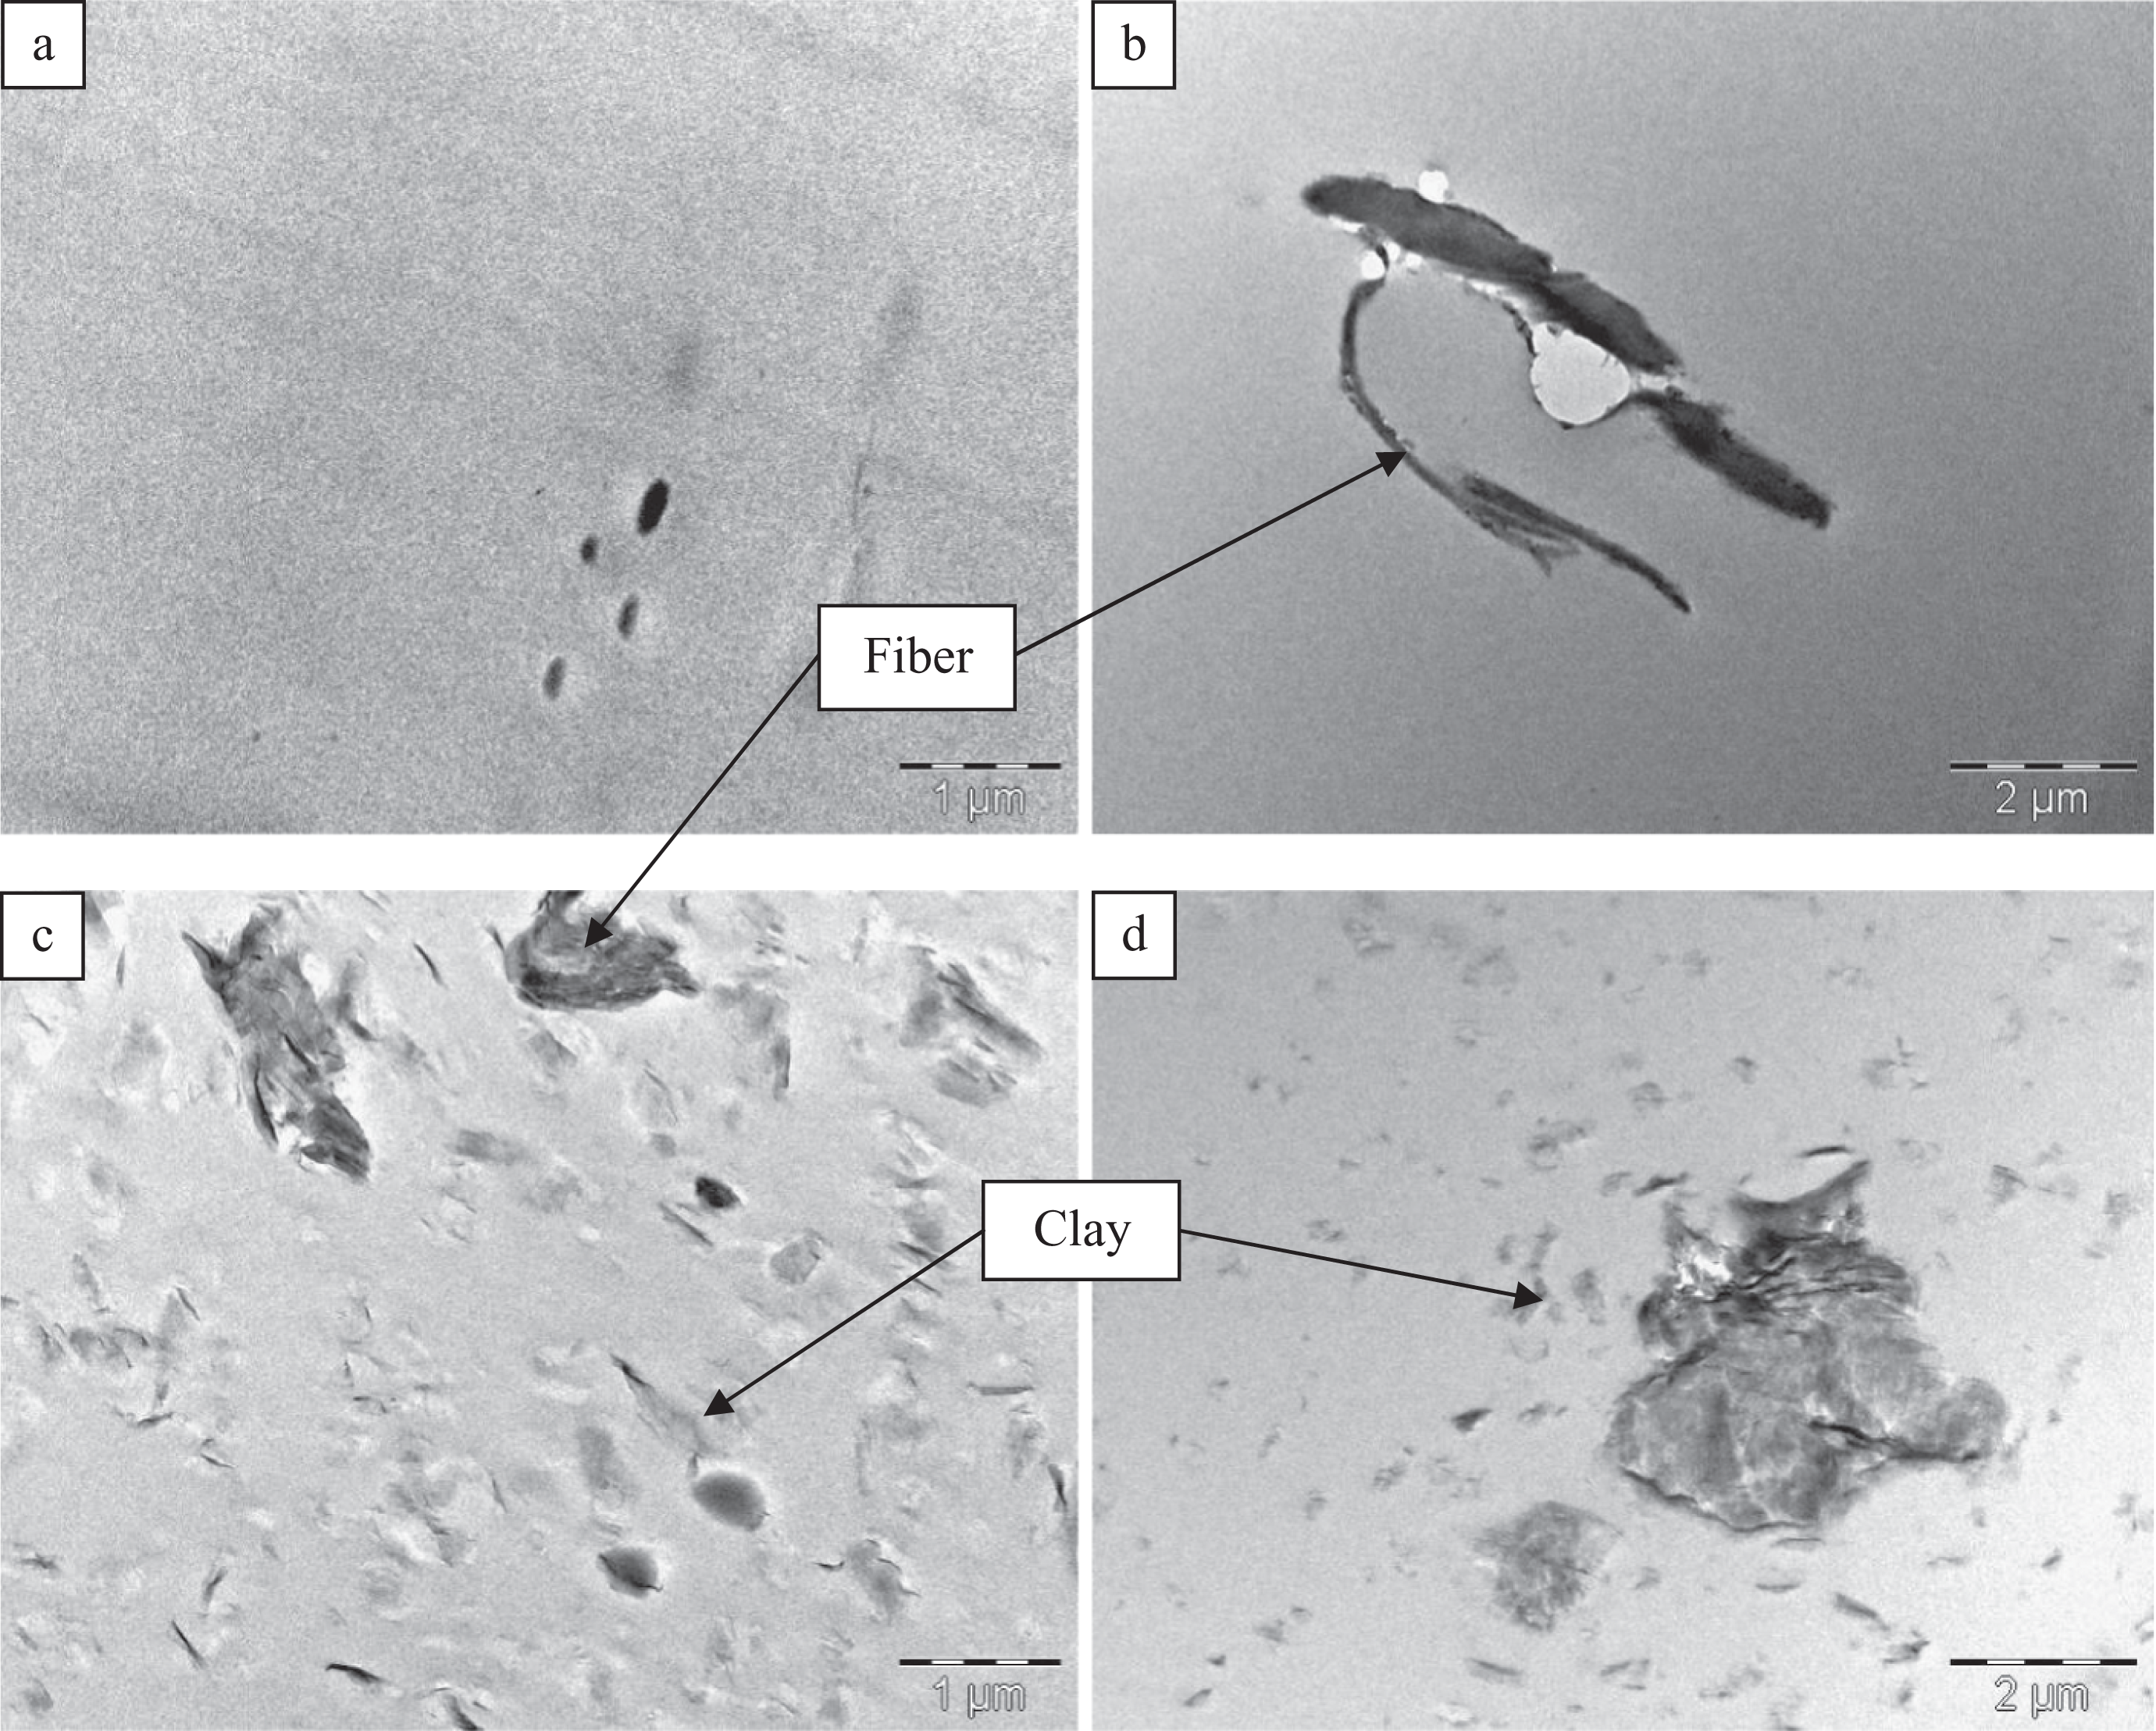
Transmission electron microscope (TEM) image of (a) polylactic acid (PLA), (b) PLA-20 Kenaf fiber (KF), (c) PLA-20KF-5Clay, and (d) PLA-5Clay.
DMA also supports the fractography analysis. From DMA, it can also be stated that both storage modulus (E′) and loss modulus (E′) increase with filler and fiber (Figure 4a and b), which indicates higher toughness and restriction of chain movement in the matrix. Storage modulus curve is also a good indicator of T g, and the T g values of S1, S2, S3, and S4 are 55.4, 56.5, 57.5, and 58°C, respectively. The increment of 2 to 3°C of the T g values is very important for any polymer and composite materials because the working temperature range of polymer and their composites is from β-transition (T β) temperature to T g. So even a small increment in T g is very significant.
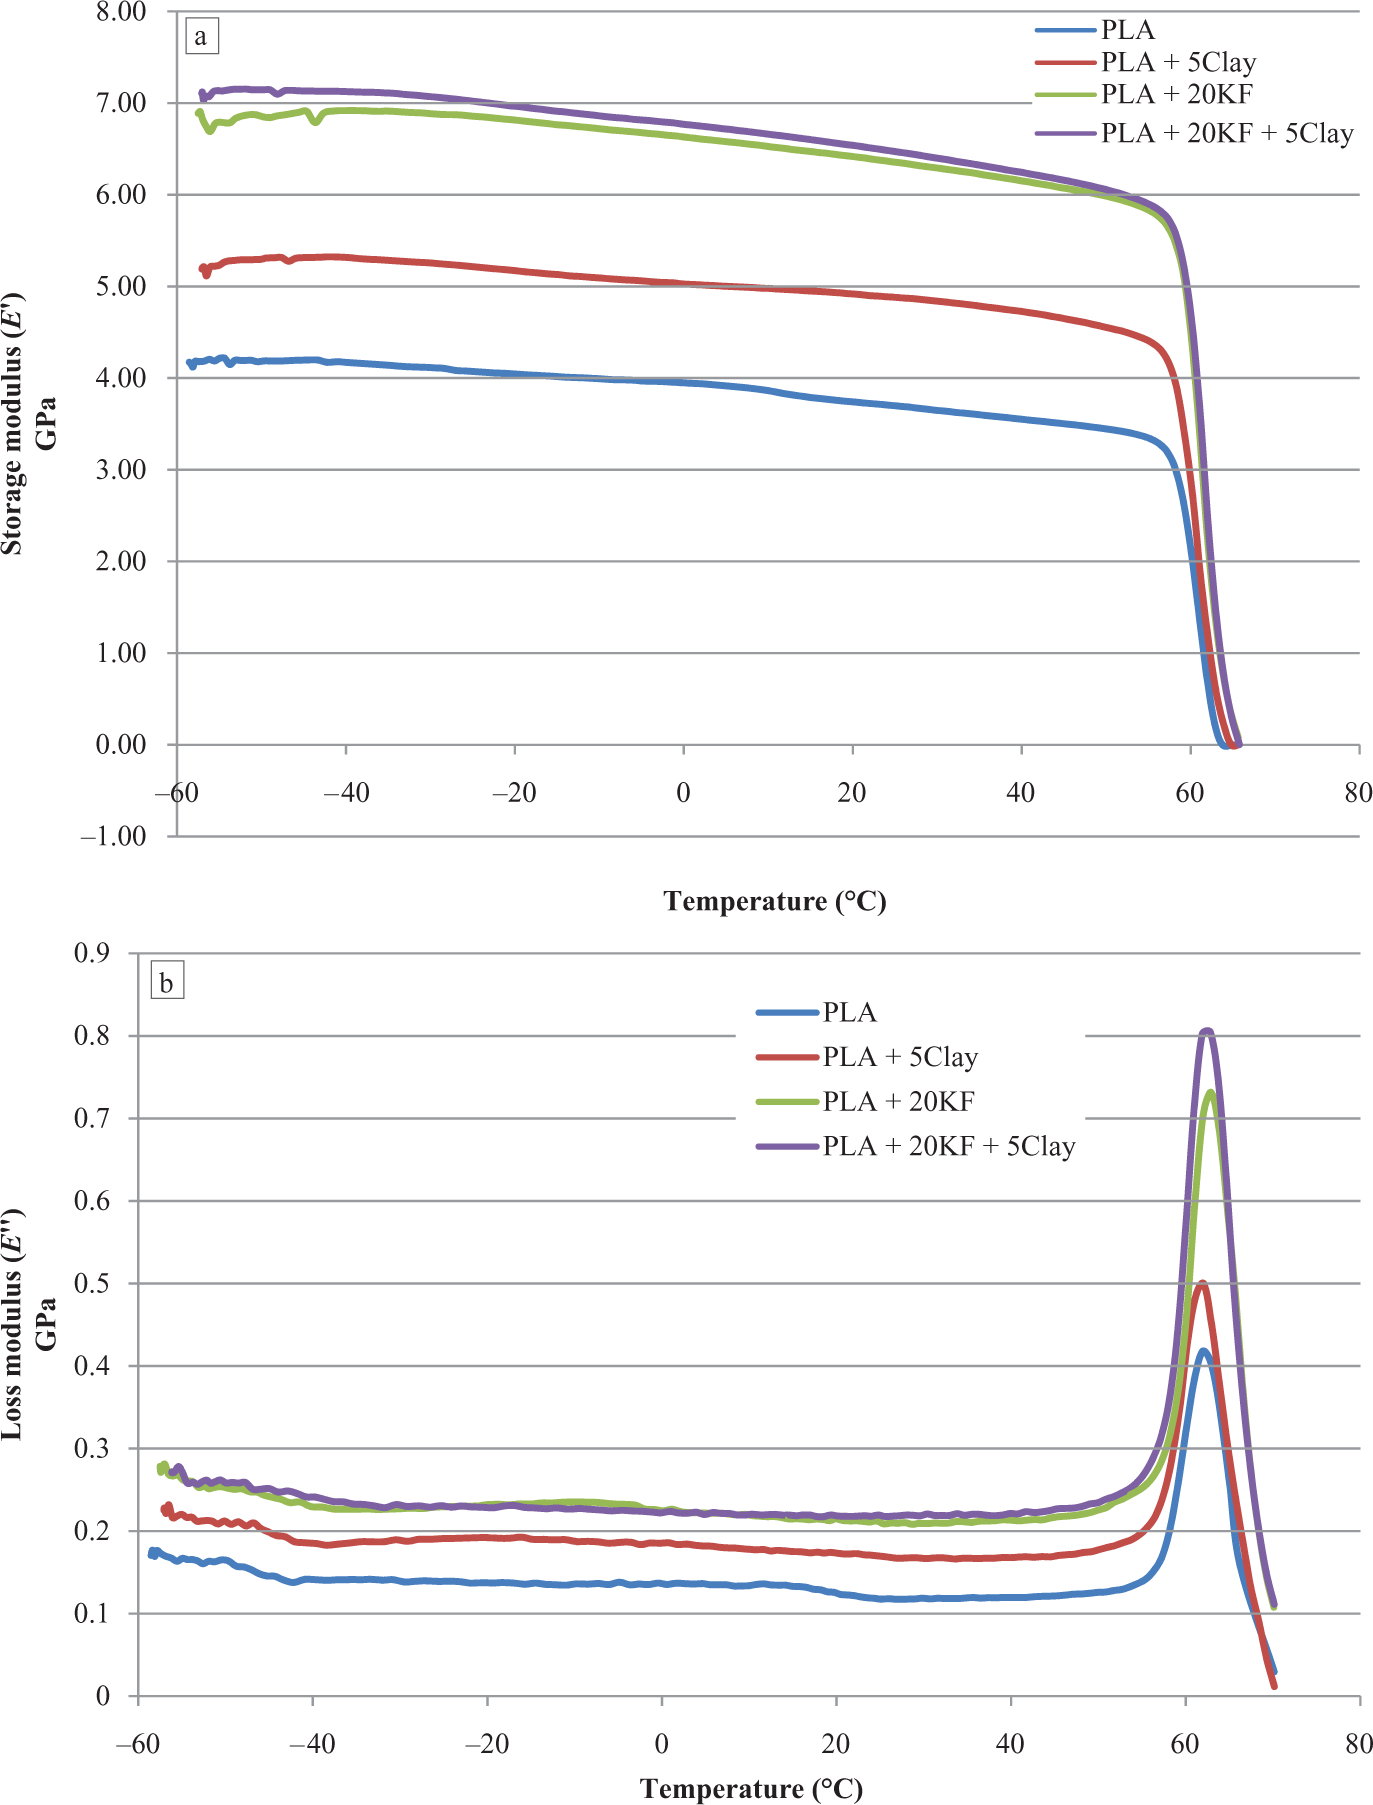
Dynamic mechanical analysis of (a) storage modulus and (b) loss modulus.
Again at a large scale S1 shows (Figure 4a) a very small peak between −20°C and −40°C, which indicate the β-transition temperature (T β) and an indication of brittleness. Below this temperature, the movement of polymer chains becomes totally restricted. Whereas other samples do not show any T β which means the fillers and fibers are already restricting the movement of polymer chains. So it can be inferred from DMA that the DBTT of S1 is less than −20°C, whereas in other composites DBTT is higher than −20°C.
To determine DBTT, the impact energy is plotted against temperature for all the four samples. Among them S4 shows sudden decrement in impact energy between 20 and 10°C, whereas the others remain quite steady. So it can be said that the DBTT region for S4 is between 10 and 20°C.
Conclusion
It can be concluded that the DBTT region for S4 lies between 10 and 20°C whereas the DBTT region for S2 and S3 is either higher than 28°C or lower than −5°C and the DBTT for S1 should be lower than −20°C because from DMA curve it was found that the T β lies between −20 and 40°C. It should be mentioned here that, though S1 and S2 show the conventional DBTT curve with drastic decrement in impact energy at temperature 10–20°C, within this region the decrement in energy is only about 1.23 and 0.7 kJ/m2, respectively; whereas for S4, this value is 3.2 kJ/m2. So it is difficult to conclude that the DBTT for S2 and S3 lies between the range of 10 and 20°C. More data are needed for temperatures lower than −5°C. At lower temperature (e.g. −10, −20°C, etc.), if the energy difference is not high enough it can be said that DBTT lies between 10 and 20°C; and if, the energy difference is quite high, it can be concluded that the DBTT lies at that temperature region.
Footnotes
Acknowledgment
The authors wish to thank Brain Gain Malaysia and Research Matching Grant Scheme (RMGS09-06), eScience Fund (03-01-08-SF0087) for the financial support in making this study a success.
Funding
This research received no specific grant from any funding agency in the public, commercial, or not-for-profit sectors.