
Abstract
Carbon black (CB) thermoplastic composites are extensively used in antistatic, electrostatic dissipative, and semiconductive applications, where a relatively low electrical conductivity and low material costs are required. Achieving the adequate mixing levels during compounding is a major practical requirement. The present work studies the preparation by twin-screw extrusion of conductive composites containing ca. 20% weight-in-weight (w/w) CB, by investigating the effects of the processing conditions and of small variations in the filler's feeding rate on the evolution of the relevant processing parameters and rheological response along the extruder axis and of the electrical properties.
Keywords
Introduction
Electrically conductive polymer composites, consisting of a dispersion of conductive fillers in an insulating polymer matrix, are a practical, lower cost, and more easily processable alternative to intrinsically conductive polymers. A variety of particles and fibers is used in the preparation of these materials, including carbon black (CB), carbon fibers (CFs), carbon nanofibres (CNFs), carbon nanotubes (CNTs), and metallic particles.1,2 As the latter are prone to oxidation, which may compromise the composite's performance and bring about premature wear of the compounding and/or processing equipment, the use of carbon-based fillers has been progressively adopted as the most interesting route to enhance the electrical and thermal properties of thermoplastics.
The efficiency, availability, and cost of the various types of carbon-based fillers differ significantly, CB being the cheapest but also the less efficient. Nevertheless, CB thermoplastic composites are widely and successfully used in antistatic, electrostatic dissipative (ESD), and semiconductive applications, where a relatively low electrical conductivity is required (corresponding to an electrical surface resistivity in the range of 104–106 ohm.cm for ESD properties and 106–109 for antistatic properties). 3 The development of the so-called superconductive, or higher-structure, carbon blacks (HSCB), with much higher specific surface area, fostered the application of thermoplastic composites in more demanding applications, such as bipolar plates for fuel cells, reaching resistivity values as low as 10−3 ohm.cm. 3 Another advantage of this filler in comparison with ‘standard’ CB is the reduced amount of HSCB required to reach the conductive level. As for CNFs and, especially, CNTs, their properties make them ideal fillers for a number of advanced applications, but their cost and the difficulties in dispersing them in polymer matrices are currently still hindering their more widespread practical utilization. 4
The major requirement for electrical conductivity in thermoplastic composites is generally assumed to be the creation, during the compounding stage, of a filler network defining conductive paths within the nonconductive polymer matrix. Consequently, achieving the adequate degrees of dispersion and distribution of the filler into the polymer matrix is a key concern during the preparation of these materials. Particularly, at high filler incorporation levels, which are usually the case of electrically conductive CB composites, a sufficiently good filler dispersion/distribution will also minimize the risk of a negative effect on the mechanical performance of the matrix.
Understanding the dispersion mechanisms of powder agglomerates and, in particular, of CBs, is not a simple task, due to their complex structures. Carbon black typically consists of agglomerates with sizes in the range 10–100 μm. CB typically consists of agglomerates – of the order of 0.1 μm – made up of fused-together primary CB particles with lengths of the order of 0.02 μm. 5 Theoretical and experimental studies 6 – 8 demonstrated that the dispersion of CB under flow involves rupture, erosion, and collision mechanisms, 7 and that it is also influenced by the physicochemical interaction between the aggregates/particles and the polymer melt and by such physical properties as the permeability of the aggregates.5,9
As these concepts cannot yet be used to predict the mixing conditions to be adopted for the preparation of composites with tailored properties, many authors attempted to experimentally determine processing-morphology and morphology-properties correlations using different preparation techniques such as solution mixing, in situ polymerization,10,11 or batch melt mixing techniques. 12 – 16 Studies of continuous melt mixing processes, which are the ones generally used in industrial practice, are scarcer and mainly devoted to CFs or CNTs.3,17– 22
This work focuses on the preparation by twin-screw extrusion of conductive thermoplastic materials containing ca. 20% w/w CB (typical industrial recipe of masterbatch manufacturers, to be later diluted during the final processing stage). The effects of processing conditions (operating conditions, feeding sequence of the ingredients, and screw profile) and of small variations in the feeding rate of the CB are investigated in terms of the evolution of the relevant processing parameters along the extruder axis (this was made possible by sampling along the barrel) and of electrical properties. From an industrial point of view, the key interest is to identify the main compounding parameters and their major role, in order to be able to design new optimized conductive materials with a lower CB content. Such a reduction in the CB amount would entail an improvement of both the mechanical properties and processability of these composites.
Experimental
Materials
The polymer matrix consisted of an impact modified Polyamide (PA) 12, produced by blending a PA 12 of a flexible grade for tube extrusion, RILSAN AESN P40 TL (density of 1.04 g/cm3 and an MFR of 6.0 cm3/10 min @ 235°C/1.0 Kg), with a polyether block amide thermoplastic elastomer, PEBAX MX 1205 SW 2 (density of 1.01 g/cm3 and an MFR of 14.0 cm3/10 min @ 235°C/1.0 Kg), both manufactured by Arkema. The conductive CB (ENSACO® 250 G) – with a maximum volume resistivity of 10 ohm.cm – has a surface area of 65 m2/g, an oil absorption of 190 mL/100 g, and a pour density of 170 kg/m3 (see Ref. 23 for further characterization data).
Extrusion runs
Screw profile.
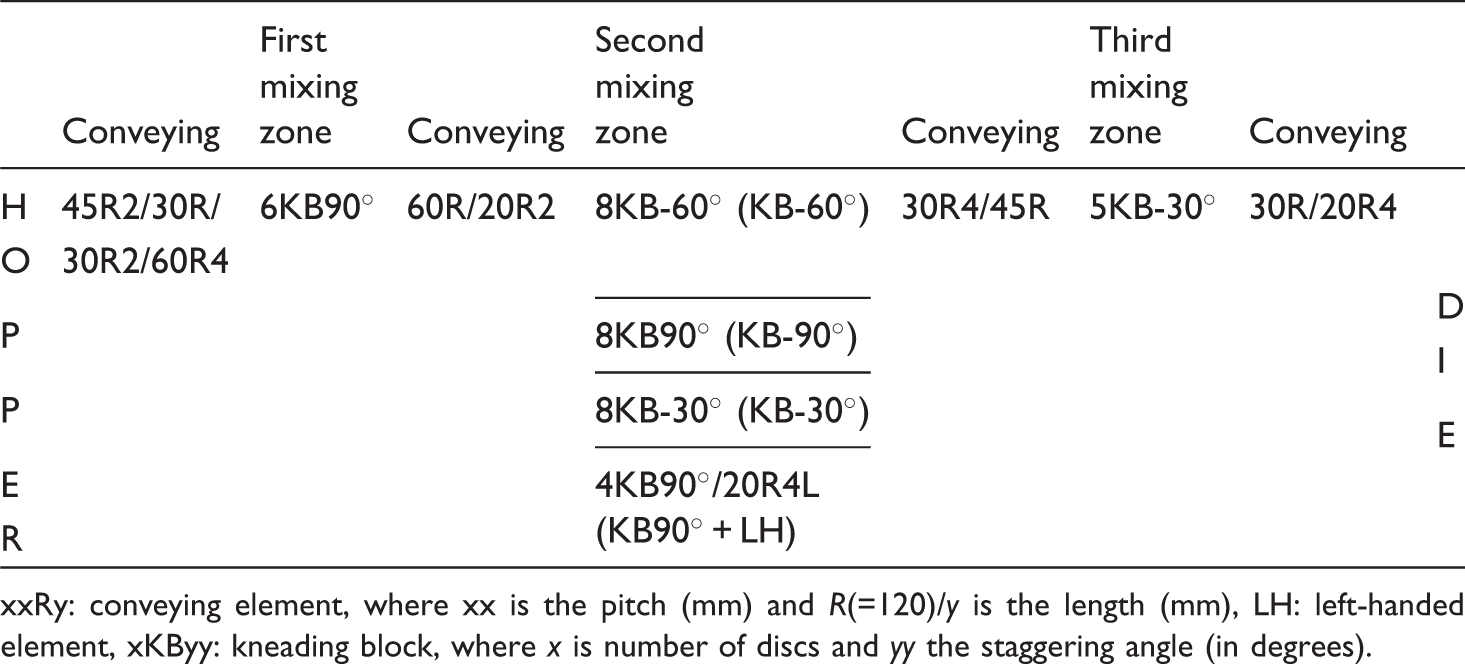
xxRy: conveying element, where xx is the pitch (mm) and R(=120)/y is the length (mm), LH: left-handed element, xKByy: kneading block, where x is number of discs and yy the staggering angle (in degrees).
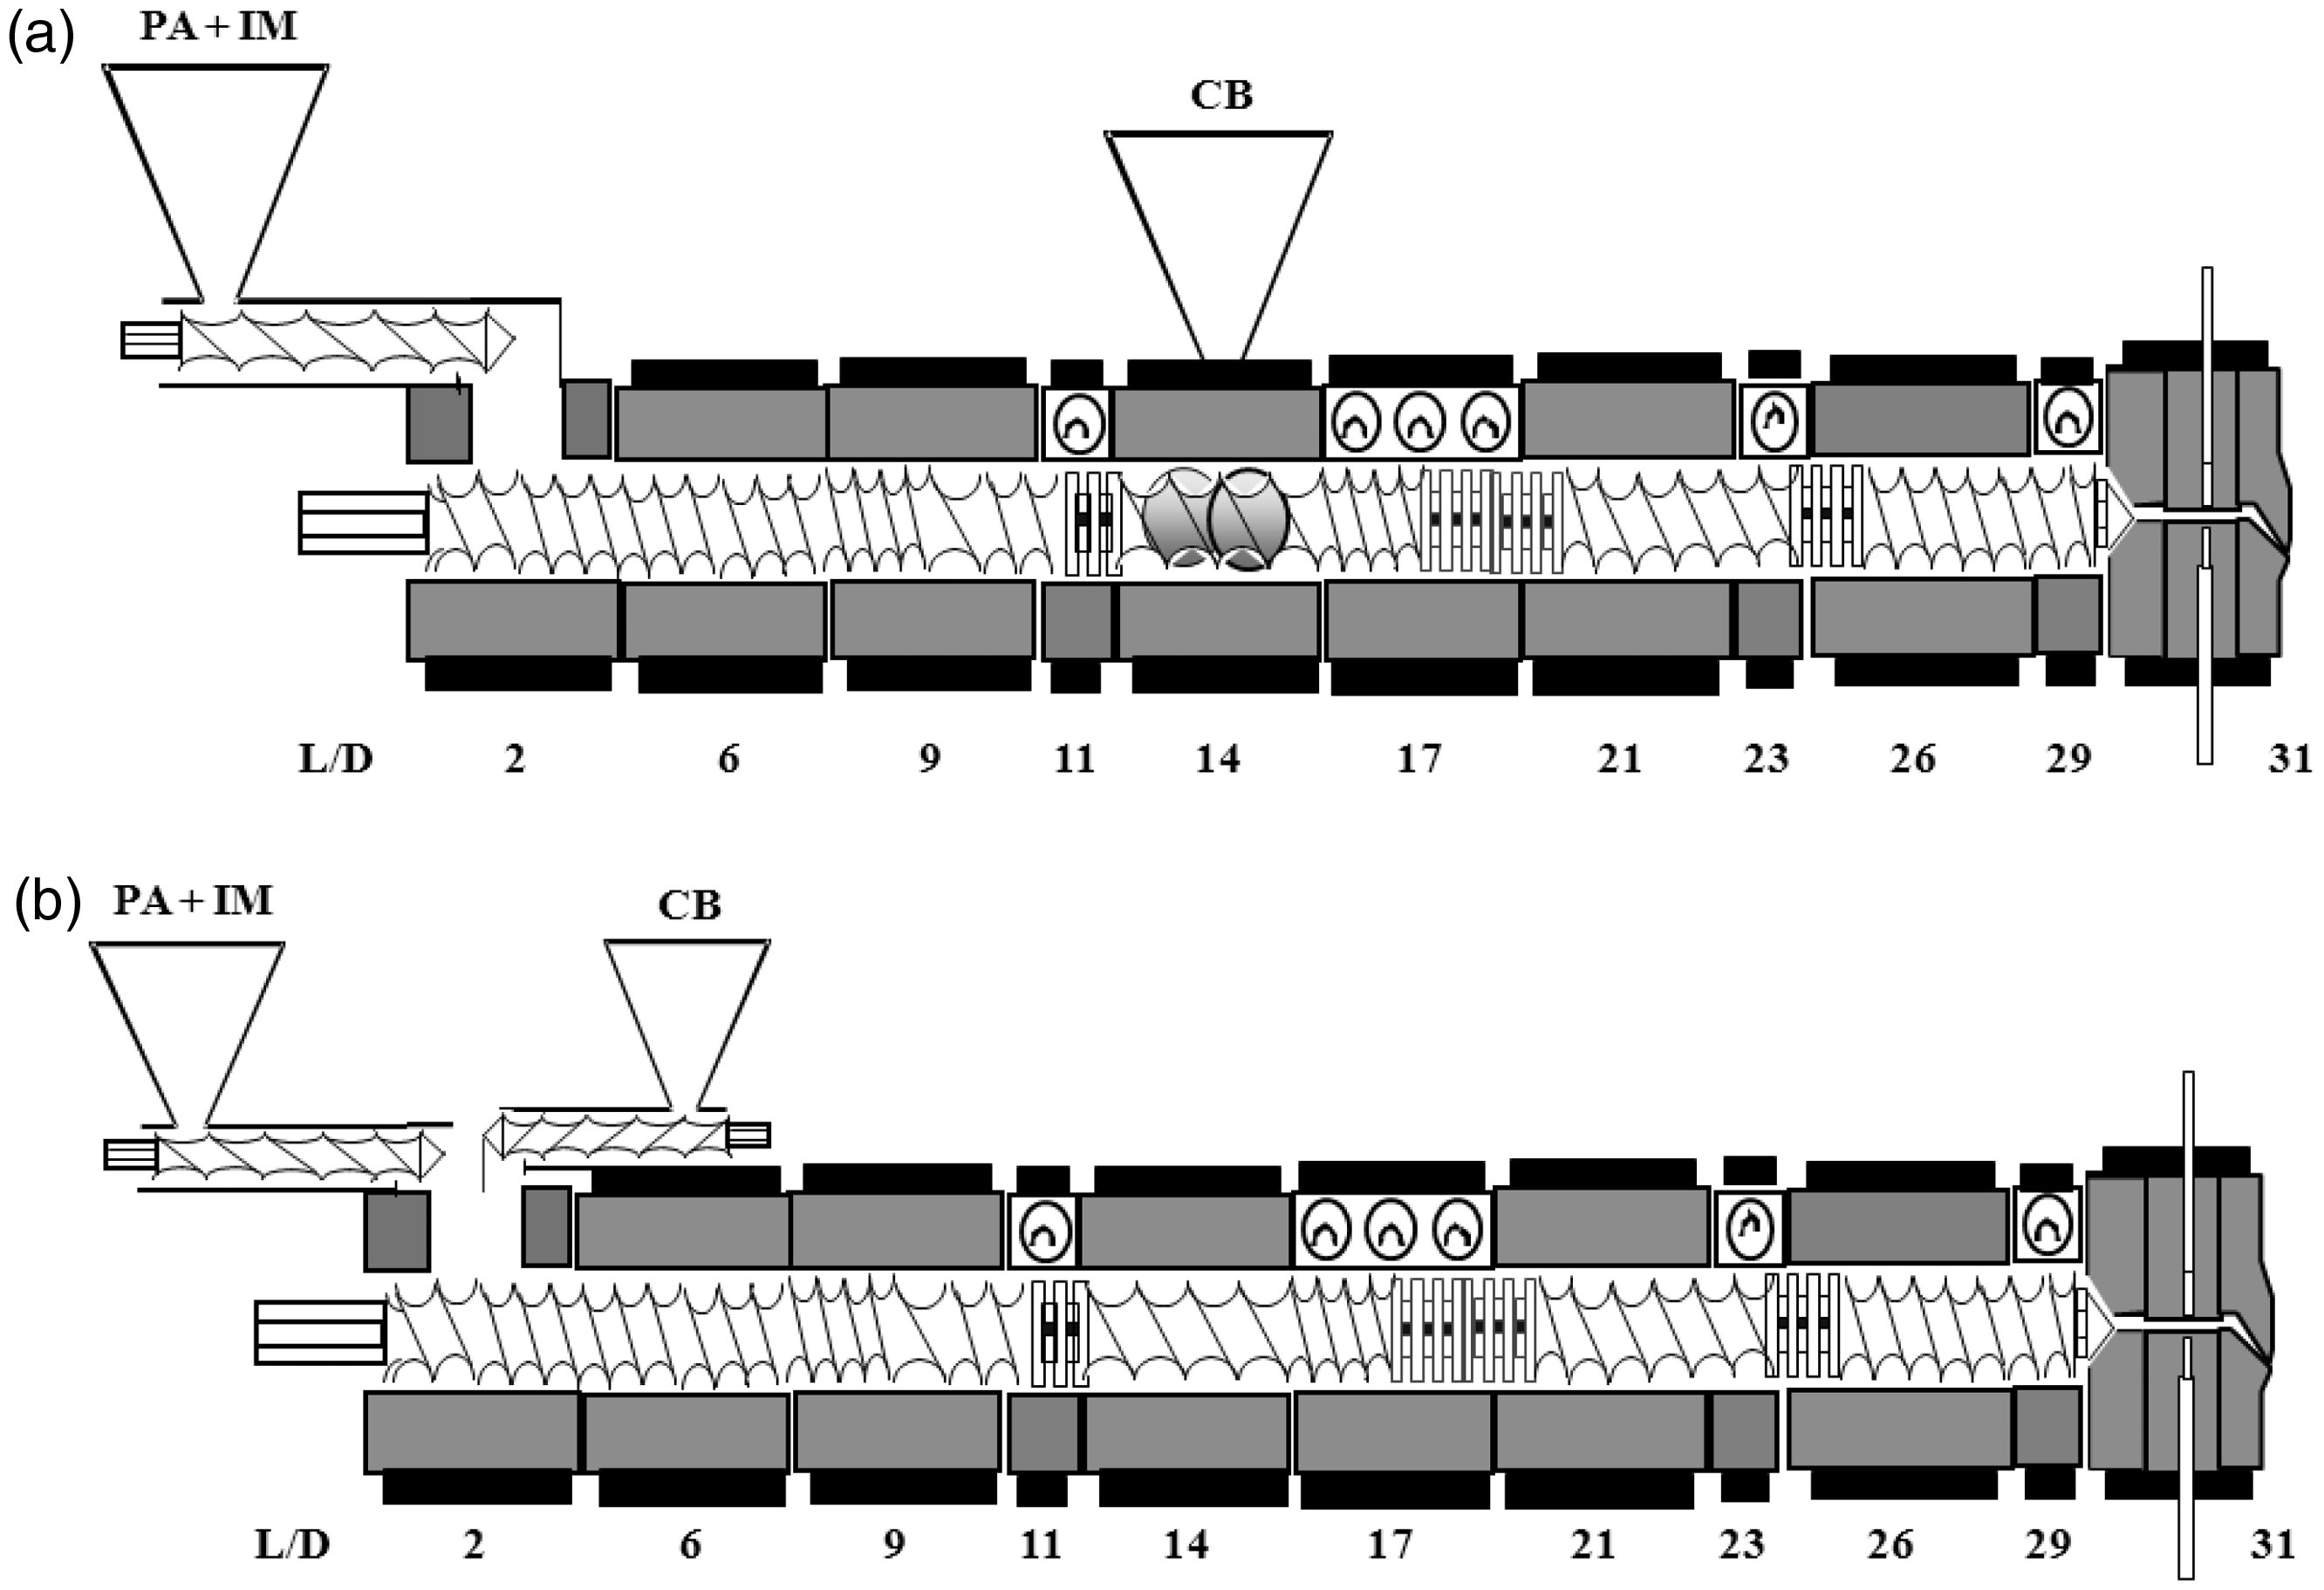
Extruder set-up and screws geometry: (a) separate feeding and (b) joint feeding.
PA12 and PEBAX were premixed in a tumble mixer for 30 min and then dried in an oven for 12 h at 80°C, followed by immediate processing. Their feed rate was set by a Moretto DVM 18L volumetric feeder positioned directly above the main hopper.
CB was either fed by a K-TRON KT20 unit in a volumetric mode coupled to a side twin screw feeder fixed at the barrel, at L/D = 14, or by the same feeding unit, also in the volumetric mode, located directly above the main hopper, for the separate and joint feeding approaches, respectively (this is also illustrated in Figure 1).
Set of extrusion runs a .
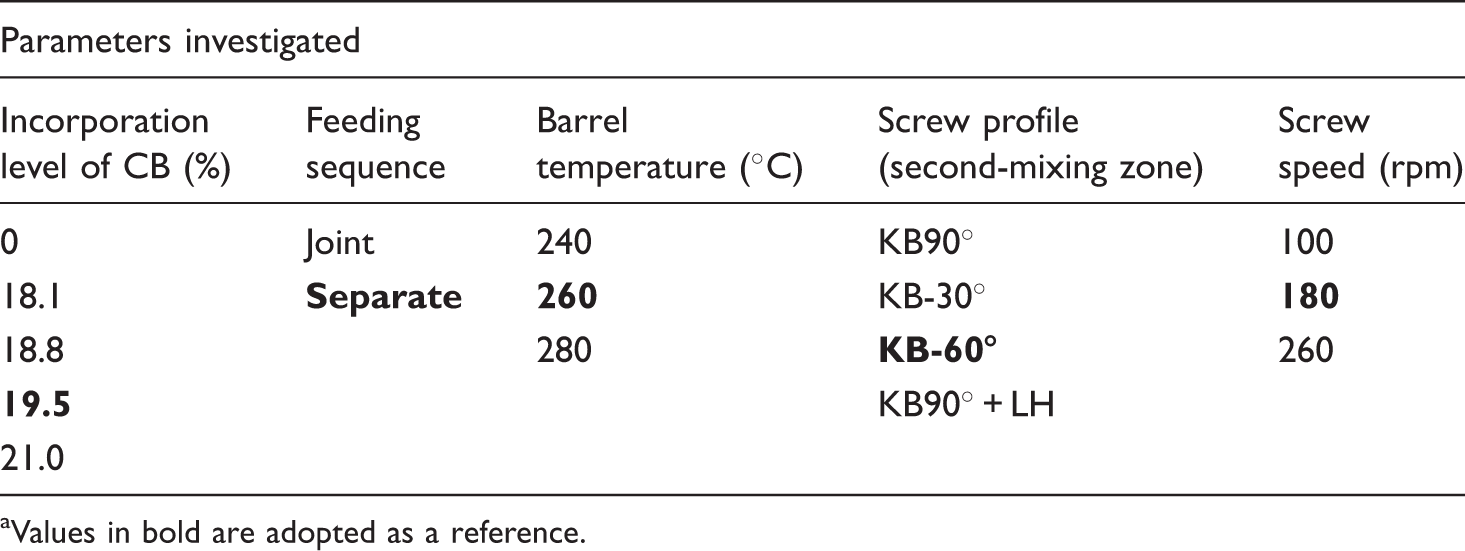
Values in bold are adopted as a reference.
Materials characterization
Thermogravimetry
Due to the well-known practical difficulties in feeding consistently low apparent density fillers during compounding or extrusion, the actual amount of CB present in each composite was determined via thermogravimetry. For this purpose, extrudate samples were subjected to temperature sweeps from 25°C to 900°C, at 20°C/min and under a nitrogen atmosphere (at a 20 mL/min flow rate), in a TGA Q500 V6.5 Build 196. The residual weight of the composite is the weight of CB, its content being then calculated knowing the initial weight of the composite before the thermal treatment.
Rheology
Isothermal shear viscosity curves of the extrudates were obtained on a dual bore Rosand RH8 capillary rheometer. The tests were performed at three different temperatures (240°C, 260°C, and 280°C), using 1 mm diameter dies with different L/Ds. The final data were obtained after performing the Bagley and Rabinowitsch corrections in the calculation of shear stresses and shear rates, respectively.
The linear viscoelastic response of the composites was measured using an ARES TA Instruments rotational rheometer in an oscillatory mode with a parallel plate configuration. Each sample (dried in an oven for 12 h at 80°C) was subjected to isothermal frequency sweeps from 0.1 to 100 rad/s at three different temperatures (240°C, 260°C, and 280°C), with a gap set at 1.5 mm and an amplitude of 1% (as determined from a linearity check). The 1.5 mm thick and 25 mm in diameter disks were obtained by compression molding (at 260°C and 20 ton) of samples collected along the extruder barrel and from extrudates.
Electrical properties
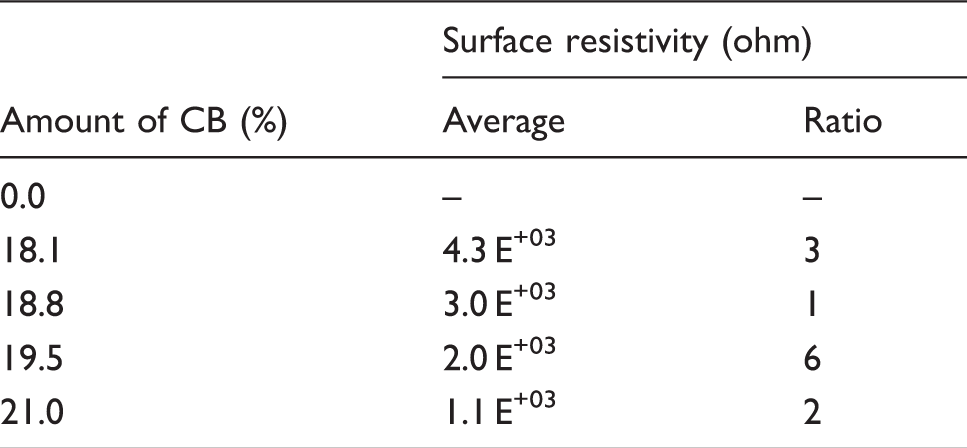
The surface resistivity of cylindrical samples manufactured in a Melt Flow Indexer (set at 275°C) by compressing pellets under a 2.16 kg load was measured using a Sefelec M1500P resistivity meter, under an applied tension of 10 V. The samples were conditioned for 2 weeks at 23°C and 50% relative humidity before the electrical measurements. The results are presented both in terms of the average value of five samples and of the ratio between the highest and lowest measured values.
Results and discussion
Effect of processing conditions
Feeding sequence
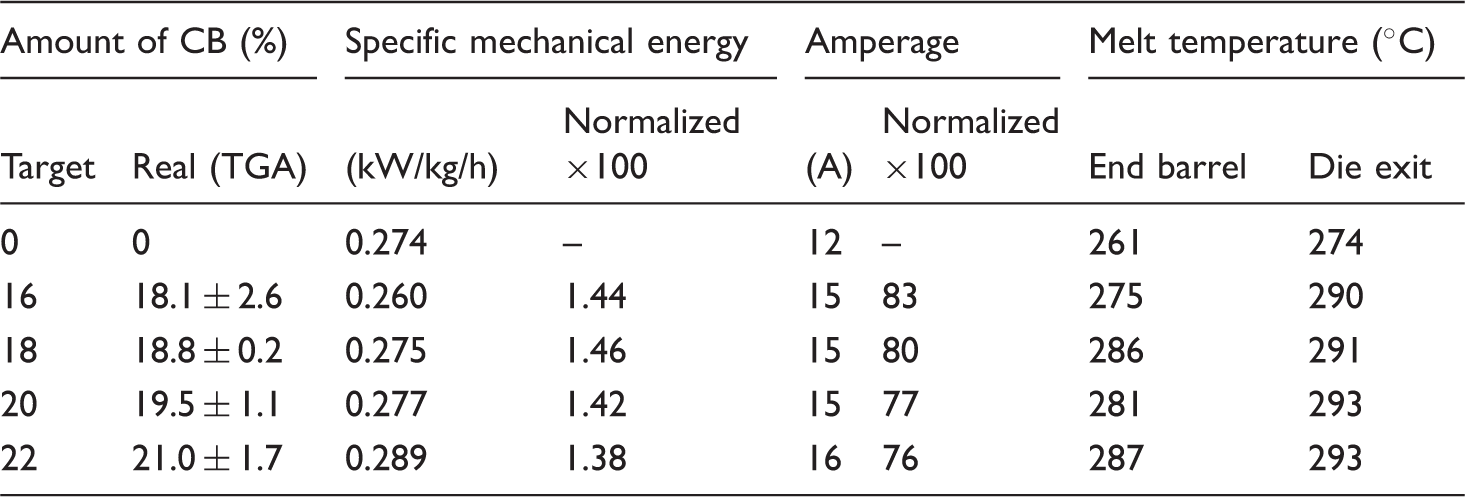
Real amount of CB incorporation, parameters monitored during extrusion and surface resistivity.
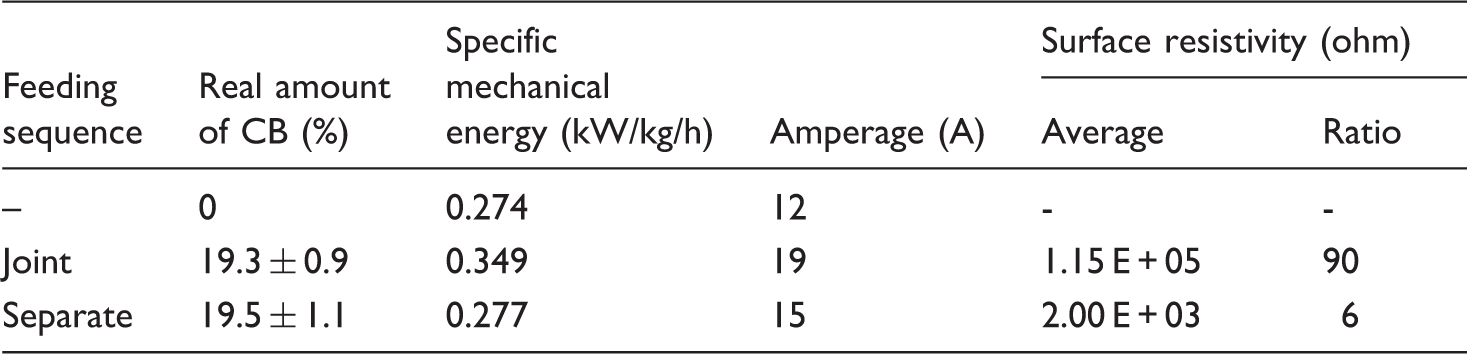
The specific mechanical energy (SME) consumption (i.e. the mechanical energy input per unit extrudate) is higher for joint feeding, but comparable for separate feeding and for the pure polymer blend, the latter being somewhat unexpected. The relative rating of the motor load (Amperage) discriminates better the differences between the three experiments, although preserving the same ranking. Higher SME and Amperage for joint feeding seem logical. When CB is incorporated together with the polymer, there is an additional power consumption in the first screw sector upstream, due to the combined effect of an increased output (polymer + CB, instead of only polymer for the sequential feeding case) with the consequent raise of the number of fully filled channels, together with higher viscosity levels (the viscosity of the filled polymer should be higher than that of the matrix).
The shear viscosity values at 100 s−1 for the matrix and composites prepared with the two feeding modes are depicted in Figure 2 (for three temperatures). As expected, the composites are more viscous than the matrix, but also have distinct viscosity levels which, in principle, could indicate different dispersion levels (higher viscosities being associated to finer dispersions). However, interpretation of the data must be made rather carefully, as the rheological response of composites can be quite complex. For example, it has been shown that, in some cases, the viscosity of the composites can be even lower than that of the matrix, due to the effect of local, between neighbor agglomerates, high shear rates.
17
A ‘lubricating’ effect was also postulated by Mooney and Wolstenholme,
26
who proposed a model of ‘supermolecular flow’ involving the rotation of particles or groups of molecules as elastic bodies. The actual evolution of the average melt temperature along the screw axis is shown in Figure 3. Taking into consideration the viscosity levels of the three materials, the melt temperatures measured at the screw tip and die exit make sense, as it is well known that there is a significant viscous dissipation during flow through restrictive dies, such as that being used. At L/D = 11, the temperature is lower for separate feeding, as the screws filling ratio is smaller and heat transfer is less effective. Curiously, at the same location, the composite is hotter than the pure polymer blend, indicating that the presence of CB improves heat transfer. Up to L/D = 17 (start of the second-mixing zone) the average temperature rises sharply, to approach the barrel set temperature. Further downstream, the temperature continues to increase although at a lower rate, but viscous dissipation at the die is again clearly noticeable. While the melt temperature of the polymer blend along the extruder stays generally below the set value, that of the composites raises more than 20°C and a further 14°C along the die. Beyond L/D = 14, the two composites behave in the same way.
Effect of the feeding sequence on the melt temperature development along the extruder and die. Effect of the feeding sequence on the shear viscosity of the matrix and composites (at 100 s−1).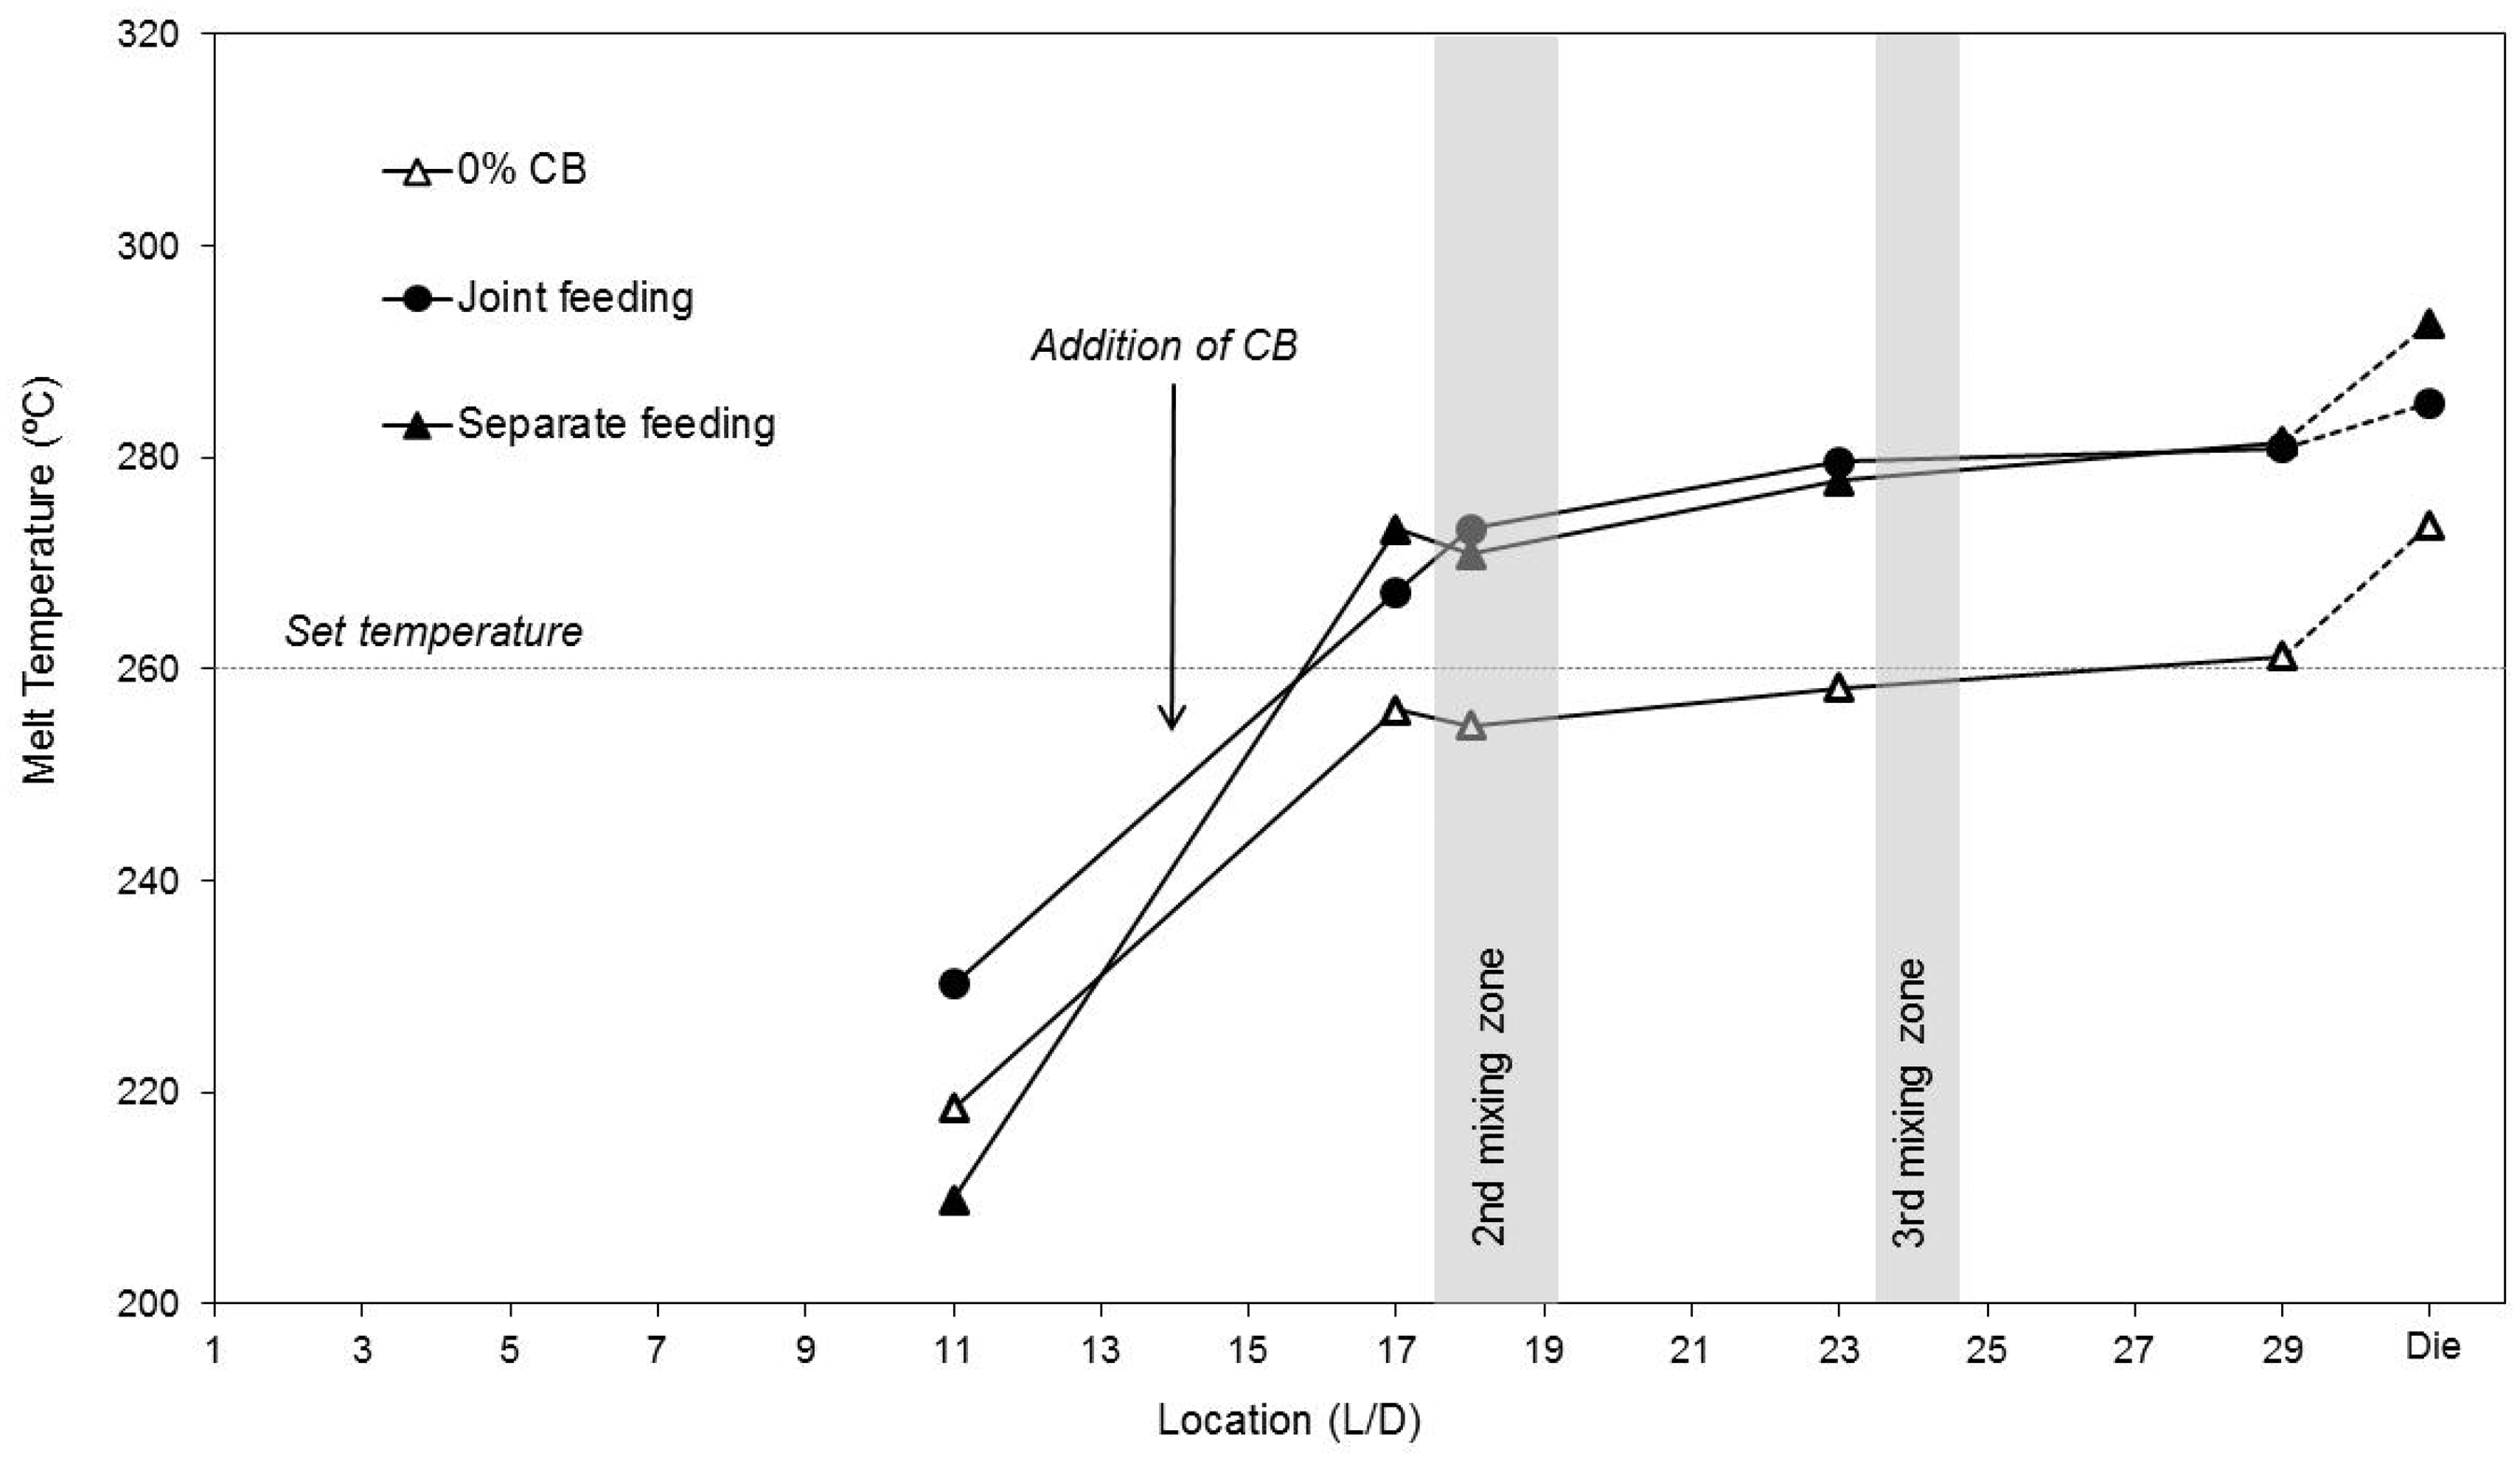
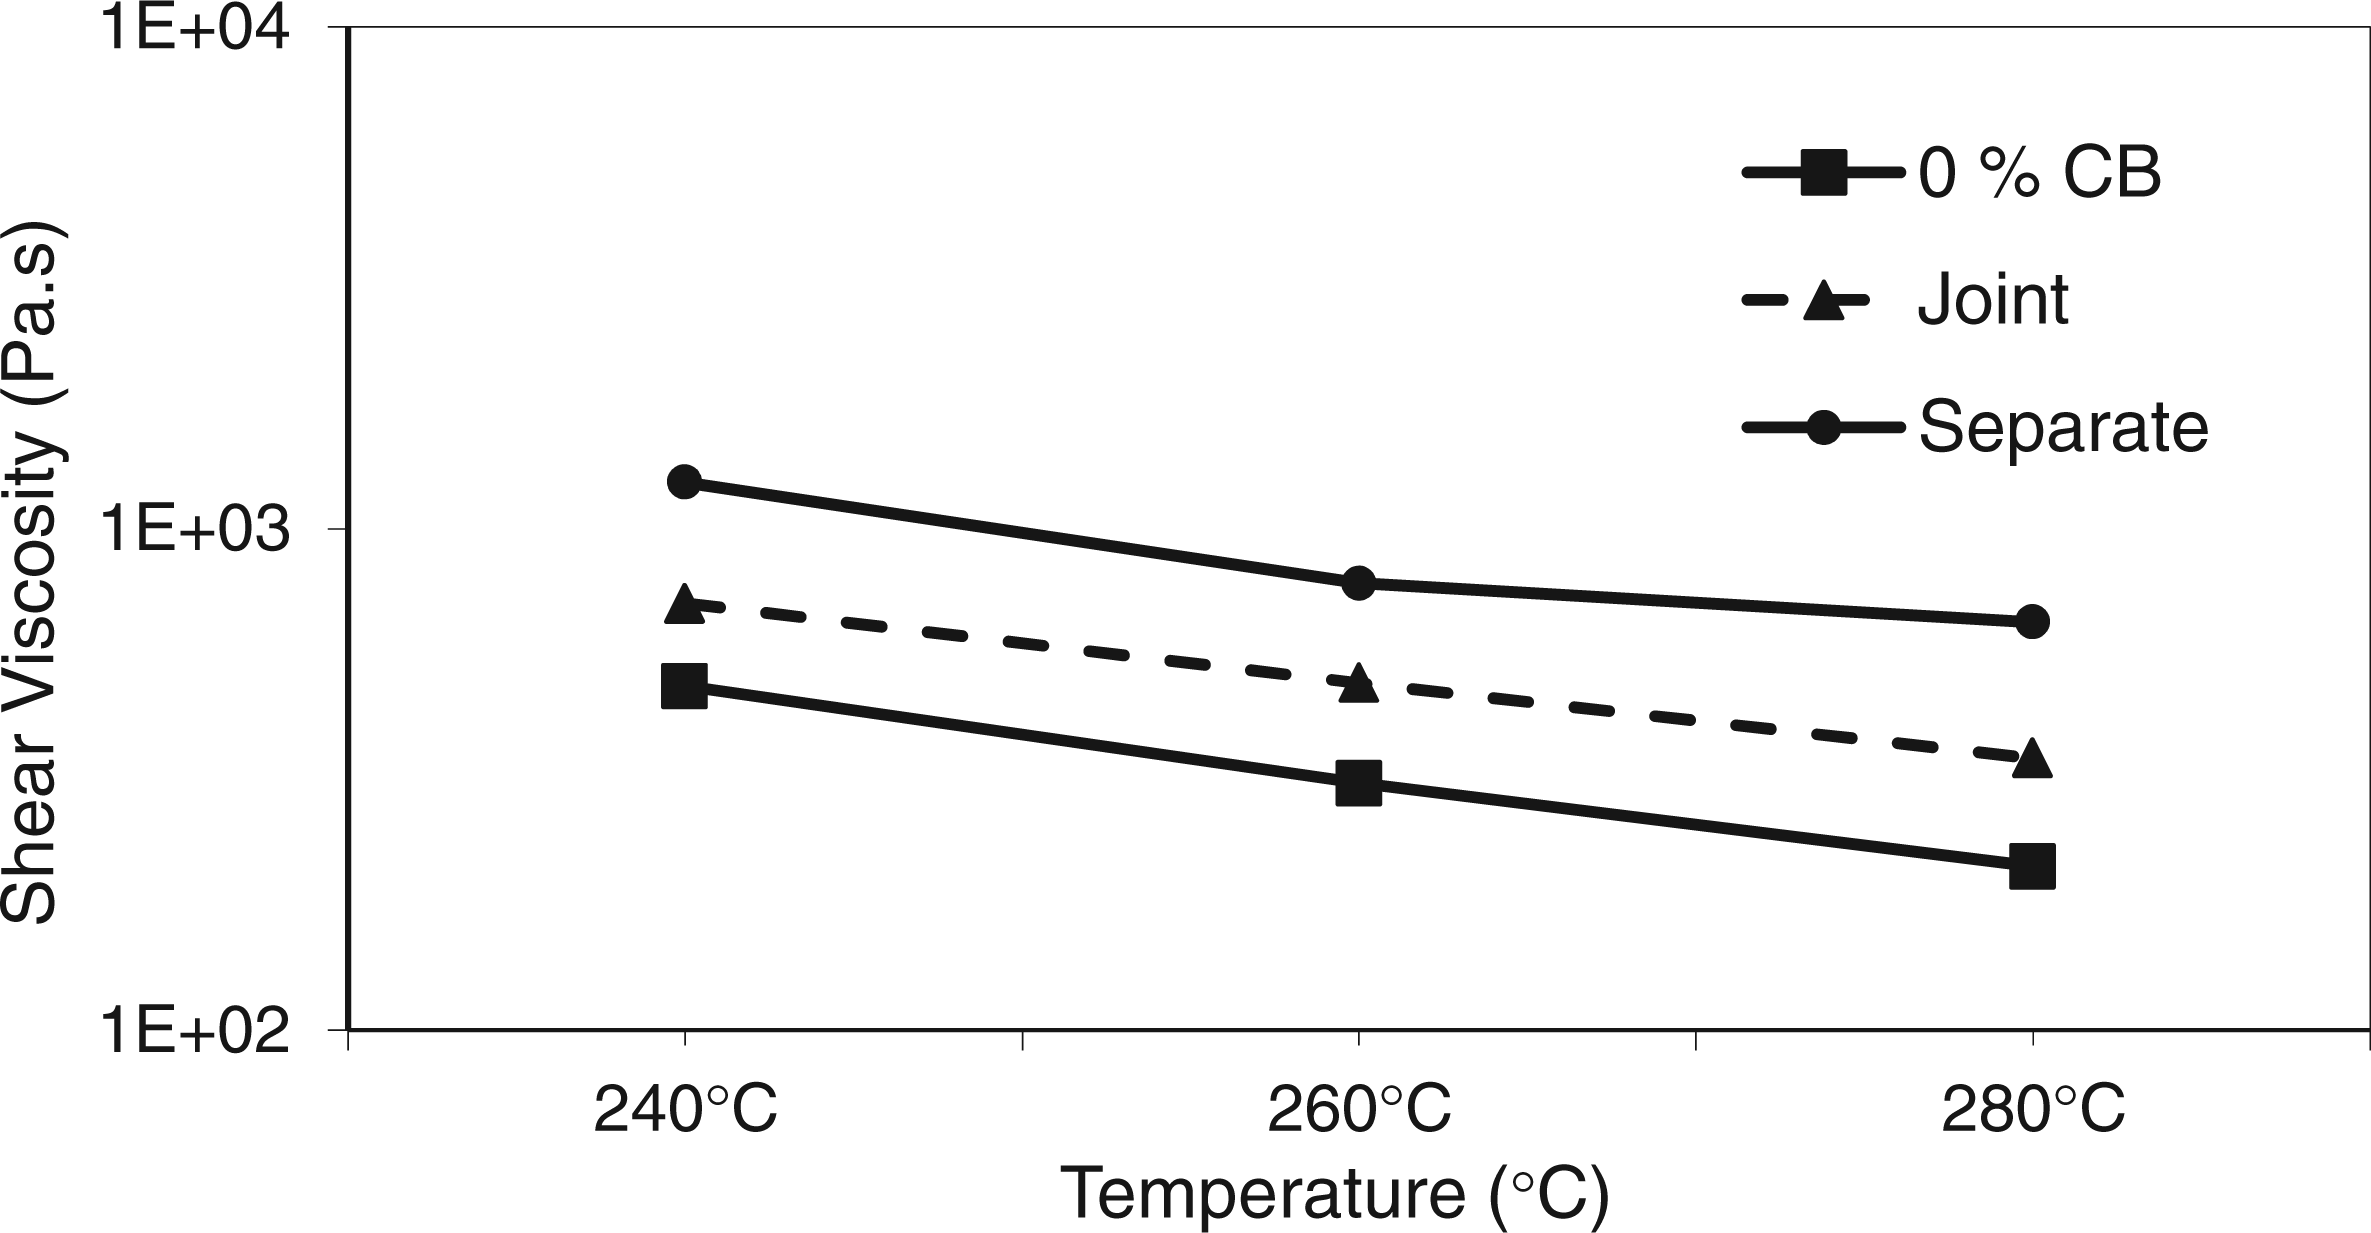
Figure 4 displays the evolution of the linear viscoelastic response (in terms of the elastic and loss moduli, G′ and G″) for the same three cases. Again, one can split the changes up to and subsequent to L/D = 17, with an increase in the moduli and a plateau-like behavior, respectively, for the composites. In the case of joint feeding, this seems to show that the mixing block upstream (at L/D = 11) melts the polymers but is not especially effective for dispersion purposes, as both G′ and G′′ increase significantly thereafter; conversely, the intermediate mixing block seems to be capable of achieving good dispersion levels, as no further evolution is detected downstream. As for separate feeding, the dispersion levels achieved straight away by the intermediate mixing block are probably close to the final ones. The magnitude of G′ and G′′ follows the ranking: separate feeding > joint feeding > polymer blend, that is, the same as for capillary rheometry. The data in Table 3 correlate well with this information, as it confirms that the composite prepared by separate feeding has lower surface resistivity. The survival (or the formation during processing, by a re-agglomeration route) of agglomerates should reduce the number of conductive paths within the composite. Such a delay in the evolution of dispersion should take place in the first part of the screw, when preparing the composite via joint feeding, as this is the situation where the two feeding forms cause distinct thermomechanical histories.
Effect of the feeding sequence on the linear viscoelastic response (at 10 rad.s−1 and 260°C) along the extruder and die, (a) G′; (b) G″.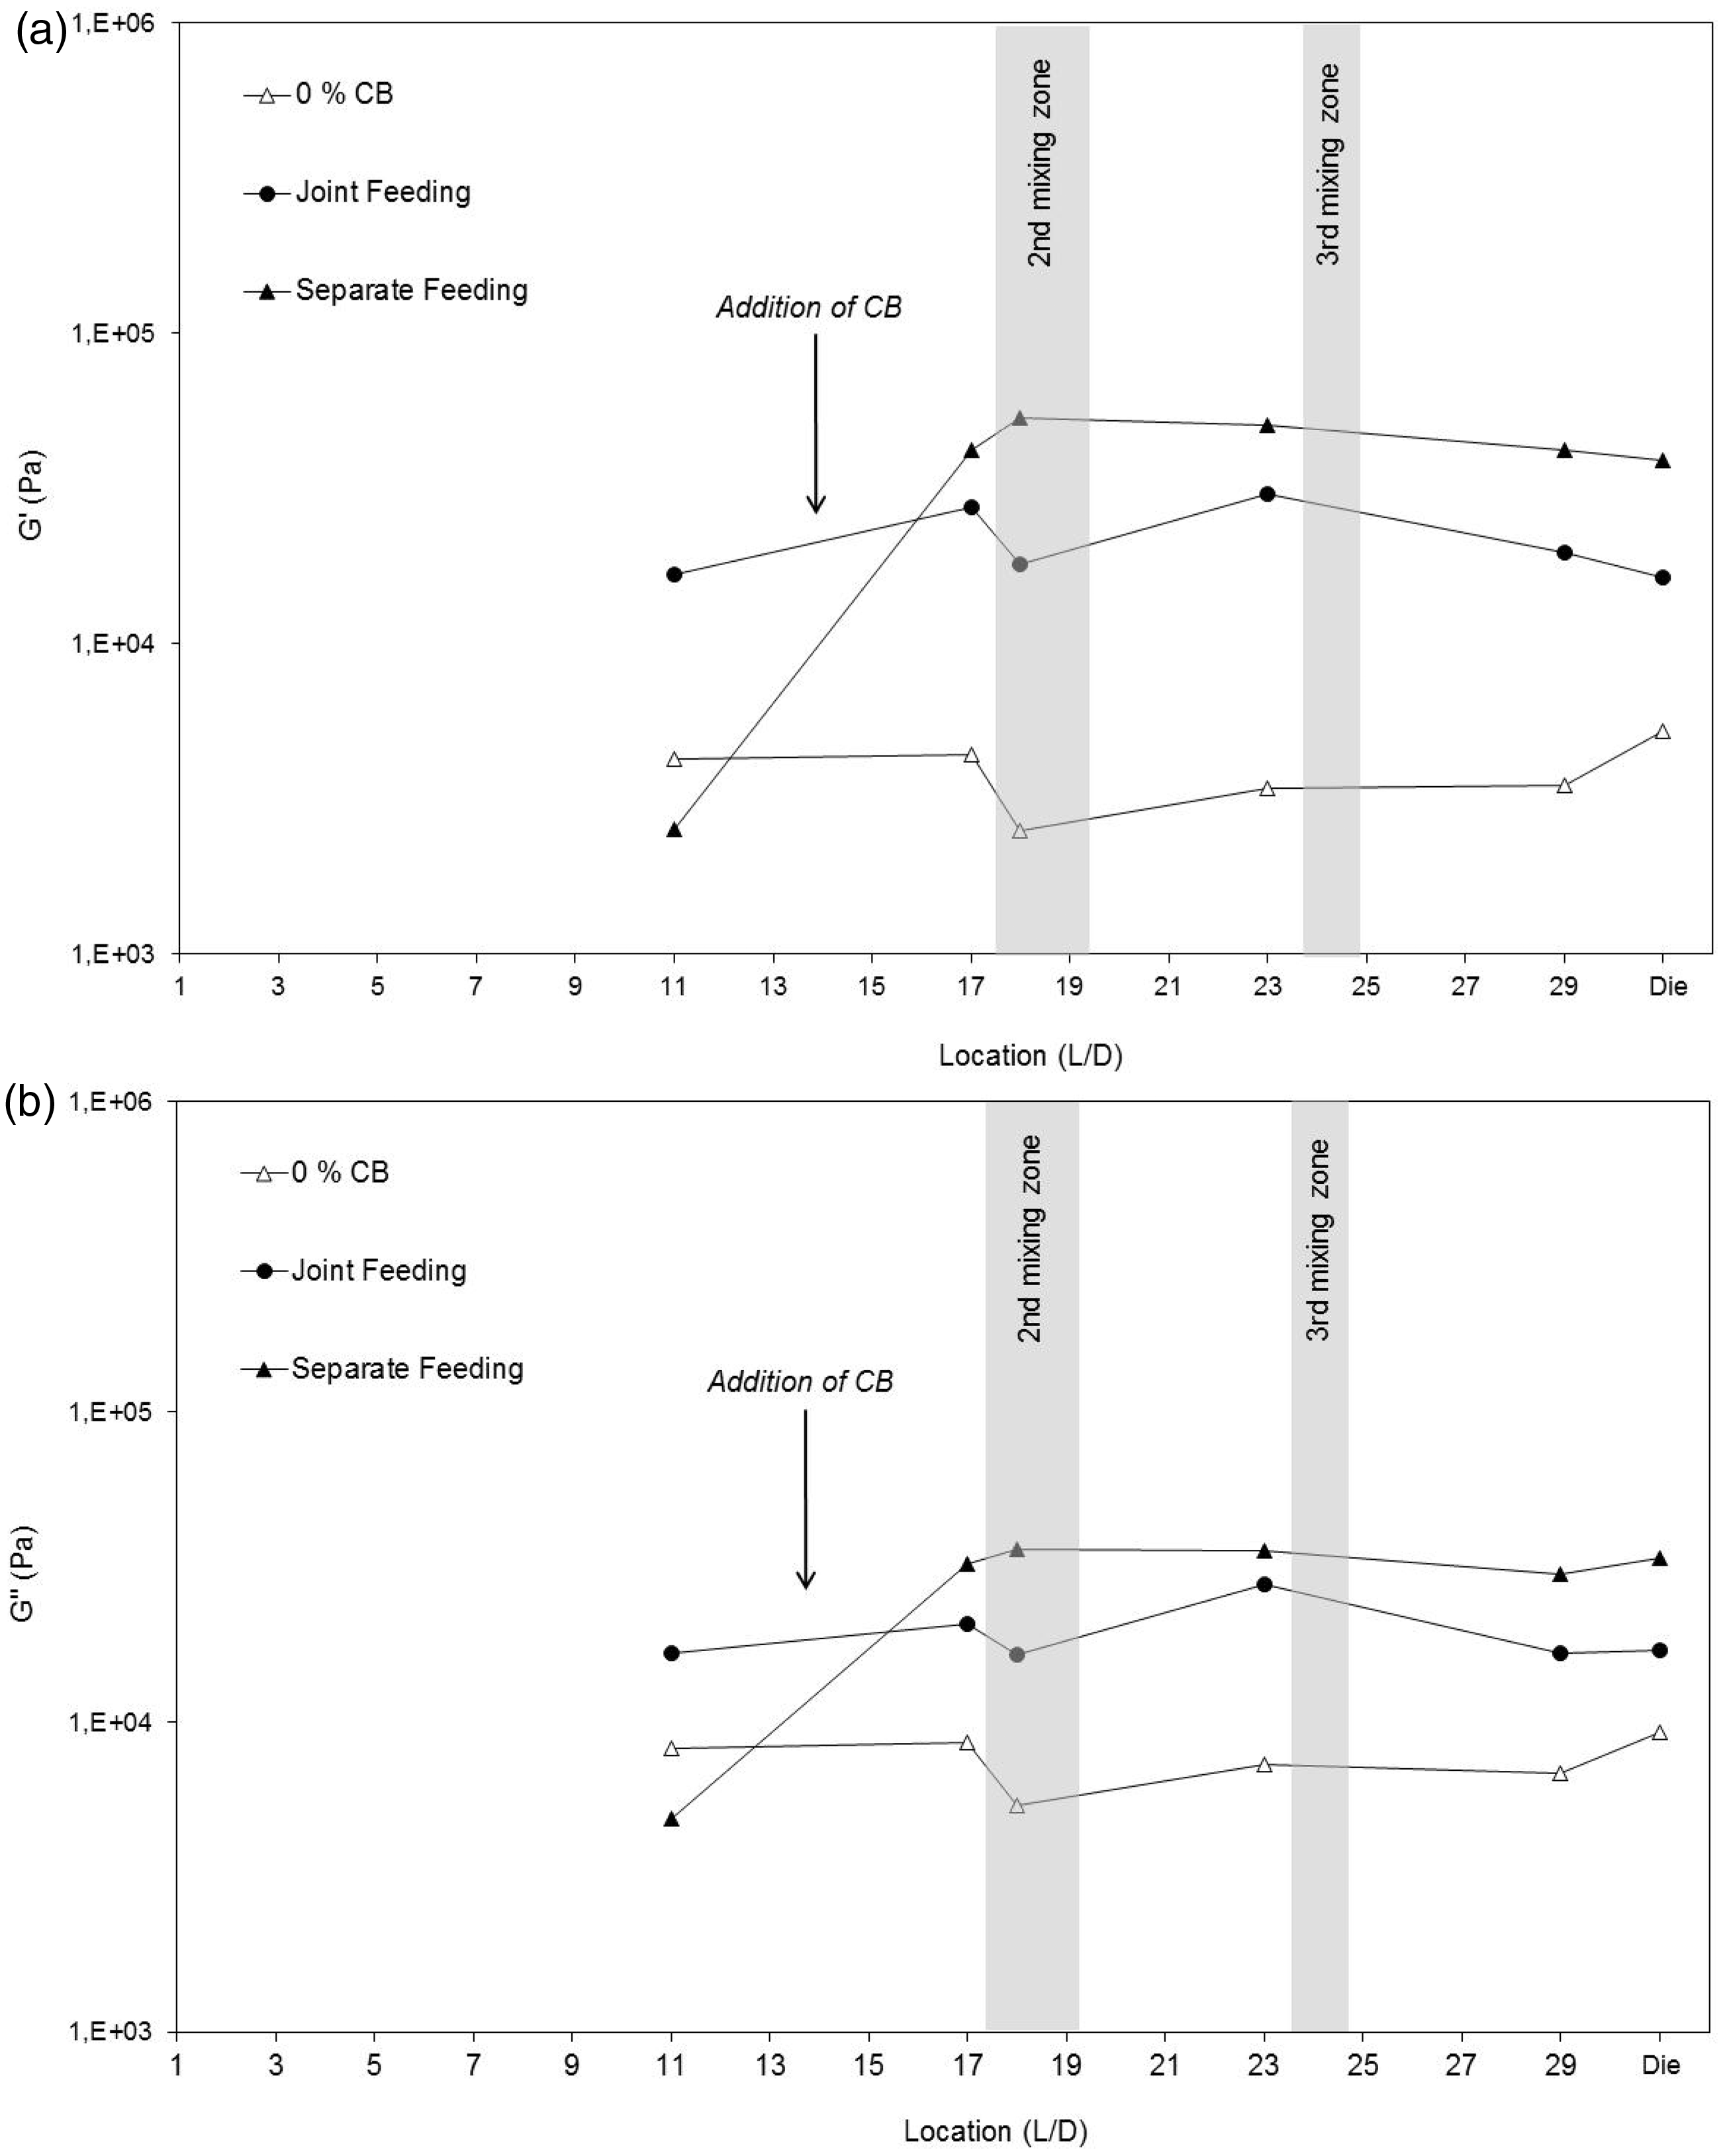
More specifically, since during flow through the first kneading zone polymer melting and some degree of CB dispersion and distribution occur, the hypothesis of agglomerate survival or formation should be investigated throughout solids conveying, along the partially filled screw channels. In order to elucidate this, the original barrel of the extruder was replaced by a 11 L/D-long transparent acrylic barrel,
27
thus making it possible to observe directly the flow of CB, of polymer pellets, or of both materials, at rates predefined by the respective feeders. The following observations were made:
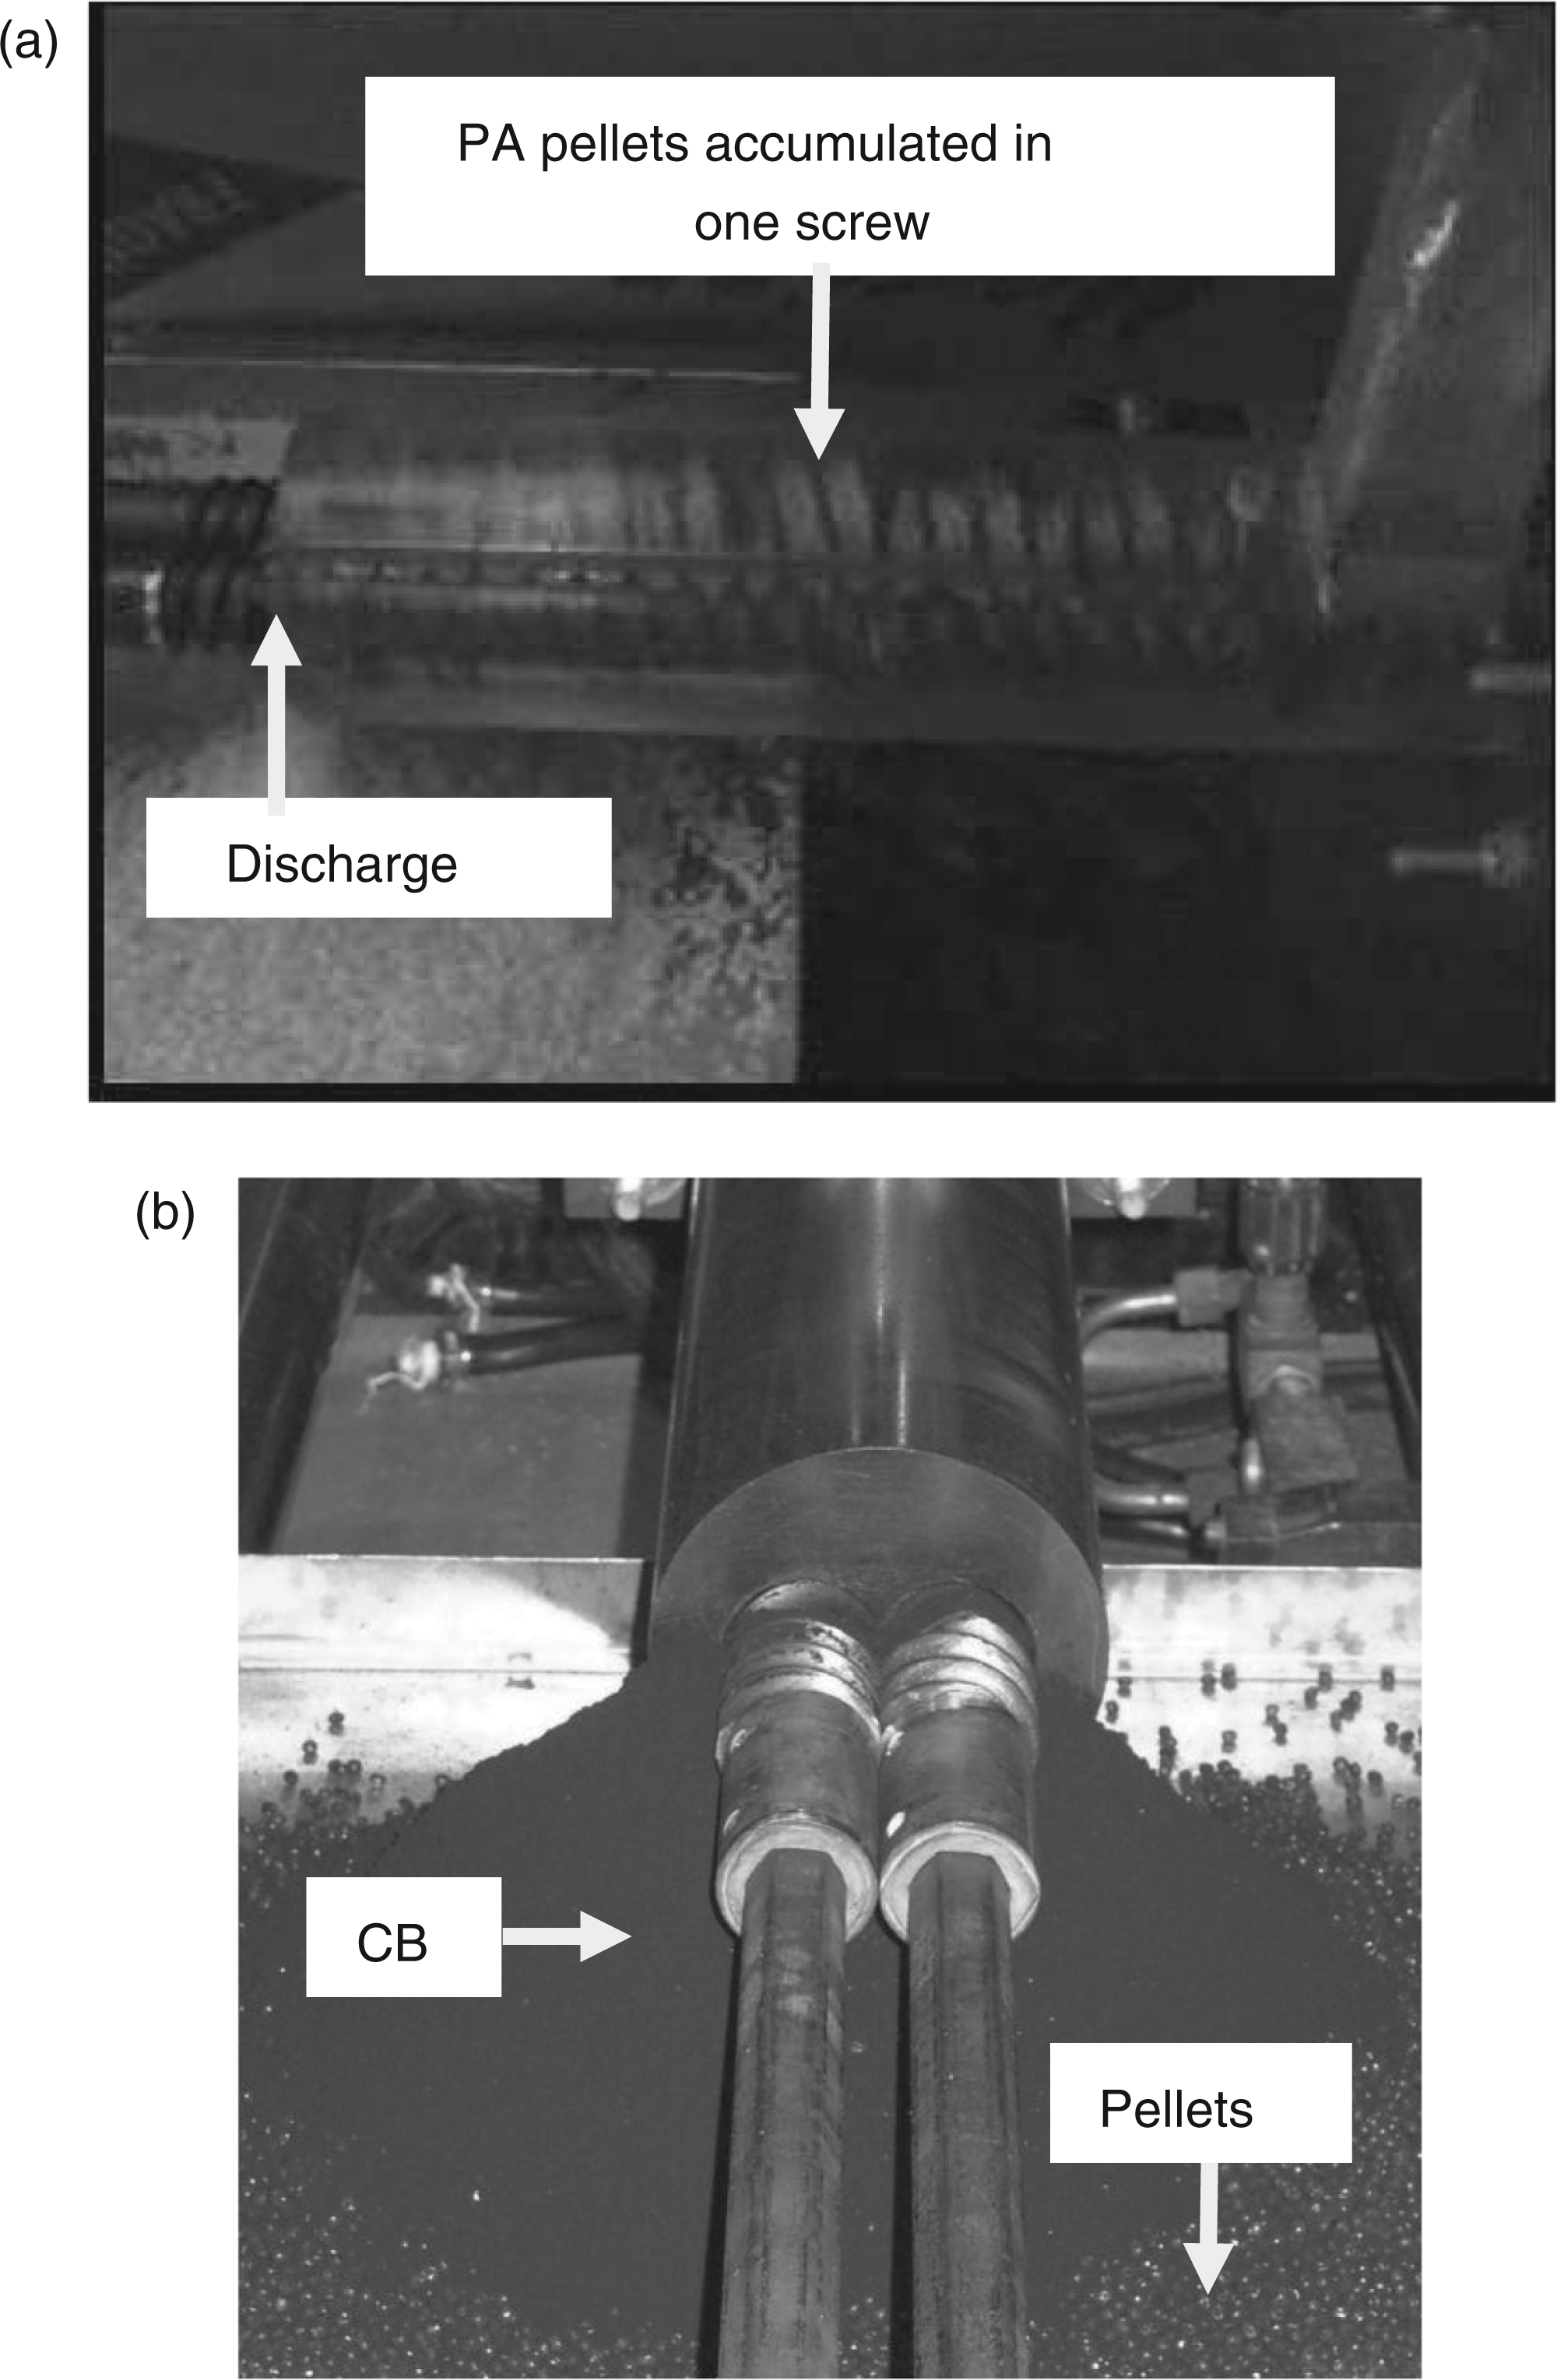
when the extruder is fed with PA pellets at a low rate, these seem to accumulate at the bottom of the barrel cross-section, moving axially forward due to dragging by the screw flights. If the feed rate is increased, or if the screw speed is reduced, the inlet material is transferred to and accumulates in one of the screws, which works almost fully filled, with only a small amount of material flowing in the adjacent screw (Figure 5(a)). As before, the pellets move axially forward due to dragging by the screw flights. This transport mechanism has obvious similarities with that of counter-rotating twin-screw extruders.
28
As the output increases, the two screws become more equally filled. Most probably, the well-known figure-of-eight flow pattern usually attributed to co-rotating twin-screw extruders is valid for melted material, which can pass through the mechanical gaps generated upon the screws rotation. when CB is fed alone, the same transport mechanisms were observed, even if the transition between regimens does not occur at the same speeds/outputs. when PA + 20% CB are fed together, the above conveying mechanisms are preserved.However, when the material emerges downstream, it becomes evident that PA and CB flow separately (Figure 5(b)), CB accumulating on top of the PA. Experiments done with a transparent barrel: (a) PA pellets at 10 kg/h and 50 rpm; (b) PA pellets + 20% carbon black (CB) powder.
Thus, it appears that in joint feeding de-mixing of the polymer + CB premix develops during solids conveying. Probably, at the beginning of the first kneading zone, the two materials are segregated to a point that during flow along this zone, although polymer melting and break-up of CB agglomerates take place, there is limited opportunity for the efficient intermingling of the two materials. Conversely, in the case of separate feeding, CB falls directly on a melt stream of molten polymer, so that some degrees of distributive mixing develop before reaching the intermediate kneading zone, where dispersion and distribution can be very efficient.
Screw profile
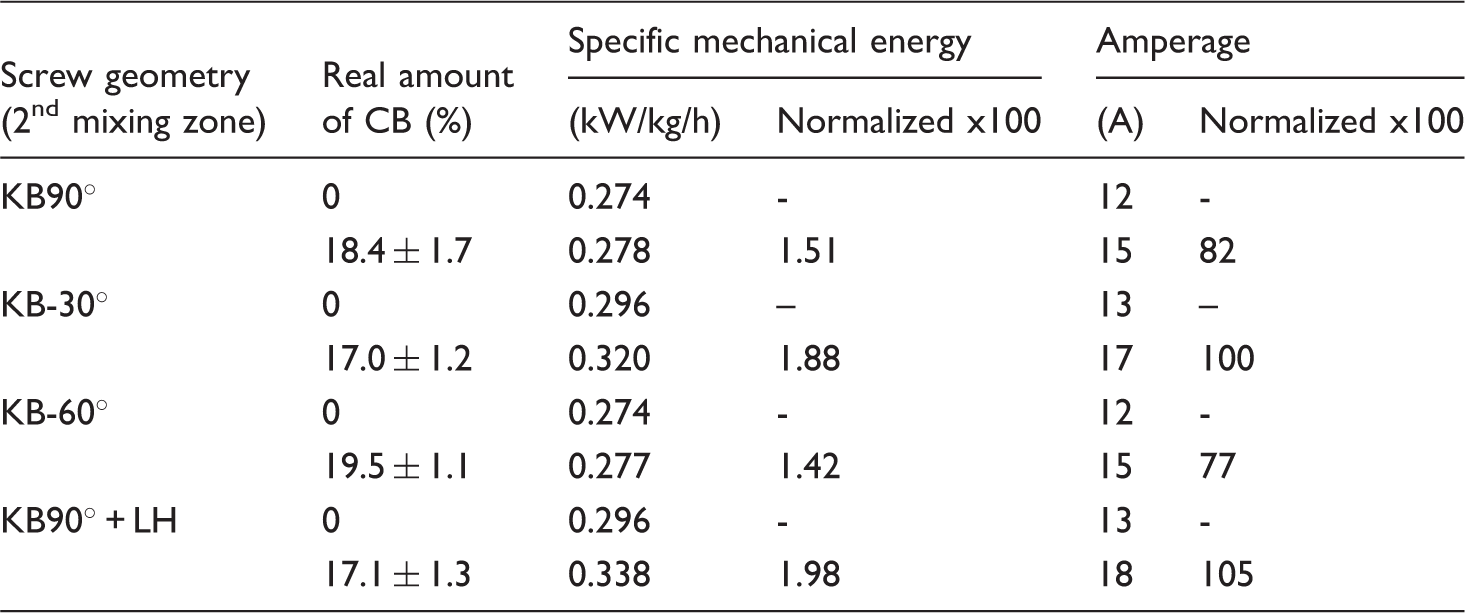
Real amount of CB incorporation and parameters monitored during extrusion.
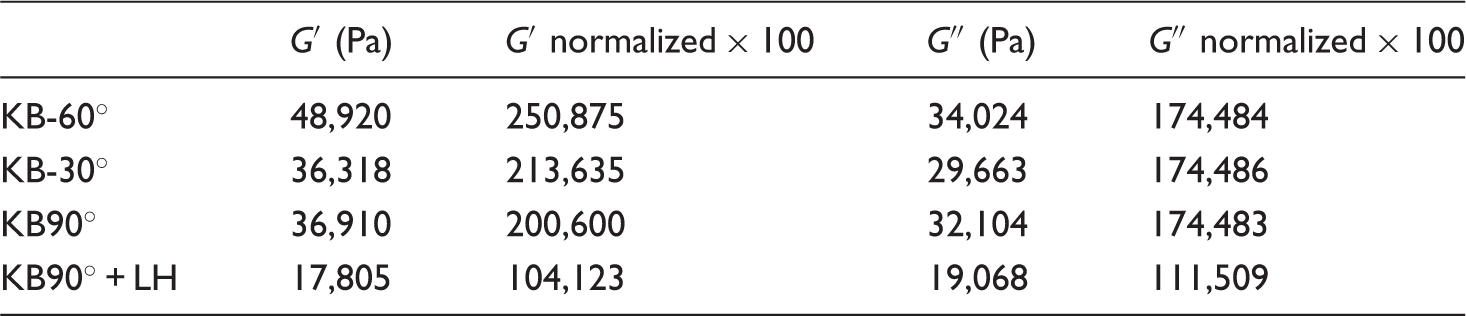
G′ and G″ determined at a frequency of 10 rad.s−1.
The evolution of the melt temperature along the barrel is depicted in Figure 6. As seen in this figure and in Table 4, when processing, only the polymer blend, SME, Amperage, and melt temperatures at the screw tip and die exit remain relatively constant regardless of the screw configuration. Viscous dissipation can reach 22°C. As expected, all the values for the composites are higher than those equivalent for the unfilled material. For example, viscous dissipation at the die exit can now reach 33°C. Also, the span of variation of SME and Amperage increases (the ranking KB90° + LH > KB-30° > KB90° > KB-60° being observed), while the melt temperatures stay relatively uniform. As in Figure 3, the melt temperature develops very quickly between L/D = 11 and 17, remains practically constant or some relaxation can even take place until the screw tips, and increases again sharply along the die. The differences in the melt temperature caused by the various configurations of the second mixing zone (which extends from L/D = 17 to 19) arise essentially upstream, between L/D = 11 and 17, most probably because that geometry influences the number of fully filled channels. As the latter increases, heat transfer and heat dissipation become obviously more effective/intense. Between L/D = 18 and 29, the average temperature measurements made halfway the mixing zone, past the mixing zone, and at the screw tips rank as KB90° + LH > KB-30° > KB-60° > KB90°. The first two correlate well with the ranking of SME and Amperage, whereas the last two are in the reverse order. Despite the limited precision of some of this data and of the inherent experimental errors involved, it seems fair to conclude that the configurations KB90° + LH and KB-30° look as if they subject the composite to higher thermomechanical stresses.
Effect of the screw geometry on the melt temperature development along the extruder and die.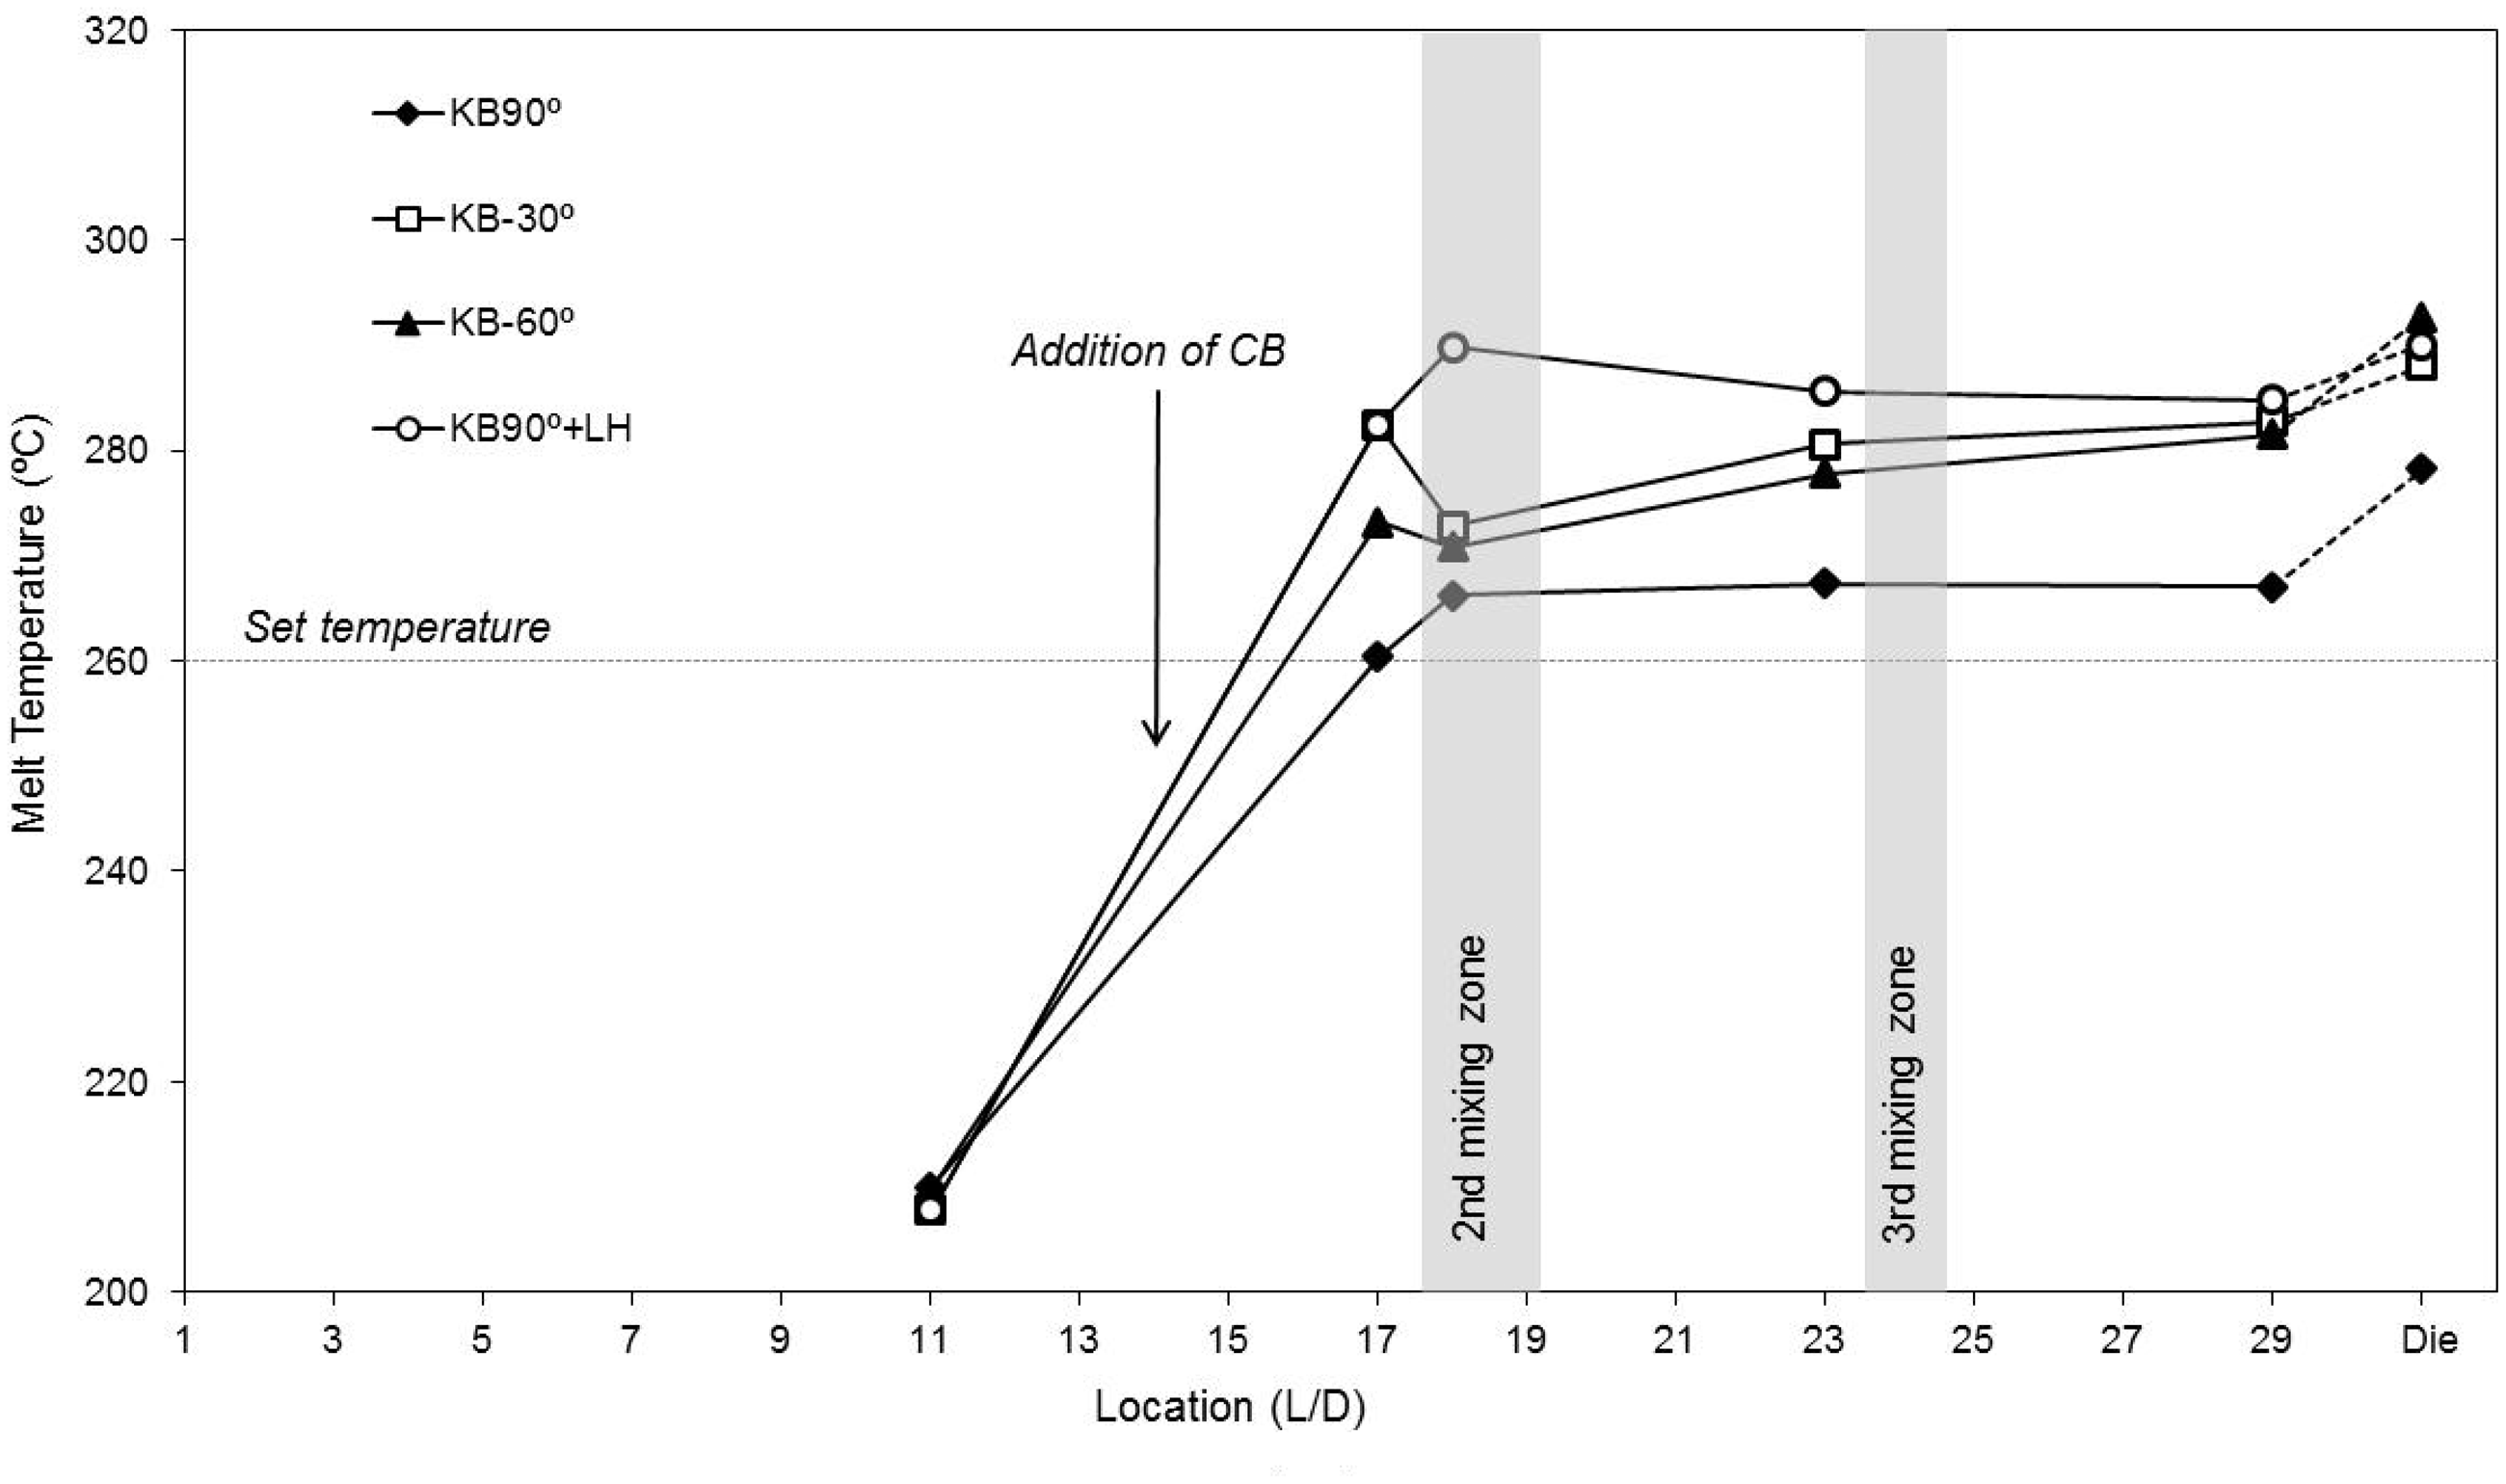
Within the limitations discussed above, the rheological response and the surface resistivity can be used to estimate whether the level of thermomechanical stresses the composite is subjected to (estimated from the parameters in Table 4) reflect on the dispersion levels (a material property). Such a correlation would be particularly useful, as the process parameters in question are easy to determine.
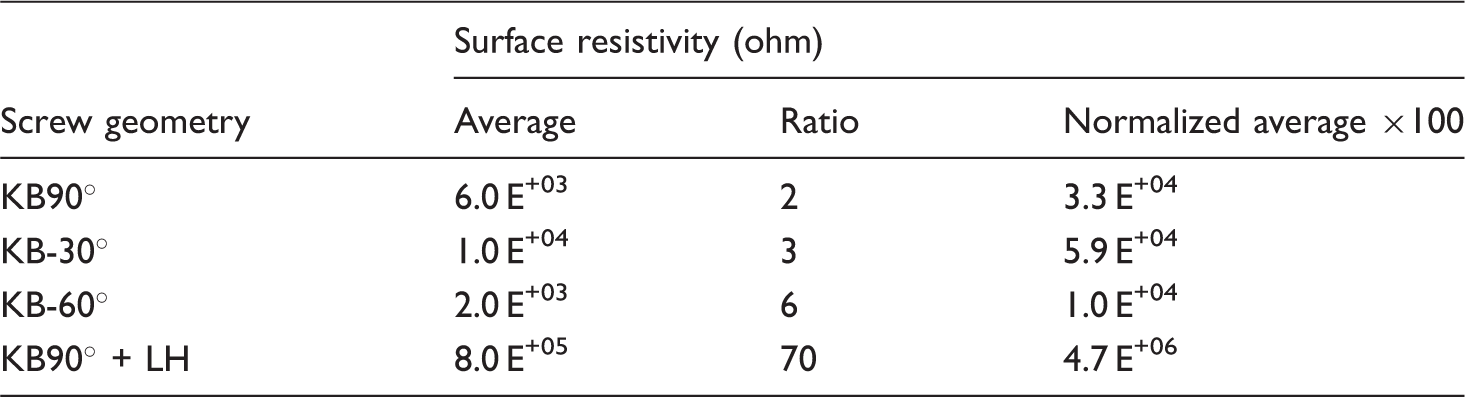
Influence of screw geometry on surface resistivity.
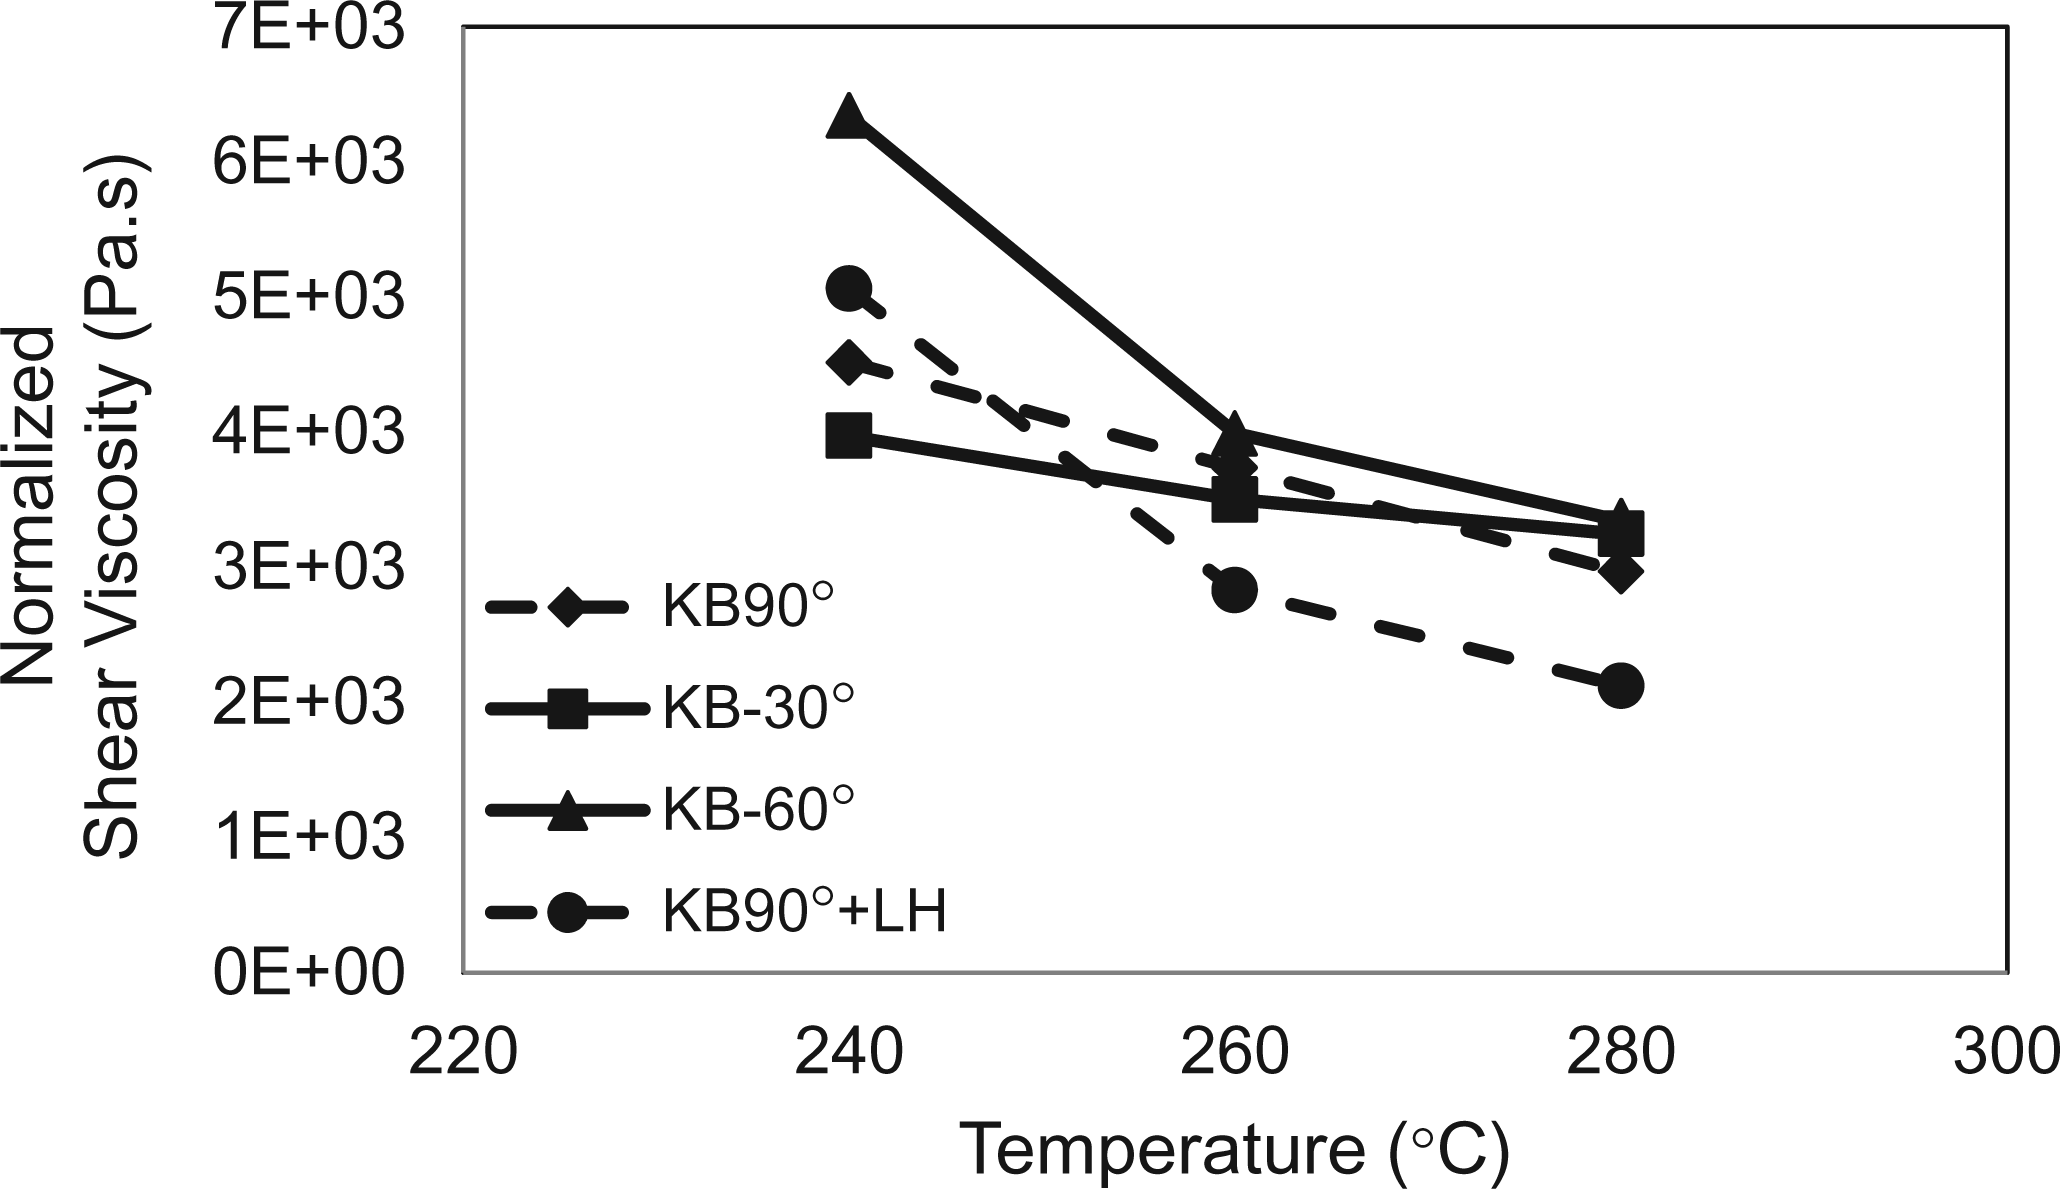
Effect of the screw geometry on the shear viscosity of the composites (at 100 s−1).
When the ranking of screw geometries presented in the preceding paragraph is compared with that resulting from SME, Amperage (and to a lesser extent, melt temperature at the die) values, the dissimilarities are evident, indicating that the levels of dispersion obtained during compounding in a twin-screw extruder are more dependent on the characteristics of local flow patterns (type and intensity of stresses, extent deformation, and flow times), rather than on global energy inputs (that are characterized by such parameters as SME and Amperage). The same type of observations has been reported by authors studying the preparation of nanoclay compounds by melt mixing with the same technology. 30
Extrusion temperature and screw speed
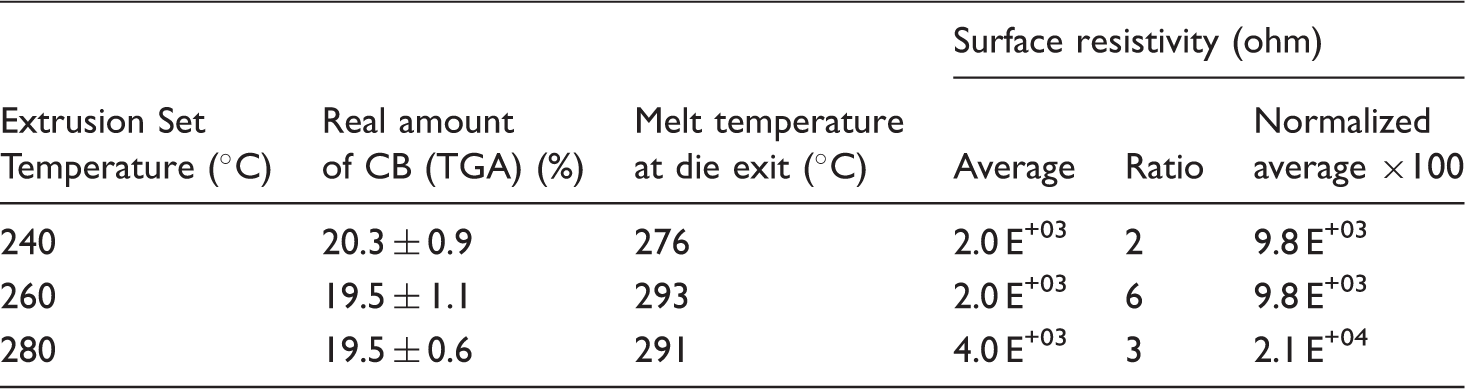
Influence of set temperature on the surface resistivity.
Influence of the screw speed on the surface resistivity.
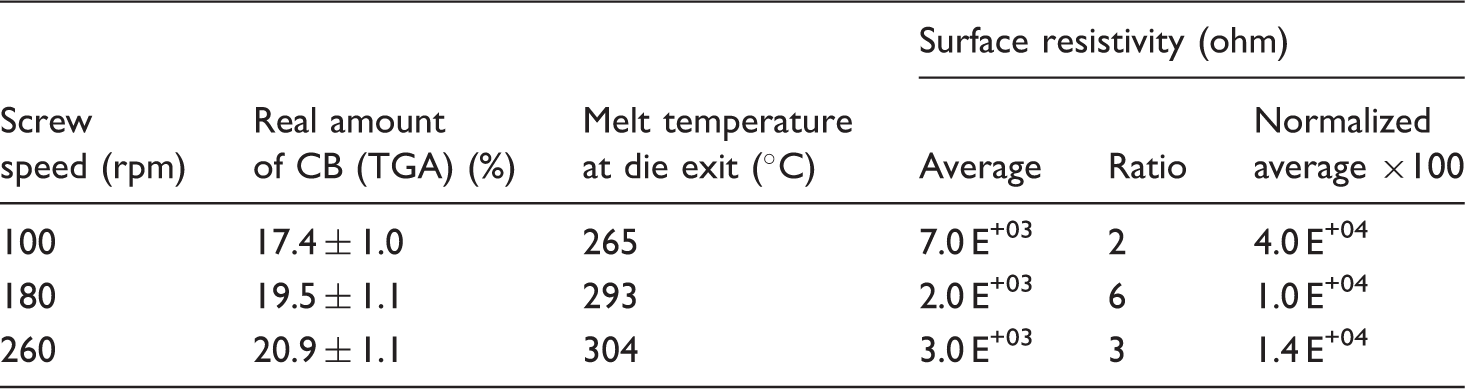
The effect of screw speed on electrical resistivity is also small (see Table 8). Even though screw speed should promote local higher stresses, these may be offset by the resulting higher viscous dissipation. As a matter of fact, at 100 rpm viscous heating at the die outlet is just 5°C, whereas for 260 rpm it reaches 44°C. As a result, the lowest electrical resistivity seems to be obtained at medium to high screw speeds. The axial melt temperature evolution is depicted in Figure 8 both for the unfilled and filled cases processed at the same three different screw speeds. The temperature differences observed at the die outlet are already present at the start of the second mixing zone, the effects of the screw speed and the presence of CB being significant (at the second mixing zone, the average melt temperature difference between unfilled and filled melt is 12°C, whereas an increase in the screw speed of 160 rpm (from 100 to 260 rpm) causes an increase in the melt temperature of 33°C and 39°C, respectively). As shown in Figure 3, the melt temperature discrepancies at L/D = 11 are due to the different local outputs corresponding to processing the unfilled blend and the composites, since CB is only added at L/D = 14. Thus, the presence of CB not only improves heat transfer (see the corresponding slopes of temperature rise) but also promotes viscous dissipation in the filled channels upstream of the second mixing zone.
Effect of the screw speed and presence of carbon black (CB) on the melt temperature development along extruder and die.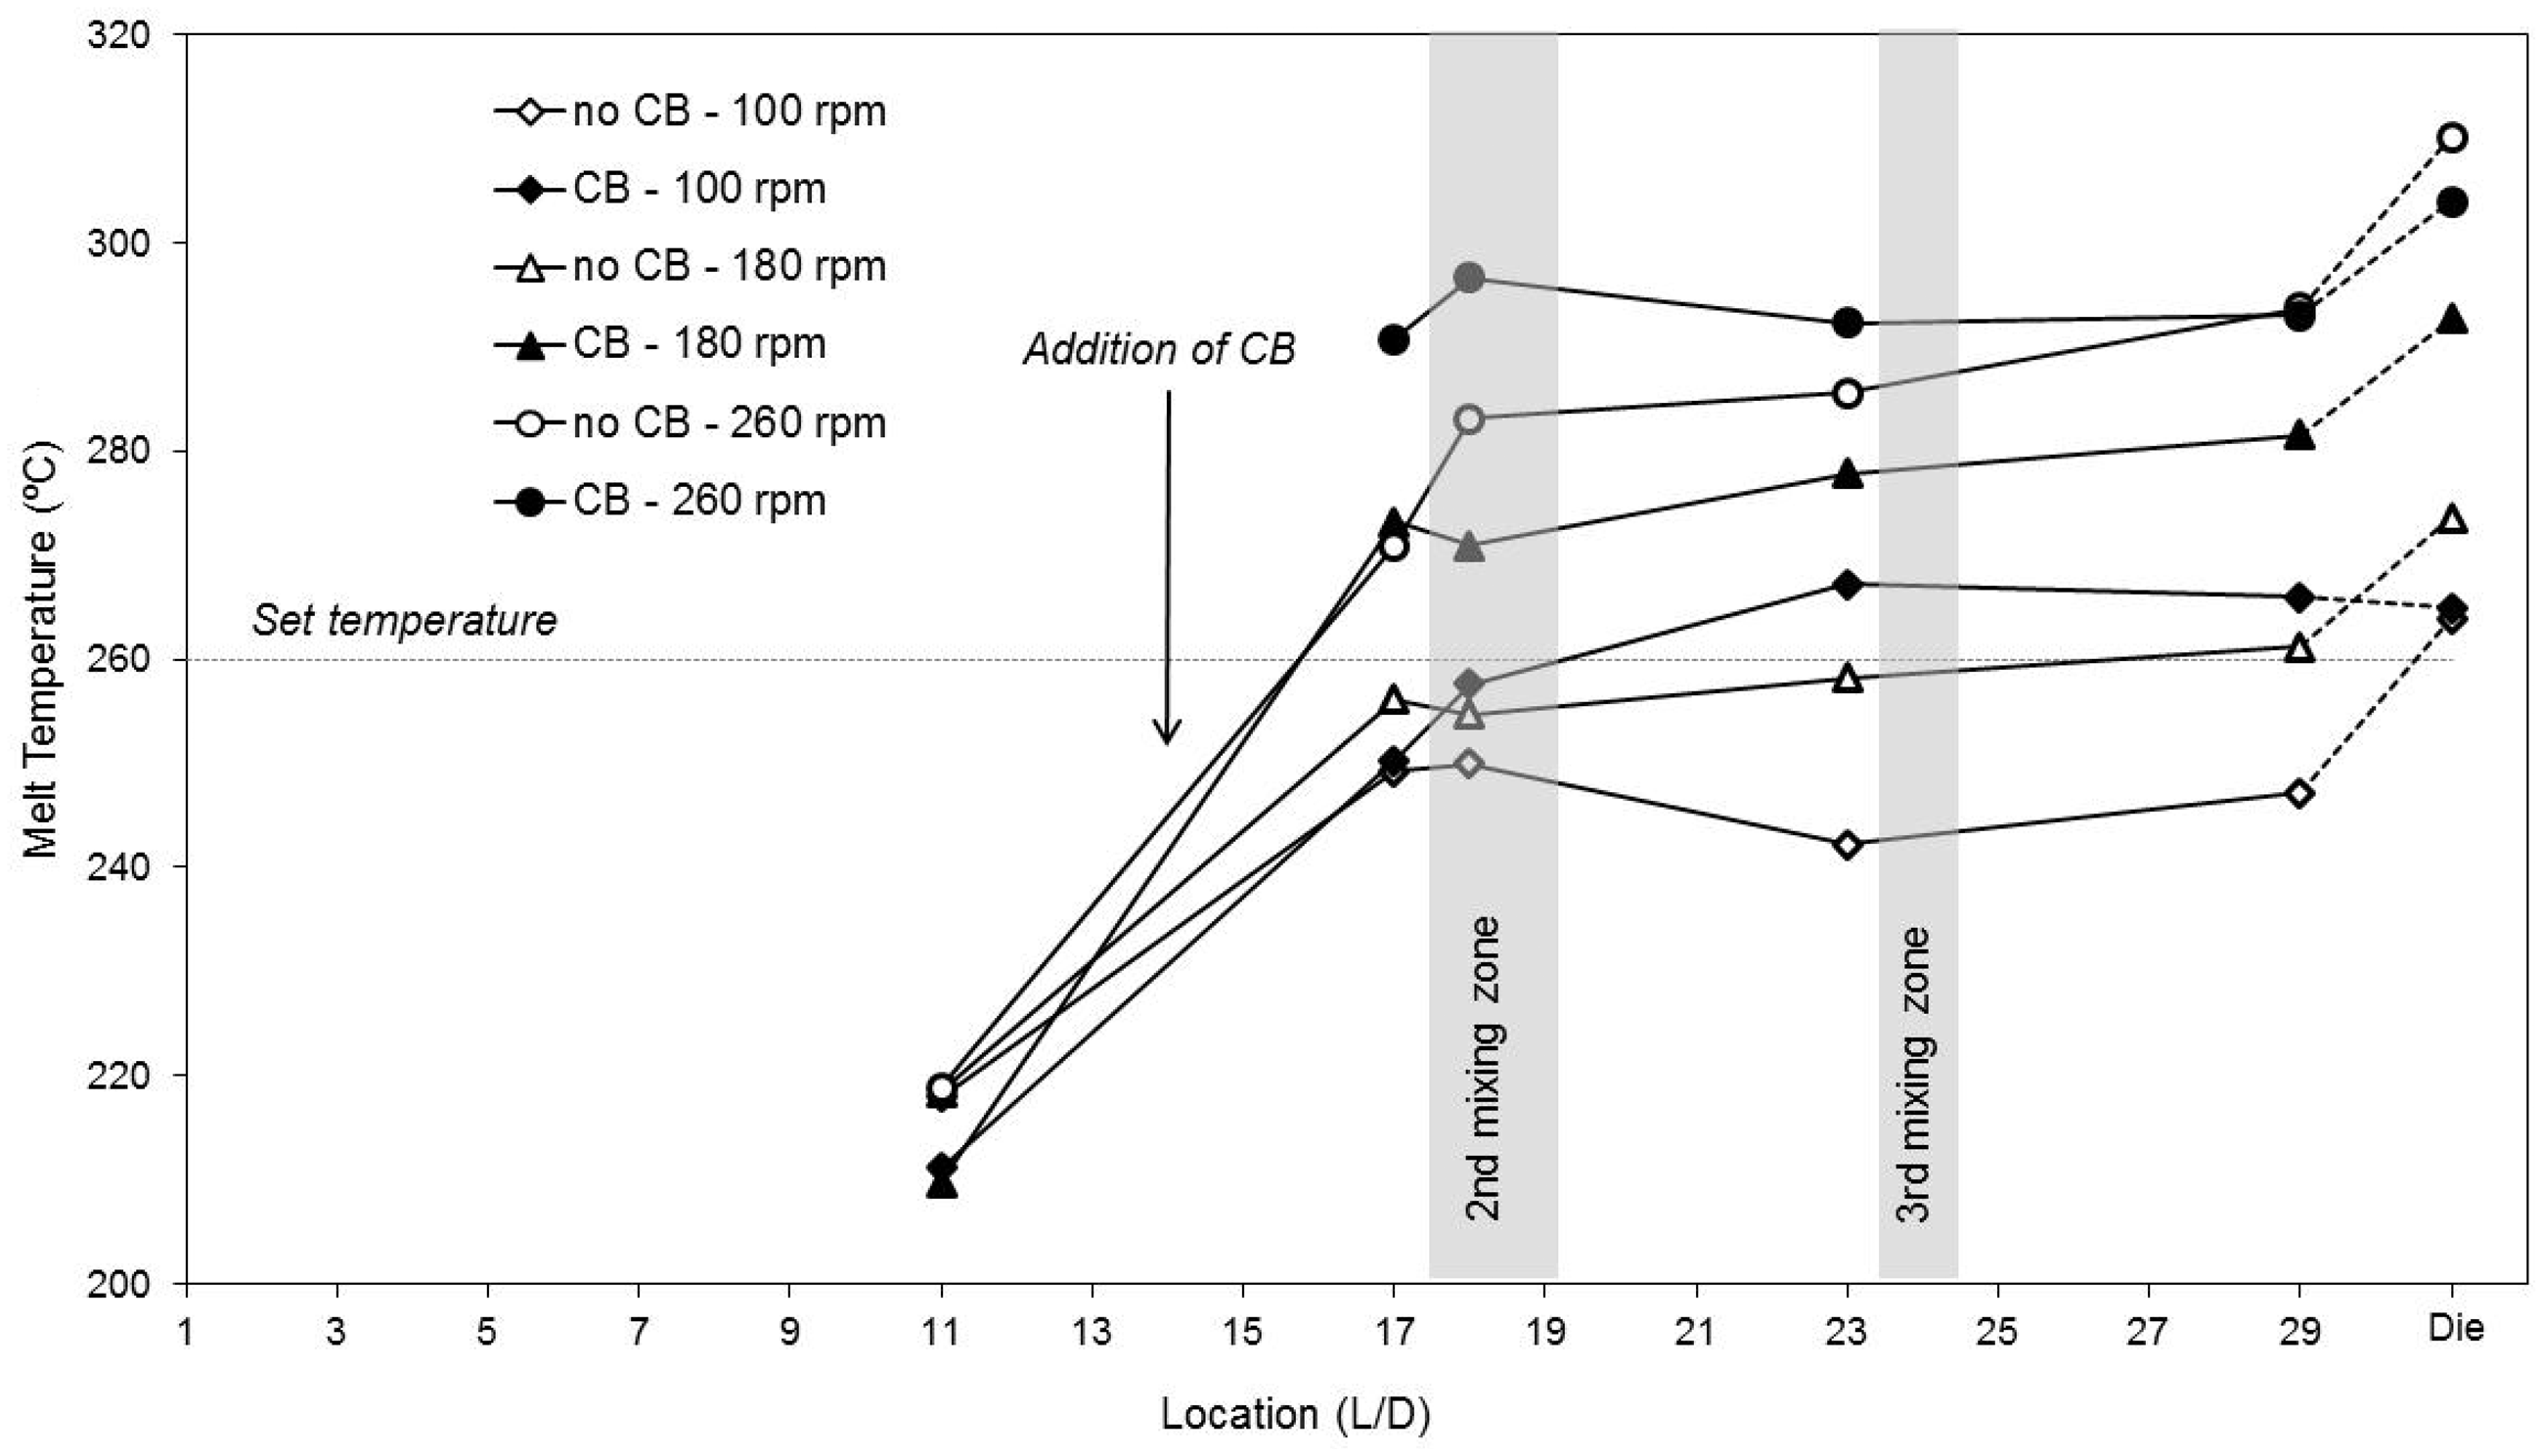
Effect of varying the amount of CB
Since materials with small apparent density, such as CB as received, are difficult to feed accurately, during compounding composites with varying amounts of filler may be unwillingly generated. In fact, in the preceding discussions, the amount of CB was normalized to unit percentage, as it was concluded that the effective quantity of the filler present in the composite was different from the target value. This section aims at investigating how the process parameters and composite characteristics are sensitive to those changes.
Effect of varying the amount of CB on process parameters.
The axial melt temperature evolution presented in Figure 9 follows the same profile as before. From L/D = 18 onward, the development for all materials is essentially parallel. The 3% difference in the CB content may generate a 10–12°C (ca. 4%) difference in melt temperature along the extruder, although the viscous dissipation along the die approximates the final outlet temperatures.
Effect of the carbon black (CB) content on the melt temperature development along the extruder and die.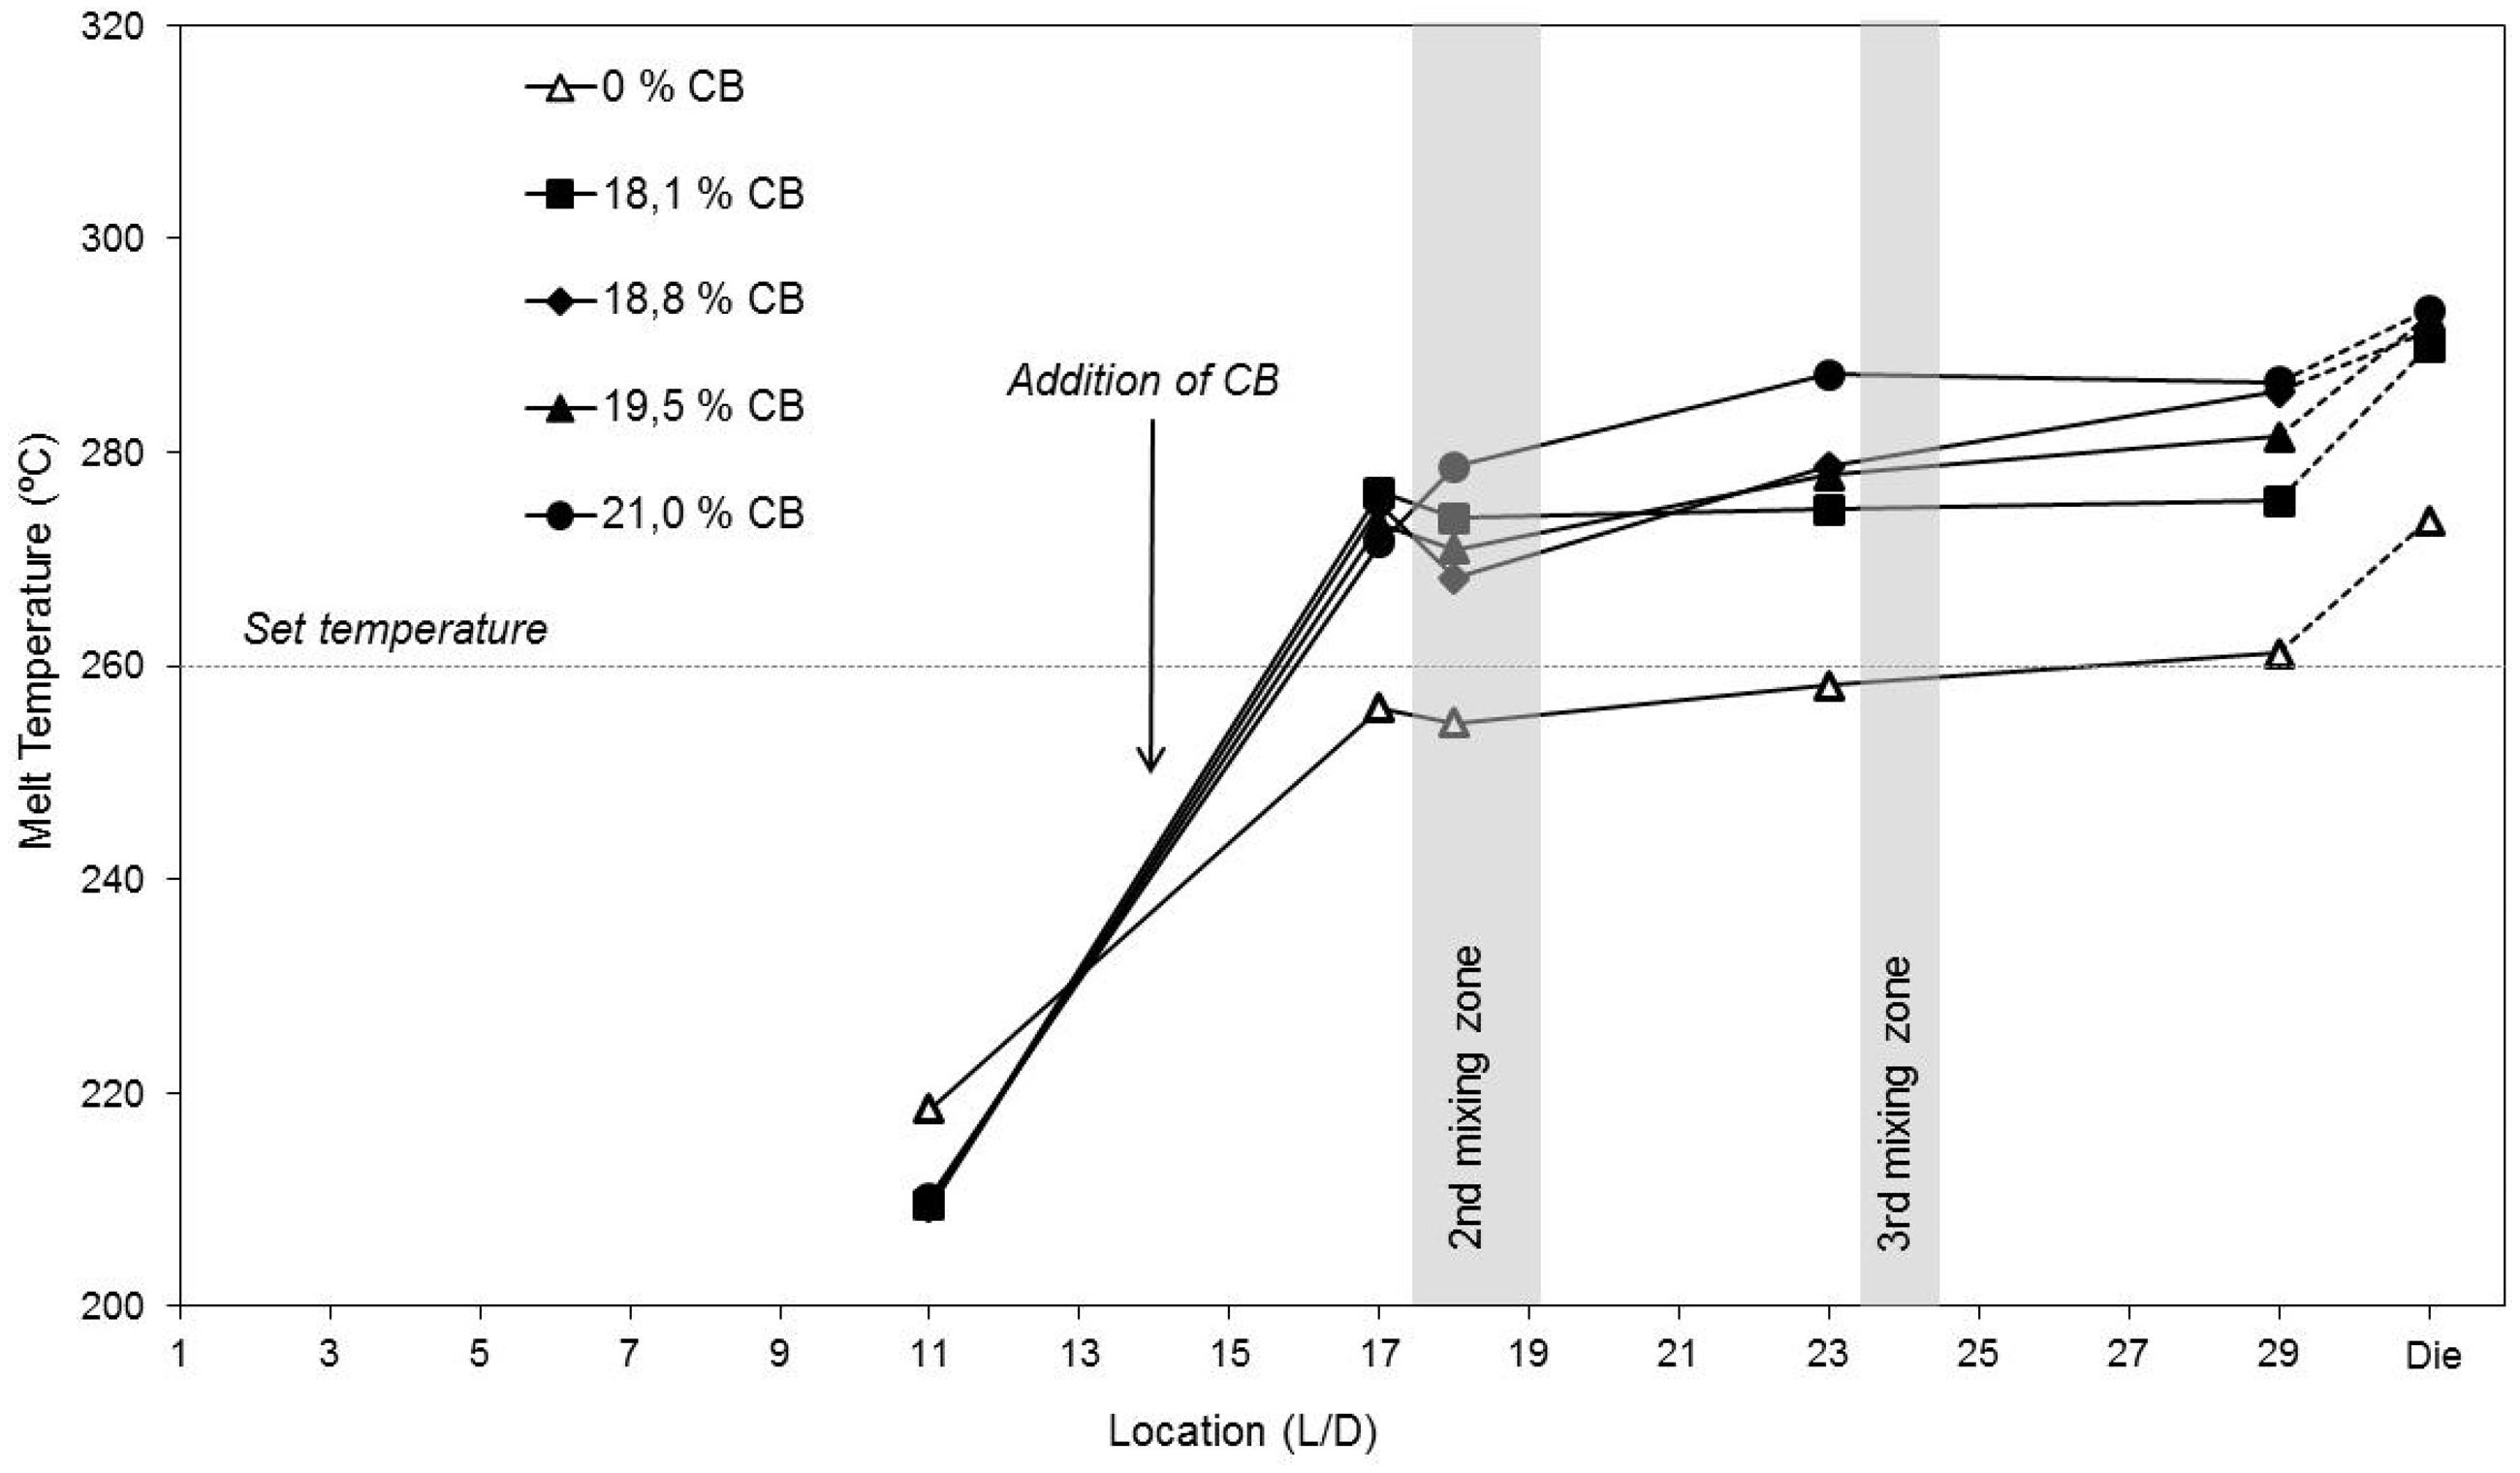
Figure 10 shows the effect of varying the amount of CB on the apparent shear viscosity (at 100 s−1), for three temperatures. Not only the differences are discernible, even at these relatively high shear rates, but the variation is approximately linear (possibly except at 280°C, due to the growing role of matrix degradation). Thus, this result validates the normalization of data to unit CB percentage which, of course, presumes a linear dependence of the effects. Above 1000 s−1, the differences are attenuated due to viscous dissipation effects.
Effect of the carbon black (CB) content on shear viscosity at 100 s−1 (capillary rheometry).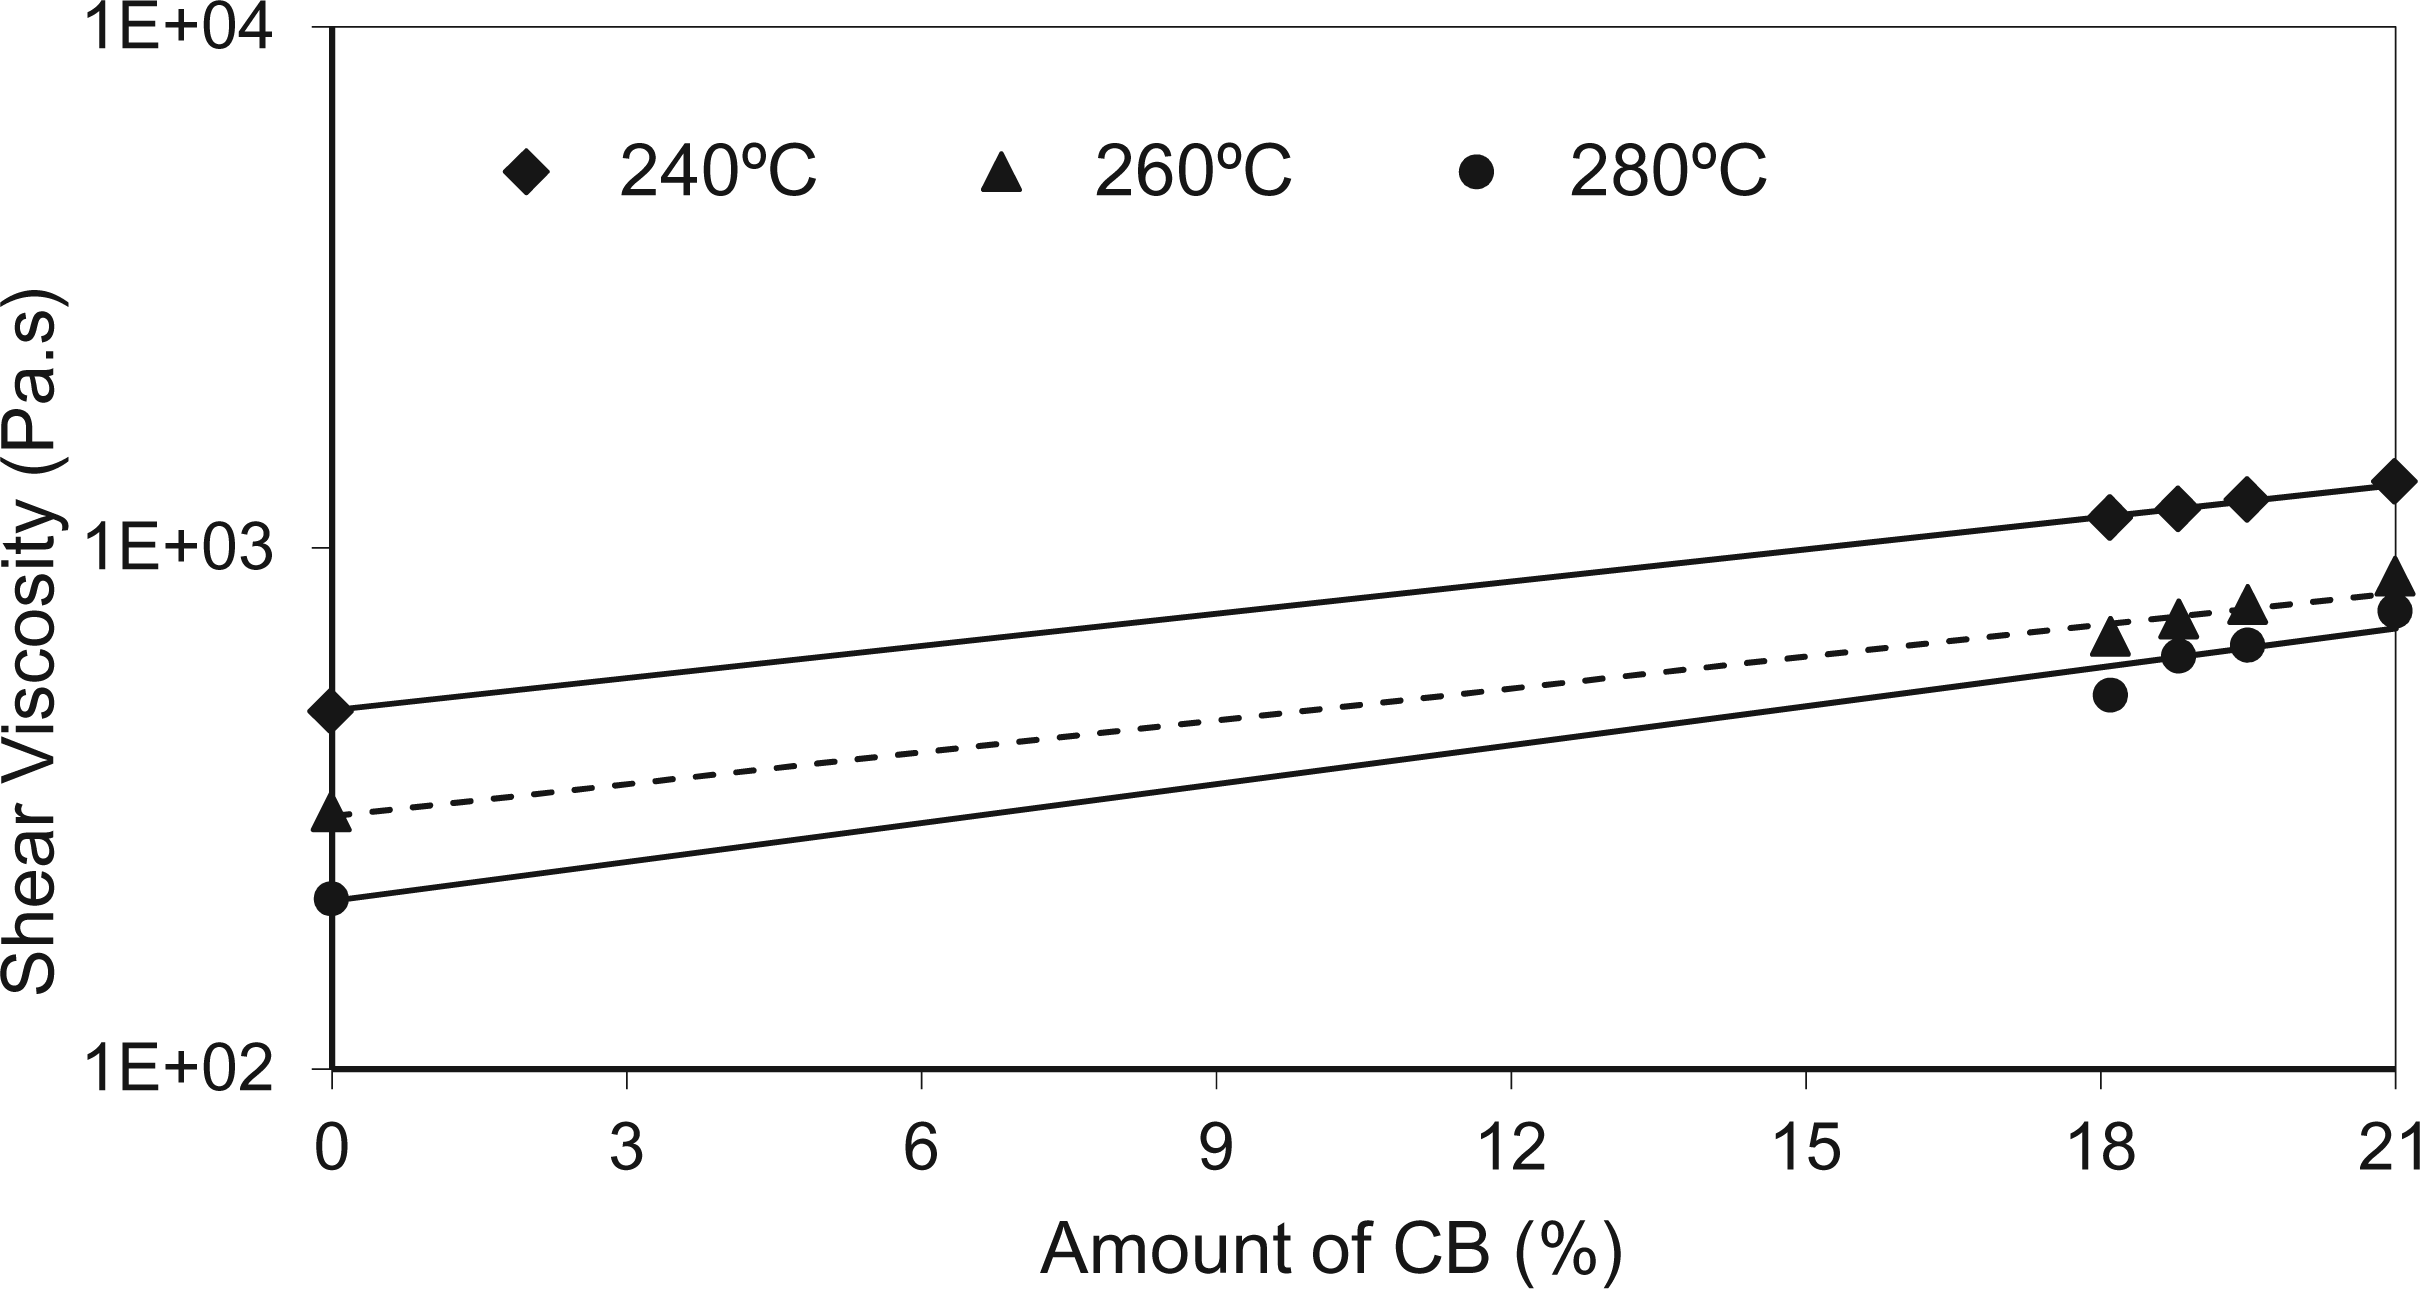
The evolution of the linear viscoelastic behavior of the unfilled blend and its CB composites is illustrated in Figure 11, in terms of G′ (G″, not shown, has a similar trend). The moduli of the blend changes little along the screw, although a drop of the moduli values seems to take place along the second mixing zone, followed by a gradual recovery downstream. Although the melt temperature stays close to the set value (see Figure 3 or 8), this trend could be attributed to PA12 matrix degradation taking place during flow along the second mixing zone, which is the most restrictive (eight kneading discs staggered at −60°), that is balanced by the gradual improvement of the dispersion of the polyether block amide thermoplastic elastomer in the matrix. The addition of CB raises the values of the moduli (as expected, G′ becomes higher than G′′), but the trends are identical. The higher the CB content, the higher the G′ and G′′. Between L/D = 17 and L/D = 18, the rate of G′ growth decreases steadily with the CB content (this effect is less evident for G′′). In fact, it raises from 44,123 Pa at L/D = 17 to 72,542 Pa at L/D = 18 for 18.1% CB, whereas it reduces from 94,954 Pa to 88,014 Pa for 21% CB. Taking into account that the associated viscous dissipations differ ca. 10°C (see Figure 9), it is clear that the values of the moduli result from a balance between matrix degradation and CB content (and dispersion).
Effect of the carbon black (CB) content on the linear viscoelastic response (at 10 rad.s−1 and 260°C) along the extruder and die.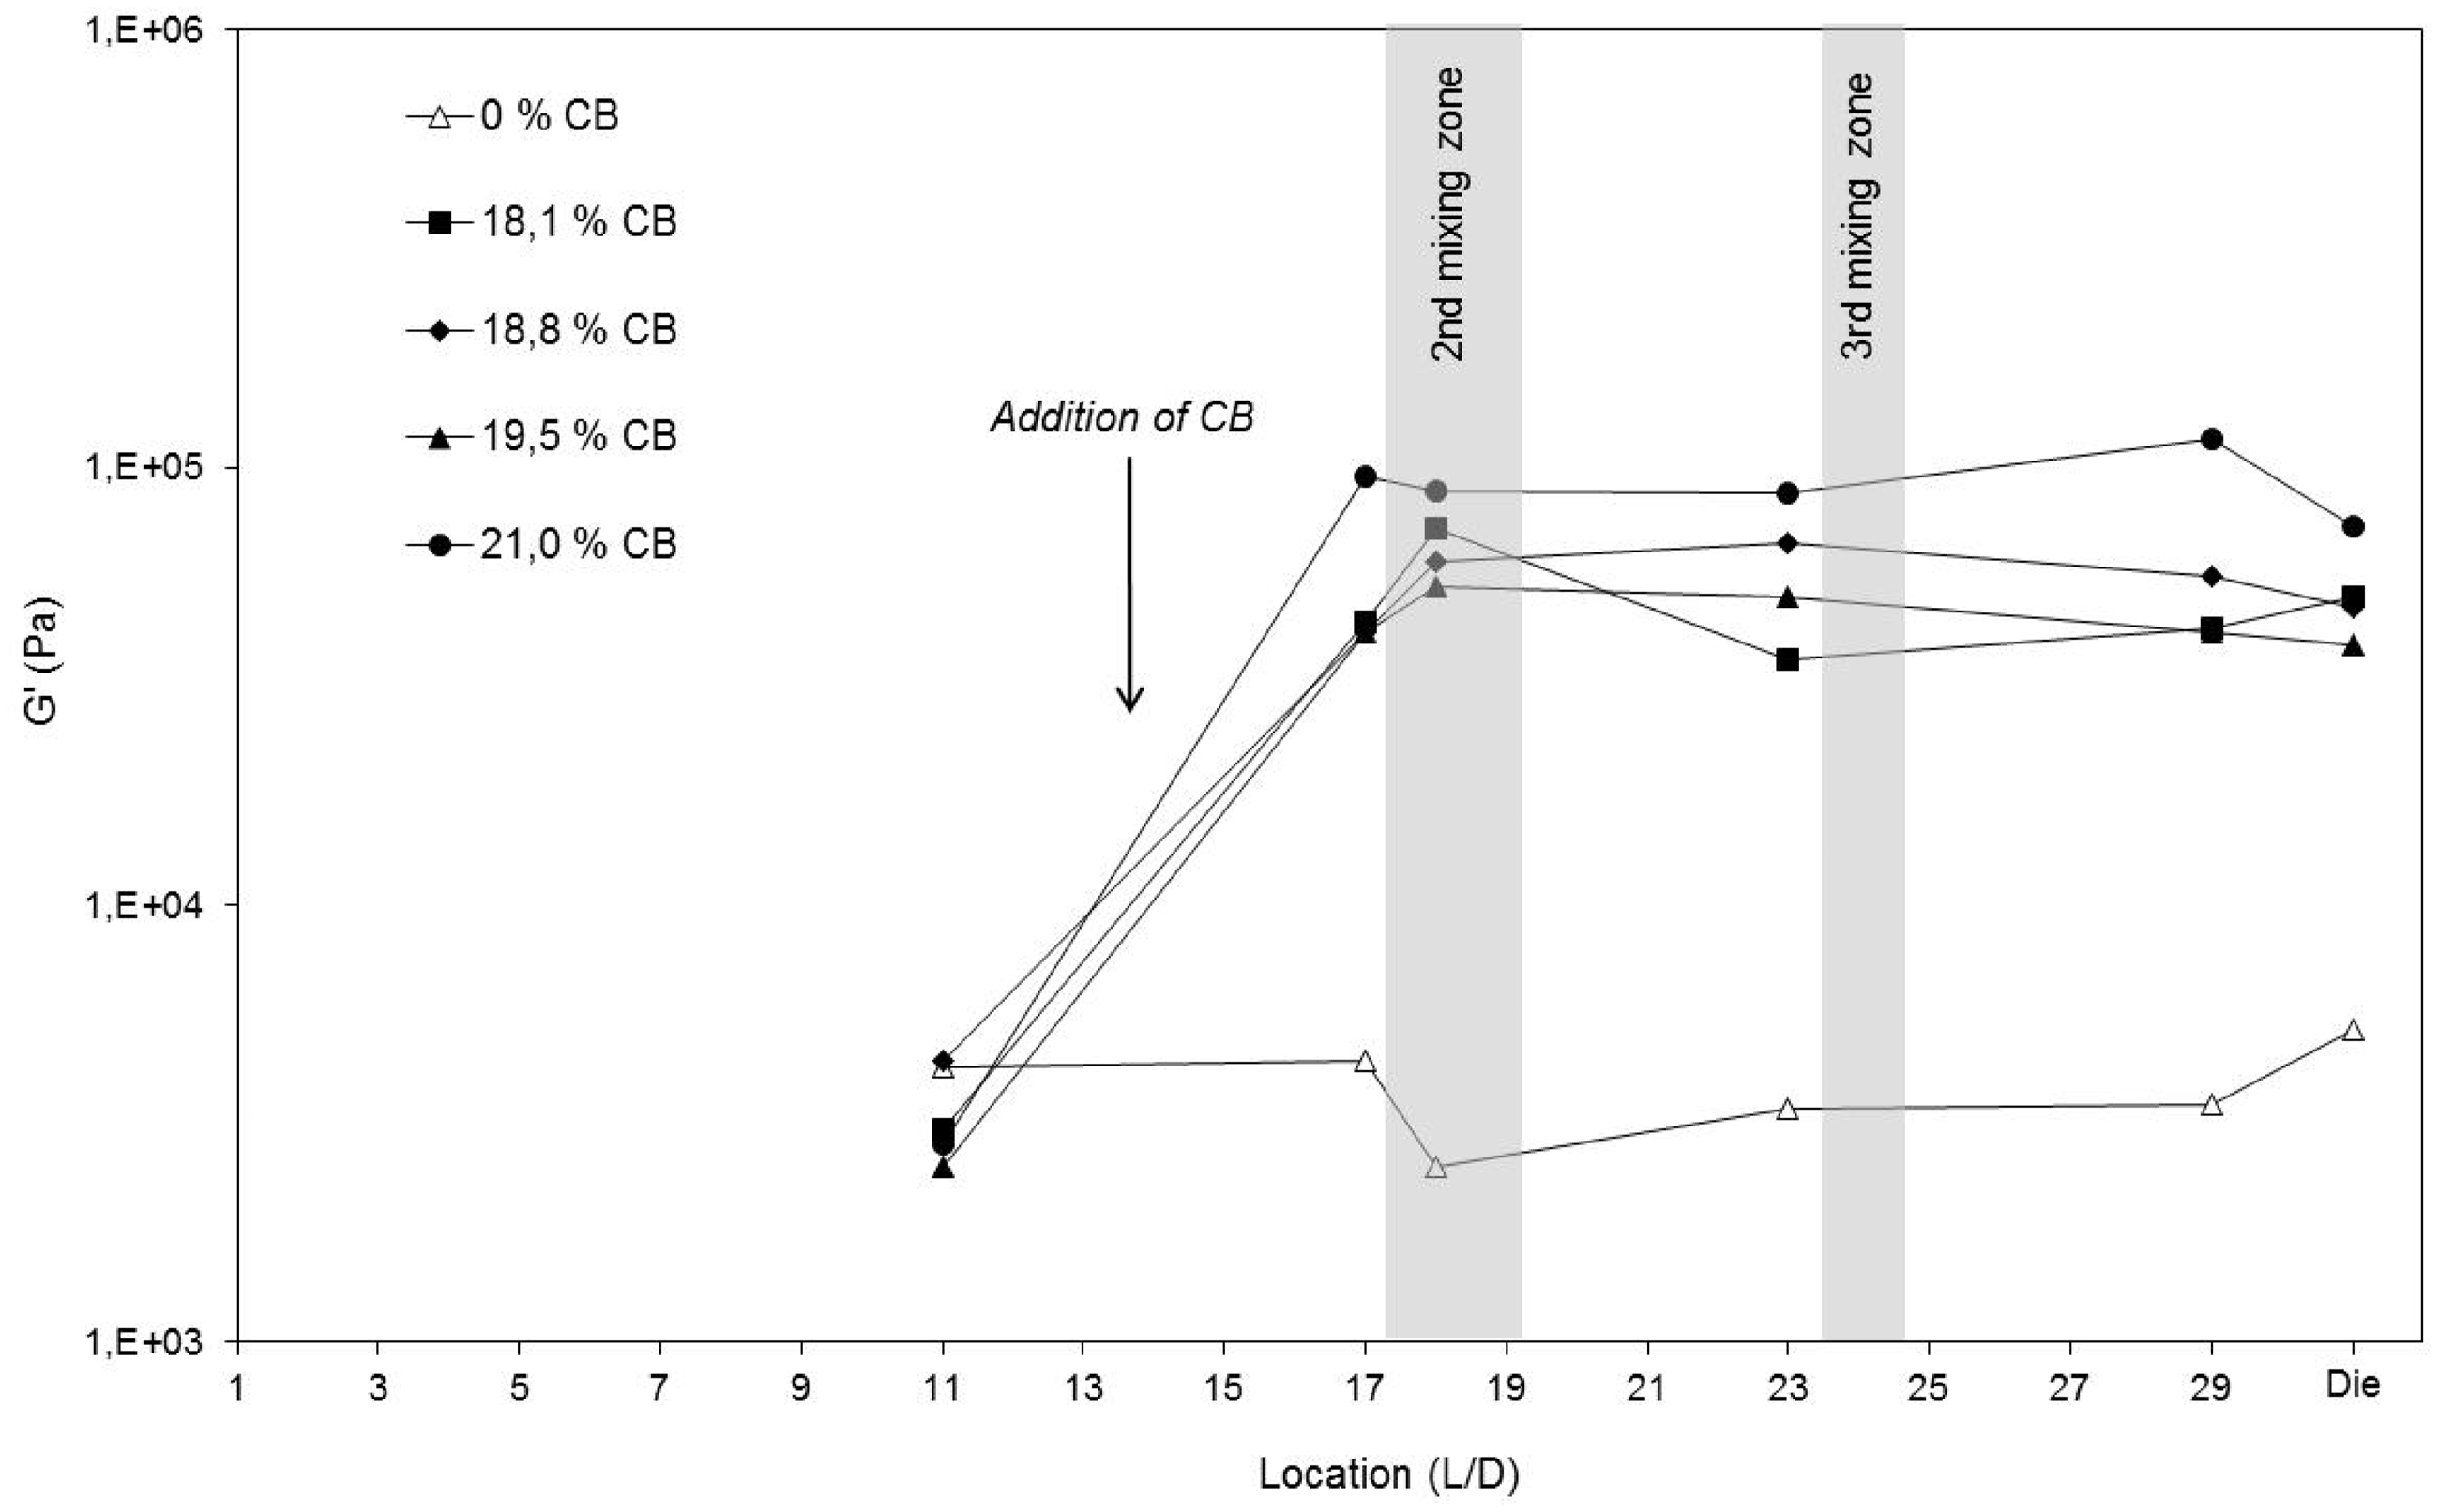
Effect of the CB content on surface resistivity.
Correlations between electrical resistivity and material characteristics/processing parameters
As seen in Figure 12, the set of extrusion runs presented in Table 2 generated composites with differences in surface resistivity of up to three orders of magnitude (for a maximum variation of CB content of 4%). Changes in the feeding sequence and screw geometry are particularly relevant in this respect. The lowest resistivity values were obtained for a combination of sequential feeding, highly restrictive screw (second mixing block consisting of discs staggered at −60°), low-set temperature (240°C), and moderate screw speed (180 rpm).
Absolute and normalized (to unit carbon black (CB) percentage) surface resistivity of composites prepared under different compounding conditions.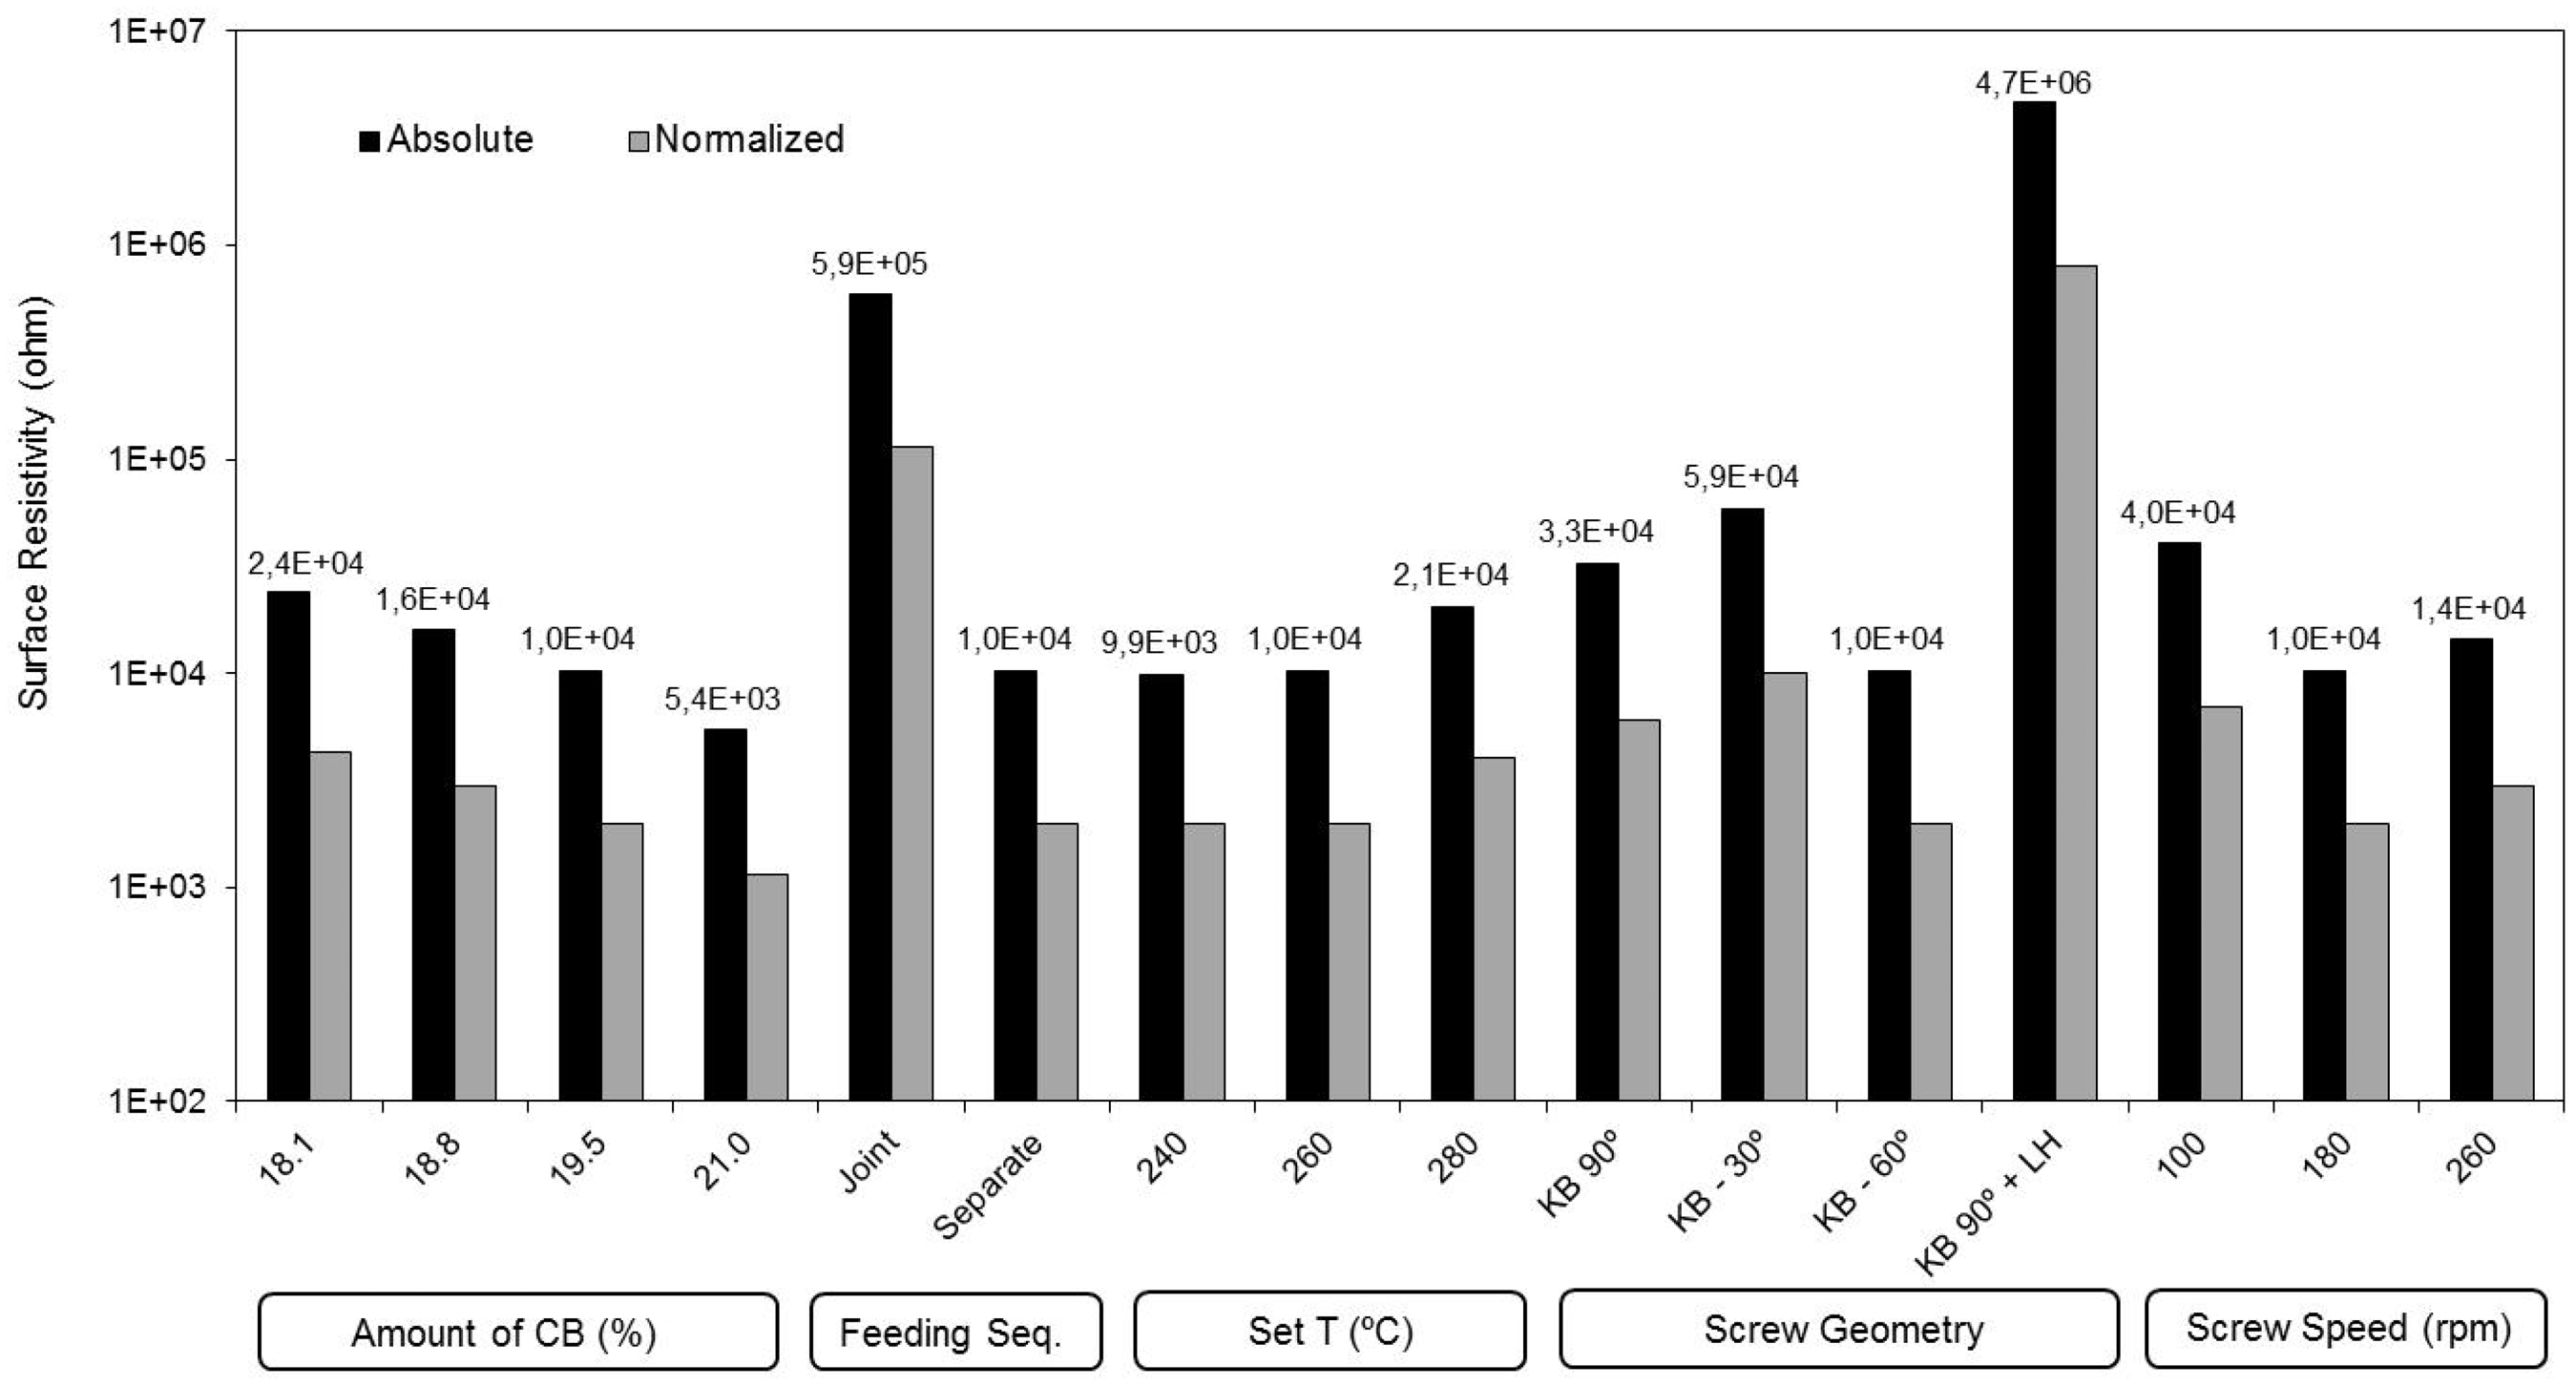
In an attempt to establish correlations between electrical performance and material or processing parameters that could be used in practice for design or quality control purposes, Figure 13 plots SME, Amperage, and G′ against surface resistivity, considering all the extrusion runs performed in this study. The difficulty in establishing such relationships is made more difficult by the limited variation of the CB content. Within reasonable boundaries, resistivity should be proportional to dispersion, since the latter generates more conductive paths within the nonconductive polymer matrix. Although SME and Amperage measure the global energy input to the process, they seem to be largely insensitive to surface resistivity variations. As discussed above, the levels of dispersion obtained in a twin-screw extruder are probably more dependent on the characteristics of local flow patterns (type and intensity of stresses, extent of deformation, and flow times) rather than on global averages. Unfortunately, it is quite difficult to elect a process parameter that can be readily quantified and that adequately represents the local flow characteristics. Thus, the alternative seems to consist either in the direct evaluation of dispersion or in the use of a material characteristic that correlates well with dispersion. The former usually requires the adoption of time-consuming and expensive microscopy techniques associated to image analysis, often also involving laborious sample preparation. As for the latter, the rheological response comes as an evident possibility, given the accepted effect of dispersion levels on the rheological response of suspensions and filled systems.
7
In fact, it has been suggested that the distance at which two agglomerates begin to interact with each other is similar to that at which an electron can easily be transferred.
16
The correlation between G′ and surface resistivity presented in Figure 13 is far from ideal, but it seems to deserve further investigation. Recent efforts to develop on-line oscillatory rheometry
31
provide a greater practical value to this relationship, as it could be used in real time on the production scale for quality control purposes.
Specific mechanical energy (SME) (a), Amperage (b), and G ′ (c) versus surface resistivity for the extrusion runs of Table 2.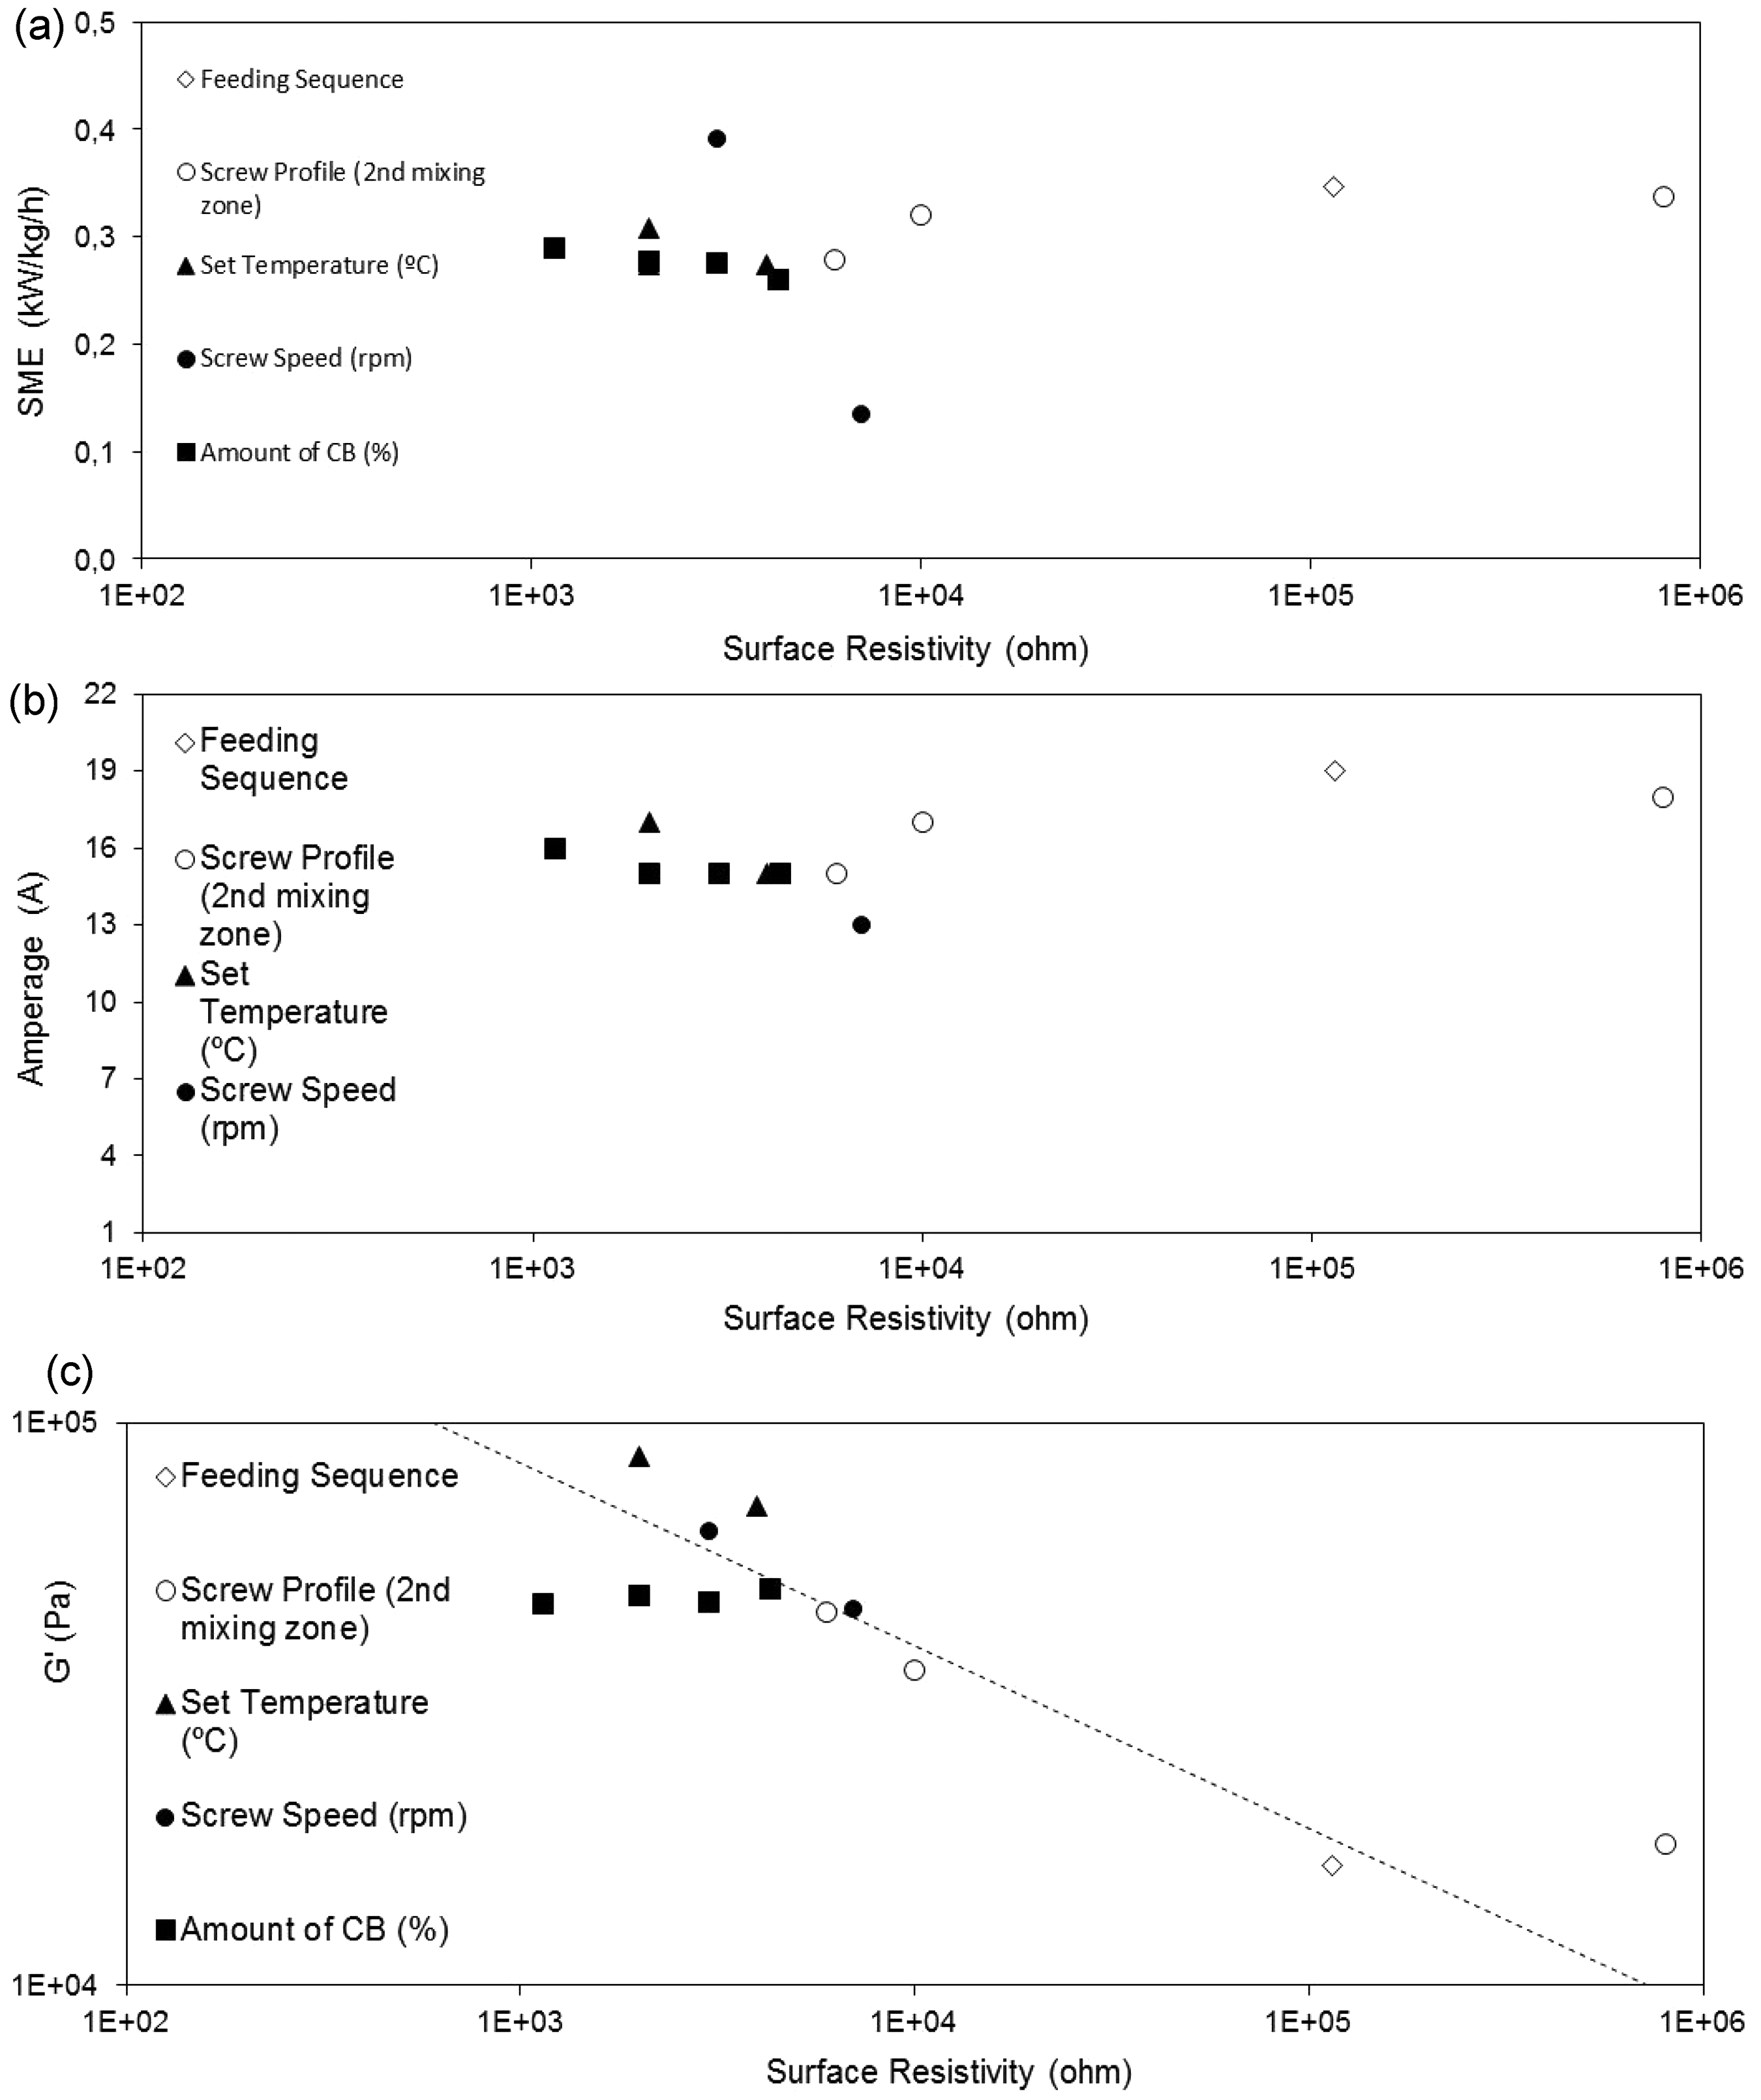
Conclusions
The effects of processing (operating conditions, feeding sequence of the ingredients, and screw profile) and of small variations in the feeding rate of the filler were investigated for an electrically conductive polyether block amide thermoplastic elastomer/PA12 – CB composite in terms of the melt temperature and rheological response along the extruder axis, of global process parameters and of the characteristics of the extrudates.
The set of extrusion runs explored, where changes in the CB content limited to 3% were made, caused variations in surface resistivity of up to three orders of magnitude. Feeding sequence and screw geometry were the most relevant processing variables. The lowest surface resistivities were obtained for a combination of sequential feeding, highly restrictive screw, low-set temperature, and moderate screw speed. Under fixed operating conditions, changes in the CB content of 4% caused measurable differences in the rheological and electrical characteristics of the extrudate.
The evolution of the melt temperature and viscoelastic moduli (G′ and G′′) along the barrel demonstrate that dispersion results from a combination of local flow conditions and viscosity (in turn, this depends on temperature, CB percentage, and matrix degradation intensity).
Global process measures such as SME and Amperage do not correlate well with dispersion/electrical performance. Conversely, the linear viscoelastic response showed a good sensitivity.