
Abstract
Commercially available TiO2 and BaSO4 nanoparticles were incorporated in polyamide 6 (PA 6) via twin screw extrusion. The primary particle size of these two nanoparticles was 15 nm and 20 nm, respectively. The compounds were manufactured via multiple extrusion and dilution processing steps. The dispersion of the nanoparticles in the matrix was investigated by scanning electron microscopy and image analysis. The mechanical properties were determined via tensile and bending tests. The toughness was investigated by the Charpy V-notch impact strength test. It was found that for TiO2 fillers a threefold extrusion process is sufficient to realize a dispersion index of 94.4%. BaSO4 fillers were hardly dispersible, ending up with a maximum dispersion index of 71%. Tensile and bending properties are maintained constant, or can be improved with the number of performed extrusion steps. Despite good deagglomeration, impact strength at low concentrations was not improved in case of TiO2, which is probably due to remaining microagglomerates.
Keywords
Introduction
The reinforcement of thermoplastic polymers with microparticles increases stiffness but decreases the impact strength and tensile strength.1,2 Nanoparticles are applied in order to counteract this behaviour. 3
The effect of nanoparticles on mechanical properties is highly dependent on their dimensions. There are three different types of nanoparticles which must have, at least, one of their dimensions in the nanometre scale:2, 4 one-, two- and three-dimensional types. 5 Considering a spherical particle, the relation of specific surface to volume of the particle is given by:
where S is the surface area, V is the volume and r0 is the radius of the particle [6]. There is a reciprocal correlation between the radius and the ratio of surface area to volume which shows a good match with the characteristic high specific surface area of nanoparticles [6]. Decreasing the radius of particle leads to an increase of the ratio of surface area to volume.
There are two different ways to produce nanoparticles: The most popular as regards polymer nanocomposites is the deagglomeration of macroagglomerates based on nanoparticles, the so-called primary particles (top-down) (Figures 1 and 2) [7–22]; the other method is in situ, for example via sol-gel chemistry (bottom-up) [7, 23]. Nanoparticles agglomerate due to van der Waal’s forces in order to reduce their surface activity (Figures 3 to 6) [5]. However, in order to improve the material properties, for example mechanical properties, a good dispersion as well as distributionof the respective nanoparticles in the polymer matrix is required.
Scanning electron microscopy pictures of (a) TiO2 and (b) BaSO4 nanofiller agglomerate in a PA 6 matrix. Scanning electron microscopy picture of well-dispersed TiO2 nanoparticles in a PA 6 matrix. Scanning electron microscopy picture of the TiO2 nanoparticles reflecting large agglomerates. Scanning electron microscopy pictures of the TiO2 nanoparticles, closer view. Scanning electron microscopy picture of the BaSO4 nanoparticles reflecting large agglomerates. Scanning electron microscopy pictures of the BaSO4 nanoparticles, closer view.
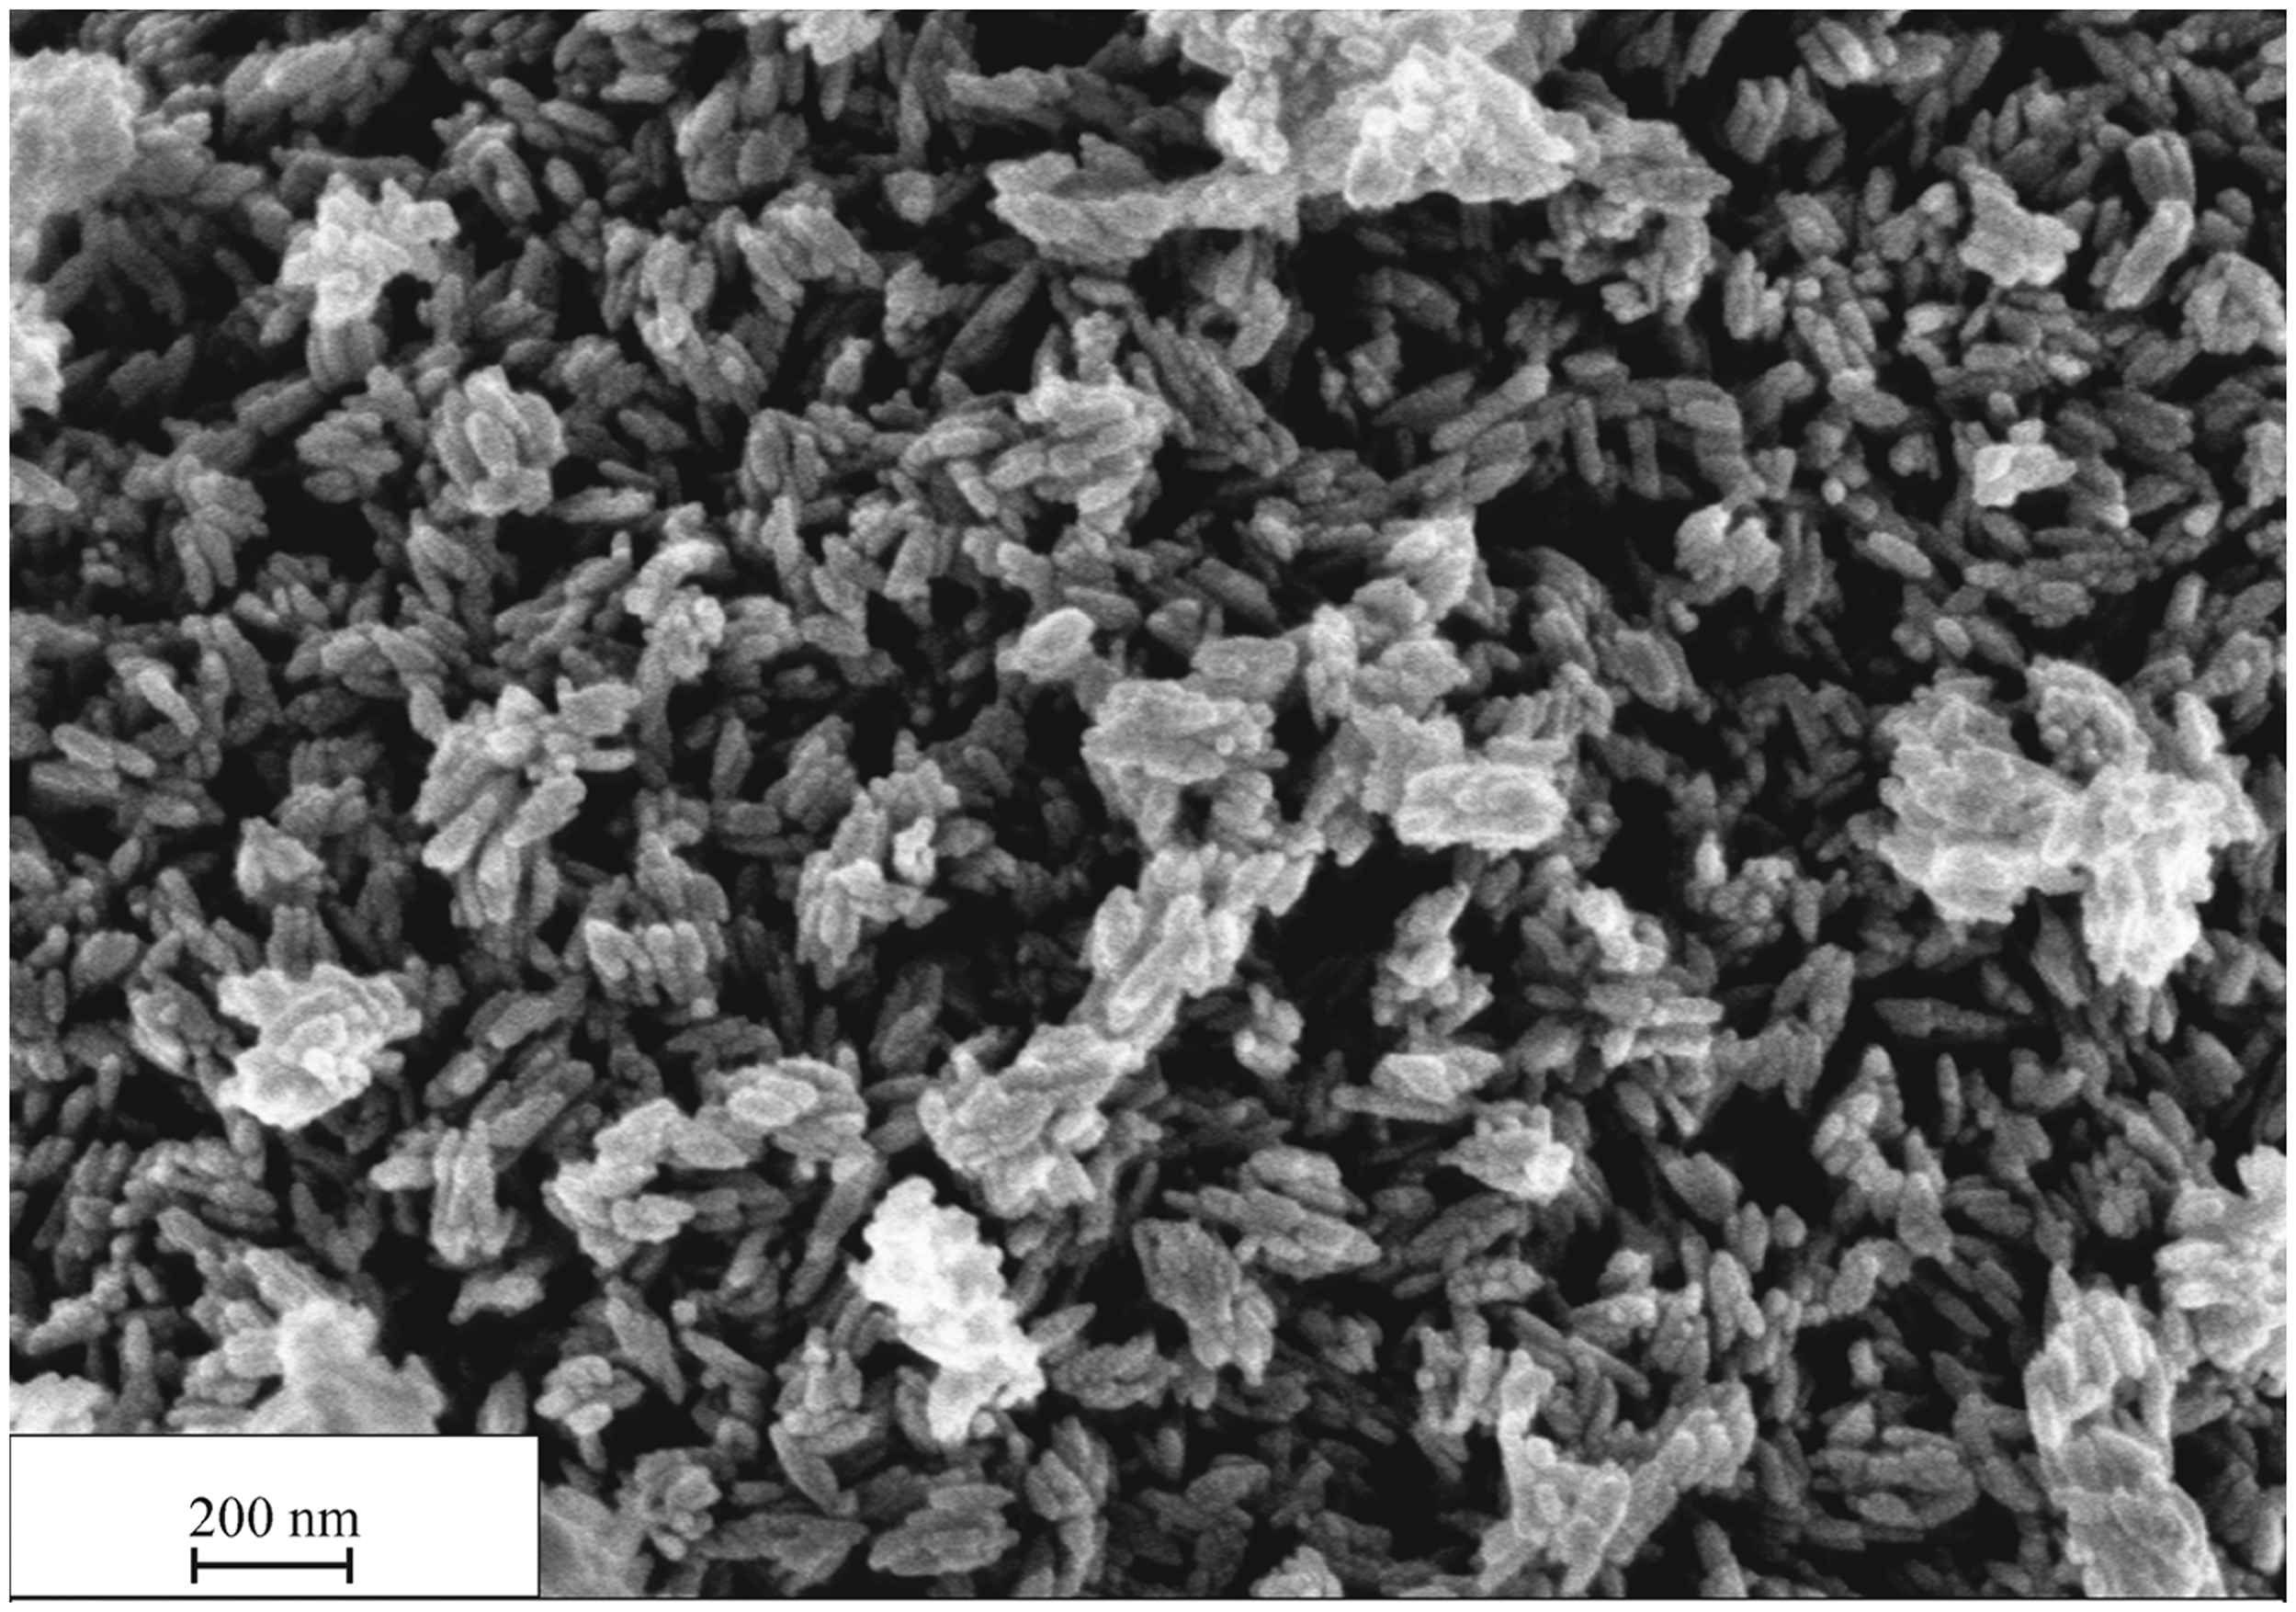
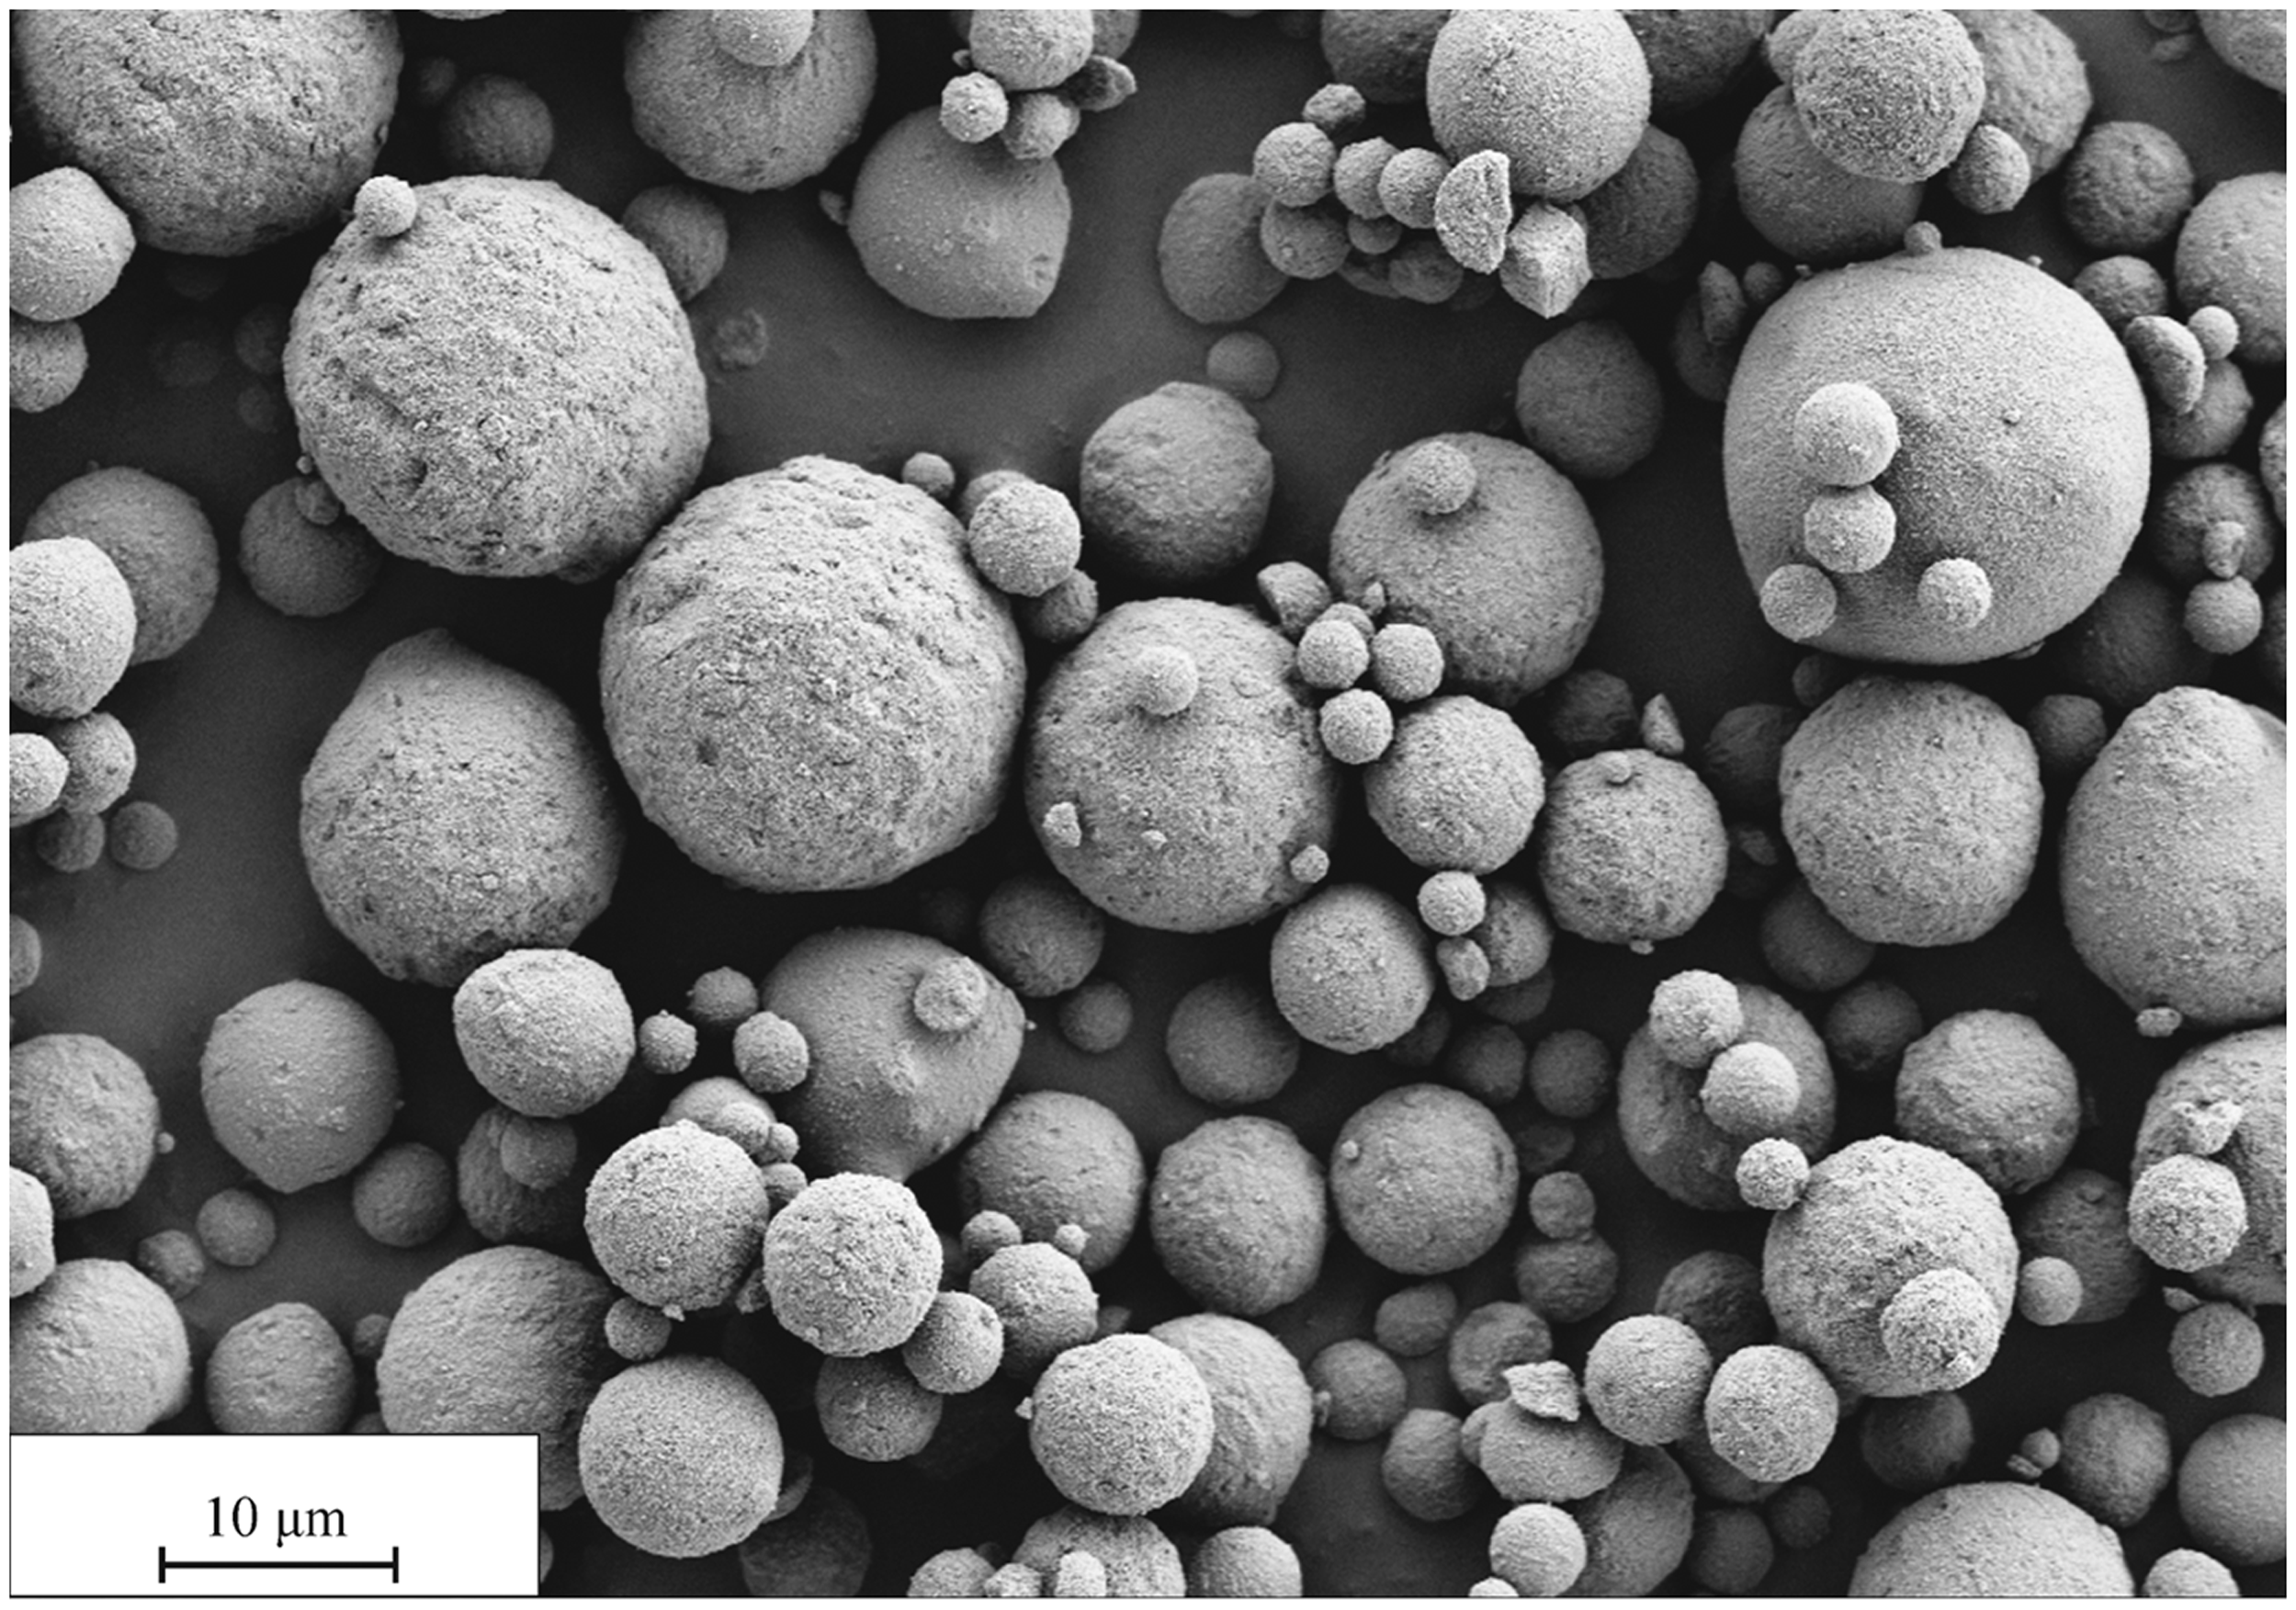
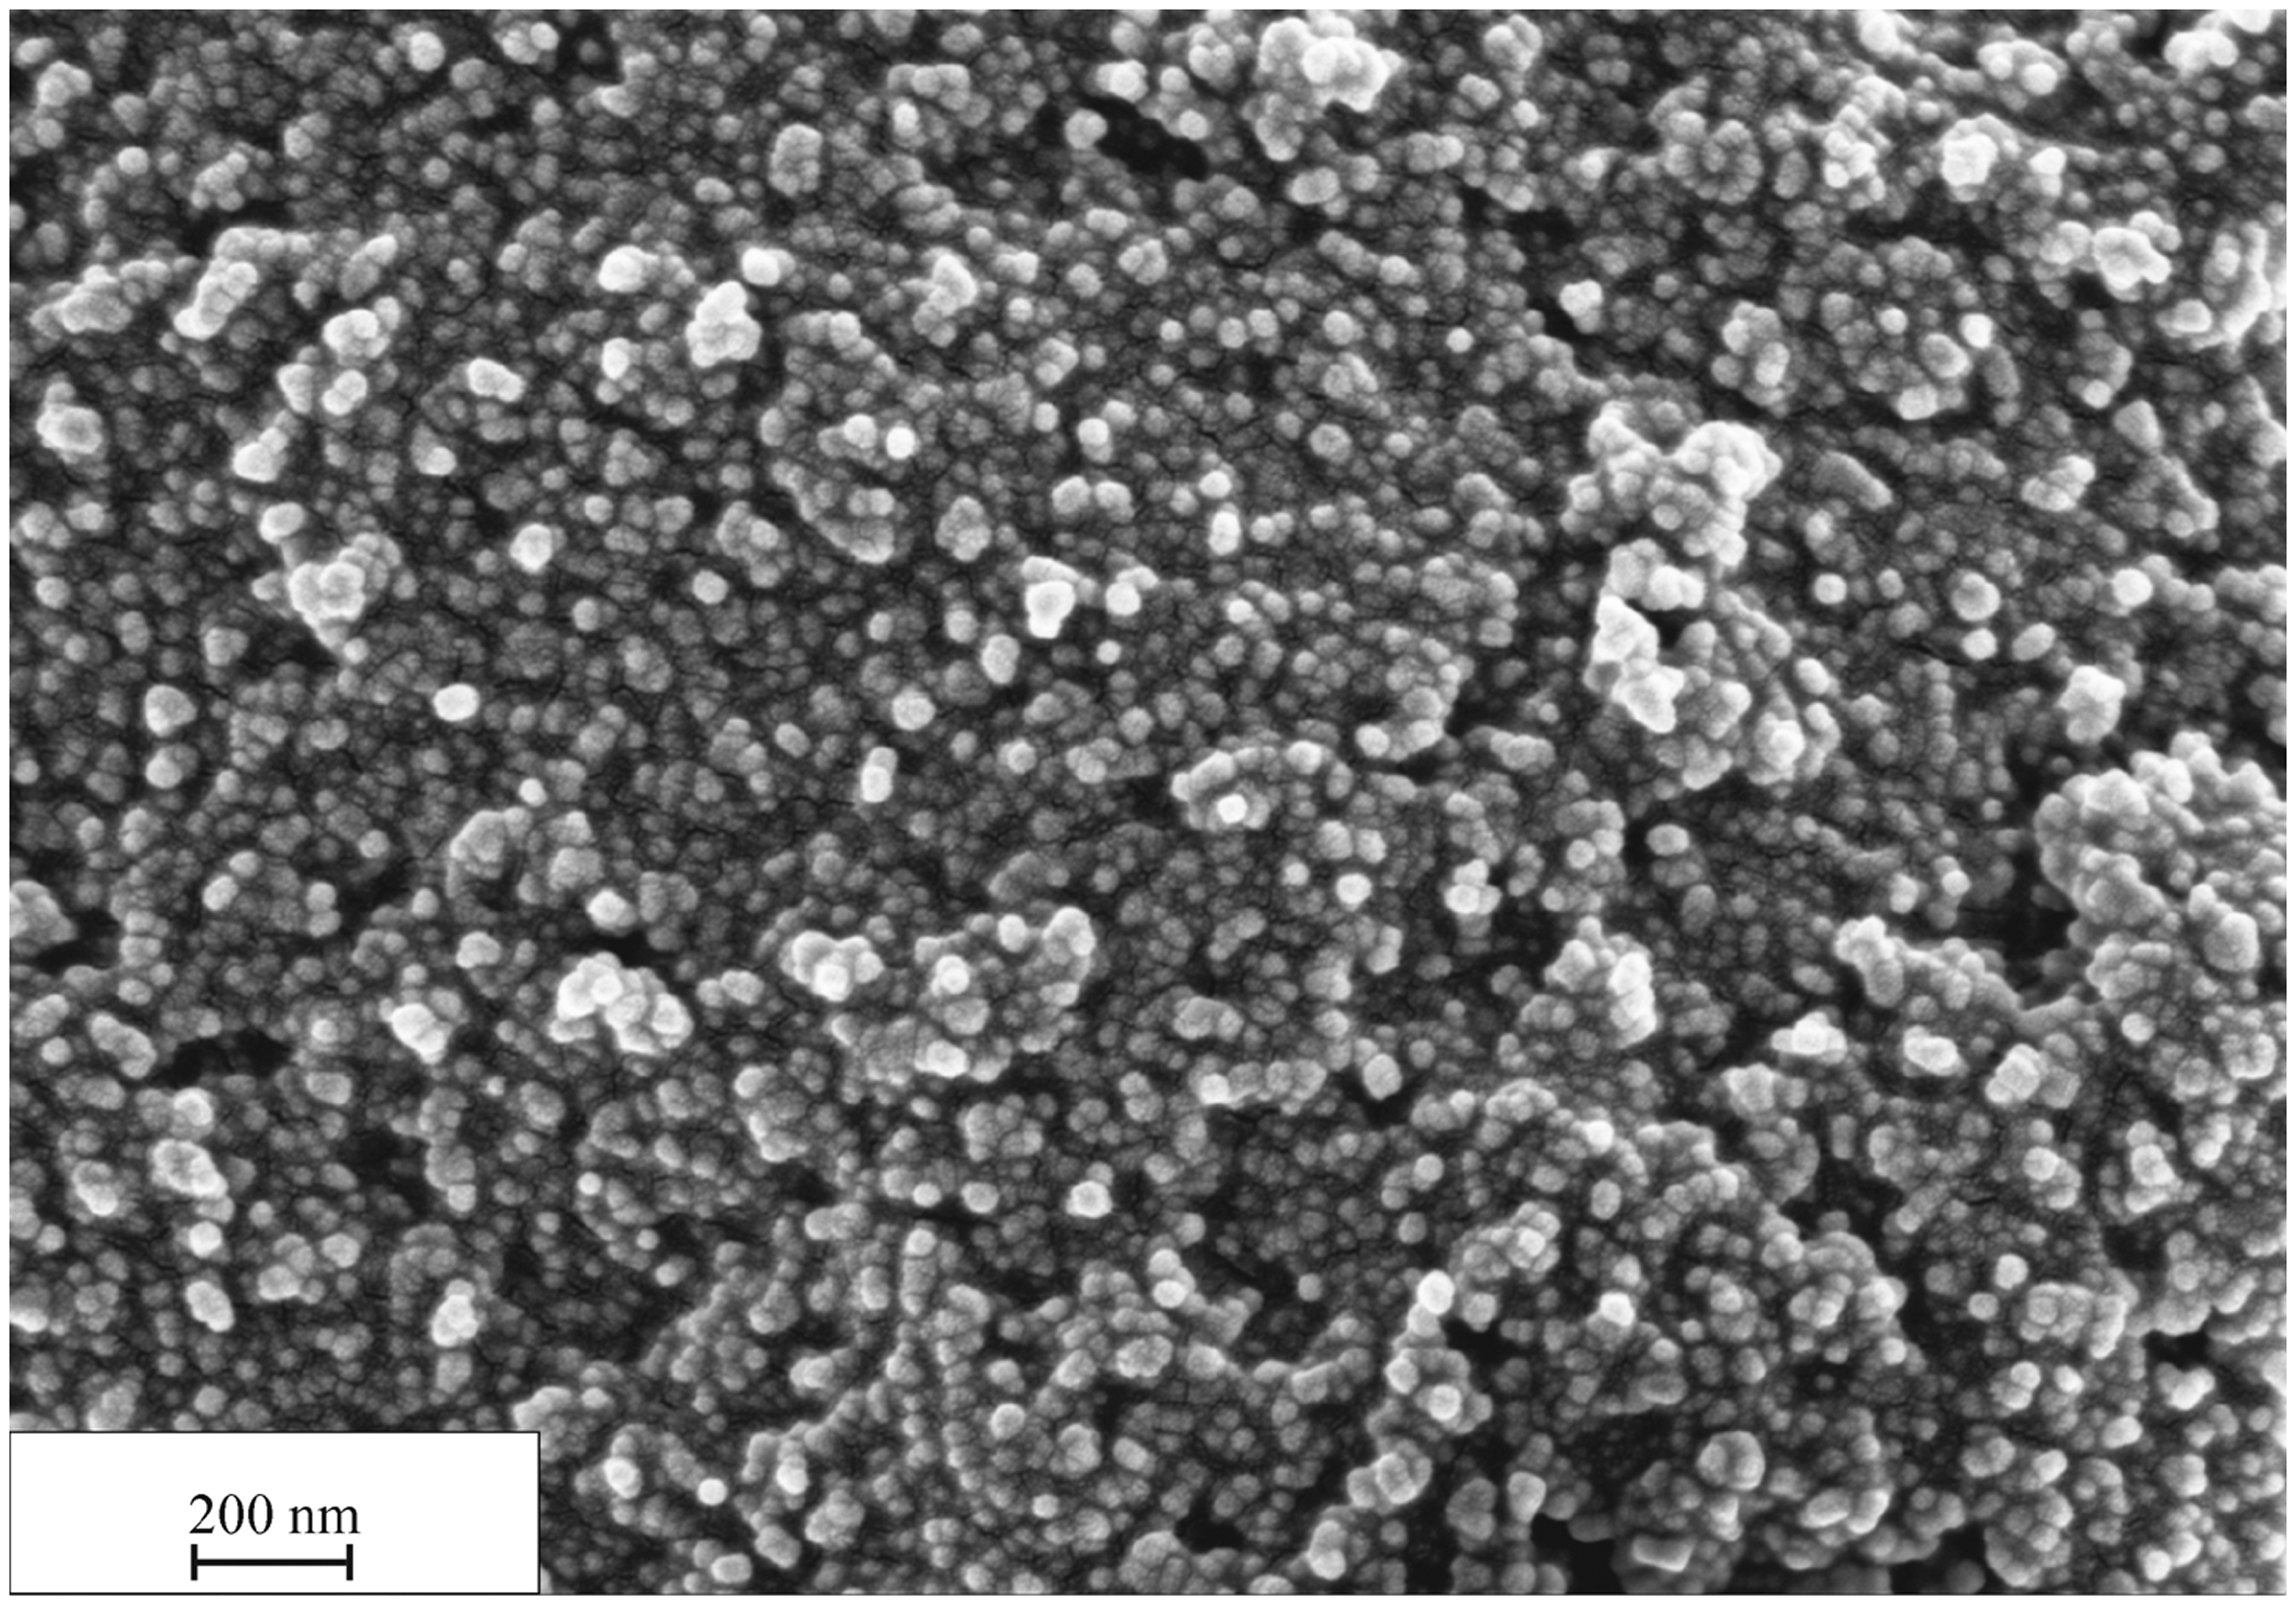
The nanoparticles used in this paper are TiO2 macroagglomerates with a primary particle size of 15 nm and BaSO4 macroagglomerates with a primary particle size of 20 nm. In comparison with BaSO4, which shows an ideal spherical shape (Figure 6), TiO2 reveals a more irregular shape with an organic surface coating based on polyalcohol (Figure 4). This type of coating is responsible for stabilizing the particle itself and for building up van der Waal’s forces between the polymer matrix and particle, improving the mechanical properties [24].
There are many different ways to produce particle-reinforced thermoplastics, but the most important economical one is the continuous extrusion process [25]. This study will therefore focus on finding the most efficient deagglomeration (top-down) parameter set to improve the mechanical properties. Until now, research on thermoplastic nanocomposites, based on the top-down method, has been an ongoing process regarding improvement of processability. The goal of this project is to develop PA 6 nanocomposites in order to process them via melt spinning to produce PA 6 yarns.
Experiments
Materials
For PA 6, Ultramid B 24 N 03 from BASF, a commercially available light-stabilized polyamide 6 grade for the production of textile fibres which is especiallysuitable for high-speed spinning, was used. The applied nanofiller was a commercially available titanium dioxide particle powder (Hombitec RM 300, Sachtleben Chemie GmbH) with an average primary particle size of 15 nm and an average specific surface area of 70 m2/g. The particle surface was functionalized with polyalcohol. The second nanofiller was a commercially available barium sulphateparticle powder (Sachtoperse N 20, Sachtleben Chemie GmbH) with an average primary particle size of 20 nm and an average specific surface area of 60 m2/g.
Extrusion
Before extrusion, PA 6 was dried for 24 h at 80°C. For extrusion, a co-rotating twin screw extruder from Berstorff GmbH was used. The components were fed via high-precision gravimetric feeders (K-tron Deutschland GmbH) through the main feeder to be processed at 220°C and 300 rpm. The string from a 4 mm die was cooled in a water bath, pelletized, dried and injection-moulded (Allrounder 320, Arburg GmbH) into test specimens for impact and tensile testing.
It has been shown [2] that iteration of extrusion process steps can enhance the deagglomeration of macroagglomerates. Therefore a multiple extrusion process was applied. In the first step a 7 vol% masterbatch (labelled: once extruded) was produced, and in a follow-up of six further process steps the microparticles in the PA 6 were more and more deagglomerated and distributed (labelled: two to seven extrusion steps). Impact strength runs through a maximum as a function of particle loading, which will be shown in this work [2, 3, 26]. The masterbatch containing 7 vol% TiO2 nanoparticles without deagglomeration and further dispersion and distribution, and the masterbatch after one, two and six further extrusion steps were diluted down to 0–2 vol% nanoparticle content by the addition of neat PA 6 (labelled: two times, three times and eight times extruded, respectively).
Mechanical testing
Before mechanical testing, the specimens were dried at 80°C for 3 days.
Tensile tests were performed at room temperature on injection-moulded specimens in accordance with DIN EN ISO 527-2 standard on a universal testing machine (Zwick GmbH model 1485). The specimens were of type 1A measured with 2 mm/min. The 3-point bending tests were performed according to DIN EN ISO 178.
The Charpy impact strength was measured according to DIN EN ISO 179 on a pendulum-type impact testing machine (CEAST GmbH). The specimens were of type 1 with a type A notch. The bearing distance was set to 62 mm with an impact energy of 4 J and an impact speed of 2.9 m/s.
Microscopy
Polished surfaces were analysed using scanning electron microscopy (SEM), (JEOL 5400) via detection of the backscattering electrons. Fracture surfaces were scanned with a secondary electron detector. All samples were coated with gold using a sputtering device (SCD-050, Balzer AG). The SEM images were analysed with image analysis software by which the number and size of agglomerates were measured. From these results the dispersion index was calculated according to Equation (2) [27]:
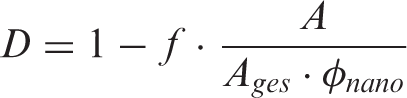
with
D ≙ dispersion index
A ≙ area of the agglomerates
Ages ≙ area of the image
f ≙ shape factor
Φnano ≙ volume fraction.
Definition of the shape factor
The shape factor f will be calculated with a so-called control compound containing a well-defined dispersion of particles based on a defined volume content. Therefore, we used a nano-reinforced PA 6 composite with no dispersion which will be set to zero for the dispersion index. f can be calculated by solving Equation (3):
In our case f was set to 0.63.

Computed microtomography system
Computed microtomography (μCT) measurements were performed on a nanotom X-ray system (Phoenix X-ray Systems Services GmbH).
Results and discussion
Multiple extrusion steps
The higher the shear energy, the higher the potential of deagglomeration regarding the top-down method, which will be realized via multiple extrusion processes [3, 26, 28]. In order to analyse the number of extrusion steps needed to achieve the static state of deagglomeration, material behaviour was analysed when extruded up to several times, in our case seven times.
Figure 7 shows the results of tensile tests on a 7 vol% masterbatch of PA 6 with TiO2 and BaSO4 nanoparticles after multiple extrusion steps. The Young’s modulus for the reinforced materials remains constant as a function of number of extrusion cycles. The improvement in deagglomeration (Figure 9) of TiO2 does not lead to an increase in Young’s modulus. The Young’s modulus of TiO2 filled compounds is higher than that of BaSO4 compounds. TiO2 reinforces PA 6 to a higher degree than BaSO4, which could be due to a better nanoparticle–matrix interaction (Figure 1). The effect of interfacial interaction between particle and matrix is, for example, discussed by Guo et al. [29]. The Young’s modulus of neat polyamide 6 is less than that of the reinforced sample, but increases with the number of extrusion steps (Figure 7). The tensile strength for TiO2 compounds and neat polyamide 6 has the same level and is maintained constant over the respective extrusion steps (Figure 7). For BaSO4 compounds the tensile strength starts at a low level but increases with further extrusion steps, and reaches almost the same level as neat and TiO2 filled PA 6 after seven extrusion steps (Figure 7). This could be due to the reduction of the number of BaSO4 agglomerates causing a reduction in defects in the material (Figures 9 and 10).
Tensile results of a reinforced PA 6 composite with 7 vol% TiO2 and BaSO4 nanoparticles as a function of extrusion steps. Bending results of reinforced PA 6 composites with 7 vol% TiO2 and BaSO4 nanoparticles as a function of extrusion steps. PA 6-composites reinforced with 7 vol% filler content (a) TiO2, once extruded and(b) seven times extruded and (c) BaSO4, once extruded and (d) seven times extruded. Dispersion index of 7 vol% TiO2 and BaSO4 nanoparticles in PA 6 after different extrusion steps.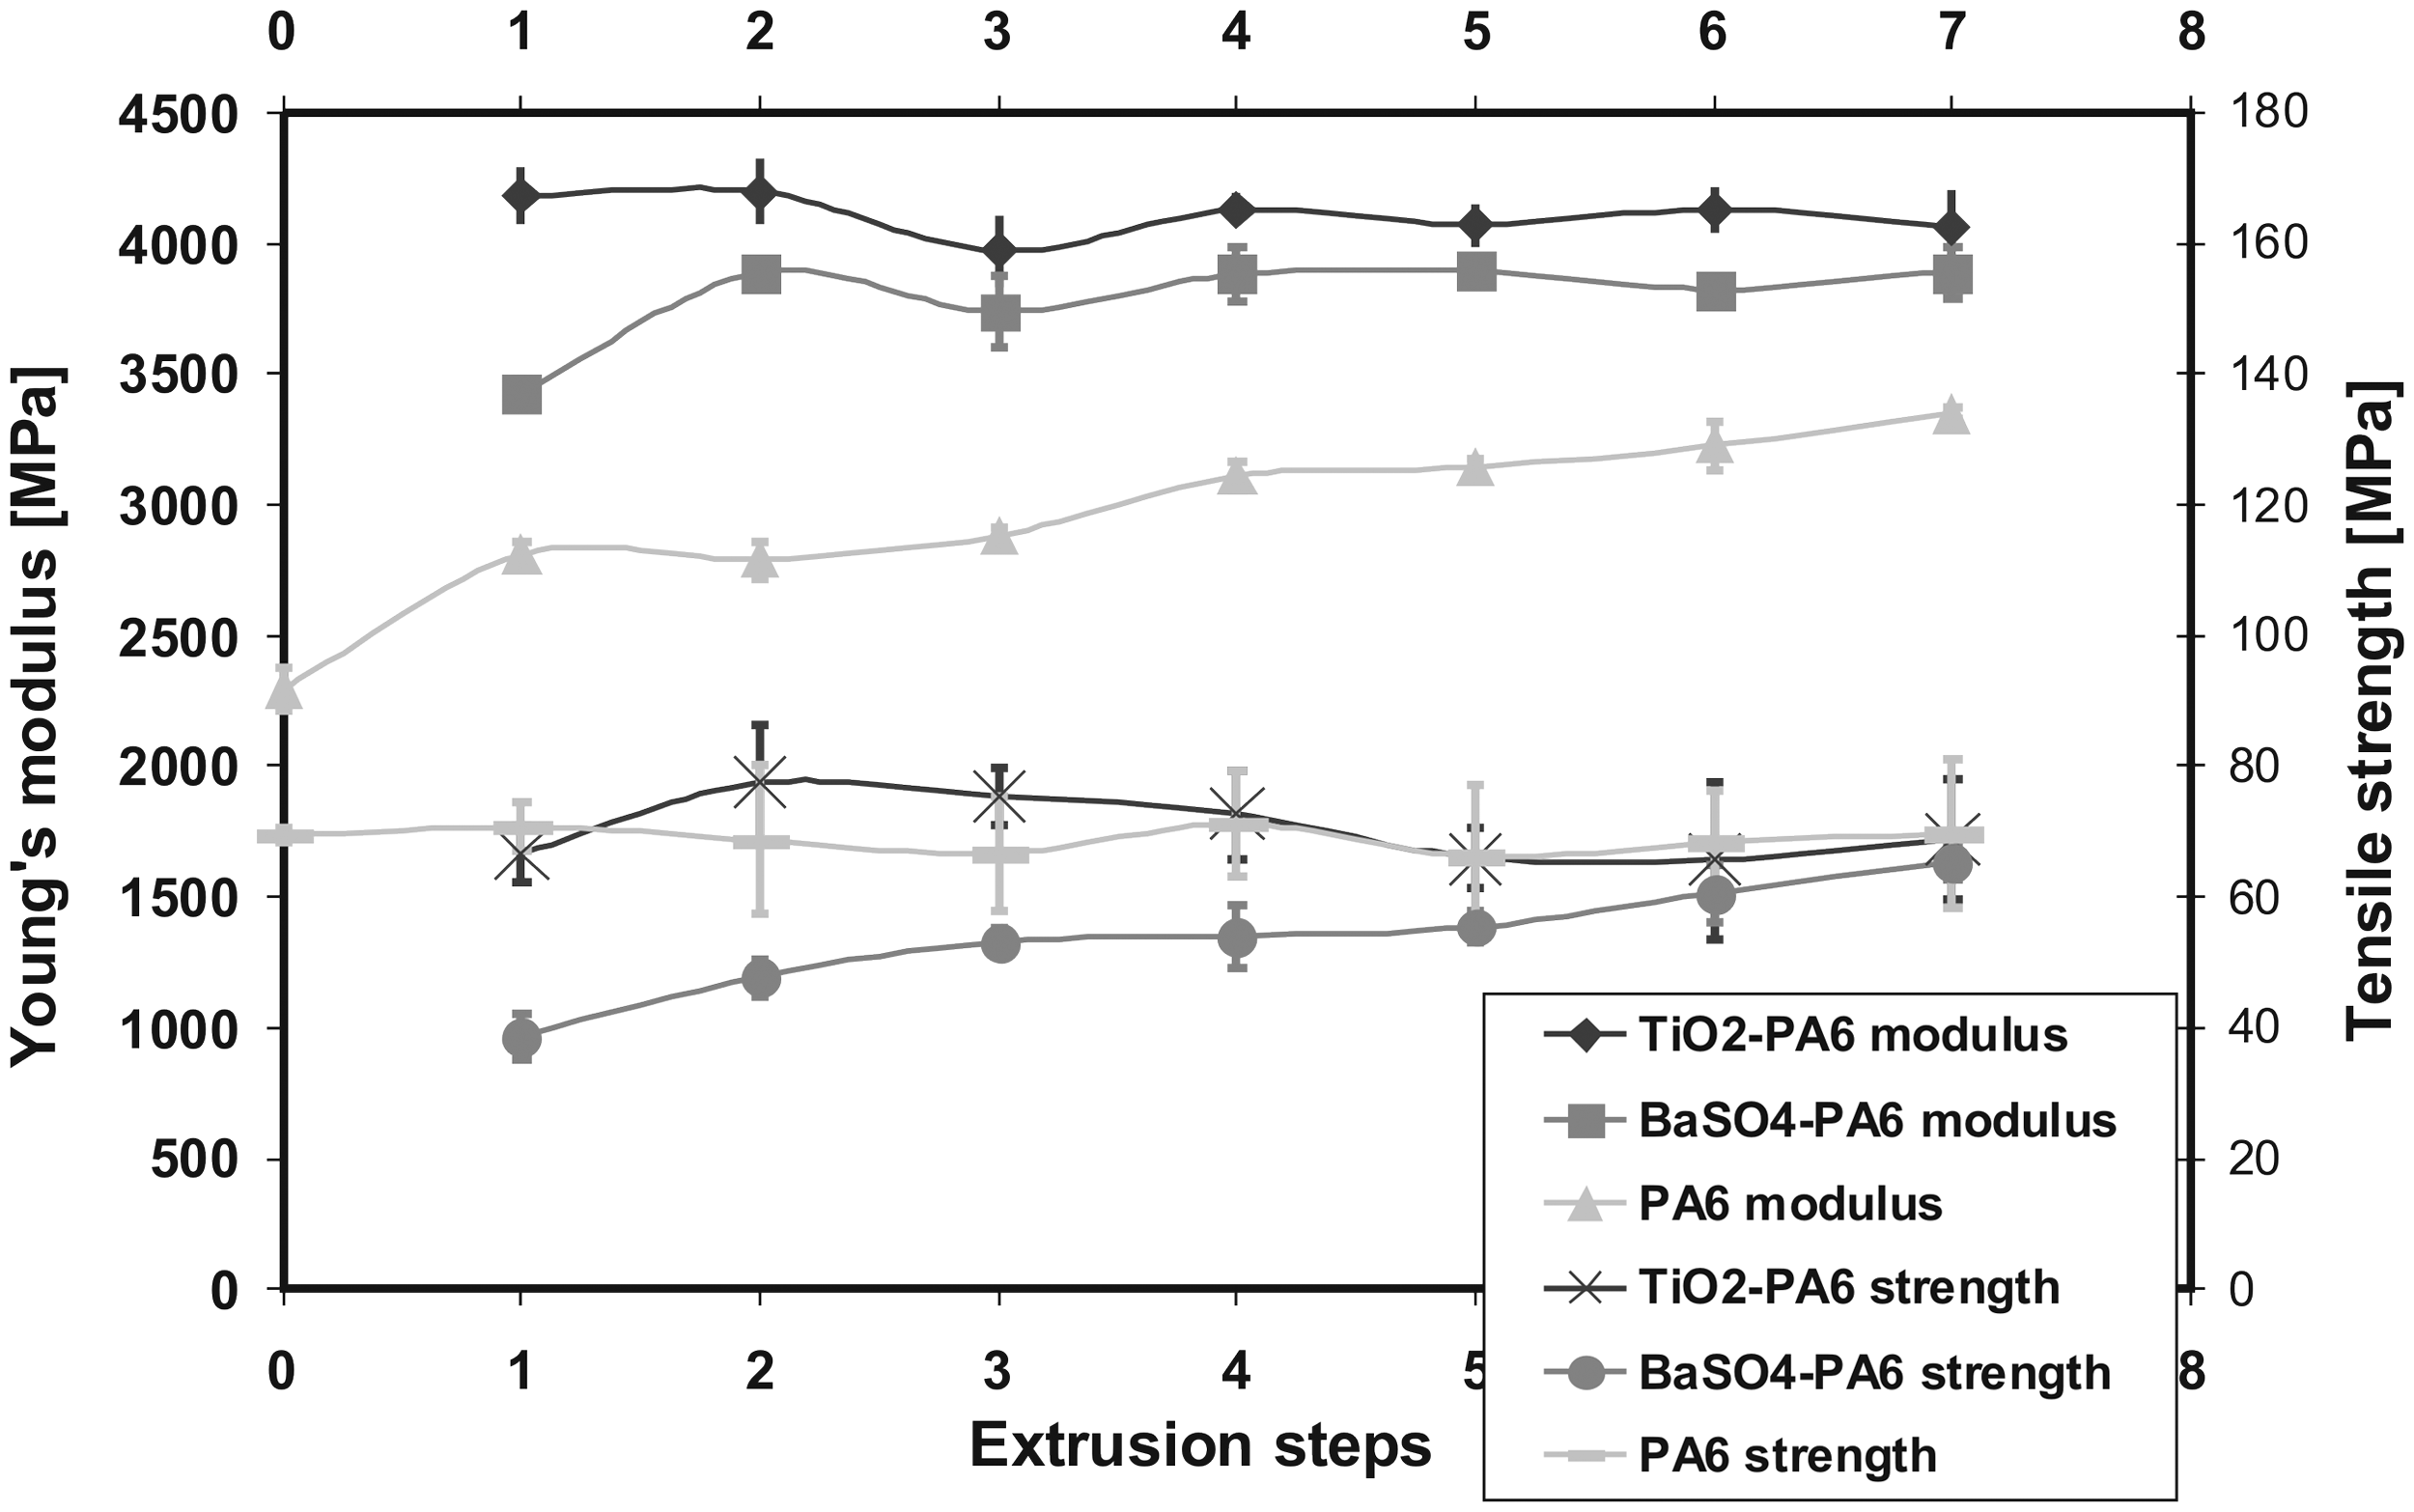
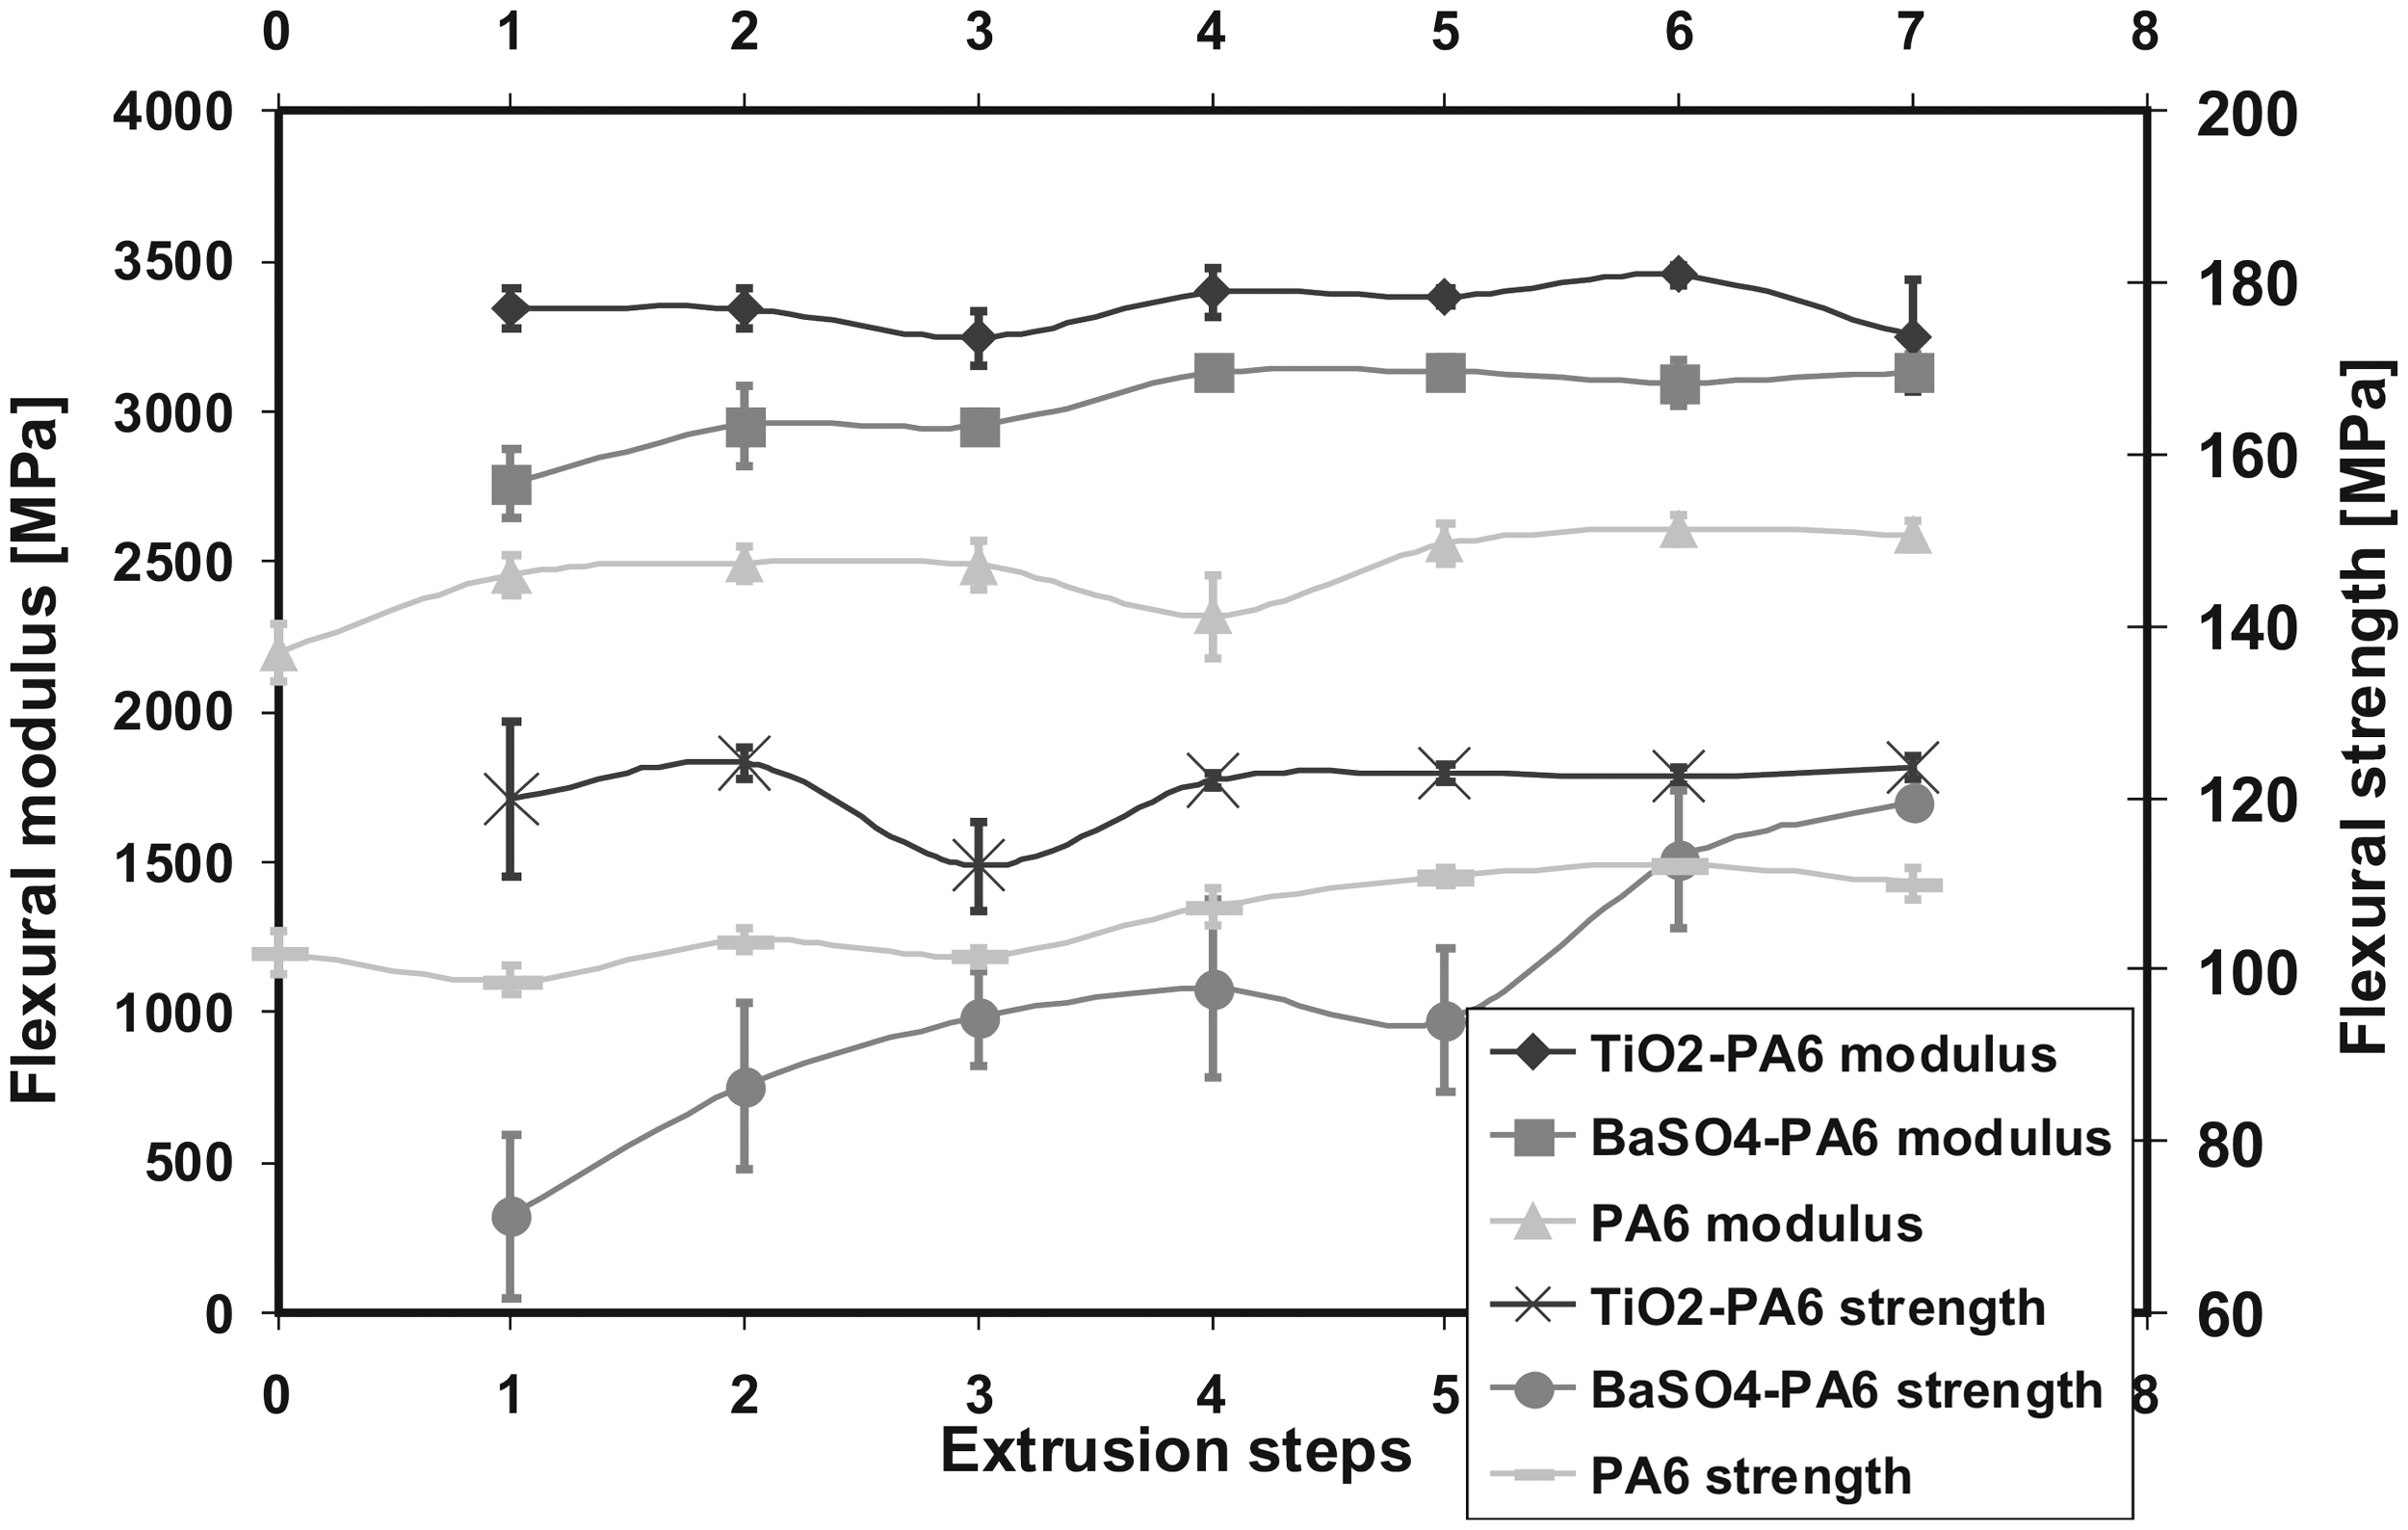
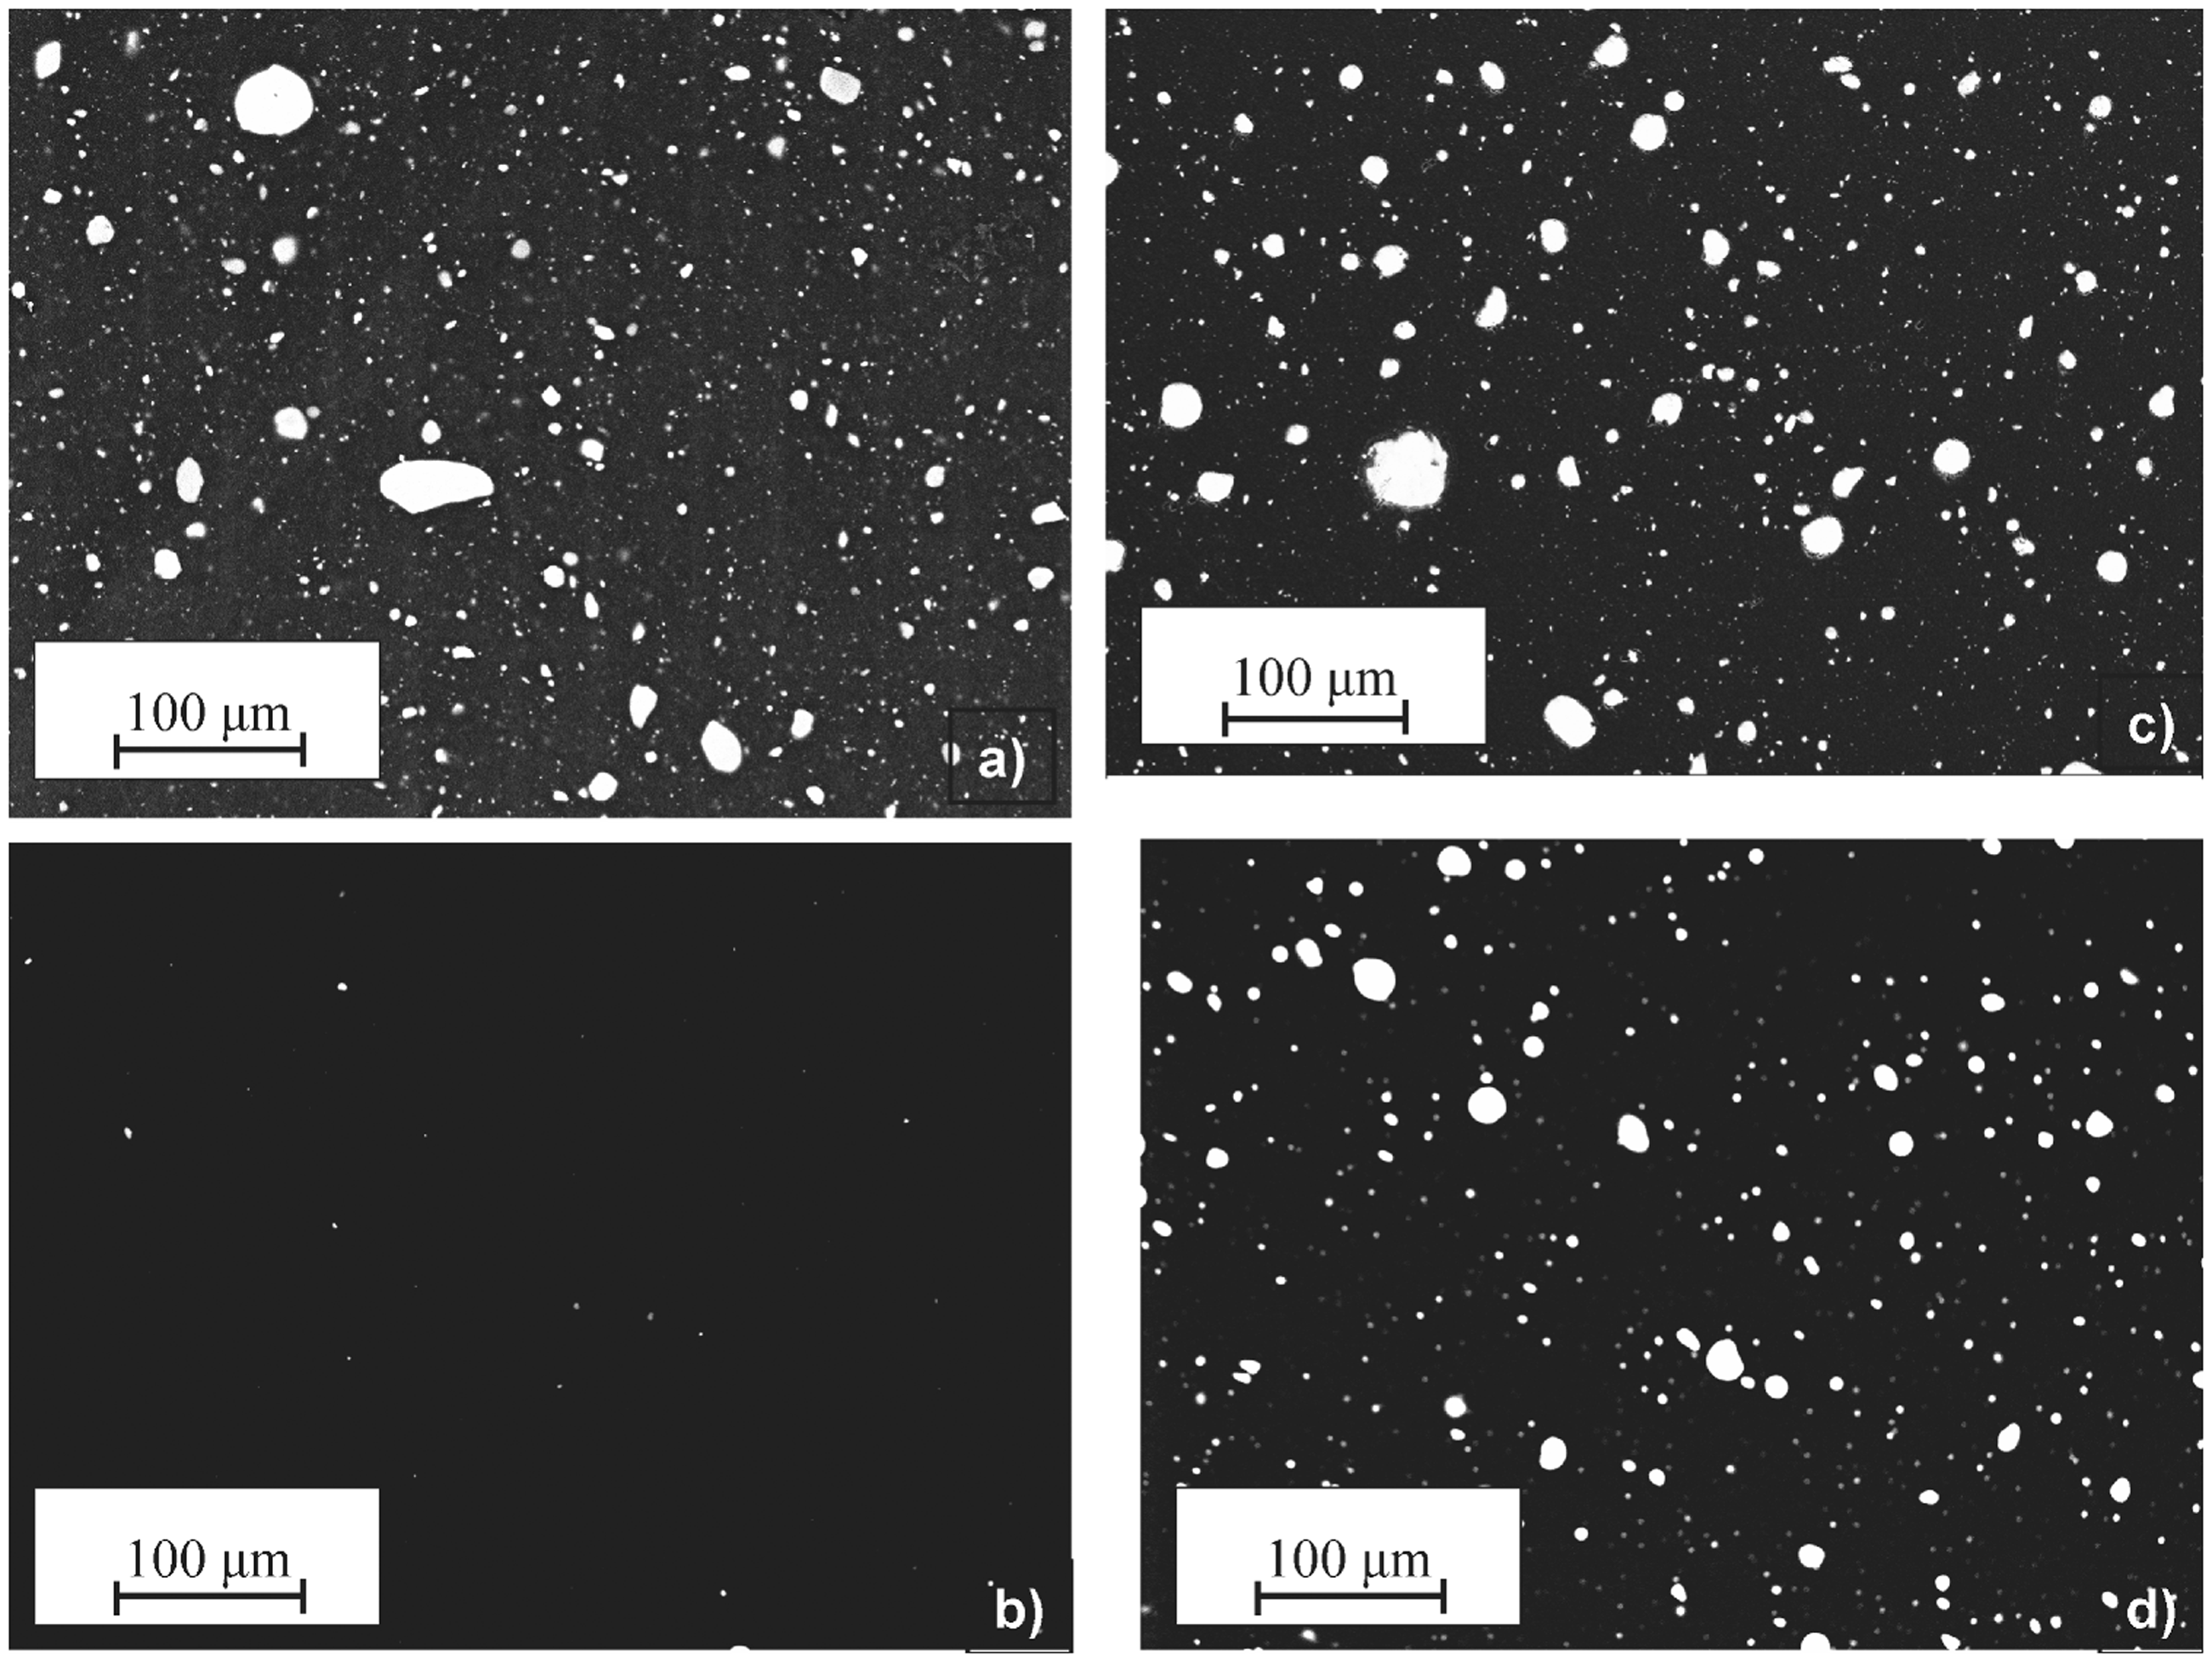
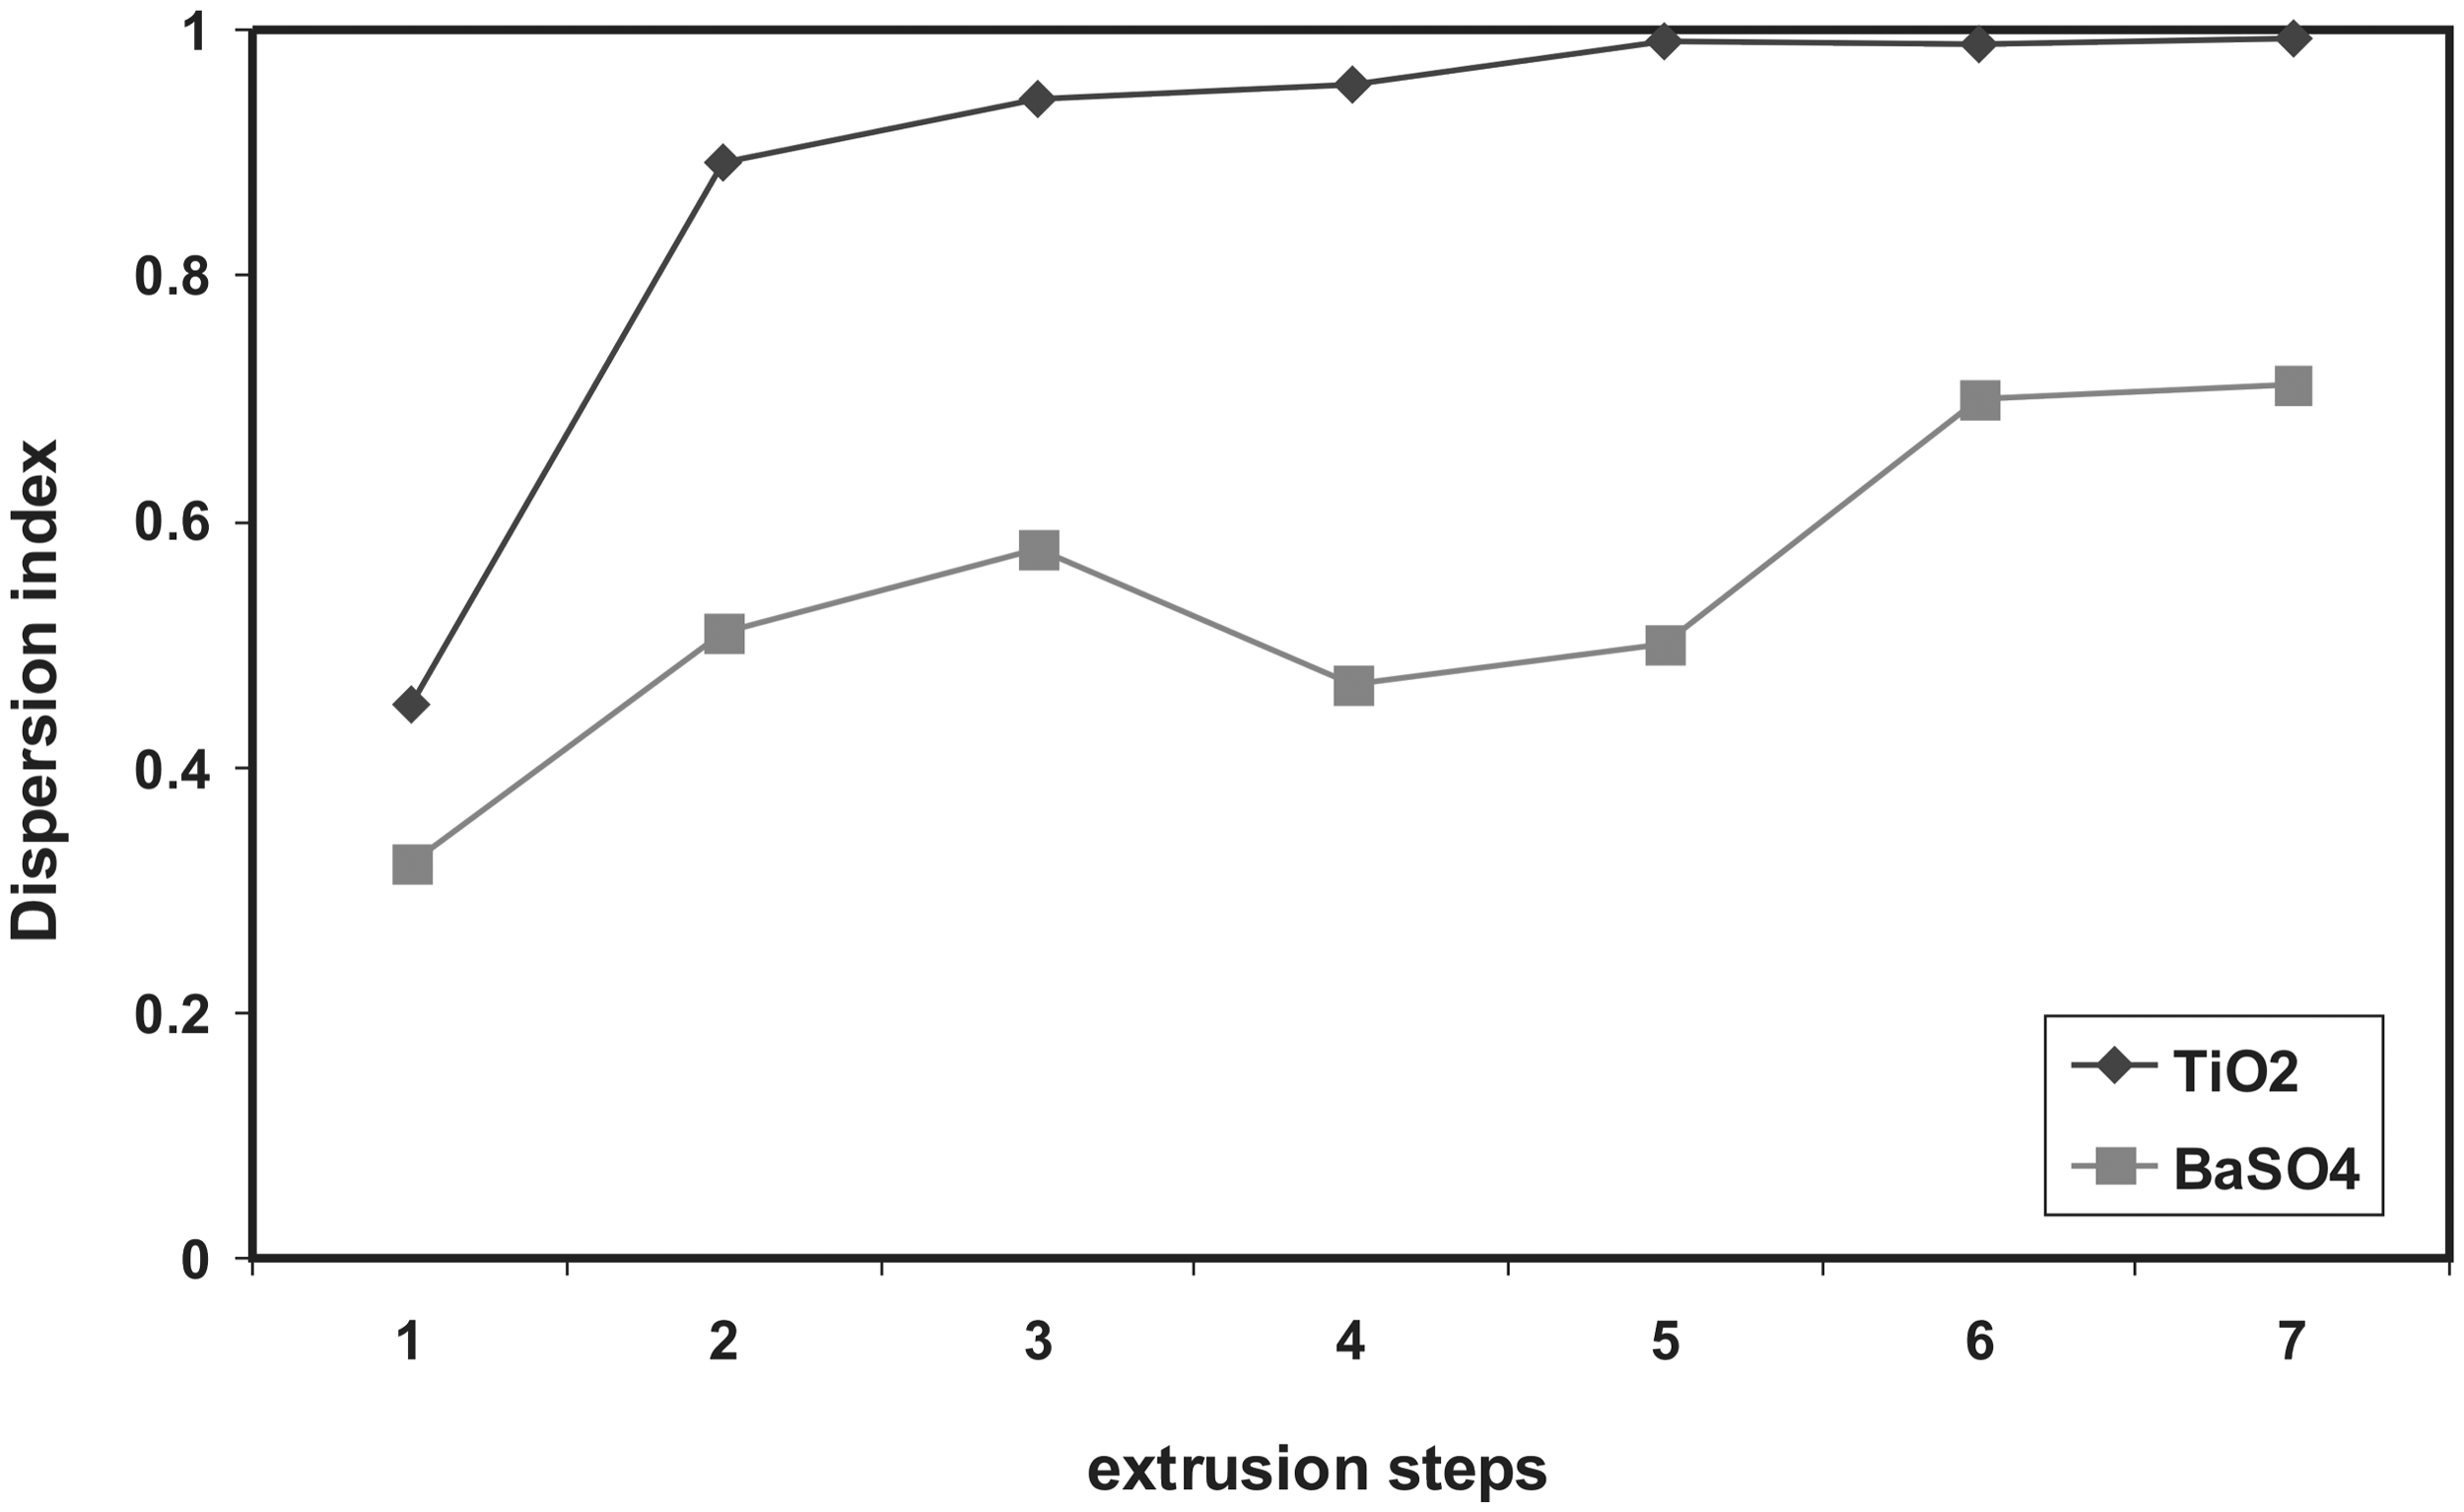
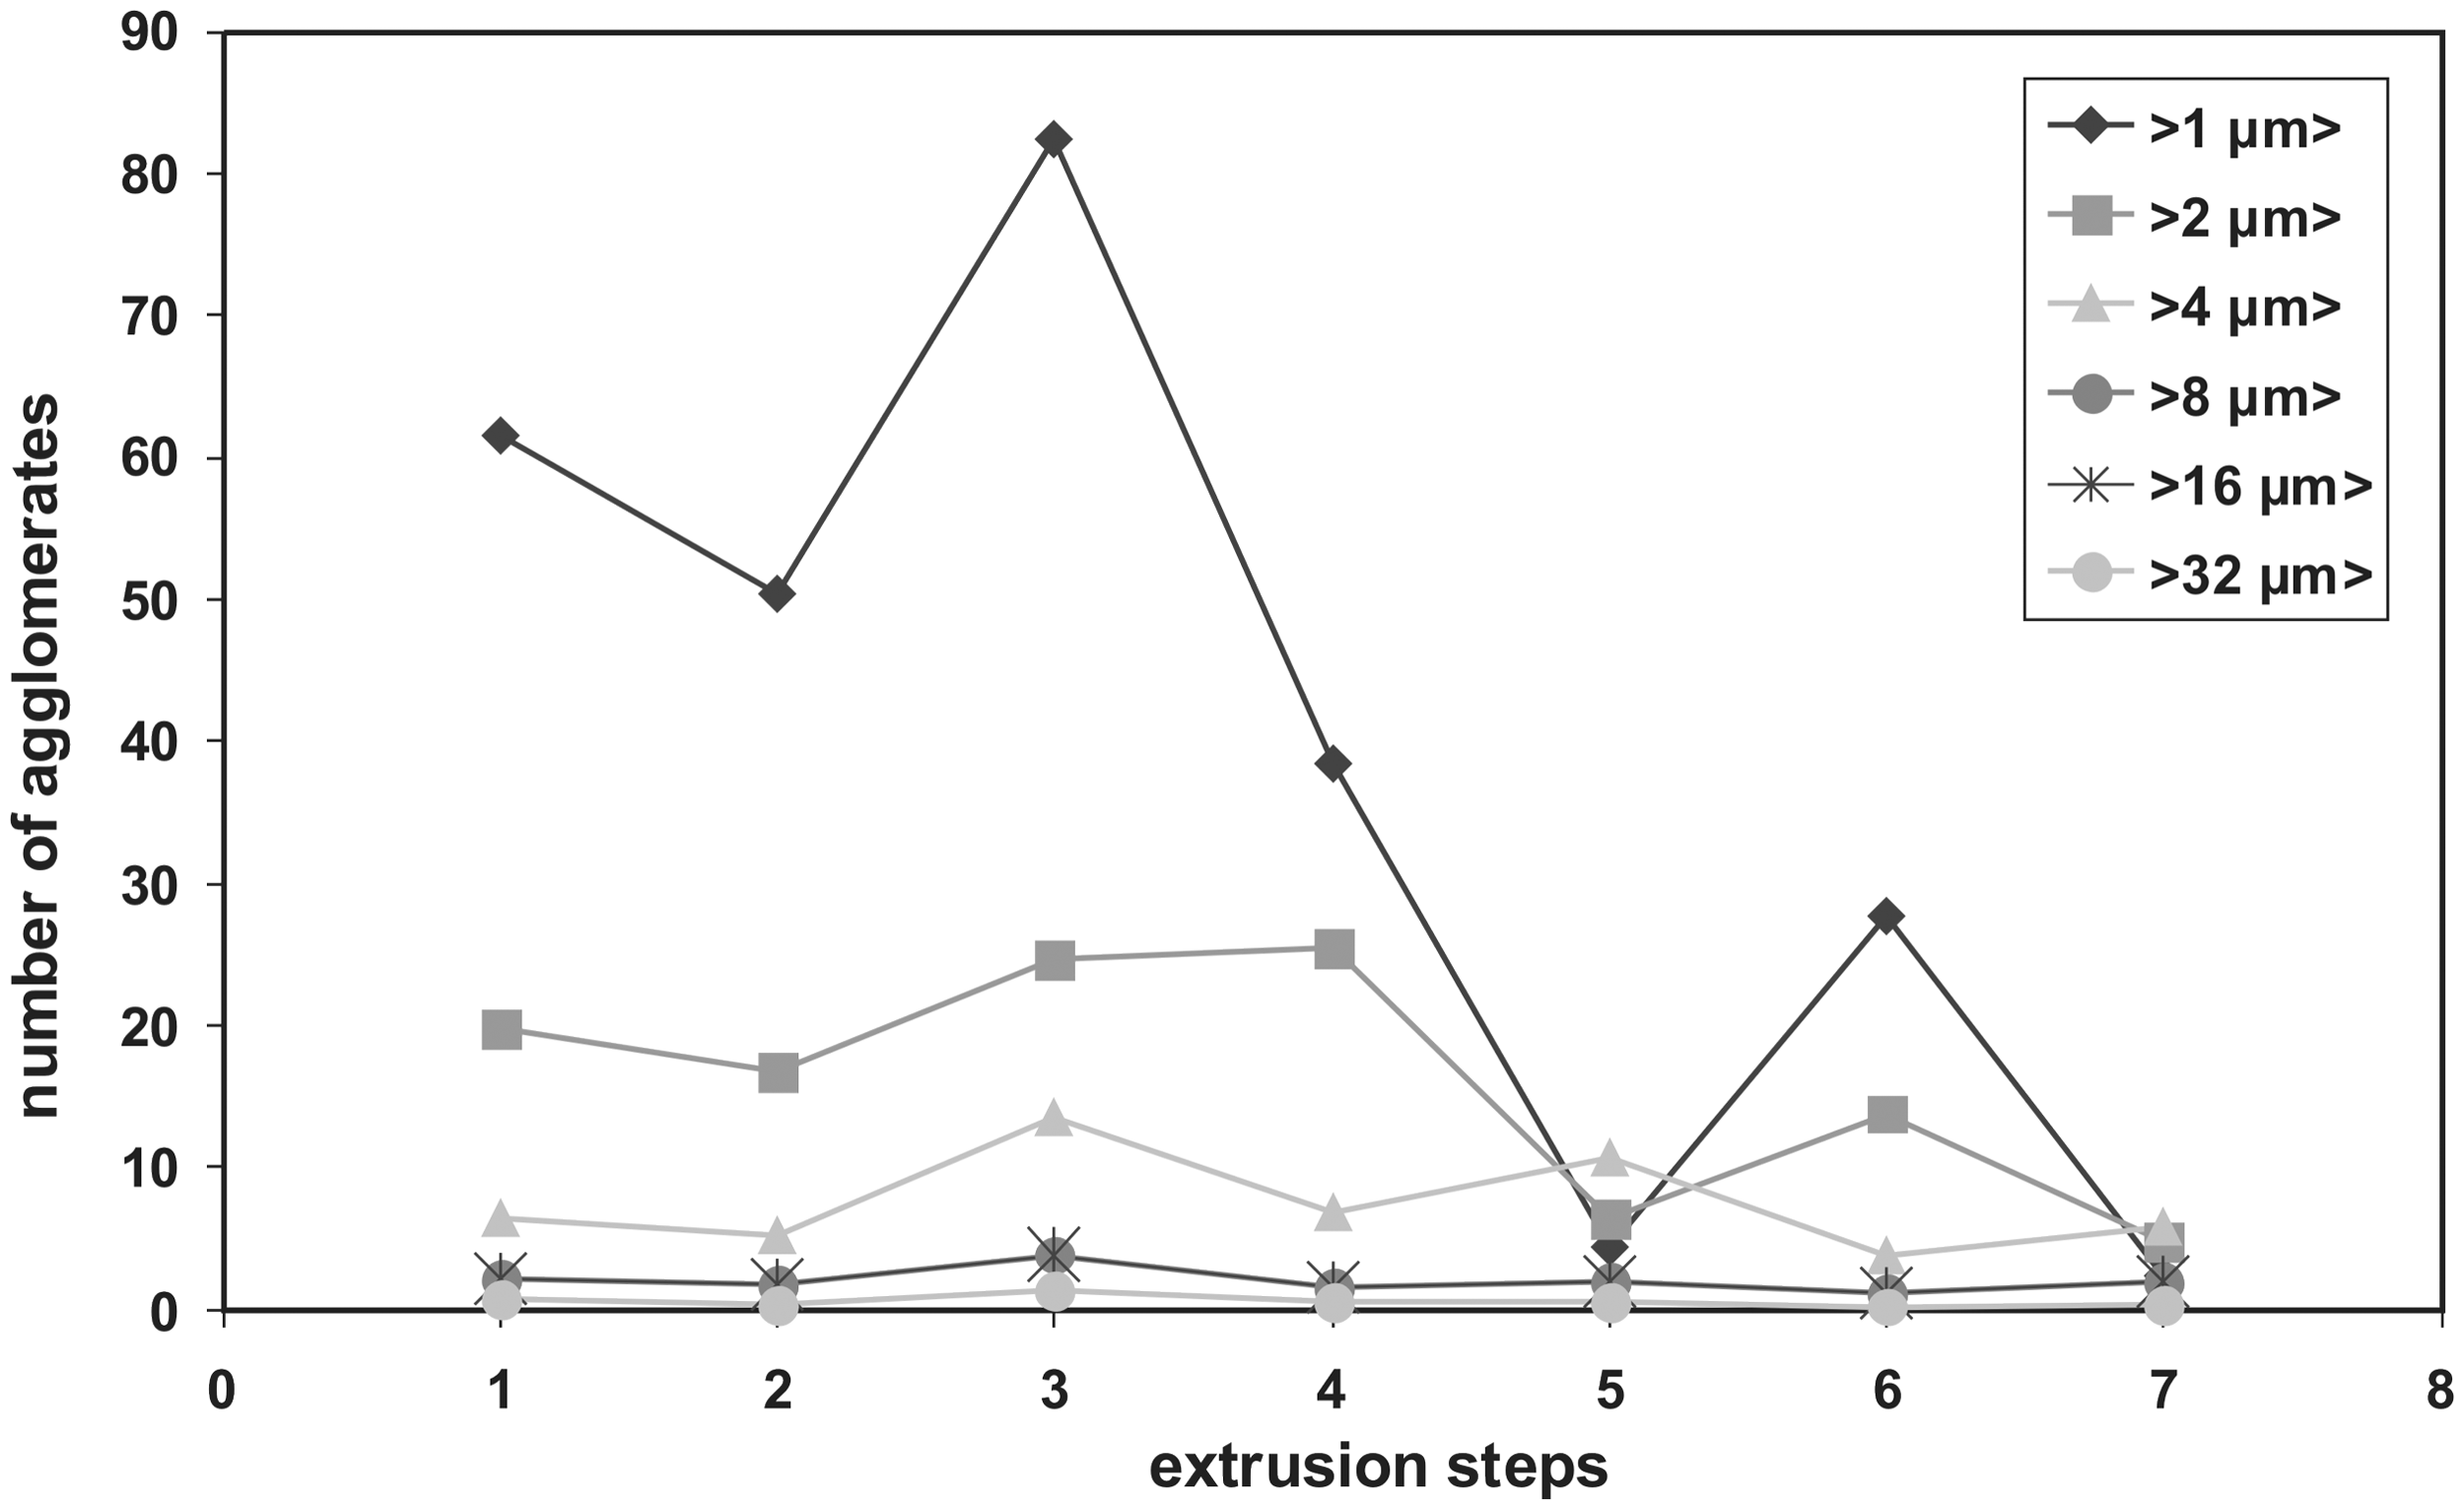
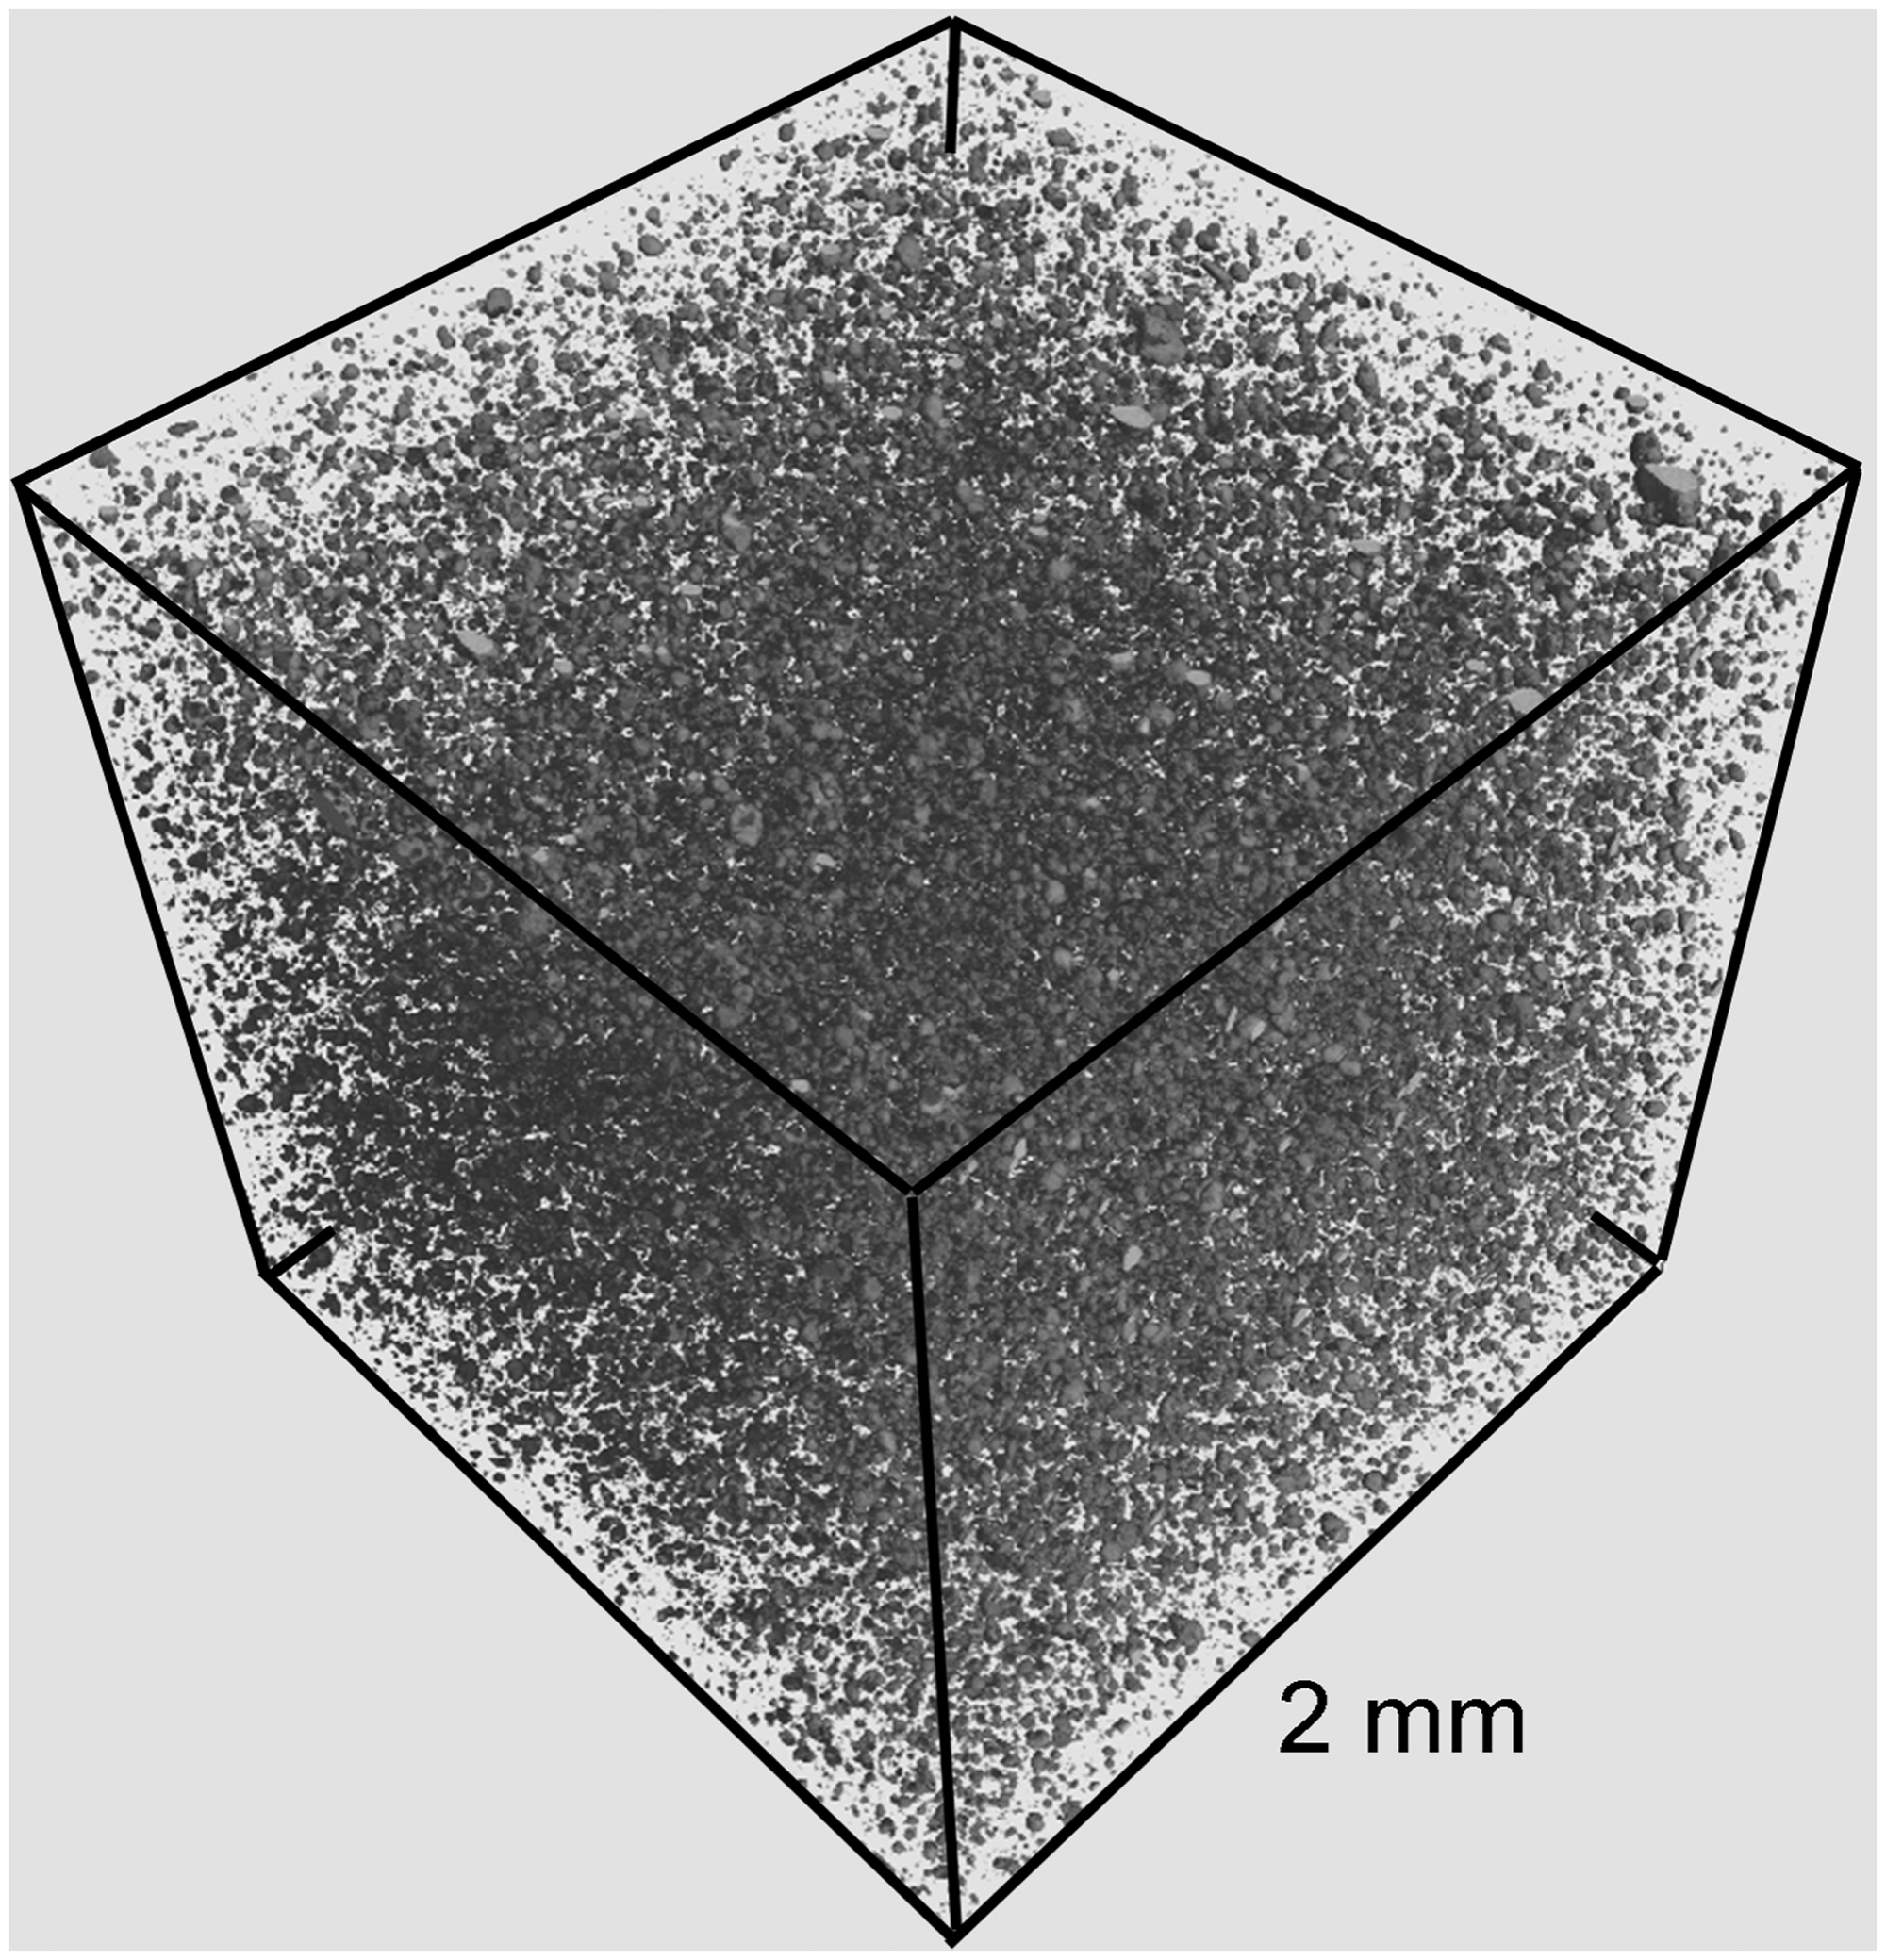
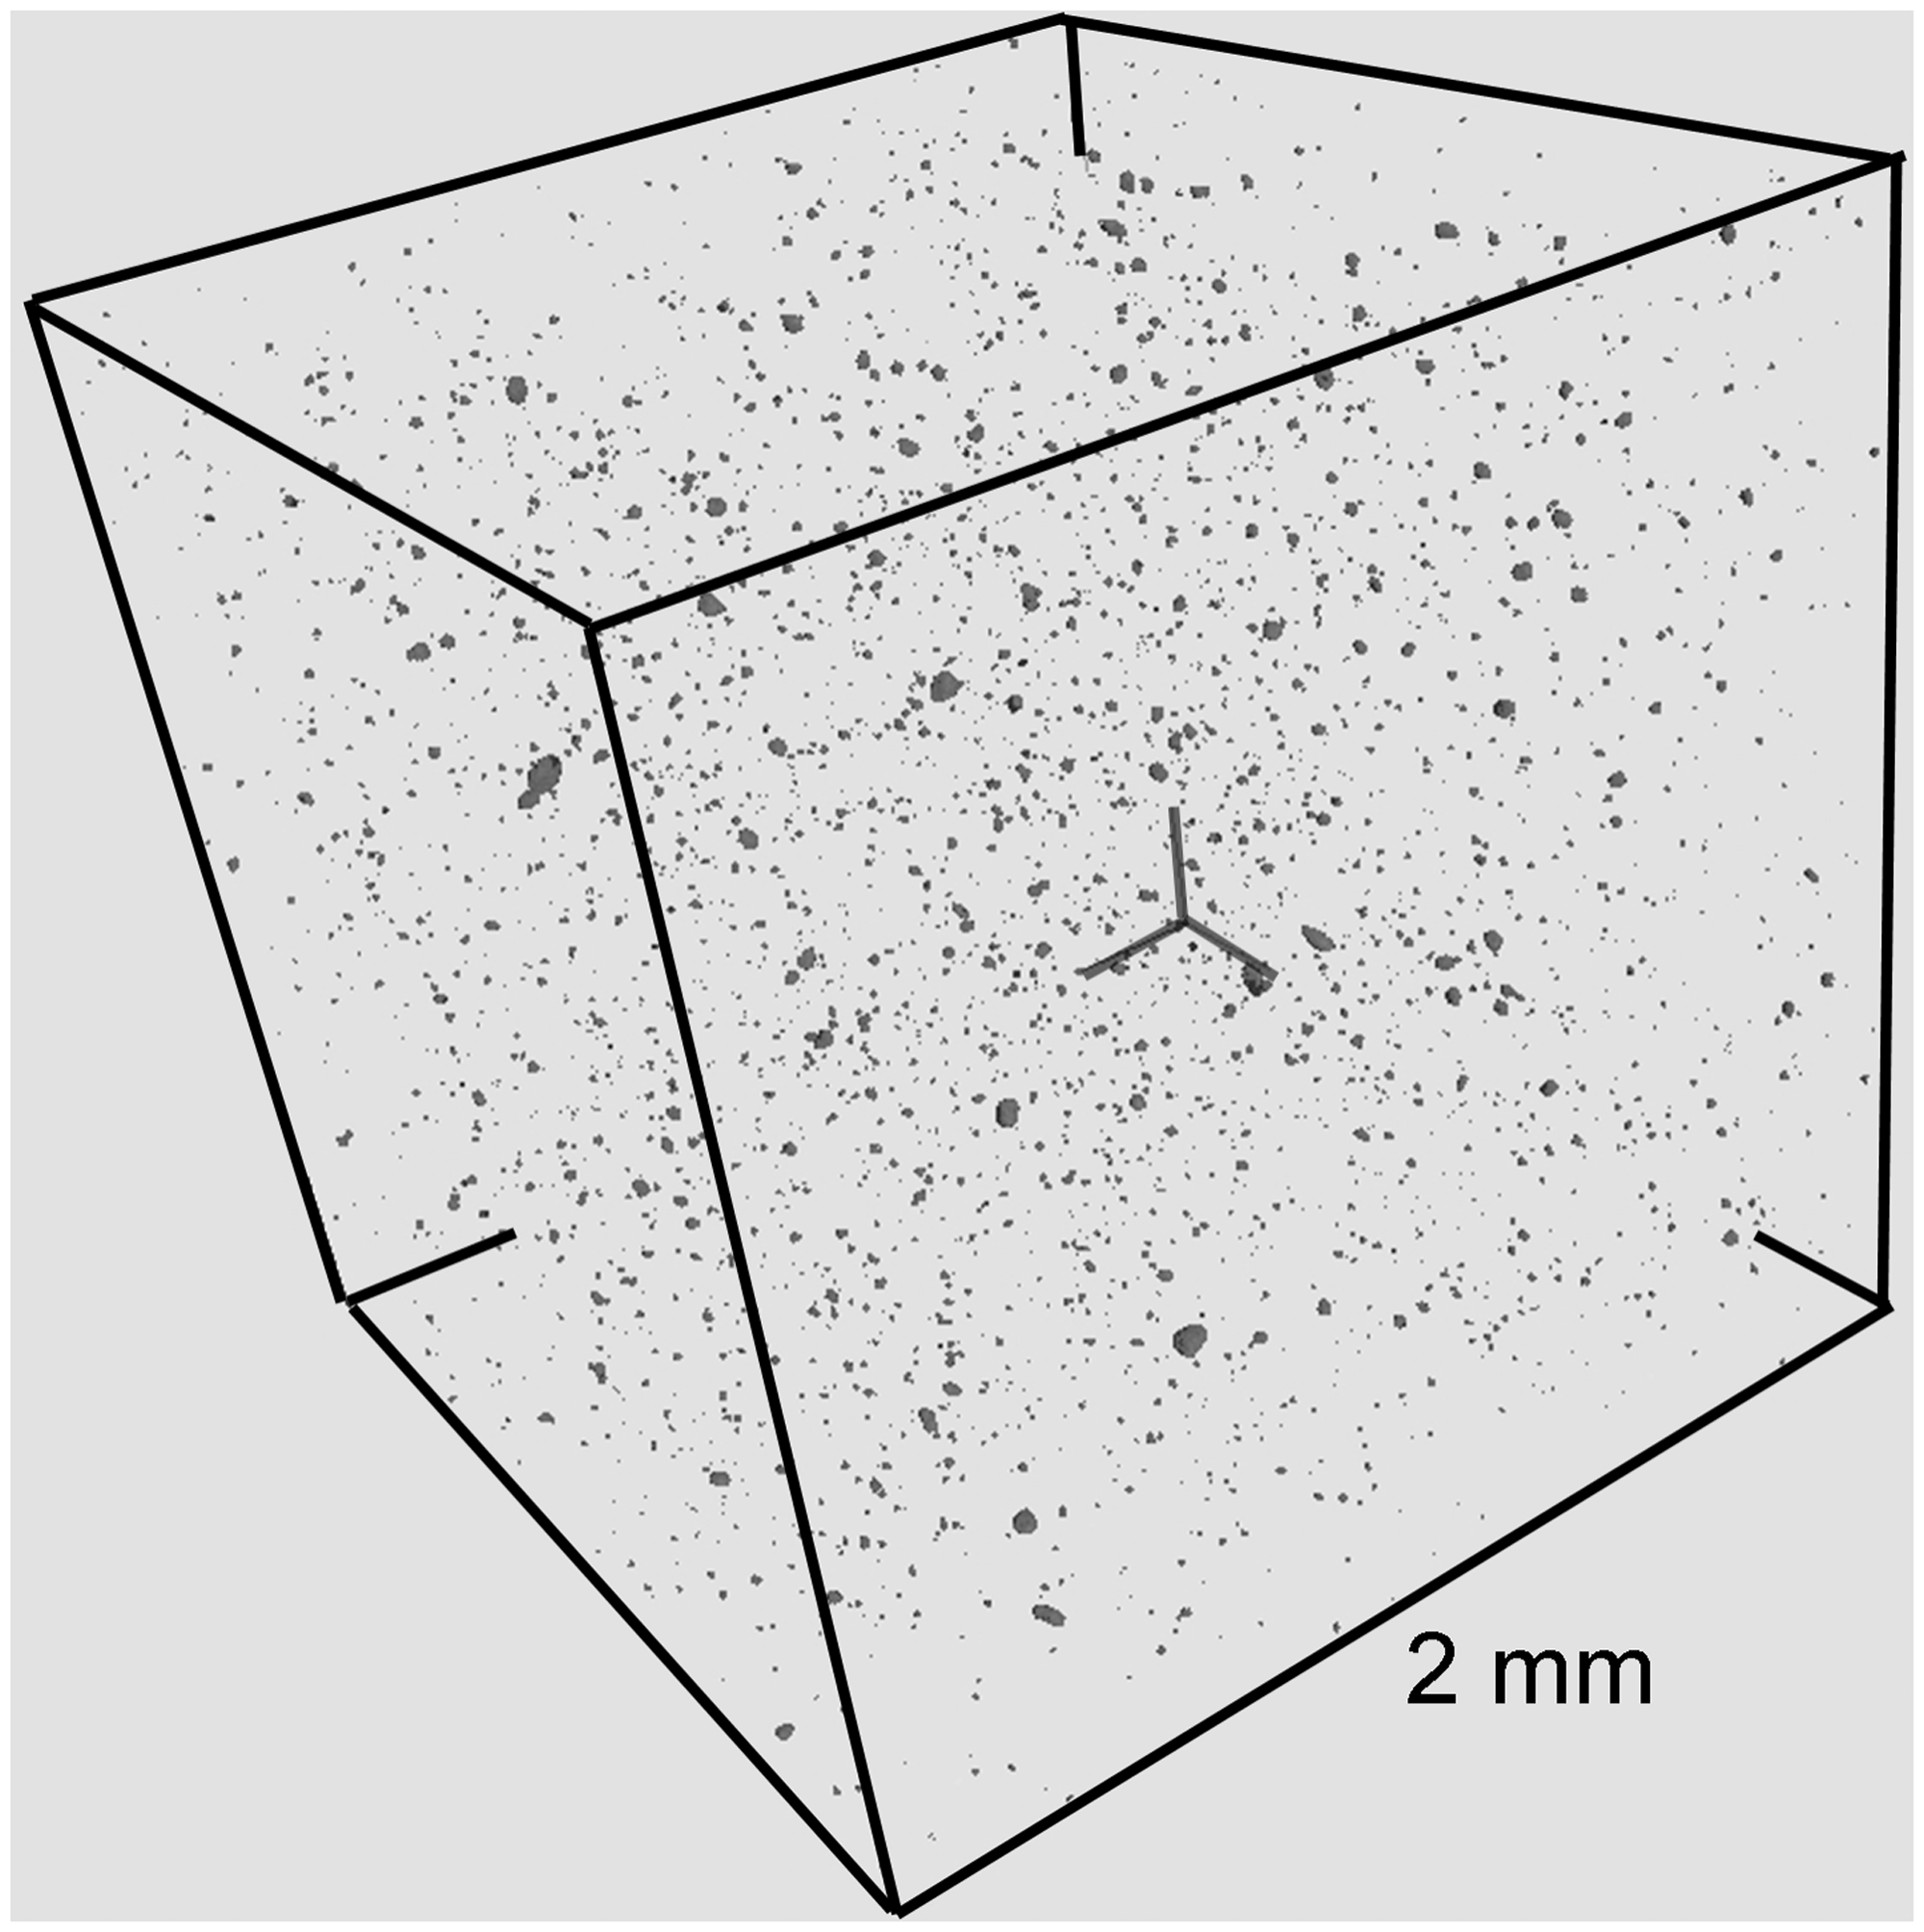
In summary, it is evident that Young’s modulus of neat PA 6 increases with slightly decreasing tensile strength through a number of extrusion steps, whereby TiO2 compounds remain mechanically quite stable. On the other hand, the Young’s modulus and tensile strength of BaSO4 compounds increase almost up to the level of TiO2 compounds and neat matrix. This kind of mechanical behaviour will be also reflected by the respective bending tests (Figure 8). In the case of TiO2 PA 6 compounds, flexural modulus increases but bending strength decreases, whereby for BaSO4 PA 6 compounds both strength and flexural modulus increase nearly up to the level of the respective TiO2 compounds. For neat PA 6, strength and modulus increase but do not reach the level of the TiO2 PA 6 compound. The SEM images (Figure 9) show a poor degree of deagglomeration for both masterbatches, TiO2 and BaSO4, after one extrusion step. BaSO4 filled material is less deagglomerated than TiO2 filled material, which will not be improved with further extrusionsteps. On the contrary, TiO2 compounds show a very good degree of deagglomeration. After seven extrusion steps, agglomerates predominantly less than 1 µm in size will be found. Based on the SEM findings including image analysis, the respective dispersion indices were calculated (Figure 10) according to Equation 2. TiO2 masterbatches start with a very small dispersion index of 45.1% after one extrusion step, but after only the second step the dispersion index increases to 89.2%, after the third up to 94.4% and after the fifth extrusion step 99% was reached. In the case of BaSO4 PA 6 compounds, the maximum dispersion index is in the range of 70% after the sixth and seventh extrusion steps, coming from 32.2% after the first one. Figures 11 and 12 reveal that the number of large agglomerates does not decrease for the BaSO4 masterbatch with the number of extrusion steps; on the contrary, the small agglomerates are more deagglomerated than the large ones, which may have an impact on strength. Figures 13 and 14 show the 3D μCT analysis, illustrating the poor degree of deagglomeration for TiO2 reinforced PA 6 compounds, extruded once in comparison with extruded seven times.
Dispersion index of 7 vol% BaSO4 macroagglomerates as a function of size. Number of 7 vol% BaSO4 macroagglomerates as a function of size. 3D μCT analysis of 7 vol% TiO2 nanoparticle-reinforced PA 6, extruded once. 3D μCT analysis of 7 vol% TiO2 nanoparticle-reinforced PA 6, extruded seven times.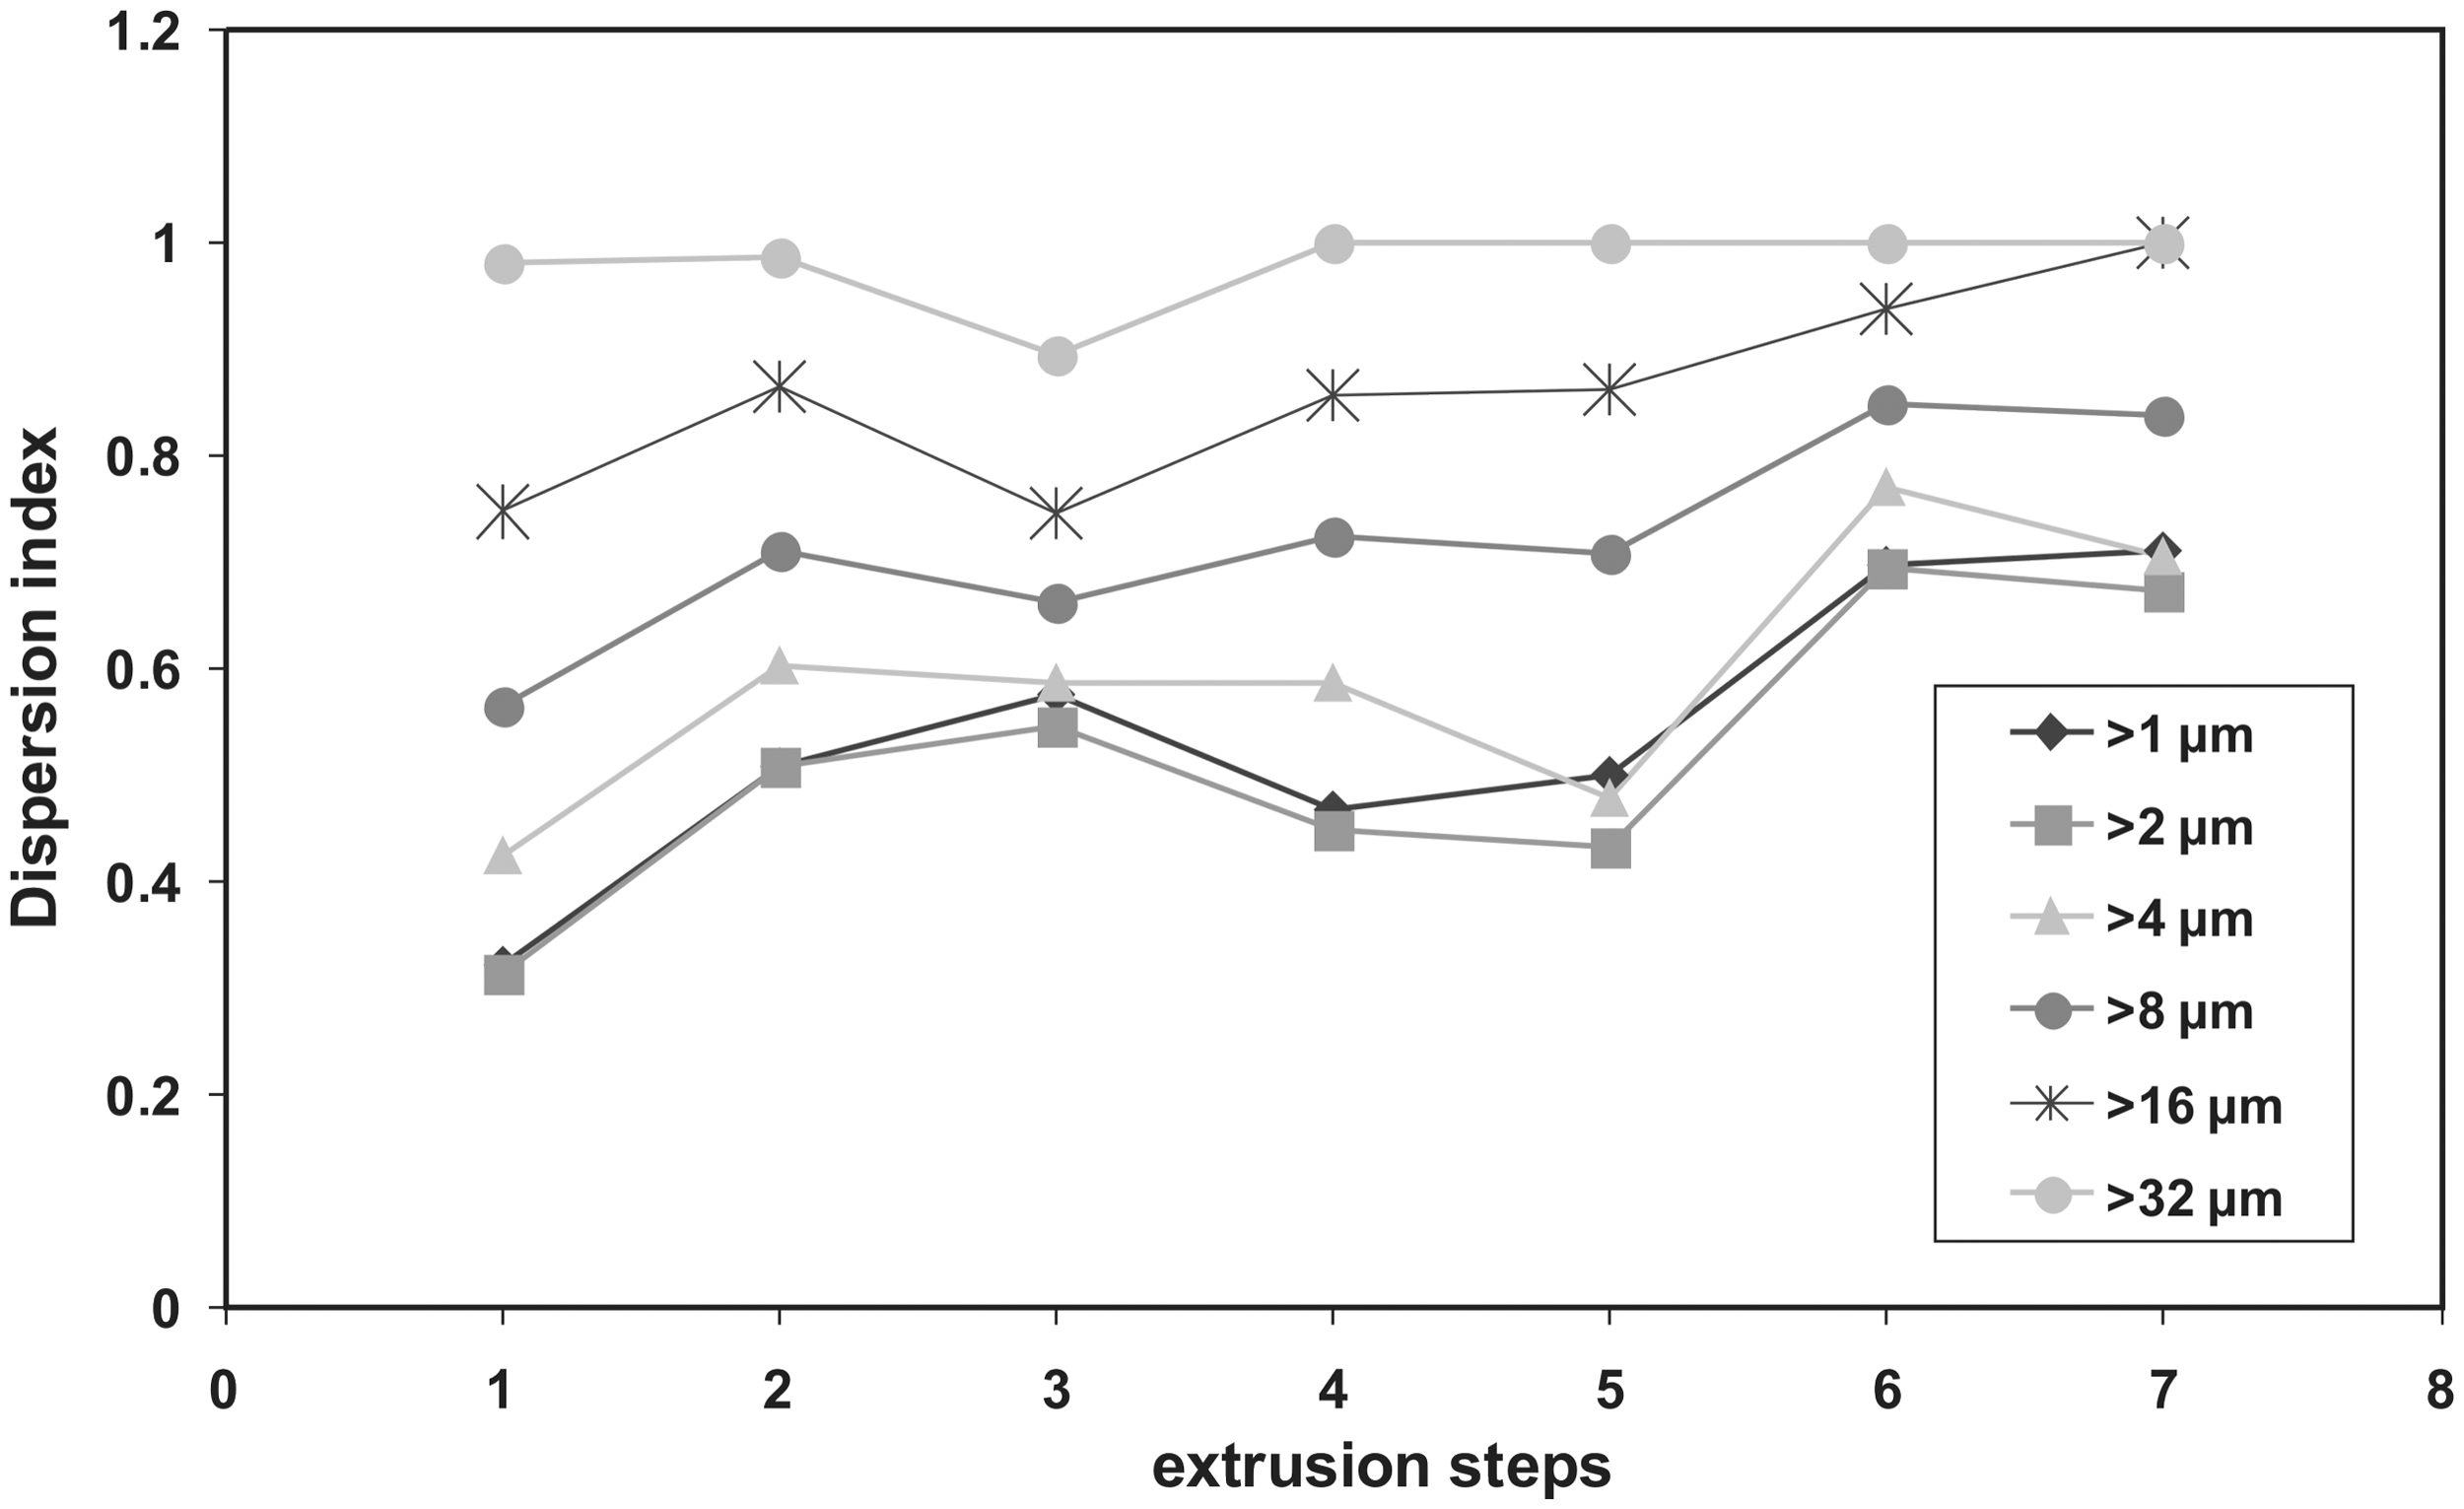
Multiple extrusion ‘dilution’
Three masterbatches with 7 vol% particle content were taken to perform further extrusion steps. In the last extrusion step neat PA 6 was added (‘dilution’) to obtain lower particle contents. This procedure was performed with:
Original masterbatch after compounding particles and matrix
Masterbatch, once diluted, thus twice extruded
Masterbatch, seven times diluted, thus eight times extruded.
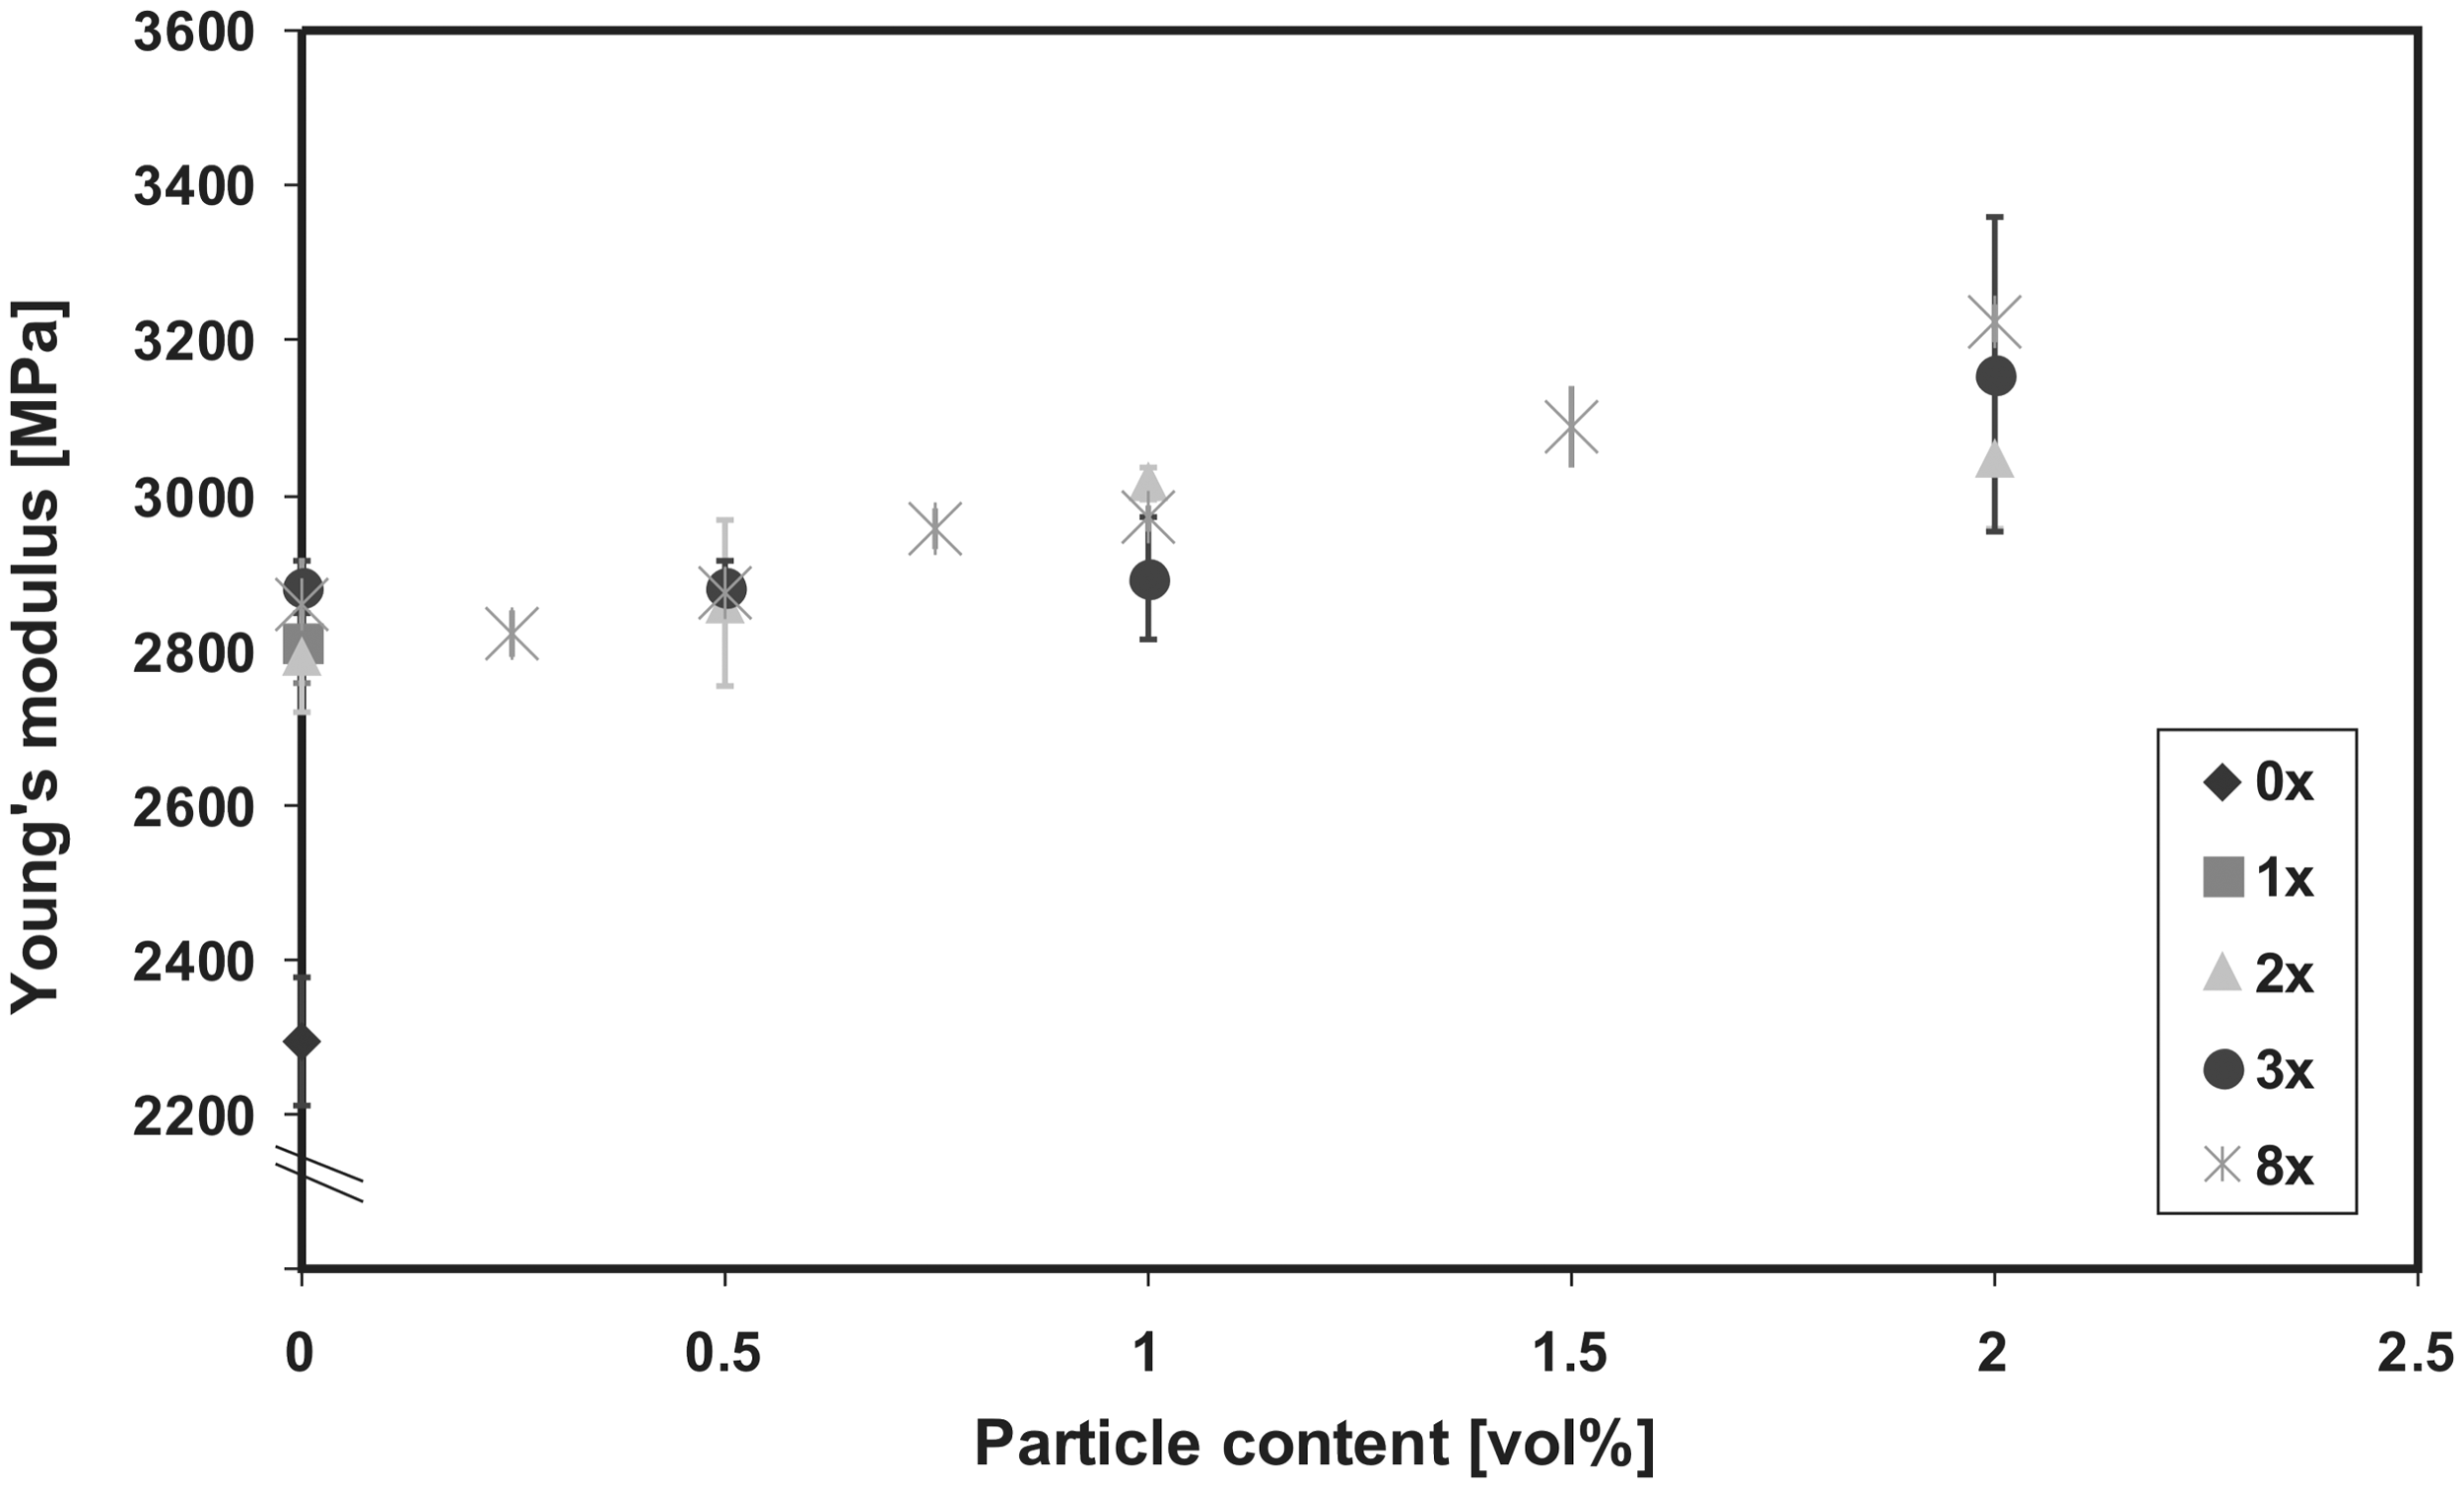
The labelling is as follows: the masterbatch, after the first compounding, is referred to as two times extruded, even though only the masterbatch fraction is extruded twice. The fraction of the added neat PA 6 is only extruded once. The Young’s moduli increase nearly linearly with increasing filler content, as shown in Figure 15, in accordance with the linear rule of mixtures. The compounds independent of the number of extrusion steps are nearly on the same level. The degree of deagglomeration does not have any impact on tensile strength. Figure 16 reveals that the strength remains for all filler contents and extrusion steps at the same level. Only the PA 6 compound with 2 vol% TiO2 shows a decrease of about 20%, after the eighth extrusion step.
Tensile strength as a function of TiO2 nanoparticle content and extrusion steps in PA 6. Young’s moduli as a function of TiO2 nanoparticle content and extrusion steps in PA 6.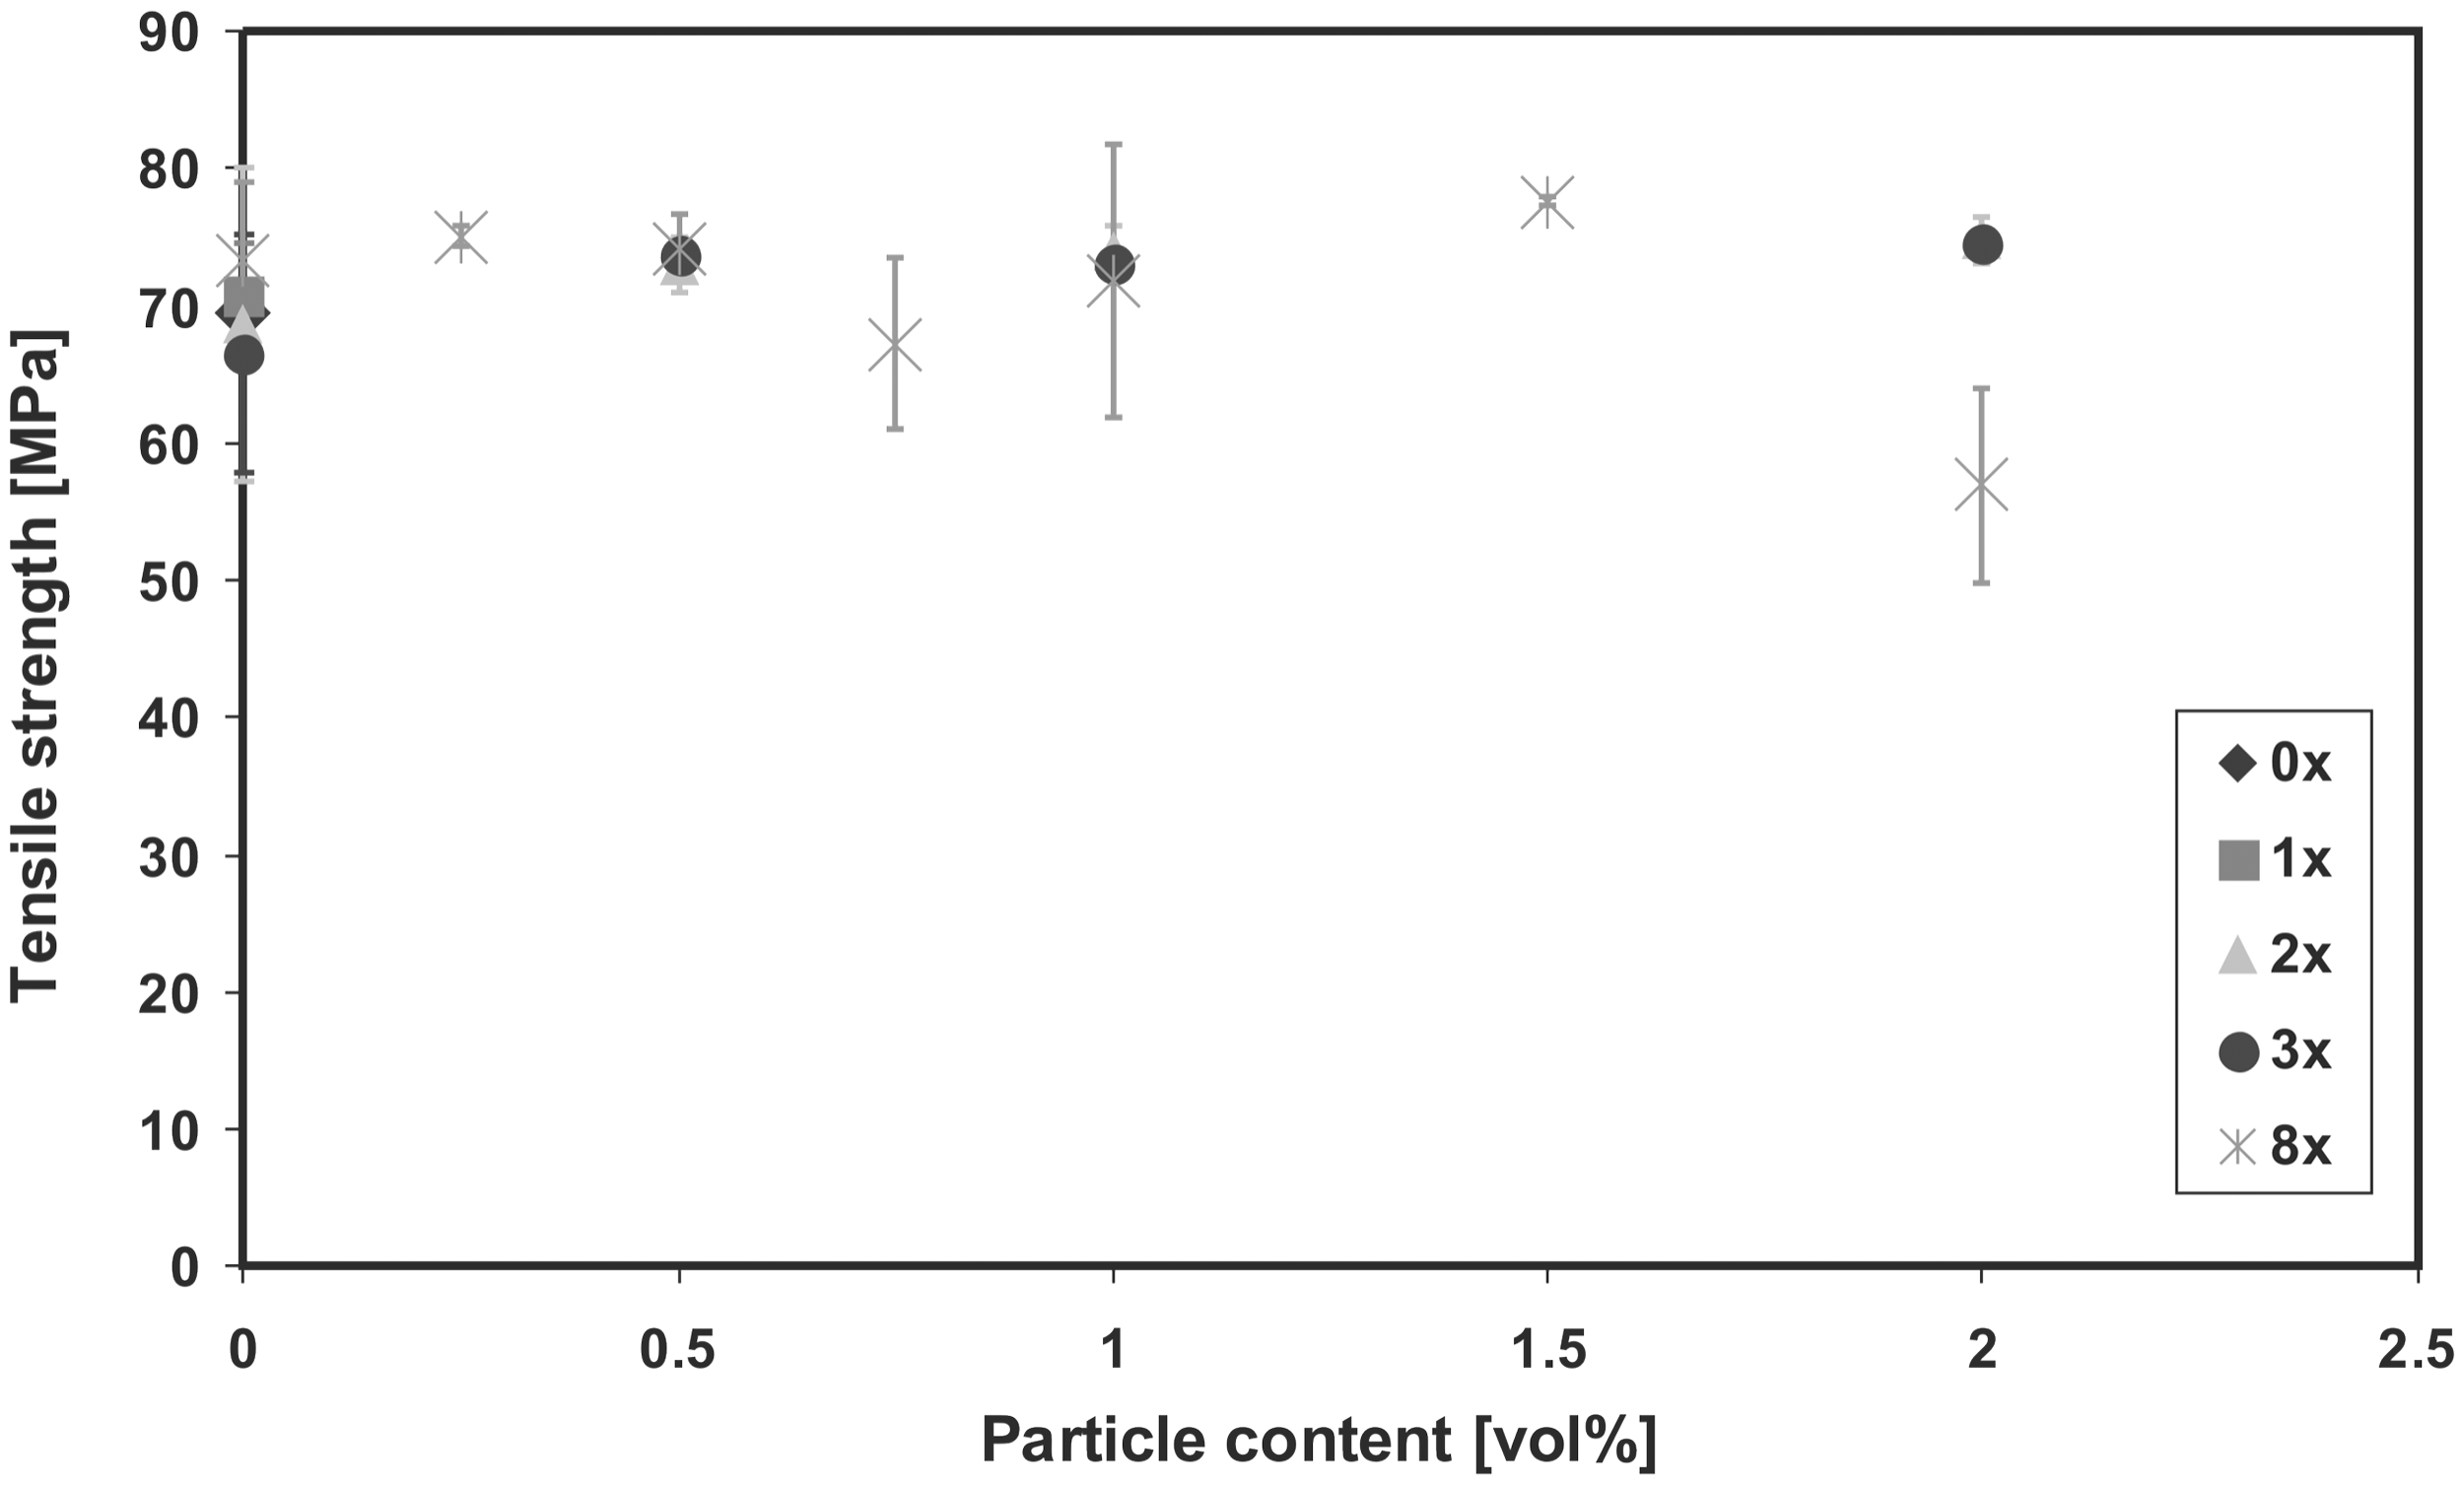
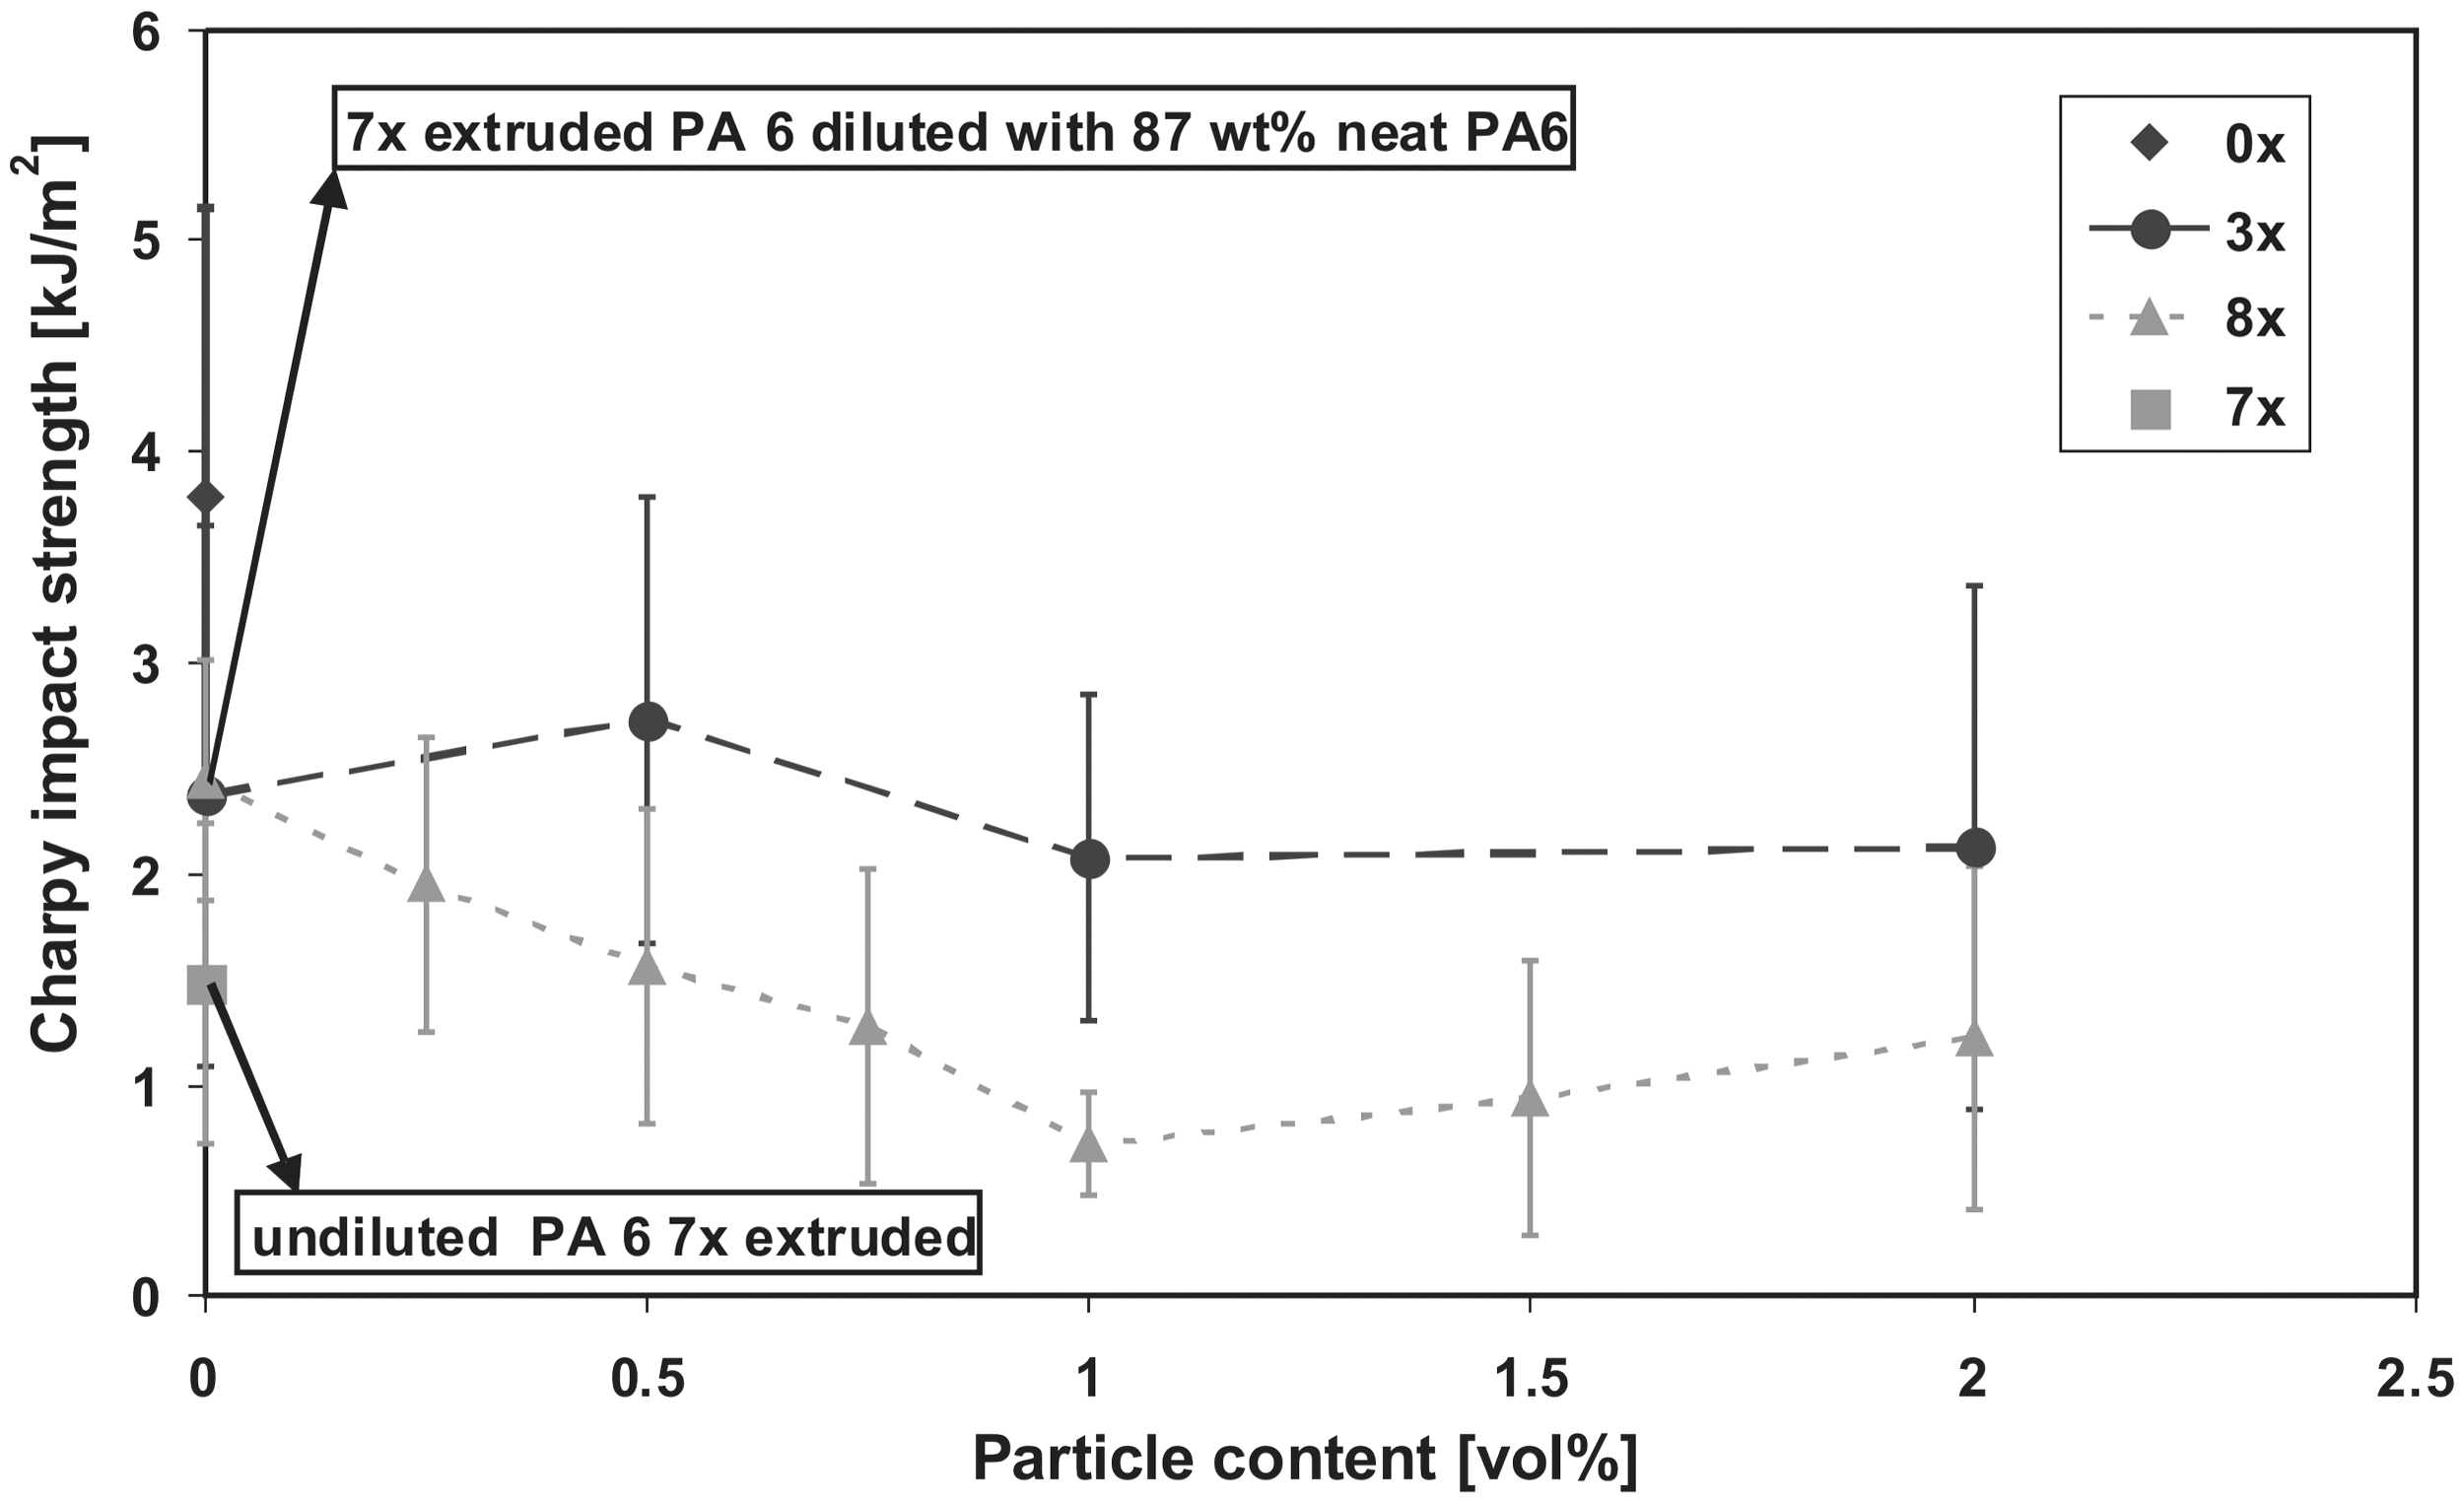
In the case of Charpy impact strength, nanoparticle-reinforced polymer composites should show a higher toughness as a function of homogeneous distribution and dispersion of nanoparticles than microparticle-reinforced composites, due to their respective mechanisms such as crack deflection, crack bridging and crack debonding. Via all these mechanisms there should be an increase in energy absorption [20, 28, 30] leading to a higher toughness and impact strength. However, looking at Figure 17 it is evident that the impact strength of neat PA 6 is much higher than that of the nanoparticle-reinforced PA 6 composites. From Figure 17 it is quite impressive to see that toughness is not only a question of particle size, shape and distribution, but also a function of molecular weight at a given morphology. Neat PA 6 shows, after seven extrusion steps, nearly one-third of the original impact strength, indicating a large decrease in molecular weight. A drastic increase takes place in further extrusion steps (8 times) by adding neat PA 6. This procedure of adding neat PA 6 always took place in the last extrusion step, to achieve the final particle content (0.5; 1.0; 1.5; 2.0 vol%). However, independent of the adding of neat PA 6, the impact strength is, in the case of the reinforced compounds, with increasing extrusion steps lower than PA 6, passing the same extrusion history. Only in case of three extrusions does impact strength seem to achieve a maximum at 0.5 vol% TiO2, still far below the impact strength of neat PA 6. From the SEM and μCT analyses a deagglomeration of the respective agglomerates is evident, but we will never be able to destroy all the agglomerates independent of the number of extrusion steps we apply. Figure 18 shows the state of the art of agglomerates after eight rounds of extrusion, the so-called dilution steps used to achieve the final particle content. Even here we see remaining agglomerates, which might be the reason for a lower impact strength in the case of reinforced PA 6.
Scanning electron microscopy images of the ‘diluted’ seven times extruded TiO2 masterbatch (7 vol%) to obtain the final particle content, which is given top-left in the pictures. Charpy impact strength as a function of TiO2 nanoparticle content and extrusion steps in PA 6.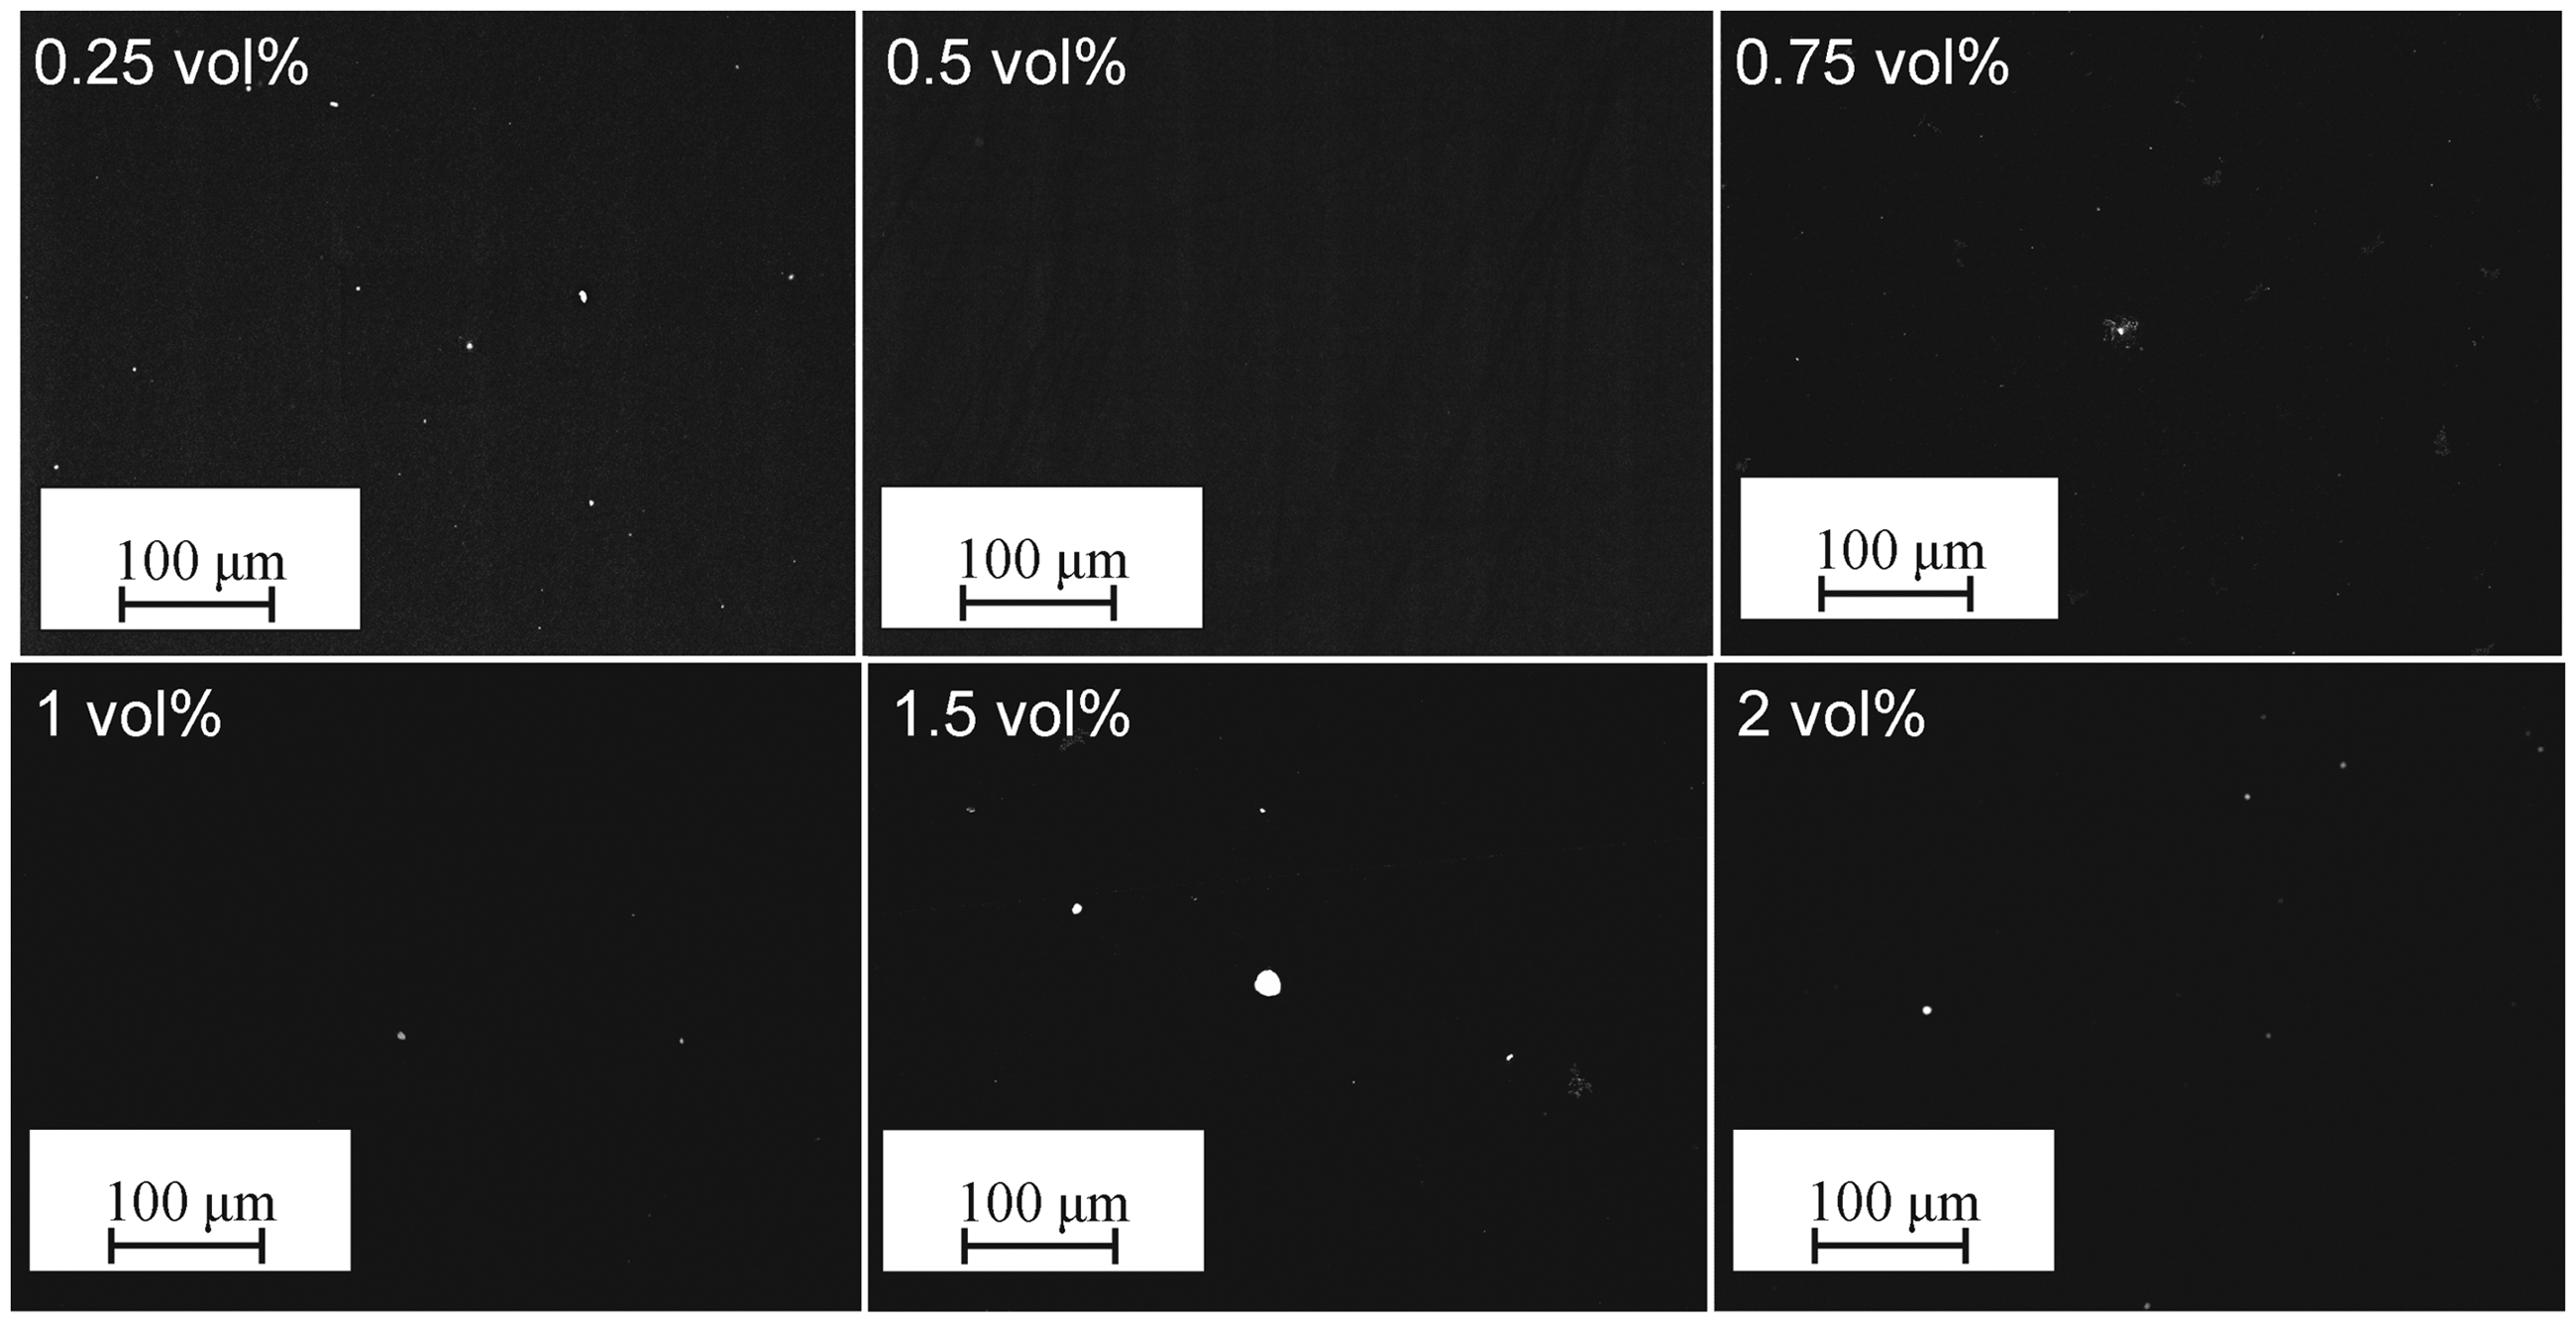
Conclusion
The goal of this work was to determine the effect of TiO2 and BaSO4 nanoparticles on the mechanical properties of PA 6. Using twin screw extrusion, 7 vol% of the respective nanoparticles were incorporated. In order to achieve a high degree of deagglomeration, multiple extrusion steps were applied. Compounds filled with TiO2 nanoparticles showed a dispersion index of D = 95% after only three extrusion cycles. On the contrary, in the case of BaSO4 reinforced PA 6, the maximum dispersion index was only 71%, and this after seven extrusion cycles. The mechanical properties remained constant or increased with the number of extrusion steps. However, even in the case of a good degree of deagglomeration for TiO2 nanoparticles, the impact strength does not increase but decreases with increasing extrusion steps. The remaining agglomerates seem to act as defects, decreasing the energy absorption of the compound. Nevertheless, the degree of deagglomeration (distribution), especially in case of TiO2, is sufficient to enable processability via melt spinning of nanomodified PA 6 yarns.
Footnotes
Acknowledgements
The authors gratefully acknowledge the support of the German Federal Ministry of Education and Research (BMBF) (Contract No. 03X0058C) and the Center for Project Management (PTJ) for funding this research project.