
Abstract
Adhesion and friction of E-glass fiber-reinforced epoxy (E-GFRE) composites were studied using pin-on-disc tester. The worn surfaces of the composites were examined using scanning electron microscope. The results showed that the wear resistance of E-GFRE composites can be improved by inserting approximately 5–10 wt% C-filler loading. Above 10 wt%, the wear mass loss increased linearly with increasing C-filler loading. The reinforcing C-filled E-GFRE composites have almost the same friction coefficient as the pure epoxy matrix which increased slightly on increasing C-filler loading. From the SEM microscopy observation, the main wear mechanisms for pure E-GFRE composites were plastic deformation, abrasive wear, and fatigue wear.
INTRODUCTION
Over the past 50 years, synthetic polymeric materials have been widely used in household materials, engineered products, medical disposable supplies, polymeric skin replacement systems, and other applications. The main advantages of the polymeric biomaterials compared to metal or ceramic biomaterials are the close resemblance to human soft tissue, ease of manufacturability to produce various shapes (latex, film, sheet, fibers, etc.), reasonable cost, and versatility in properties with desired mechanical and physical properties. Polyethylene has been used for tubes for various catheters, hip joints, knee-joint prostheses, and orthopedic implants. The reason is besides its low cost, polyethylene has high malleability, excellent electrical insulation properties, excellent chemical resistance, toughness, and flexibility even at low temperatures. Due to the use of polymers, the orthopedic implants are expected to withstand high loading forces, fracture in the longer term from creep or catastrophic brittle fracture, stress corrosion, and fatigue [1]. The overview applications of polymeric materials are surface joining, structures, body shell, etc. [2–11].
Friction is the tendency of a material to resist the force acting perpendicular to the load at the surface of contact. The presence of friction indicates that the possible wear may occur at the desired surface of contact [10–15]. Usually, in a tribological test, friction is the indicator that possible wear may occur, regardless of the material properties. Normal load and sliding velocity are the most common parameters used to manipulate the effect force and time to study the friction behavior on interacting surface. A dry condition of interfacing surface creates more friction, thus increasing the wear rates [12] in wear process. The surface integrity that may change in the particle debris, which is worn out may increase the abrasion force to the contacted surface, thus increasing the wear of the surface. Other researchers such as Xu et al. [6] are concerned about how the addition of fibers in matrix material can decrease the friction, thus increasing the wear resistance of the material surface.
Another parameter commonly chosen by researchers is sliding distance. Sliding distance is commonly chosen in test material surfaces that need long time of contact with relatively steady velocity. Erosion wear is usually the typical type of wear occurring under these circumstances. Using Taguchi method, the erosion response of glass fiber-reinforced polyester can be characterized [7].
EXPERIMENT
Materials
Material used for this project is fiberglass-reinforced polymer. Fiber-reinforced polymers are composite materials made of a polymer matrix reinforced with fibers. The mechanical properties of composites depend on many variables such as fiber type, orientations, and architecture. The fiber used in this project is E-glass, while the polymer is epoxy, which is bisphenol F diglycidyl ether (BFDGE), hardened by a hardener. Commonly, E-glass is a low-alkali glass with a typical nominal composition of SiO2 54 wt%, Al2O3 14 wt%, CaO + MgO 22 wt%, B2O3 10 wt.%, and Na2O + K2O less than 2 wt%. Some other materials may also be present at impurity levels. Woven E-glass with density in 600 kg/m3.
Properties of BFDGE
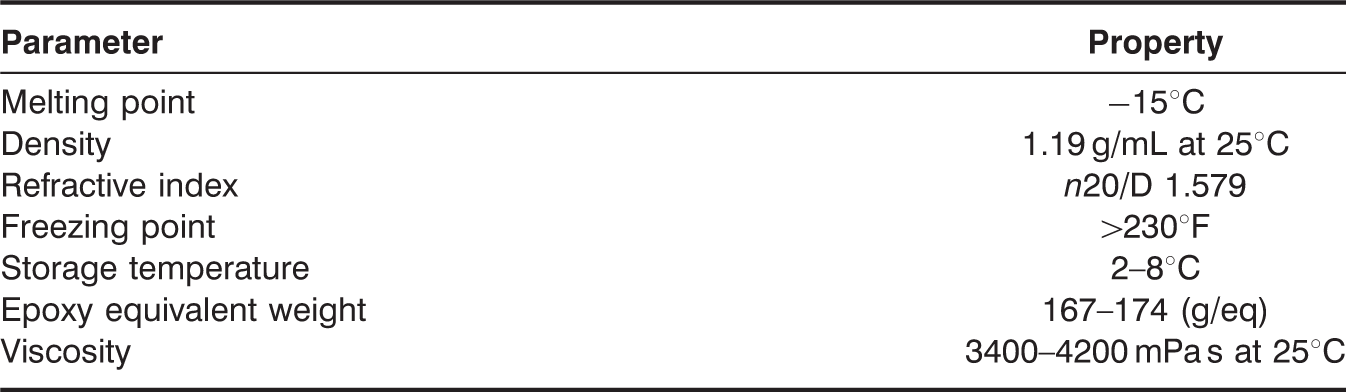
Physical Tests
HARDNESS TEST
The hardness test was performed using Future Tech Corp. Vickers micro-hardness tester with 0.3-kgf test load and 8 s of dwell time. The average hardness data were obtained for each sample.
Tribological Tests
WEAR AND FRICTION TESTS
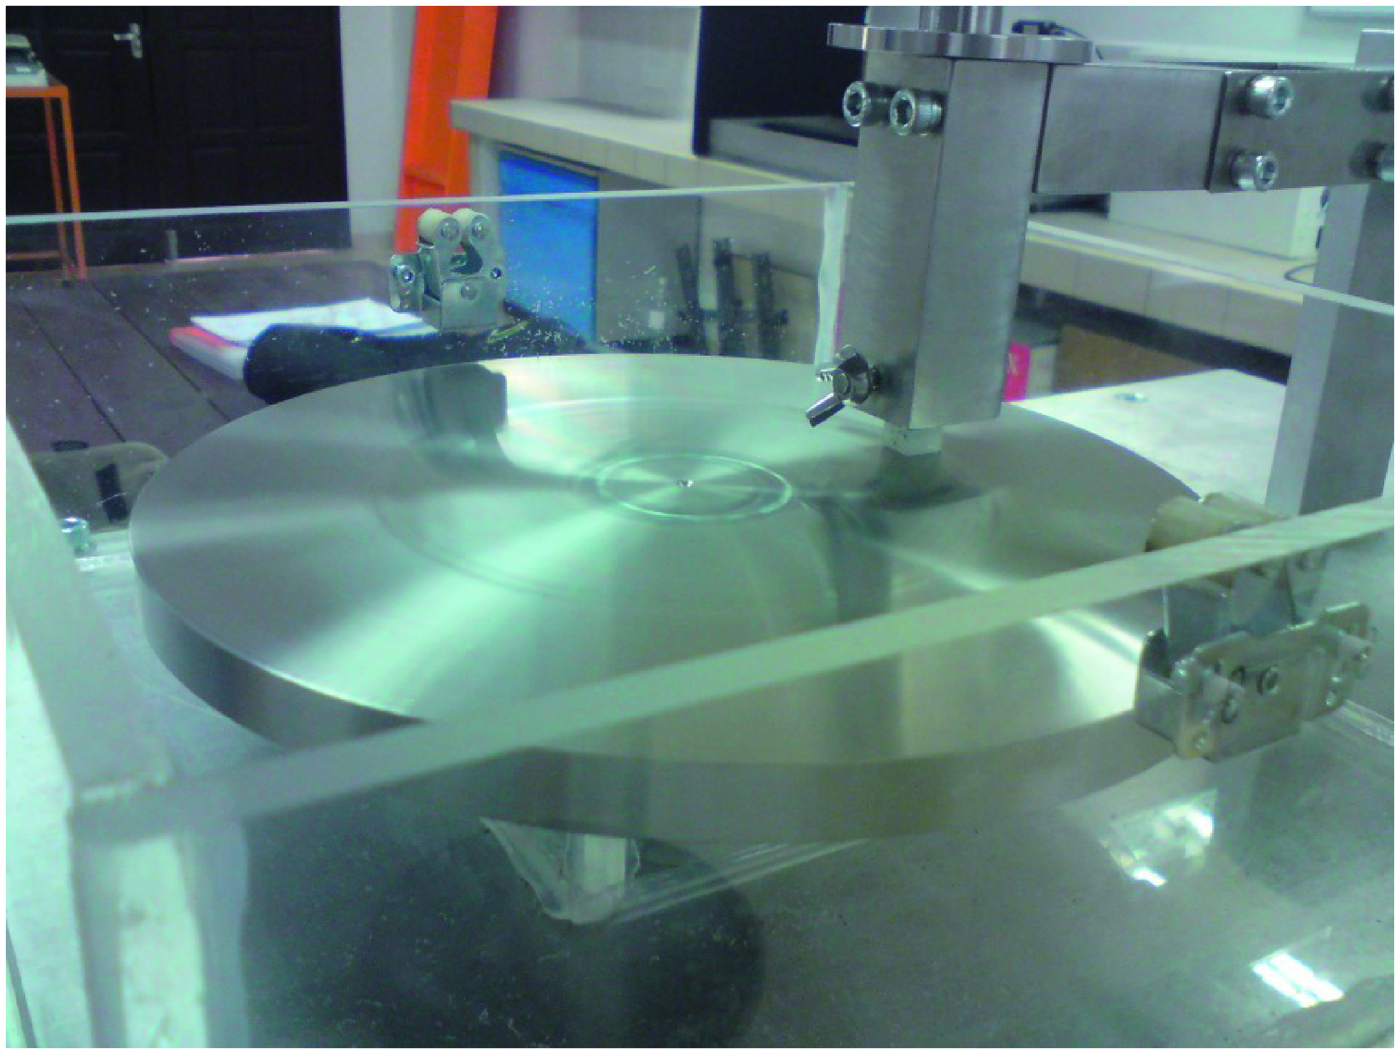
The wear and friction tests were performed using pin-on-disc tester, as shown in Figure 1. The test samples were cut from cured molded samples into square pins with dimensions 9 × 9 × 30 mm3. The abrasion area of the pin samples is 9 × 9 mm2. The disc was made of stainless steel of approximately 188 mm in diameter and 10 mm thick. The sample pin was clamped in a sample holder and the sample pin was abraded against the steel plate to simulate abrasive wear condition. The samples were tested in dry sliding condition using different variables, i.e., applied load (10–30 N) and speed (0.033–1.022 m/s). The dependable variables in this study are weight loss and average friction coefficient. The weight loss of each sample after wear test was measured using digital electronic balance ±1 mg accuracy. During the test, the deflections of voltmeter reading were recorded and the average friction coefficient was calculated from the data.
Schematic drawing diagram of pin-on-disc tester.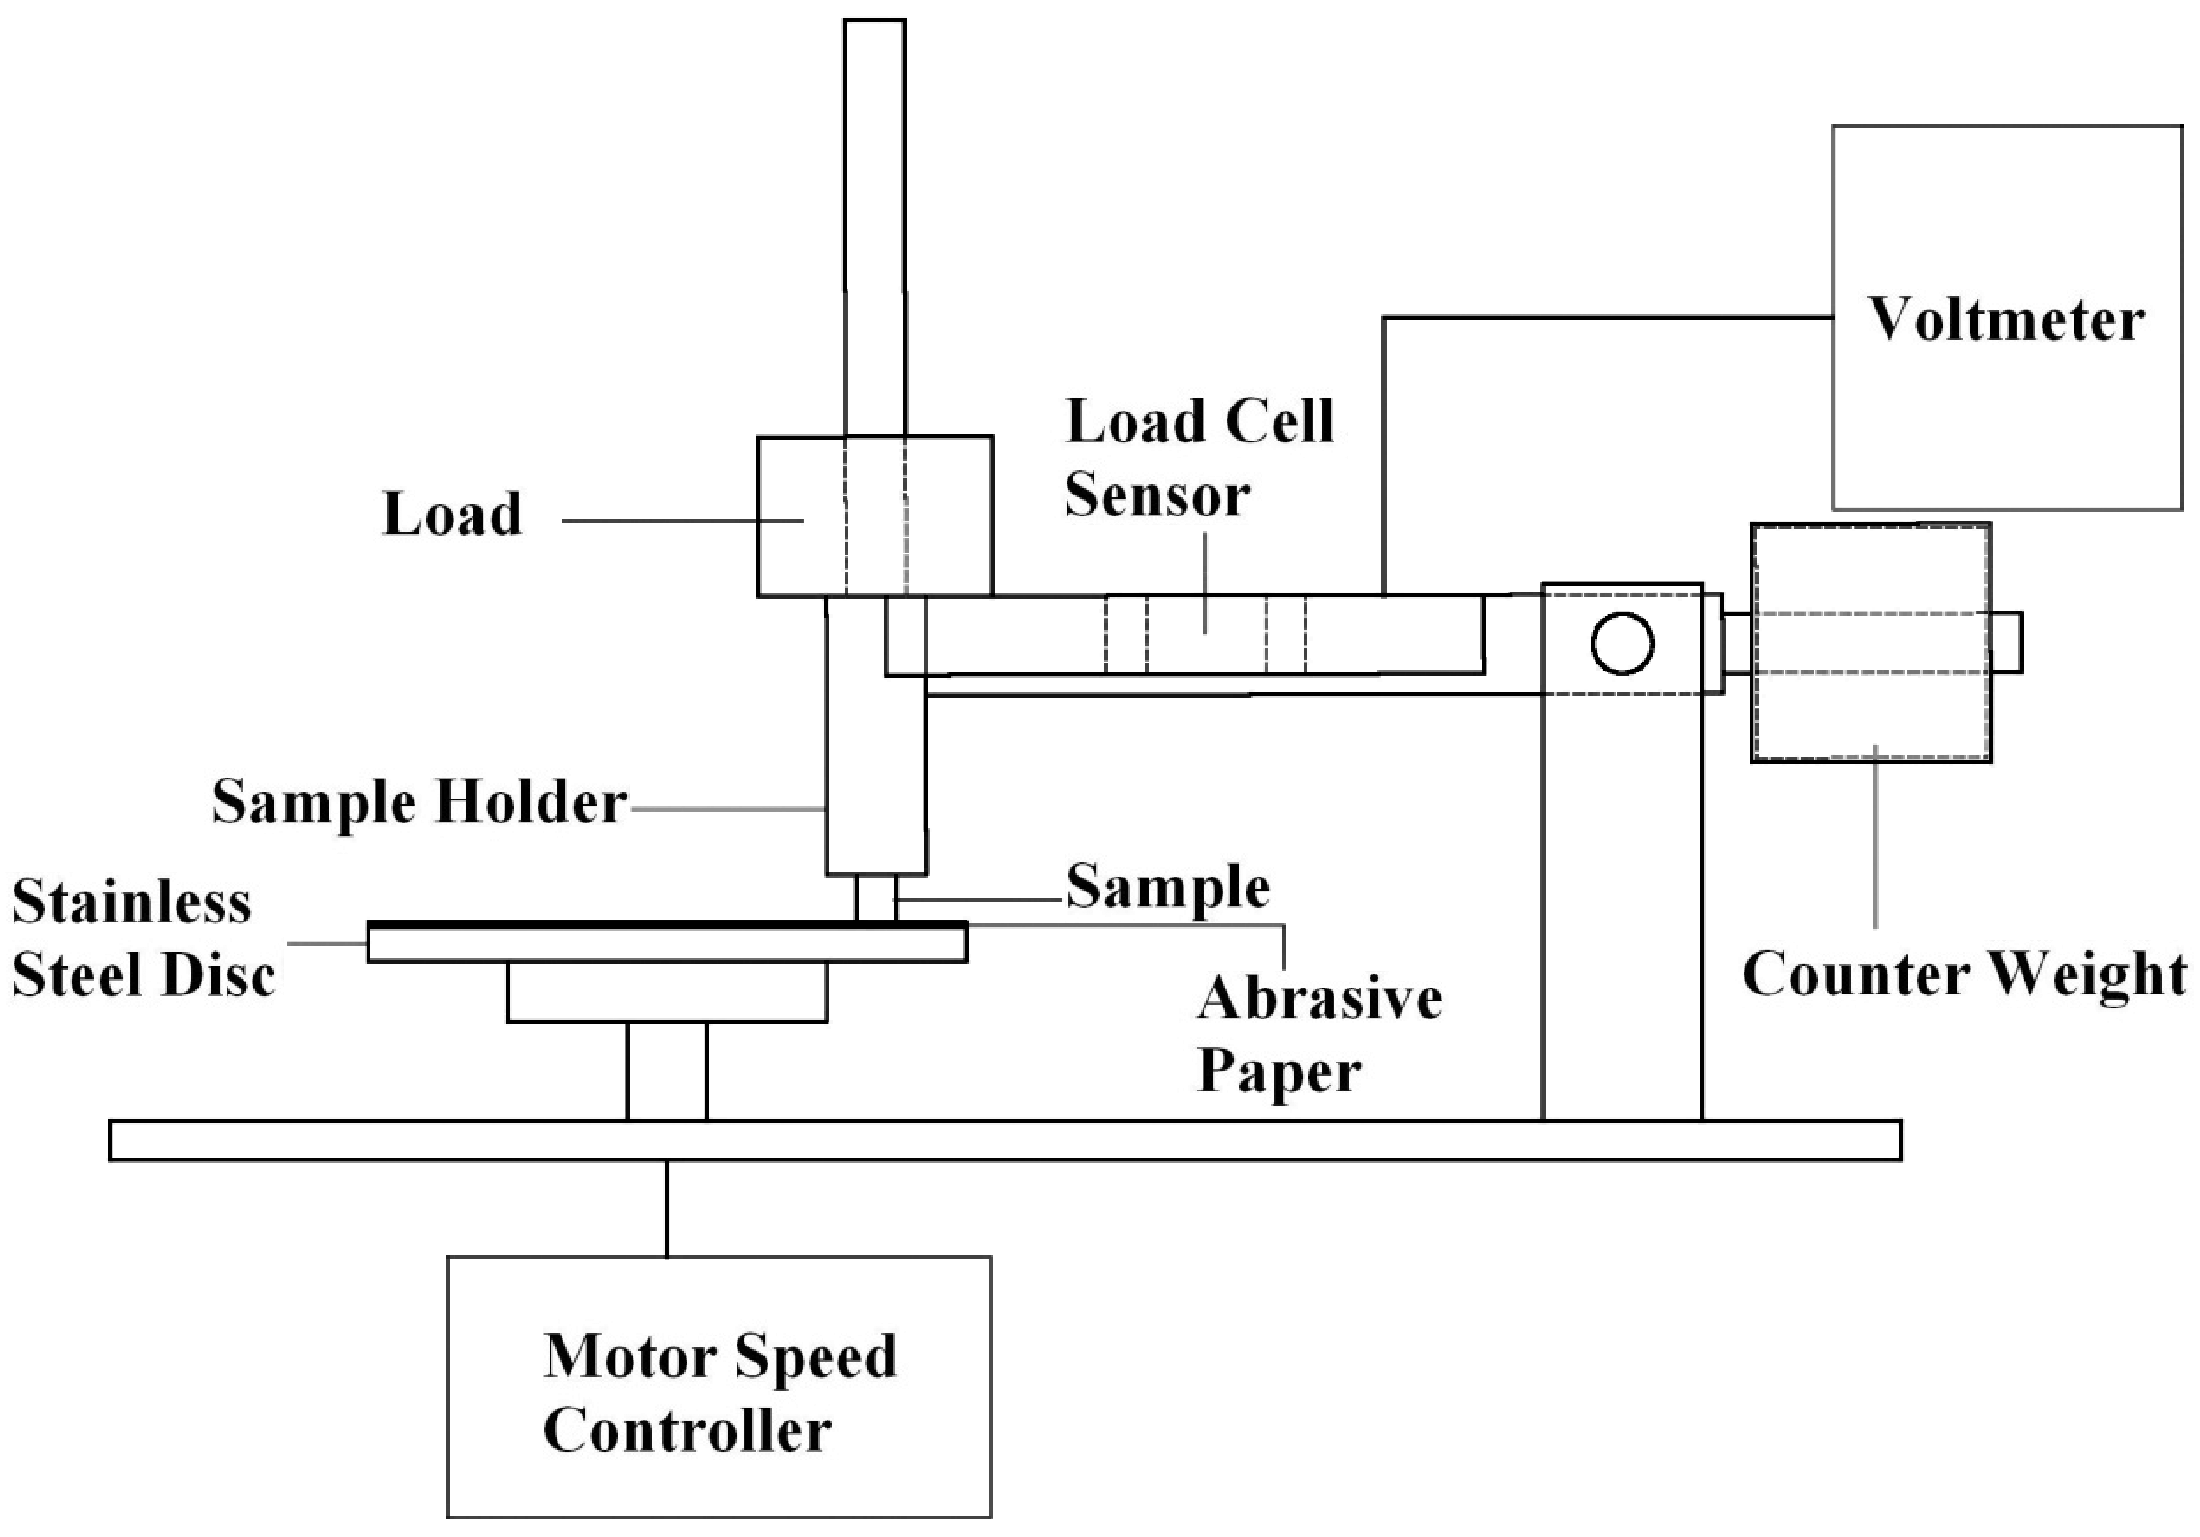
RESULTS AND DISCUSSION
Rockwell Hardness Test
Hardness value of the specimens
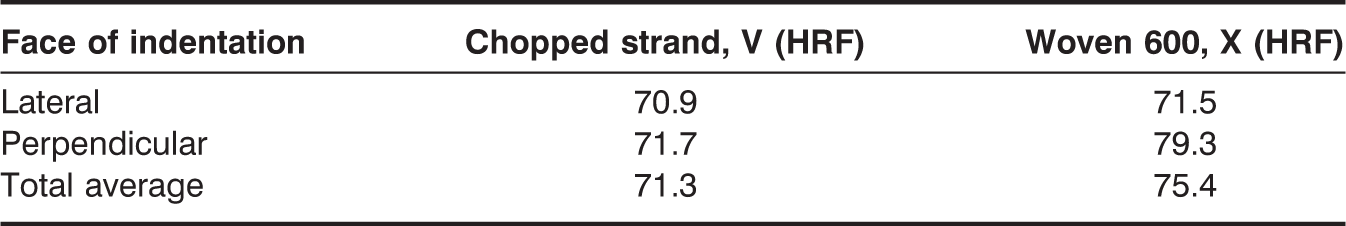
From the result, it is shown that the woven 600 kg/m3 specimen has a higher hardness value compared to chopped strand specimen. Also, we can see the pattern of the hardness on the specimen. The chopped strand hardness is more distributed than the hardness value on perpendicular and lateral faces, as the values for both faces are almost similar. On the other hand, the hardness values for woven specimen for both faces show quite a large difference in the higher hardness values on the perpendicular face.
The reason for this fact is that the orientation of fiber plays an important role in determining the hardness of the specimen. Woven specimen has a hardness higher than chopped strand due to the effect of long continuous fibers rather than short fiber on the chopped strand. The density of fiber also plays an important role as the woven specimen with more dense fiber content is proved to be harder than the chopped strand specimen with randomly oriented fibers. Higher density of fiber will stiffen the composite, as the stiffness of E-GFRE composite is mainly because of the stiffness properties of the glass fibers. The higher composition of epoxy in the chopped strand also made it more elastic and less stiff.
The random orientation of chopped strand makes the strength to be distributed more uniformly, rather than woven specimen. In lateral face, the force acting on the face is more likely to act longitudinally on the fibers, causing the force to be more likely to be taken by the binder (epoxy), whereas when the force acts in the transverse direction of fibers, the fibers will be likely to be taken by the load, as in the case of perpendicular face.
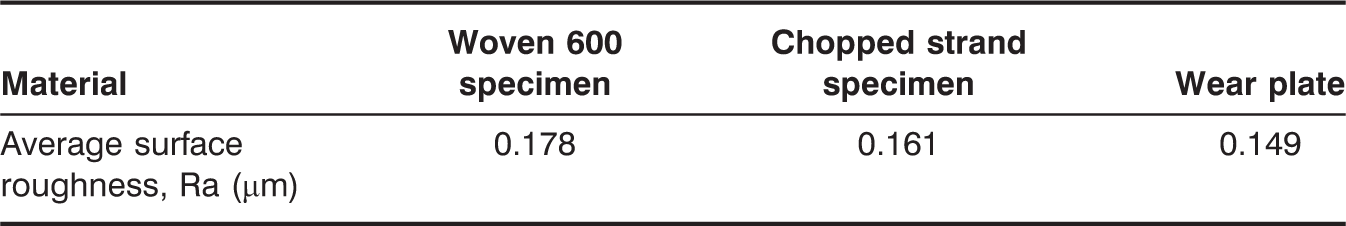
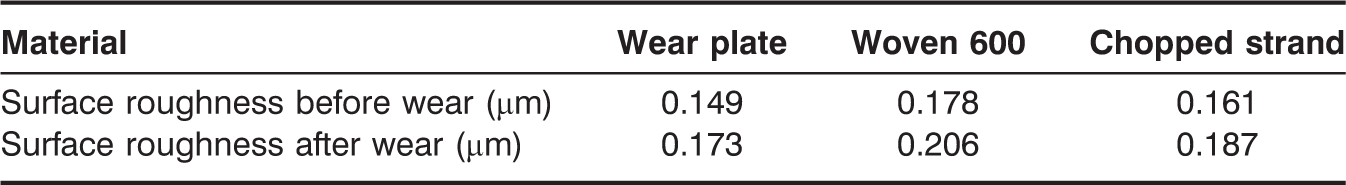
Specimen average surface roughness
Tribology Test Result
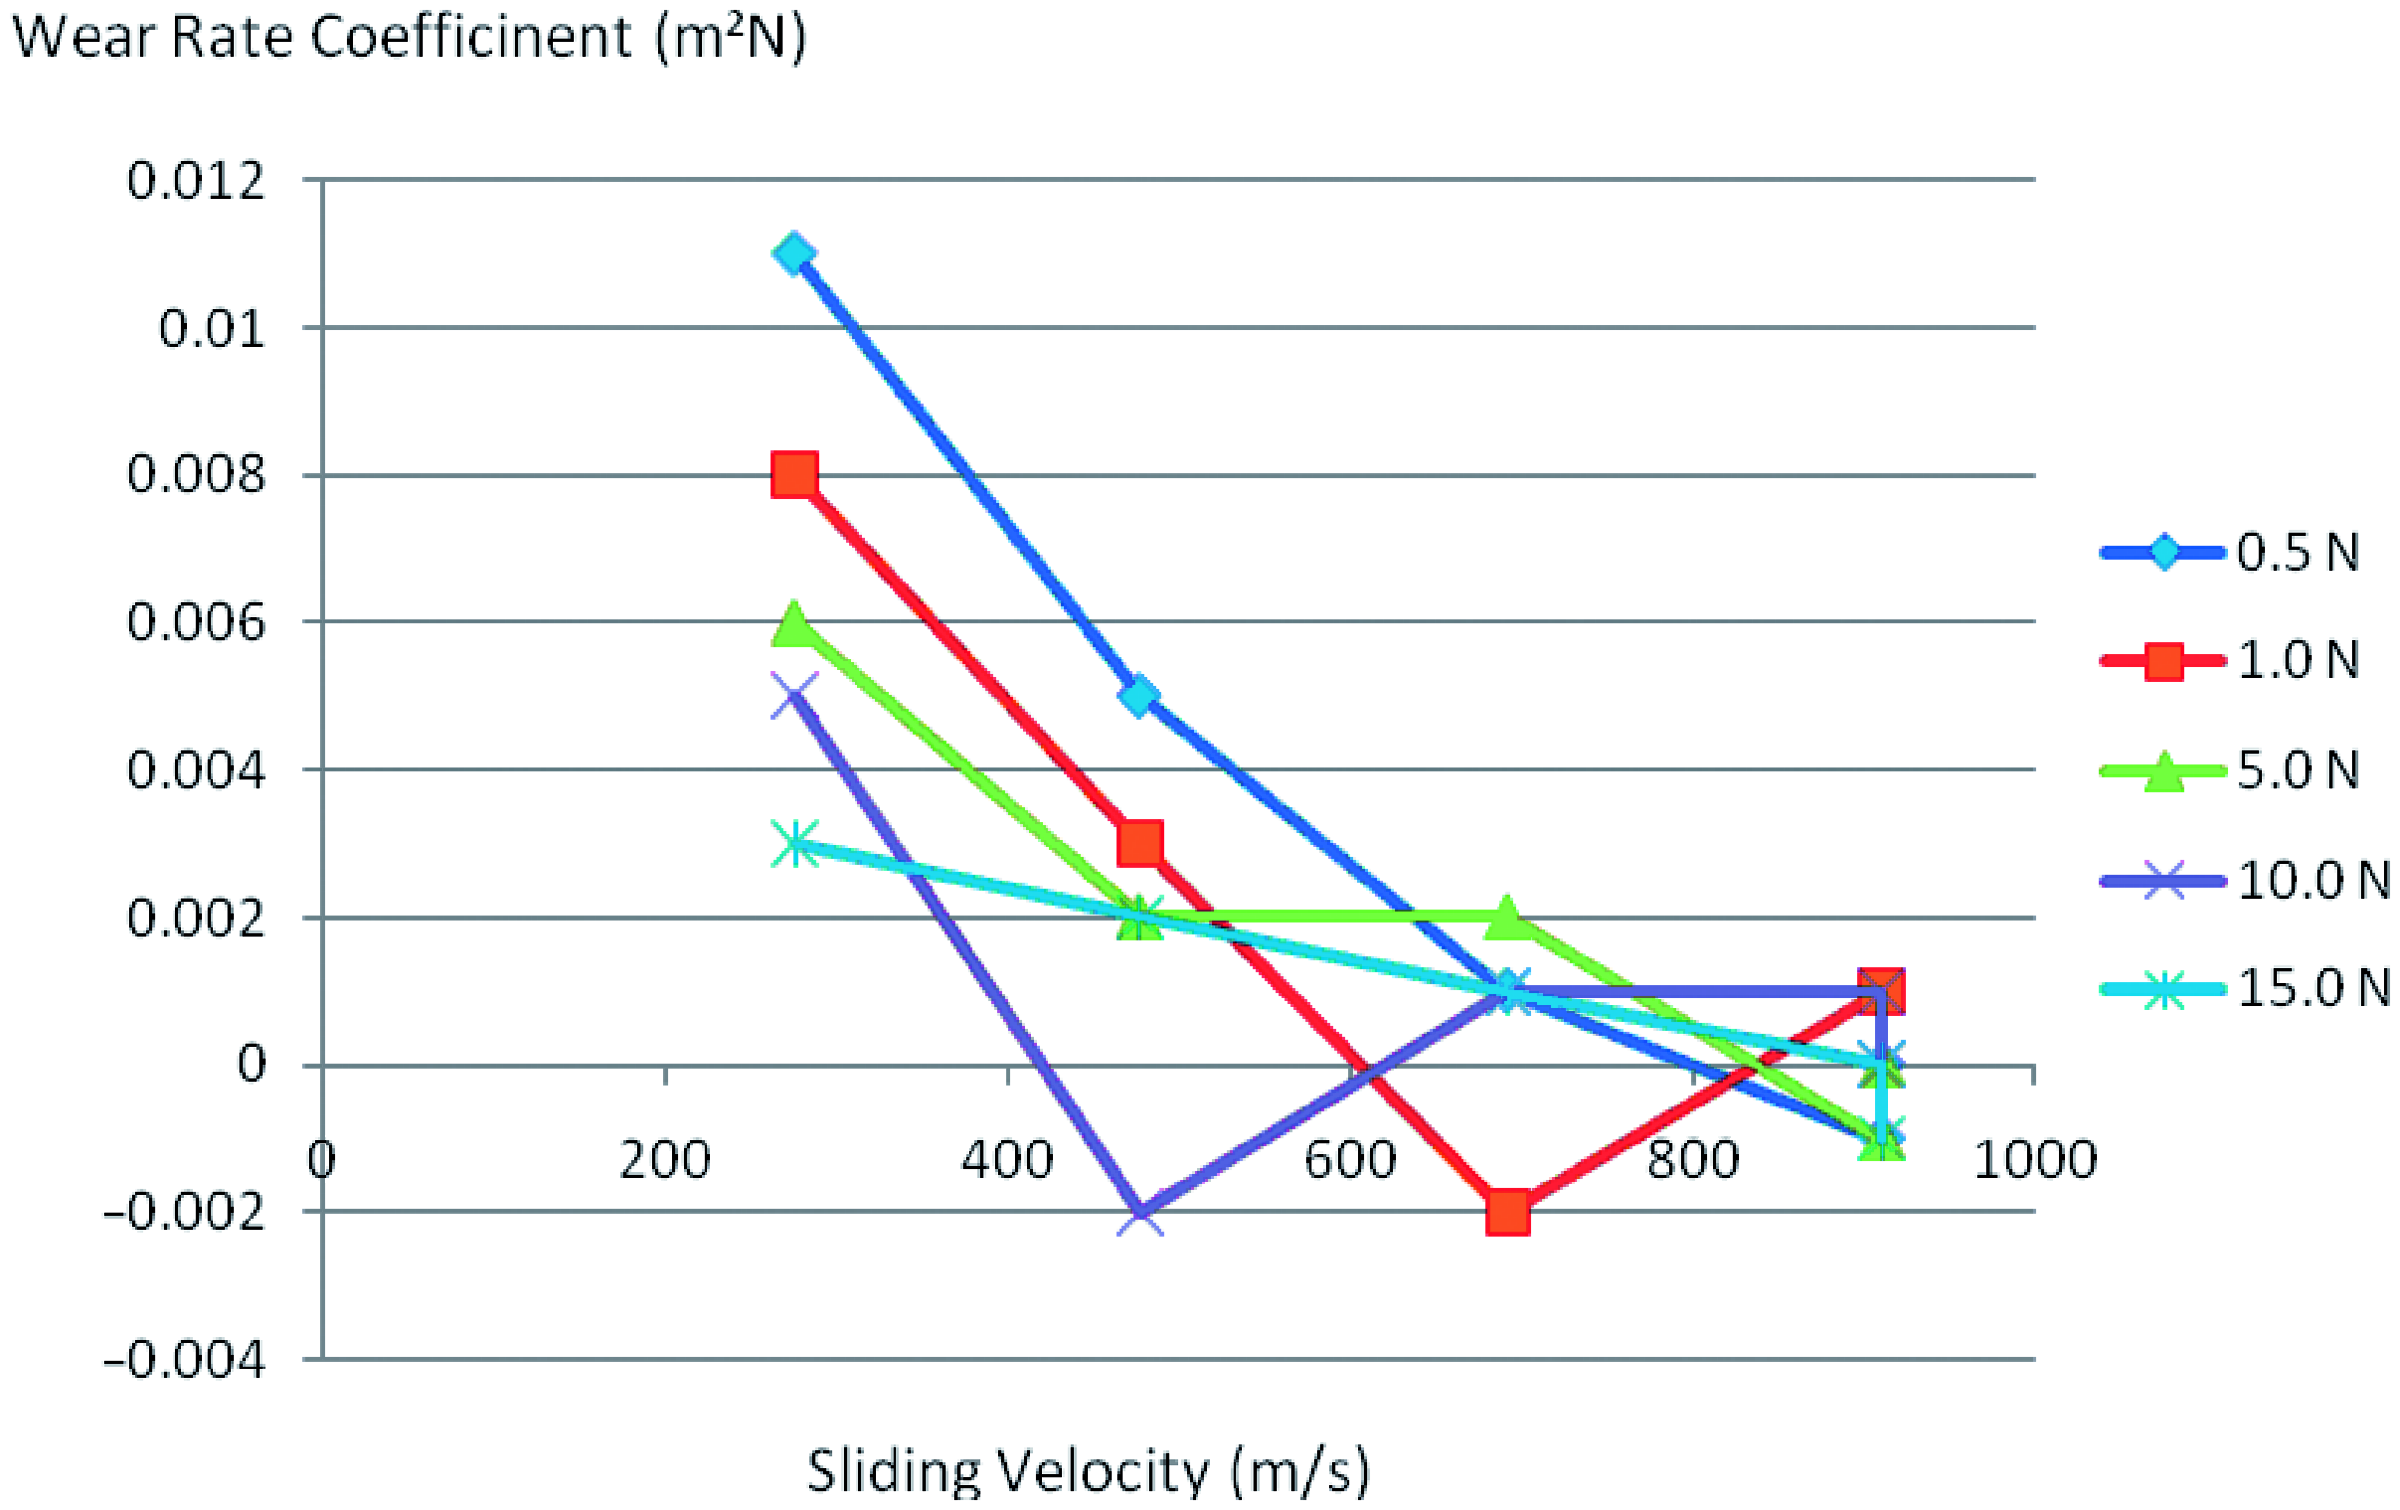
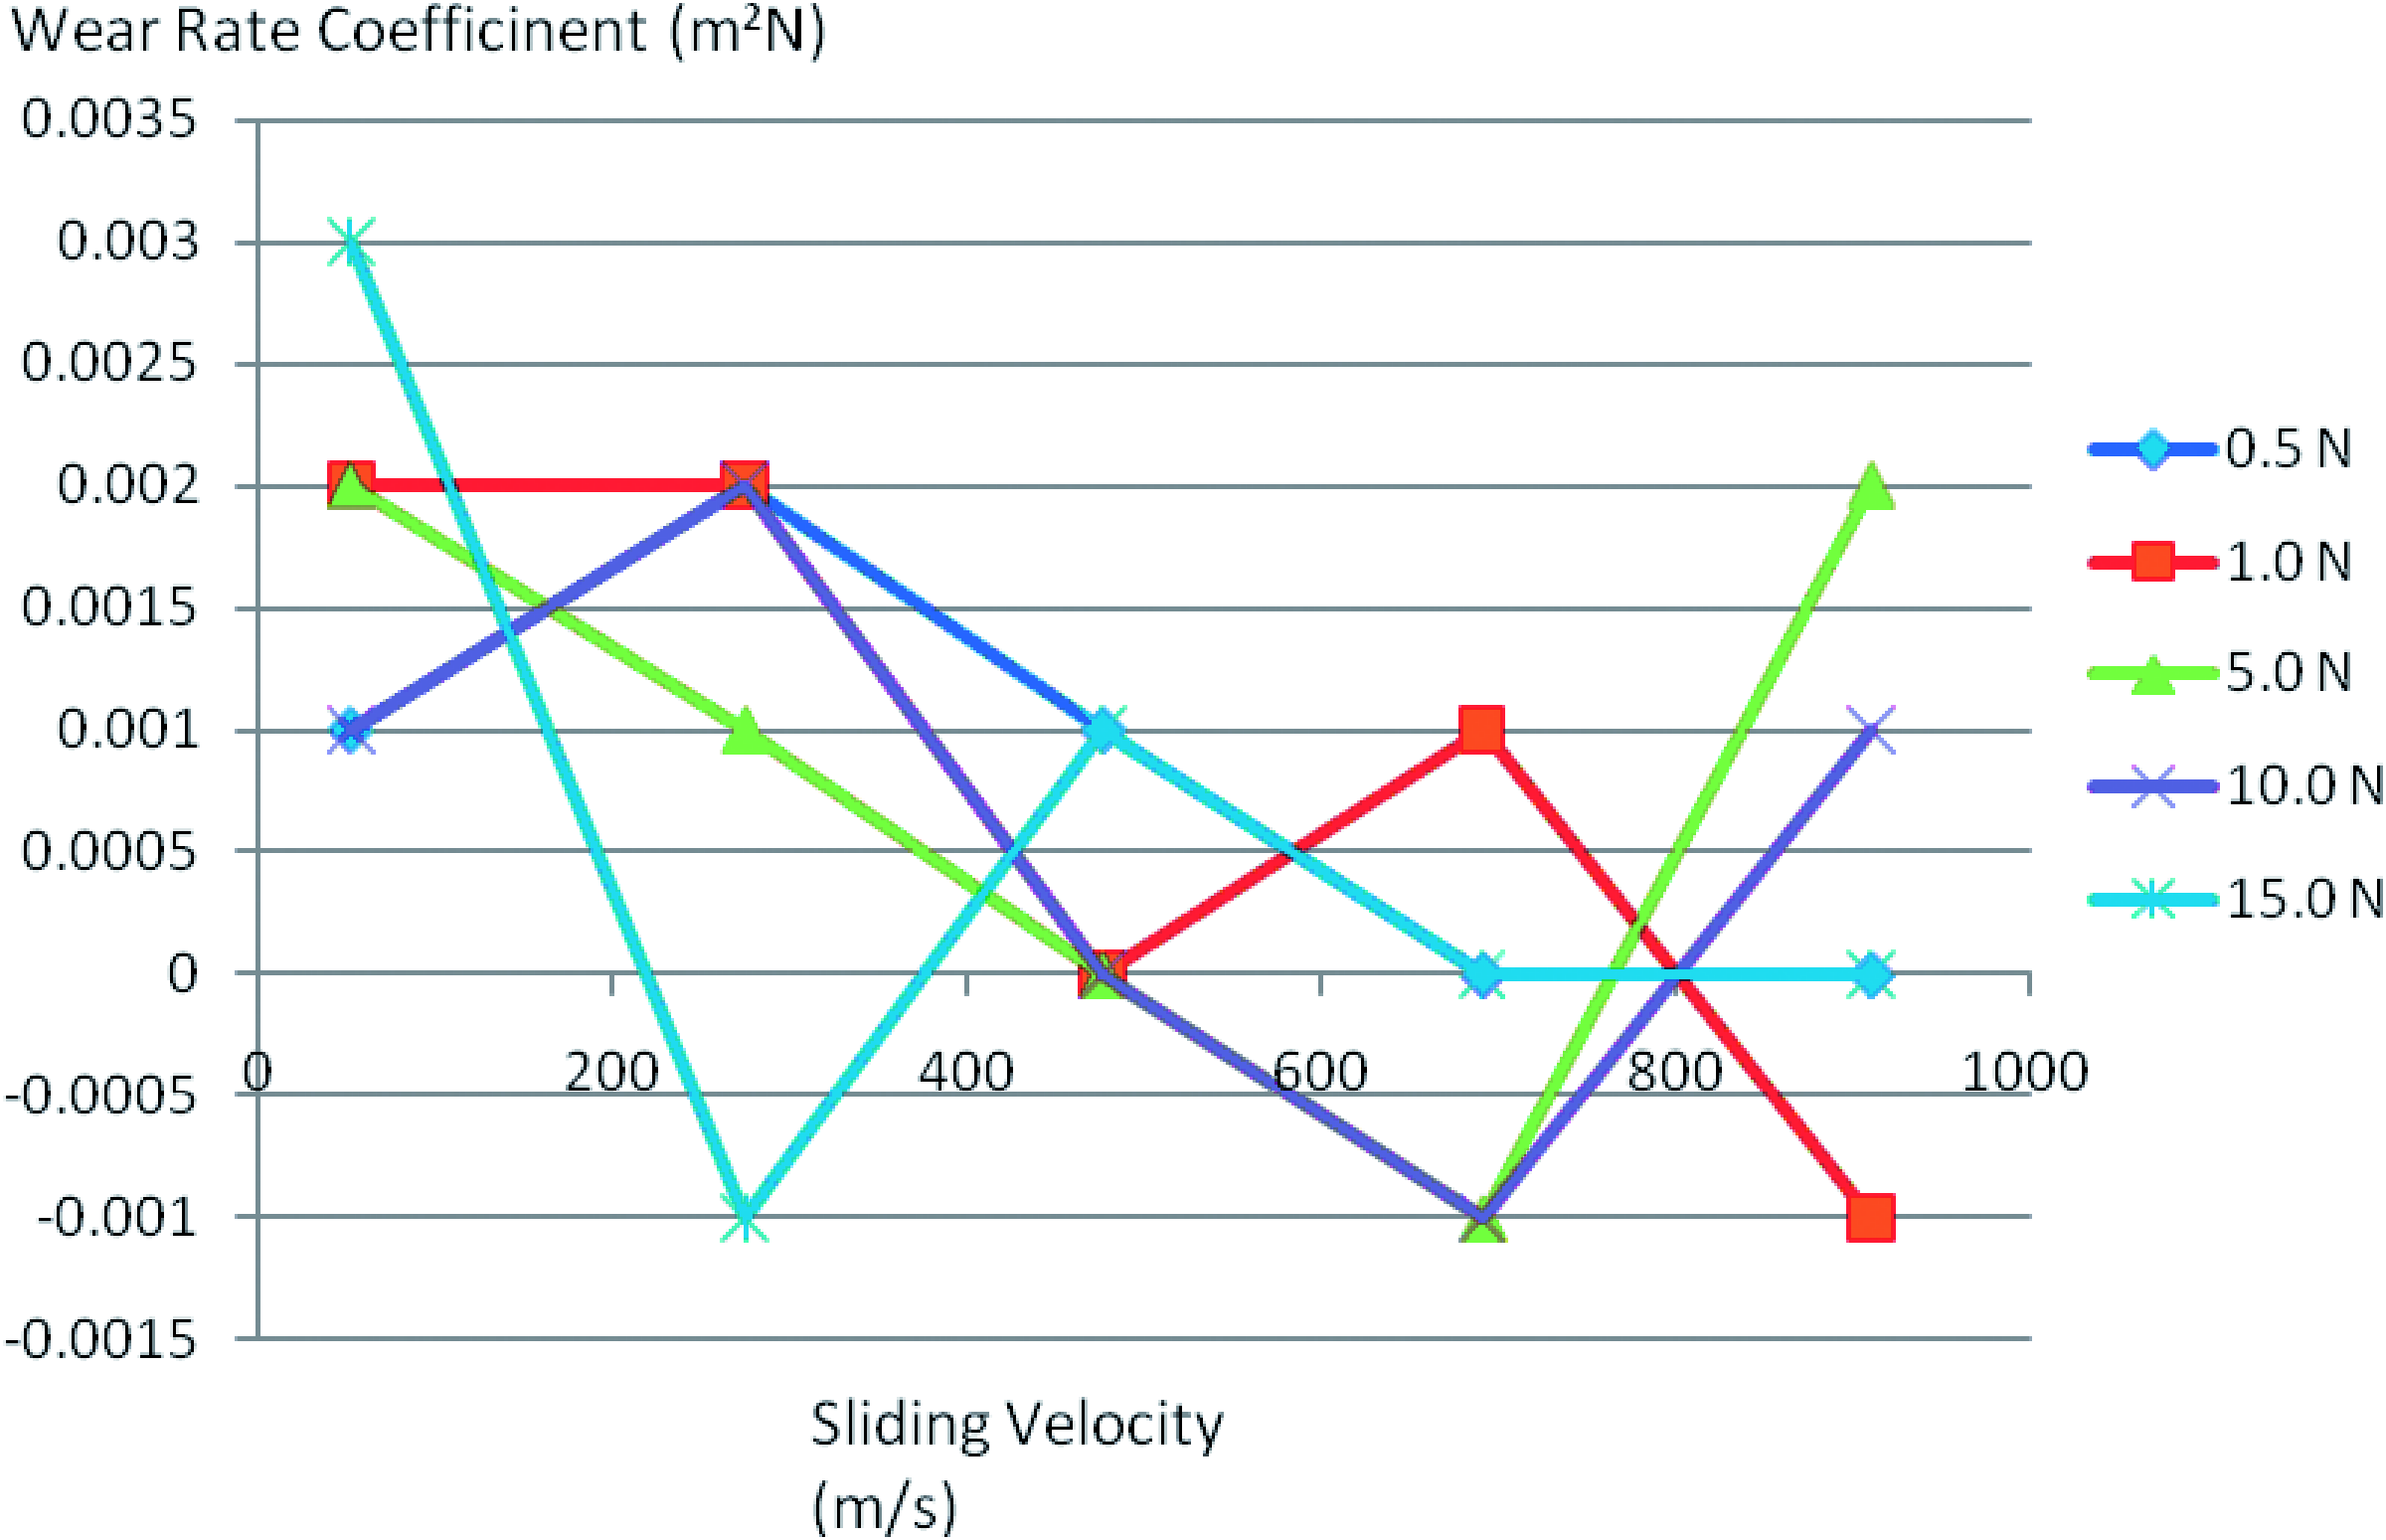
The results of the tribology test using sliding wear technique show the effect of normal load applied to the specimen and the effect of sliding distance on the worn mass of the specimen, as shown in Figures 2–5. Figure 6 shows the tribometer setup.
Effect of normal loads on the mass reduction of specimens. Effect of sliding velocities on mass reduction of specimens. Wear coefficient tabulation for chopped strand specimens for different situations. Wear coefficient tabulation for Woven 600 specimens for different situations. Experiment setup.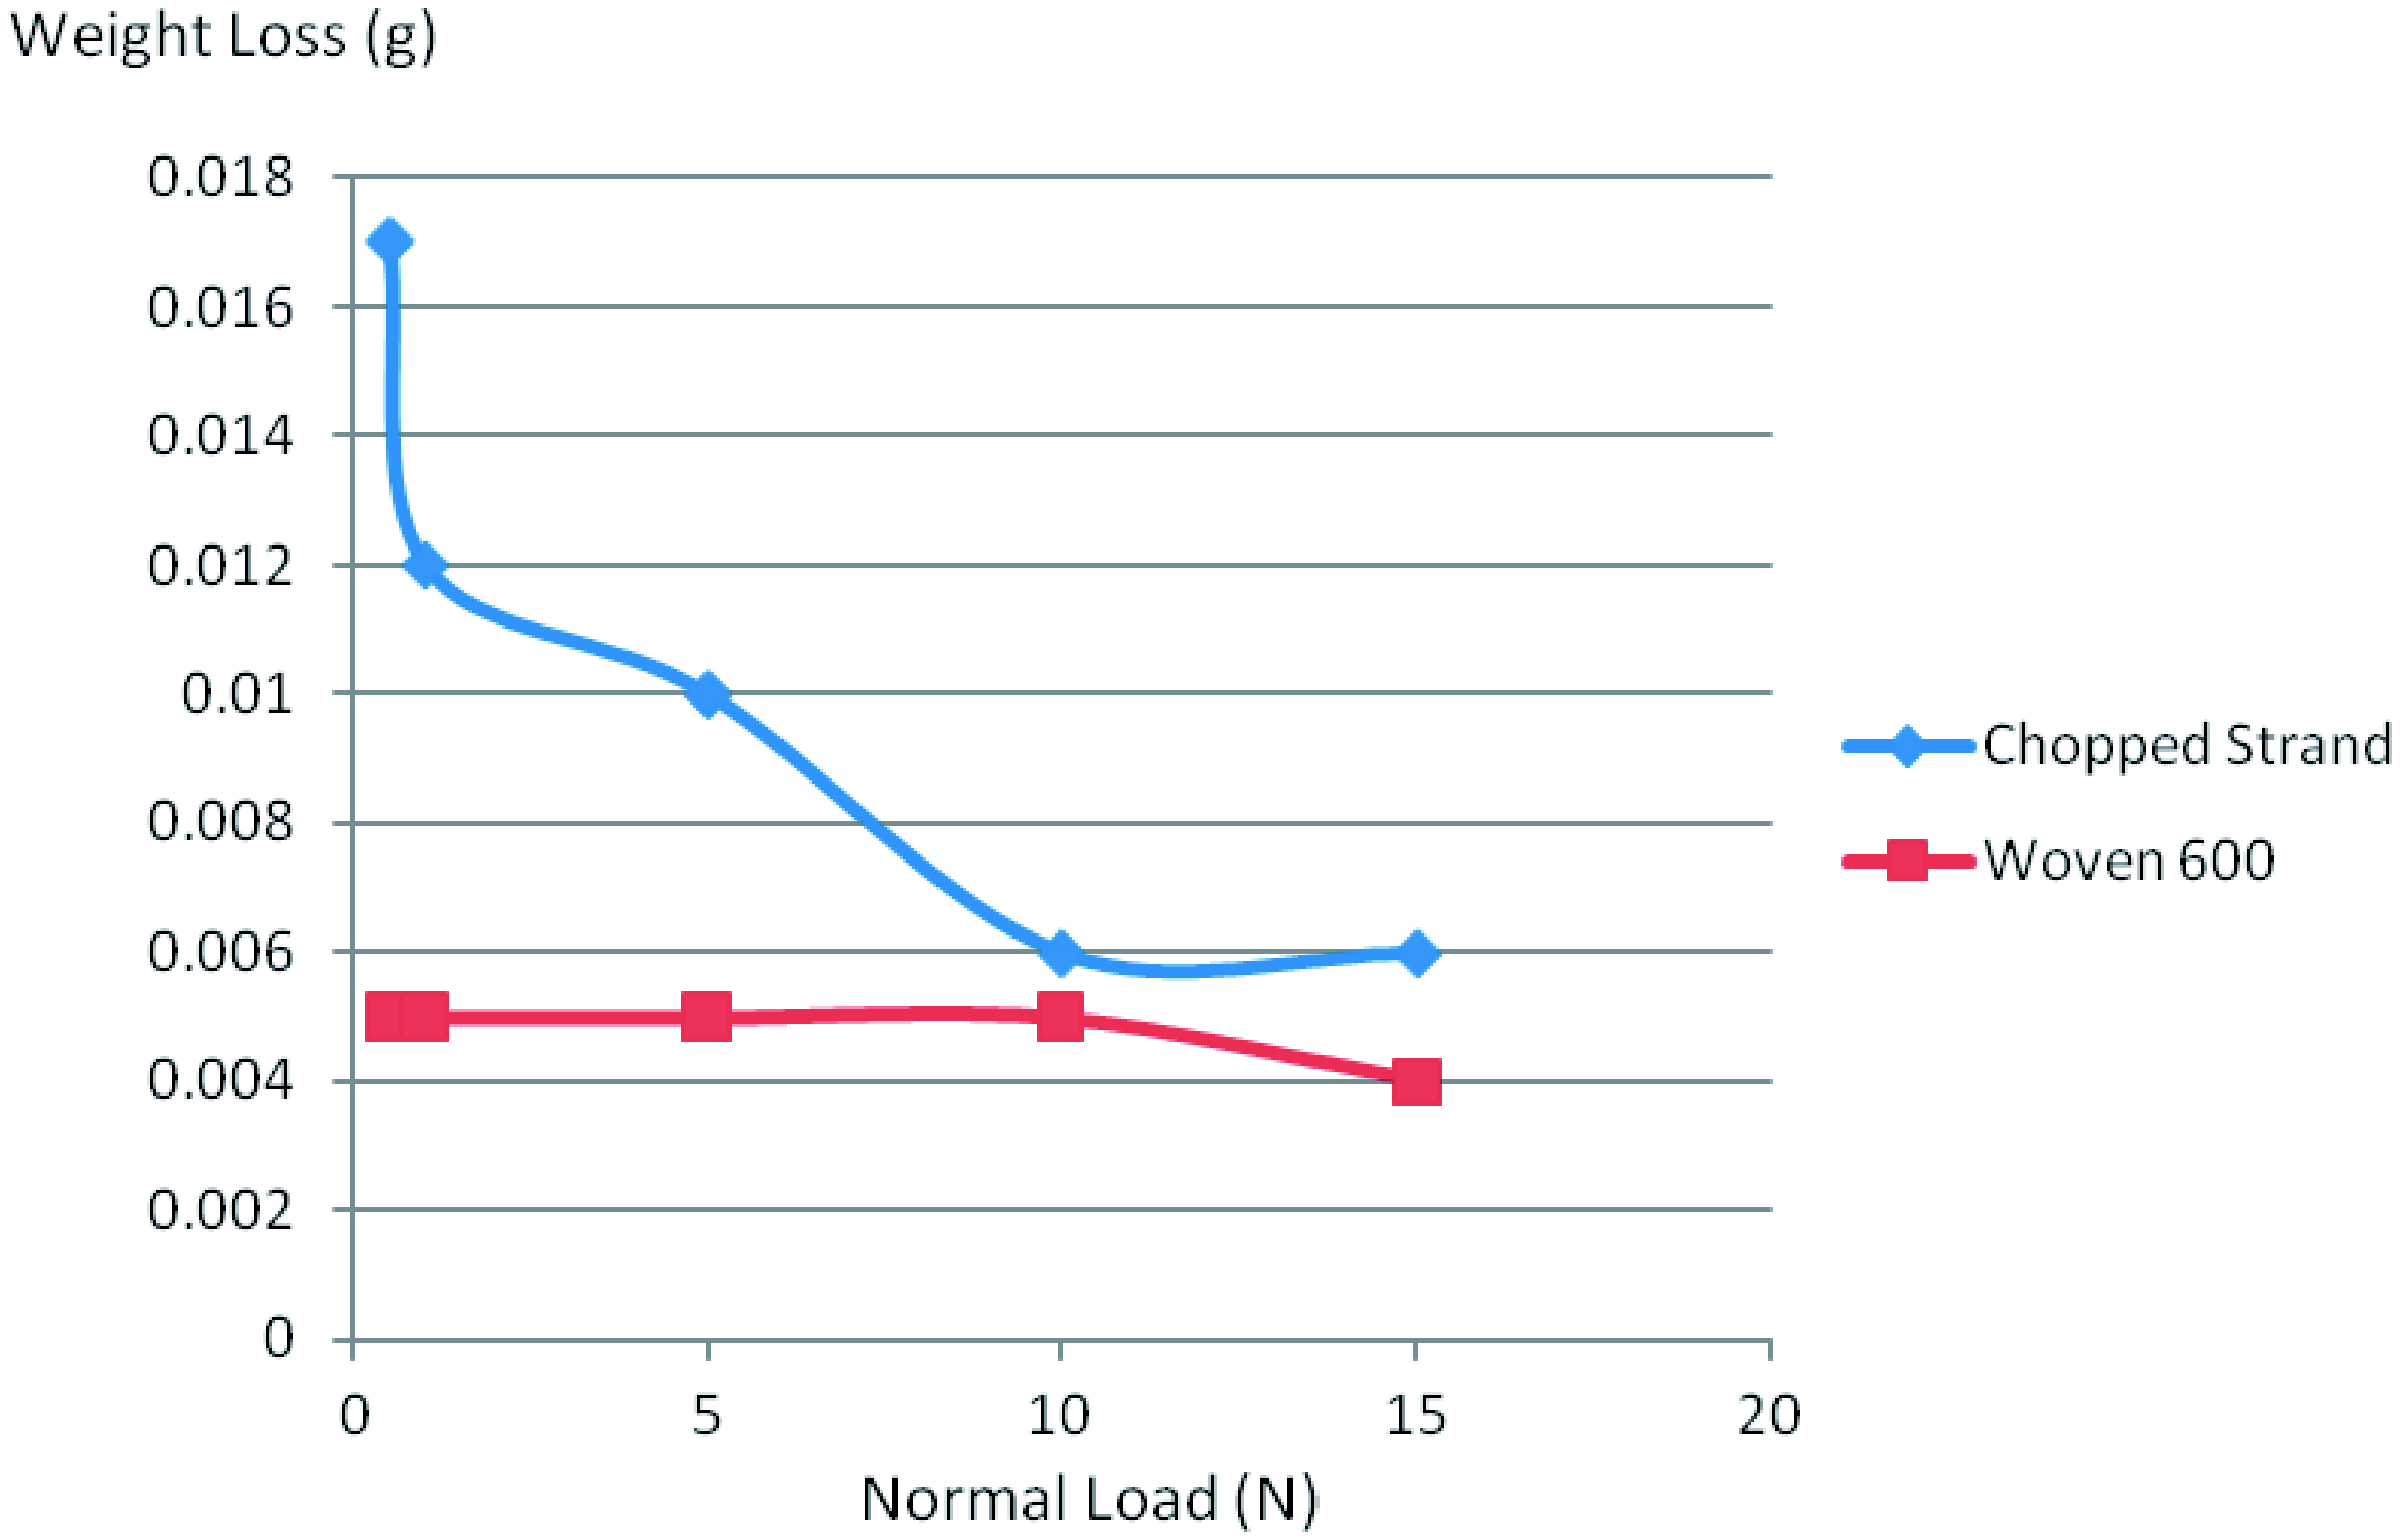
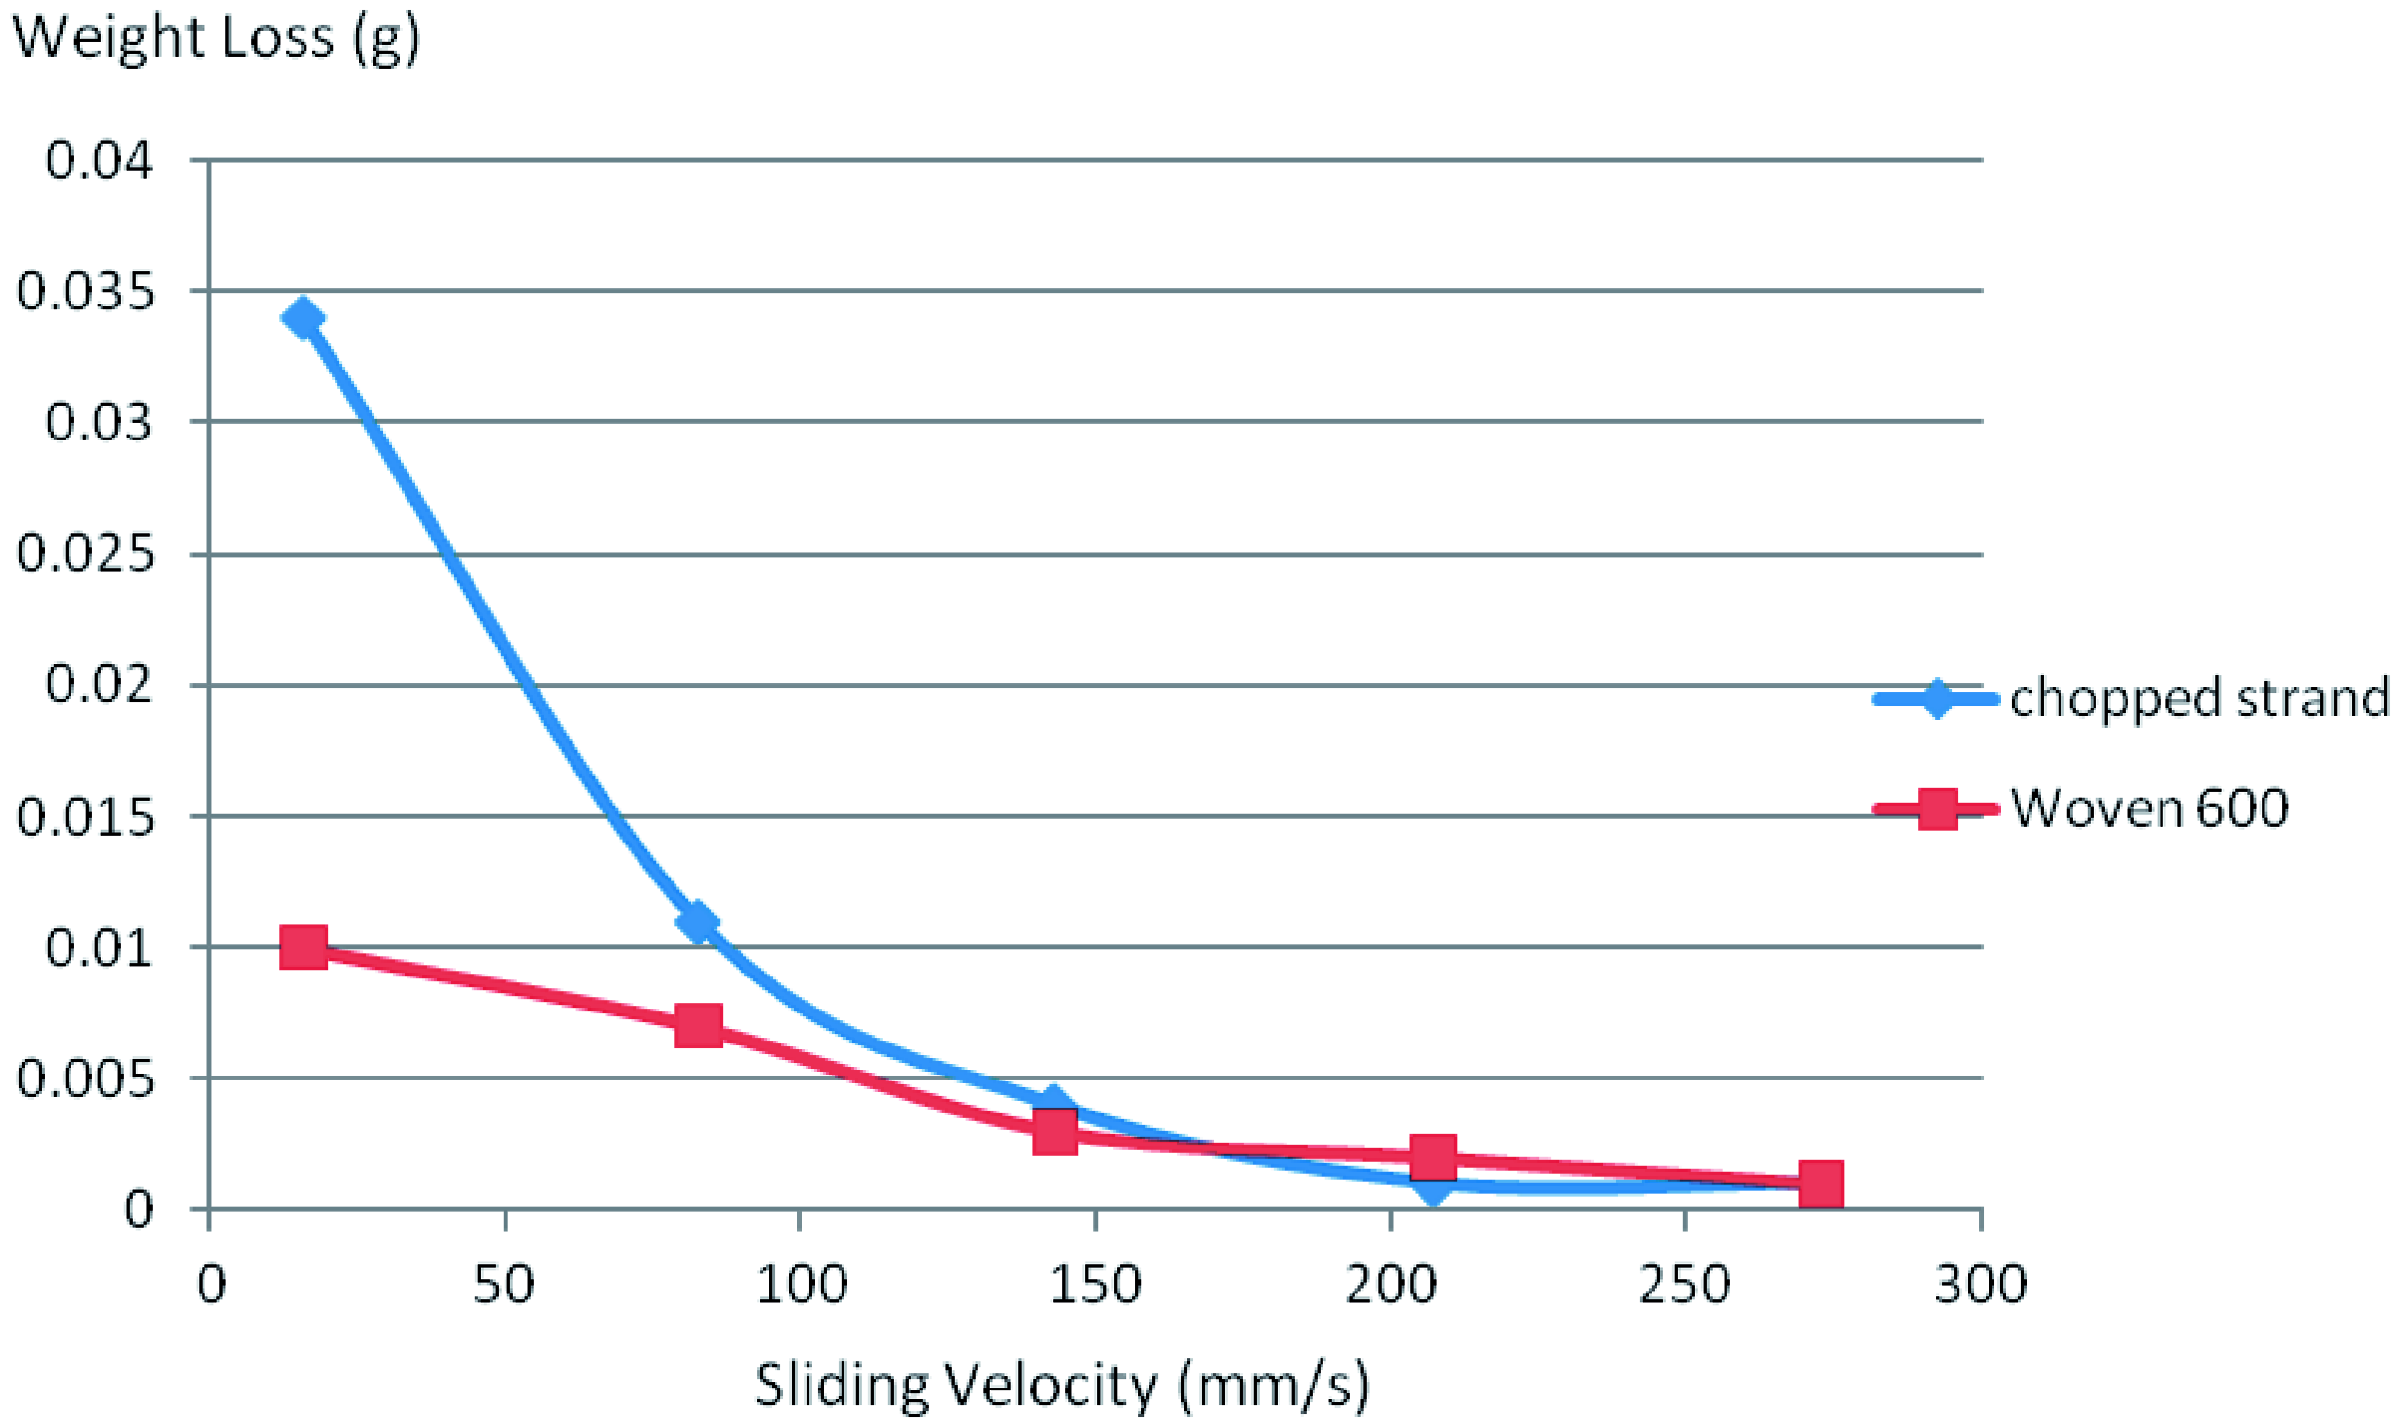
The results of the tribology experiment show that in general, chopped strand specimens wear at a much higher rate compared to woven 600 specimens. Sliding velocity has a negative effect on the wear mass of both chopped strand and woven 600 specimens. Increase of load has a negative effect on the wear mass of the chopped strand specimens. However, a little known effect occurs in woven 600 specimens.
Assumption has been made in the earlier stage of investigation, that adhesive wear might occur, regarding the smooth surface of the specimens and the wear plate. A slight difference in the surface roughness values of both surfaces is likely to cause adhesive wear.
The results obtained from the readings indicate a negative value of wear (weight of the specimen increase), which strongly suggests that adhesive bonding occurs between the surface of the specimen and the worn debris from the plate. The fluctuating value of mass loss also suggests that at some point, the debris contacts the wear plate surface, and at the other points the debris will contact the surface of the specimen.
EFFECT OF LOAD
Effect of load to the wear mass is unlikely to occur, as the friction will increase when the load is increased. However, the worn mass debris that was accumulated acts as a thin film layer between the wear plate surface and the specimen contact area. This layer of debris that stuck to the ware plate surface will eventually act like a lubricant to the interacting surface, resulting in three-body contact wear. When this happens, the friction energy acting on those surfaces will decrease, and finally, it will decrease the wear rate of the contacted surfaces.
EFFECT OF SLIDING VELOCITY
The negative effect of the sliding velocity is also shown, which can be caused several problems. With increasing velocity, the friction of the interacting surface of the wear plate and the specimen will eventually decrease. The decreasing friction force acting between the surfaces will affect the possible contact that will be strong enough to adhesively or abrasively wear the surface’s particles. Moreover, increasing velocity creates an increase in vibration and chattering on both surfaces, which will eventually lessen the frequency of contact between both surfaces. However, the chattering problem can be overcome by increasing the normal load.
FORMATION OF THIN LAYER FILM
The thin film-like layer formed at the surface of the wear plate causes problems in determining the exact theoretical wear between the surfaces. This layer will act as the lubricant, which creates a three-body contact wear to the system, as shown in Figure 7. This will cause a severe negative effect of load and sliding velocity on the system. The loose particle from this layer, somehow, will stick back to the specimen surface, giving a negative wear in some reading.
The formation of thin layer of debris at wear plate.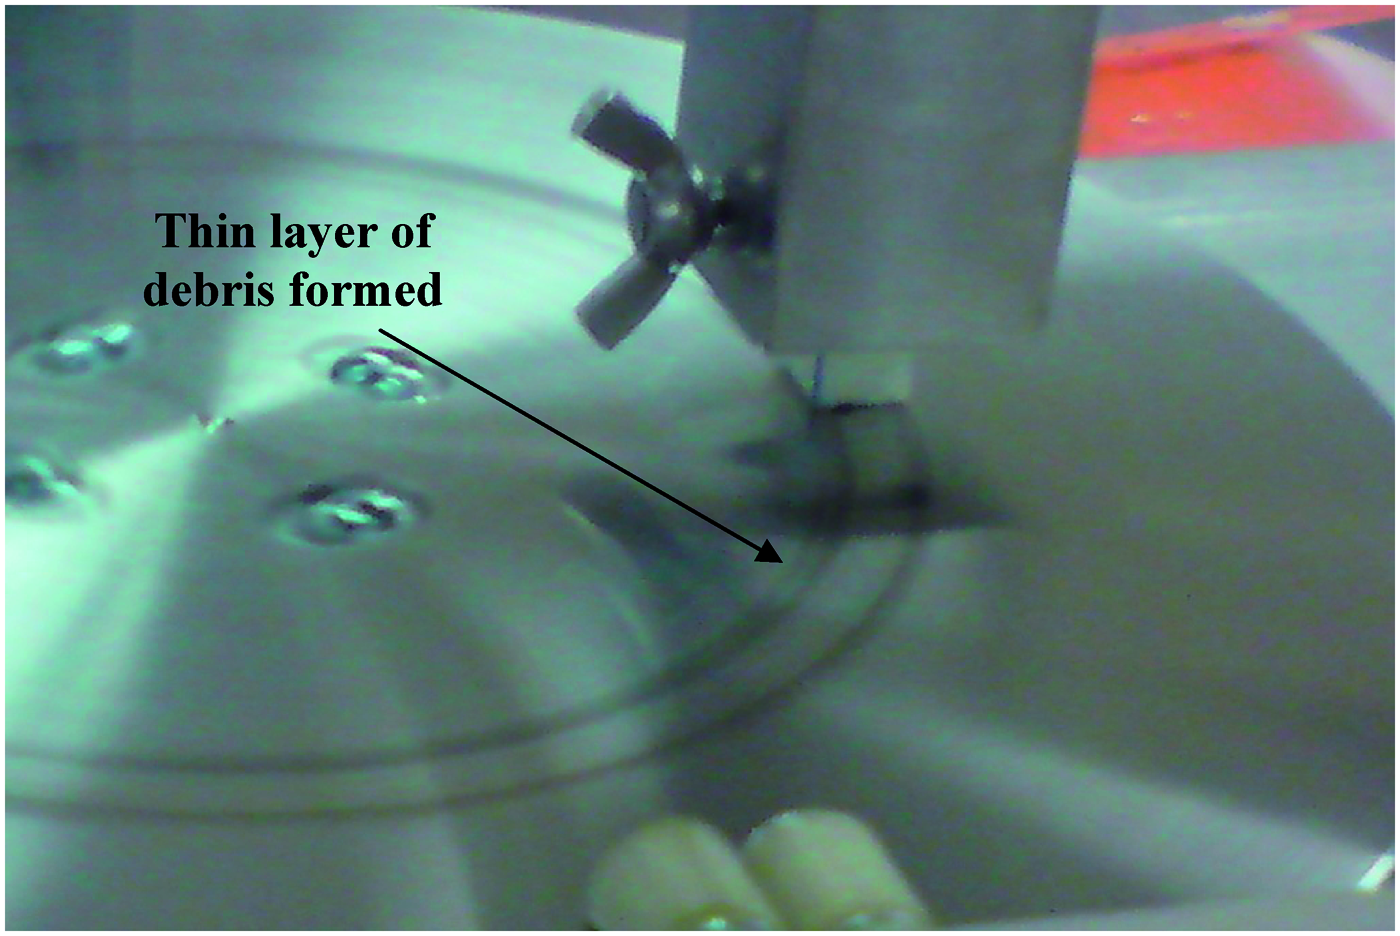
EFFECT OF HARDNESS OF THE SURFACE
From previous findings, we find that woven 600 is harder than chopped strand specimens. A basic understanding of hardness and surface wear suggests that the harder surface will have less wear. From the result of tribology test, it is seen that the concept is somehow applicable to the wear of E-GFRE composite. However, a more reasonable suggestion is applicable to explain why chopped strands wear more.
EFFECT OF THE FIBER ORIENTATION AND FIBER DENSITY
A more reasonable suggestion on the difference in wear rate of the E-GFRE composite is likely to relate to the directions and density of fiber content in the composition. Unlike metals and some harder materials, E-GFRE composite has properties resembling polymers, as the fiber is a reinforced plastic and the polymer matrix is used as binder.
Theoretically, the wear in epoxy is more than the glass fibers, as epoxy has lower internal adhesive properties than glass fibers, and it tends to lose debris. This debris then will form a thin layer, which eventually creates a three-body abrasive [13–17].
In chopped strand specimens, the random directional fibers are comprehensively dependent on the strength of the binder to stay in shape and exert loads, due to short-non-continuous structure of the fibers in random directions. This makes chopped strand composite less dense in fiber and more on the epoxy. Woven 600, on the other hand, has woven, long, and continuous fibers that are uniformly arranged. These make woven 600 composite denser in fibers and less in epoxy.
When wear occurs, epoxy is likely to wear than fibers. Chopped strand accordingly wear more as the result of random orientation of fibers and epoxy composition. Woven 600, on the other hand, will wear less as the fiber content is more than the chopped strand.
WEAR EFFECT TO SURFACE MICROSTRUCTURE
Comparison of surface roughness before and after the test
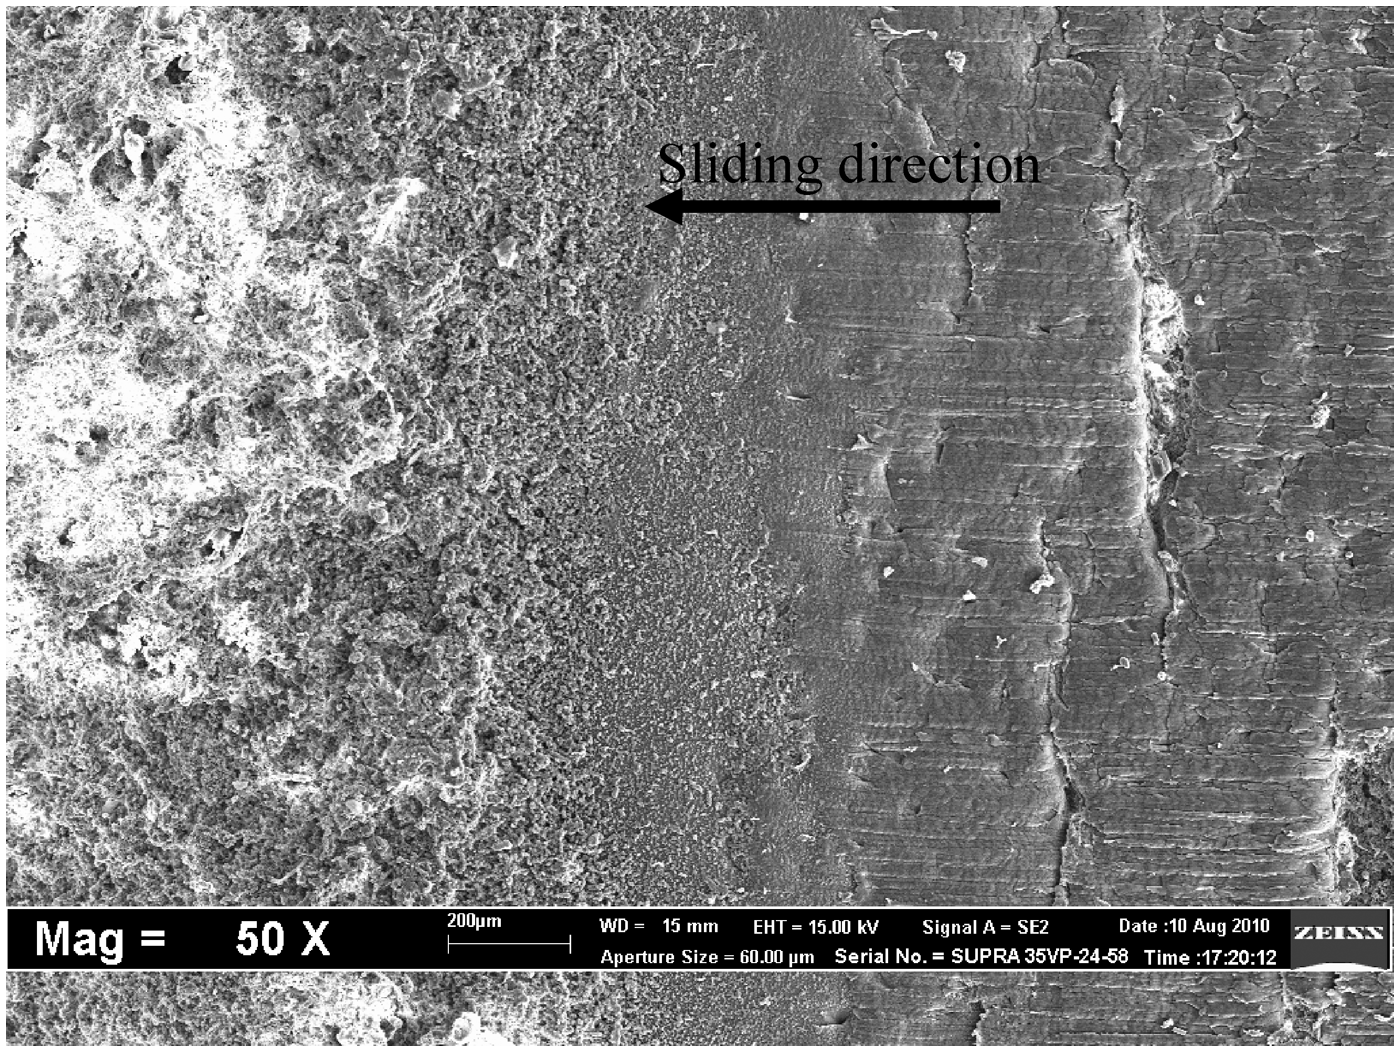
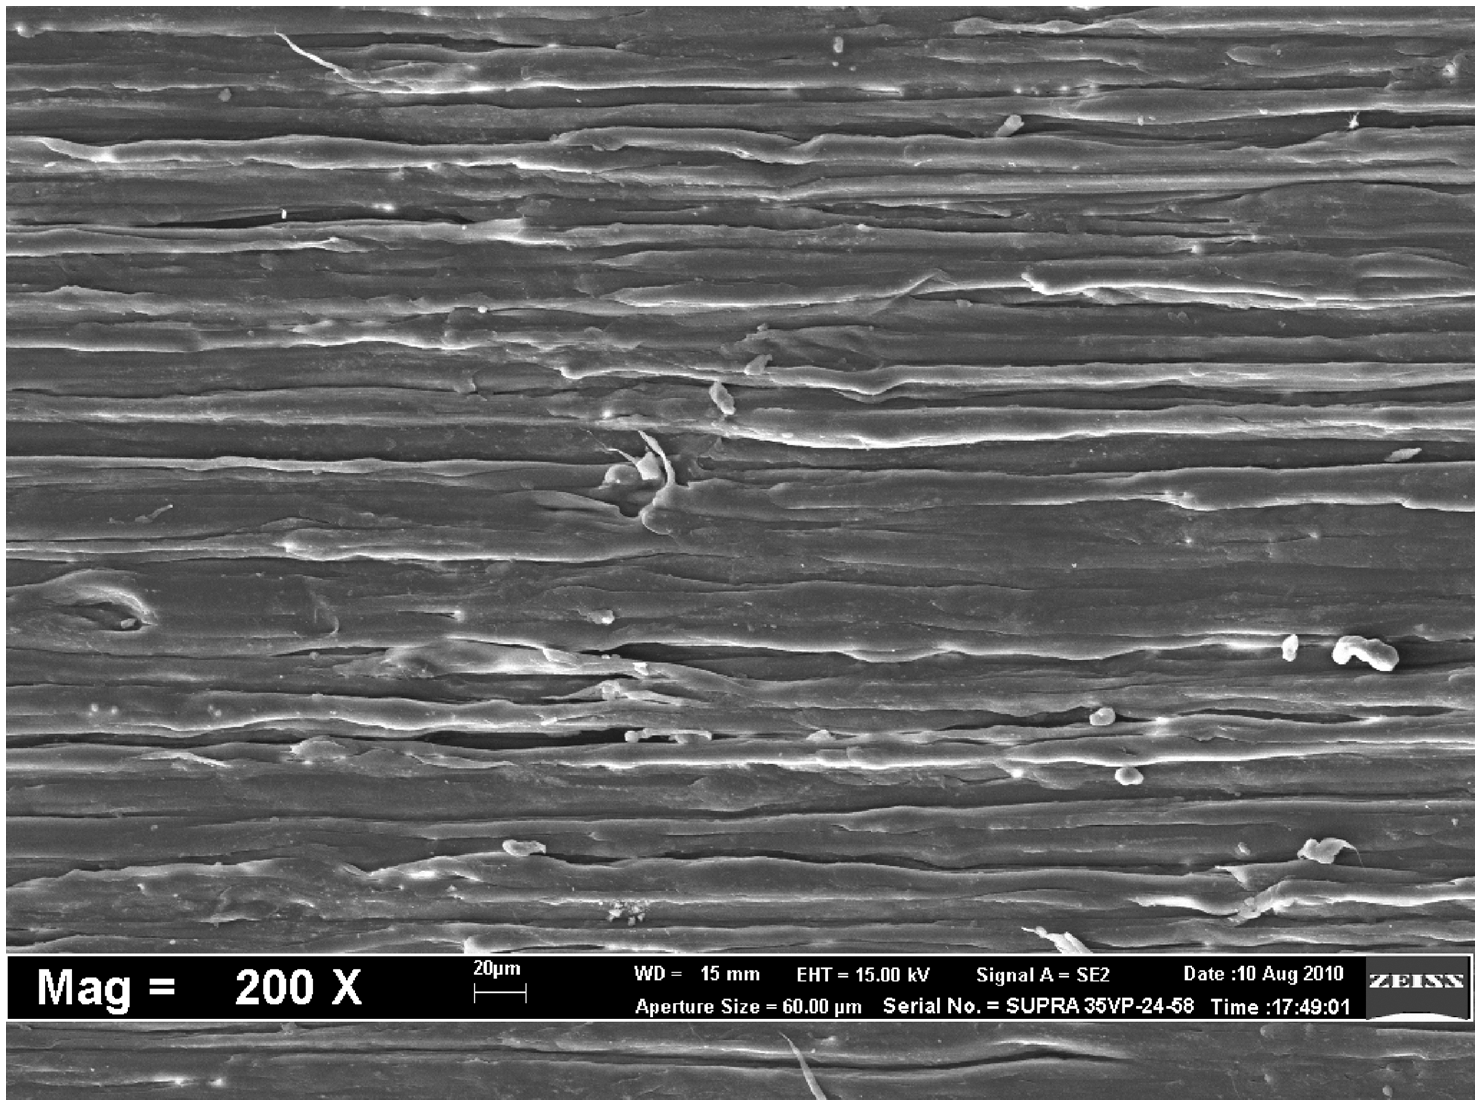
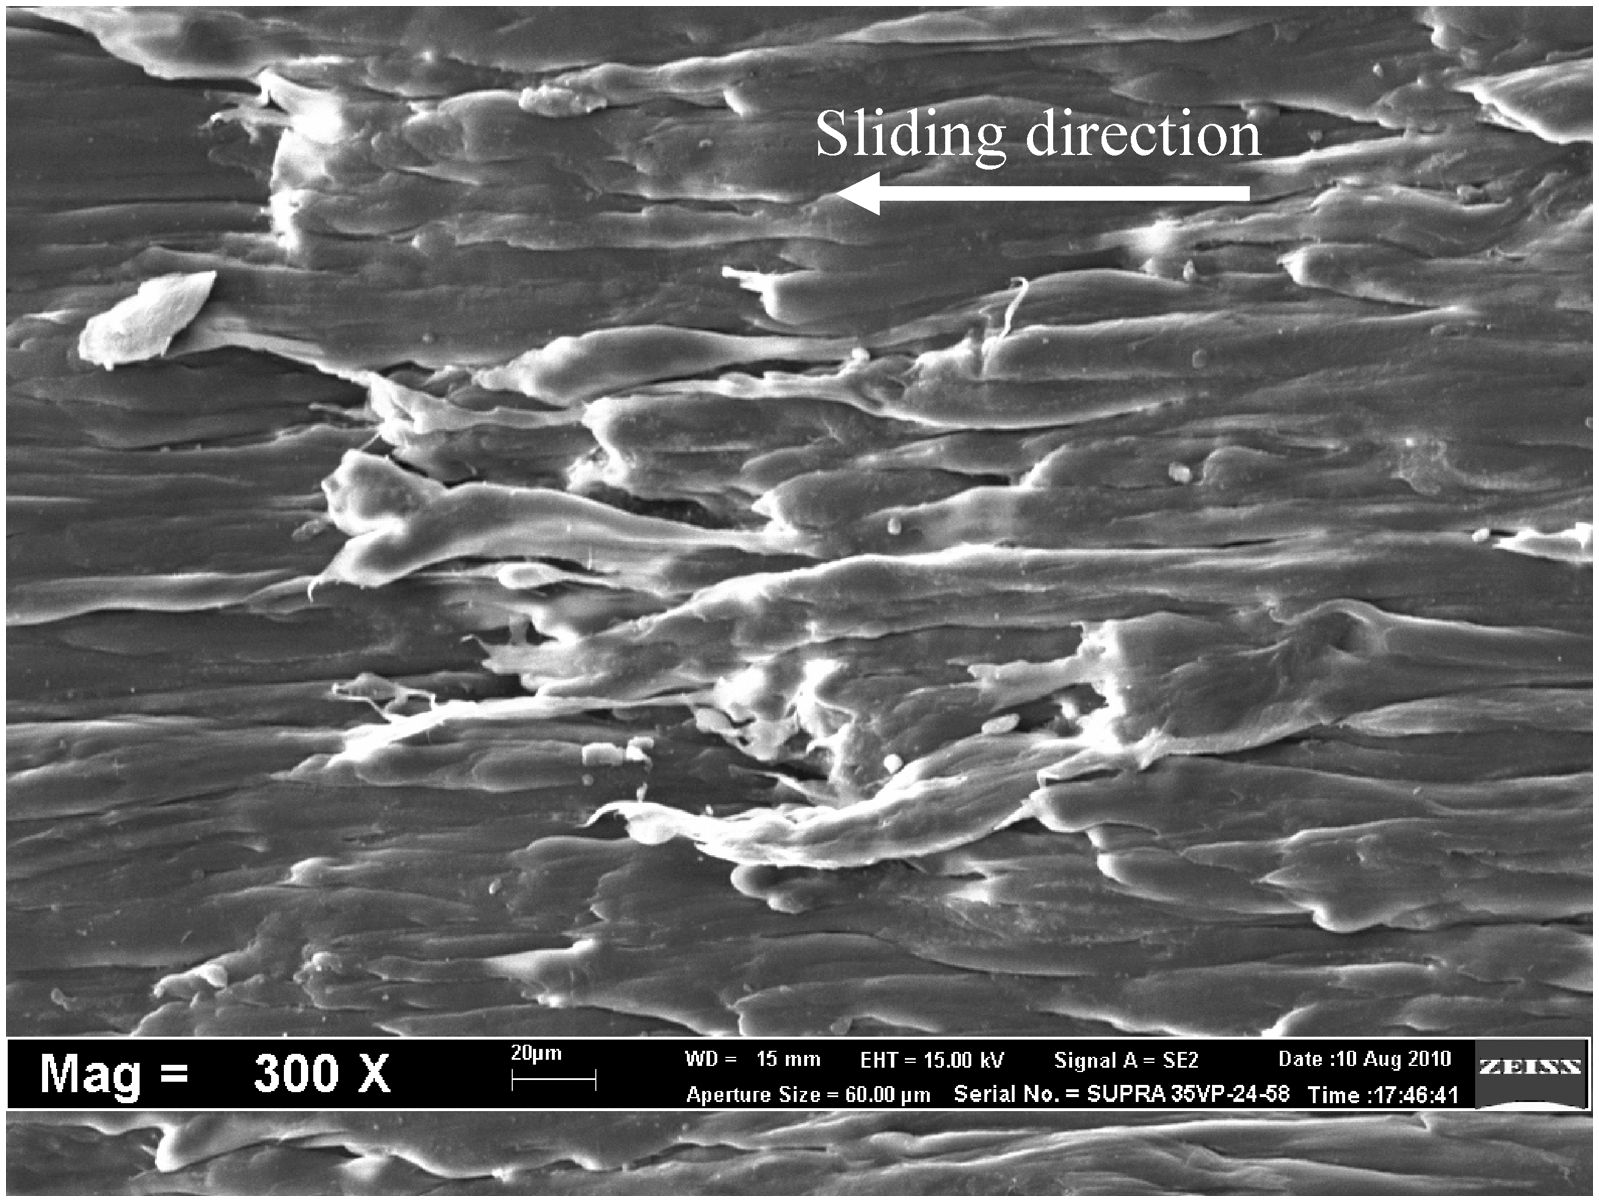
The microstructure of the surfaces before and after the wear is shown in Figures 8–11.
SEM micrograph of chopped strand specimen surface before the test. SEM micrograph of chopped strand specimen surface after the test. SEM micrograph of woven 600 specimen surface before the test. SEM micrograph of woven 600 specimen surface after the test.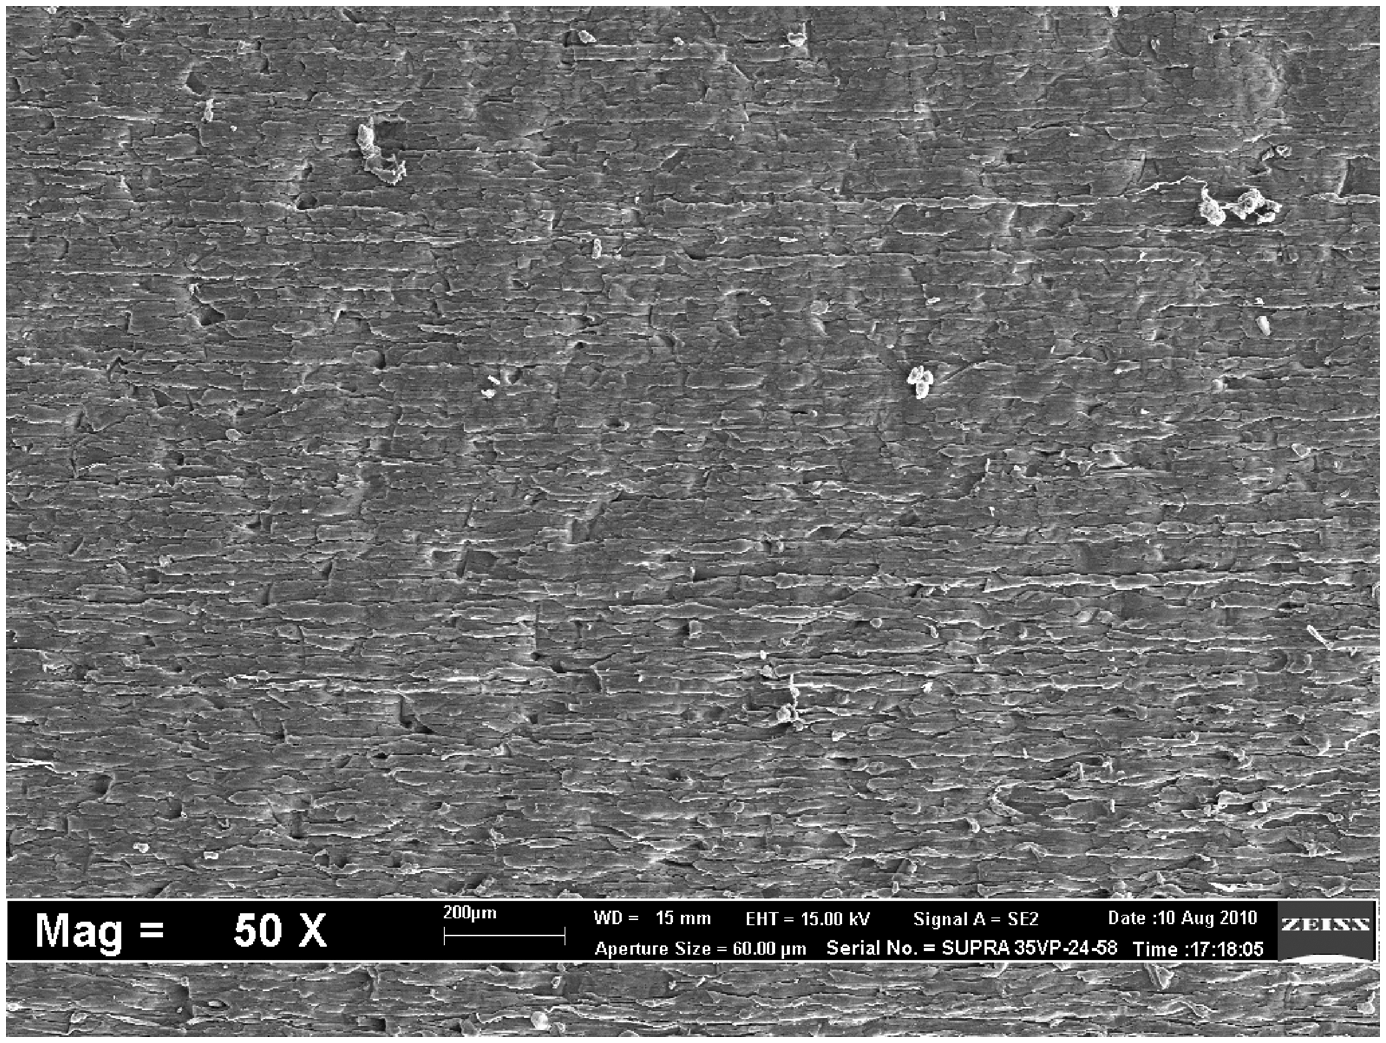
CONCLUSION
The wear properties of E-GFRE composite are mainly the effect of fiber directions and the composition of fibers and epoxy. Fiber directions are universally known as the key to the strength of glass fiber composite and the same orientation affects the wear properties of the composite.
The fiber directions help us to distinguish the properties of two commonly used types of glass fiber composites, woven and chopped strand. Tribology test has found the behavior of glass fiber acting on smooth surfaces as adhesion wear. Thus, the rotating disc method with debris is unquestionably the best method for predicting the adhesion wear of glass fiber composite.
This article concludes with the description of the wear behavior of glass fiber by the effect of sliding velocity and load, as it negatively affects the wear of E-GFRE composite. Finally, direction and fiber composition of E-GFRE have a positive effect on the wear behavior, as uniform, continuous woven fibers with a higher density of fibers in composition have better wear resistance than randomly oriented, short-non-continuous fibers of chopped strand composite.
Footnotes
ACKNOWLEDGMENT
This study was supported by the Fundamental Research Grant Scheme [203/PMEKANIK/6071192] under Kementerian Pengajian Tinggi, Malaysia.