
Abstract
This article is focused on the behavior of the high strength concrete continuous beam strengthened with carbon fiber-reinforced polymer (CFRP) sheet with different CFRP sheet lengths. Three full-scale continuous beams are analyzed under two points load, and the data of analysis are compared with the experimental data provided by other researchers. ANSYS V.11 program is used in finite element analysis, and the results obtained from analysis give good agreement with experimental data with respect to load–deflection curve, ultimate strength, and the crack patterns. The length of CFRP sheet is changed in the negative and positive regions. The results showed that the ultimate strength of the beam was reached when the value of Lsheet/Lspan reaches 1.0, and when the value decreases, the ultimate strength of beam also decreases a little (1.4%), but when it decreases less than 0.6, the ultimate strength also decreases a lot (15%).
INTRODUCTION
In the past decade, carbon fiber-reinforced polymer (CFRP) composite materials have been increasingly employed in the construction industry, mainly in applications dealing with structural strengthening and repair. They are ideally suited for this purpose, due to a combination of very high stiffness-to-weight and strength-to-weight ratios and an excellent durability in aggressive environments. Indeed, it has been shown, both analytically and experimentally, that the addition of externally bonded FRP composites significantly improves the performance of a structural member, namely its stiffness, load-carrying capacity, durability, and fatigue behavior under cyclic load.
Several studies were conducted on the behavior of a continuous beam. Although many in situ reinforced concrete (RC) beams are of continuous construction, there has been very little research into the behavior of such beams with external reinforcement [1–4]. In addition, most design guidelines [5,6] were developed for simply supported beams with external fiber-reinforced polymer laminates. Ashour et al. and El-Refaie et al. found out that increasing the CFRP sheet length to cover the entire hogging or sagging zones did not prevent the premature failure; further research into the performance of end anchorage techniques is necessary to minimize the risk of this mode of failure. Also, they suggested that, strengthening both the top surface at central support and beam soffit is the most effective arrangement of the CFRP laminates to enhance the beam load capacity [7,8]. Many studies focused on the durability of the CFRP [9]. Also, some researchers study the strengthening of columns using CFRP laminate [10,11]. When Akbarzadeh and Maghsoudi tested six continuous beams, test results showed that with increasing number of CFRP sheet layers, the ultimate strength increases, while the ductility, moment redistribution, and ultimate strain of CFRP sheet decrease. Also, new parameters of equivalent stress block were obtained for flexural calculation of reinforced high strength concrete (RHSC) beams. Good agreement between experiment and prediction values was achieved [12]. Up to now, this article mainly focused on the behavior of continuous beam externally strengthened with CFRP sheet using finite element (FE) method, and the study of the effect of Lsheet/Lspan for negative and positive regions.
NUMERICAL WORK
FE Model
In this study, general purpose FE program (ANSYS V11.0) was used to model the continuous beam. Three element types were used to build the 3D model, as listed in the following sections.
BRICK ELEMENT (SOLID65 AS DENOTED IN ANSYS)
This element is used to model the concrete in 3D and RC also. The element has eight nodes with three degrees of freedom per node translation in x, y, and z directions; in addition, it possesses special cracking and crushing capabilities. The most important aspect of this element is the treatment of nonlinear material properties. The concrete is capable of cracking (in three orthogonal directions), crushing, plastic deformation, and creep. The rebars are capable of tension and compression, but not shear. They are also capable of plastic deformation and creep [13]. The geometry, node locations, and the coordinate system for this element are shown in Figure 1.
SOLID65 element [13].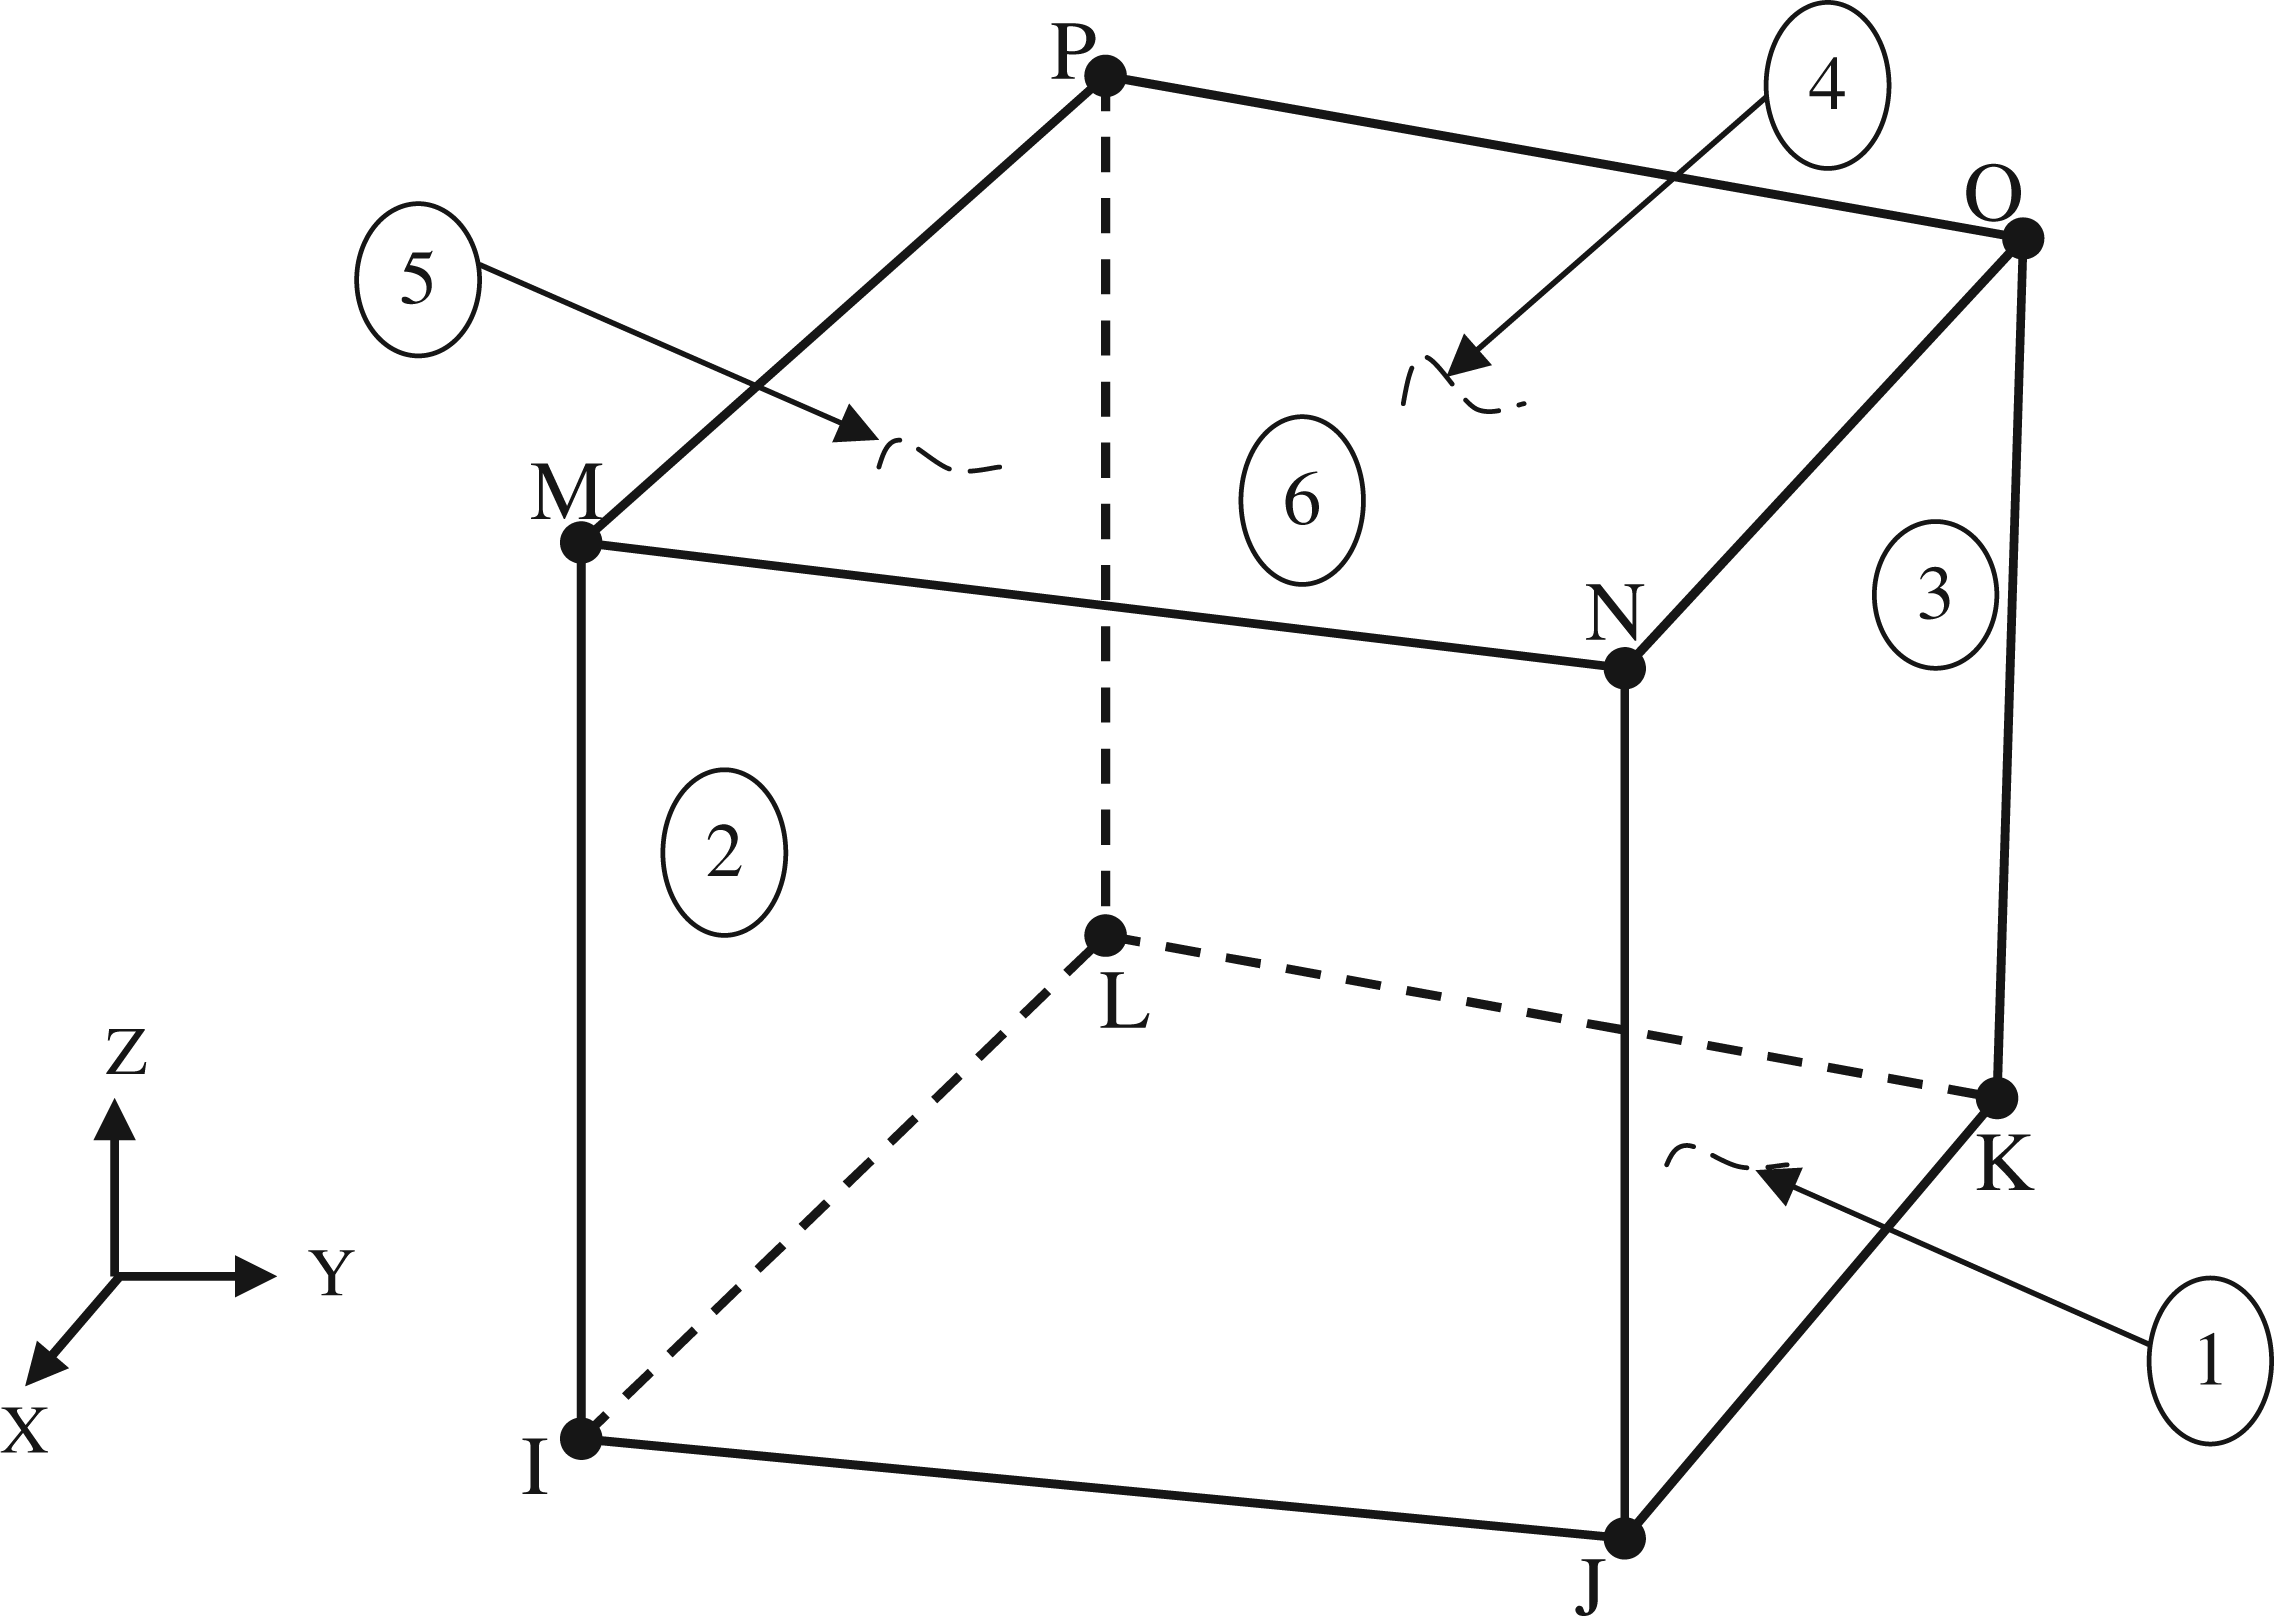
SHELL ELEMENT (SHELL41 AS DENOTED IN ANSYS)
The element is defined by four nodes, four thicknesses, a material direction angle, and the orthotropic material properties. Orthotropic material directions correspond to the element coordinate directions. The element has membrane stiffness (no bending stiffness); so, the element is used to model the CFRP laminate. The element may have variable thickness. The thickness is assumed to vary smoothly over the area of the element, with the thickness input at the four nodes. If the element has a constant thickness, only one thickness (in any node) needs to be input. If the thickness is not constant, all four thicknesses must be input (for four nodes). The geometry, nodes location, and coordinate of the element are shown in Figure 2.
SELL41 element geometry [13].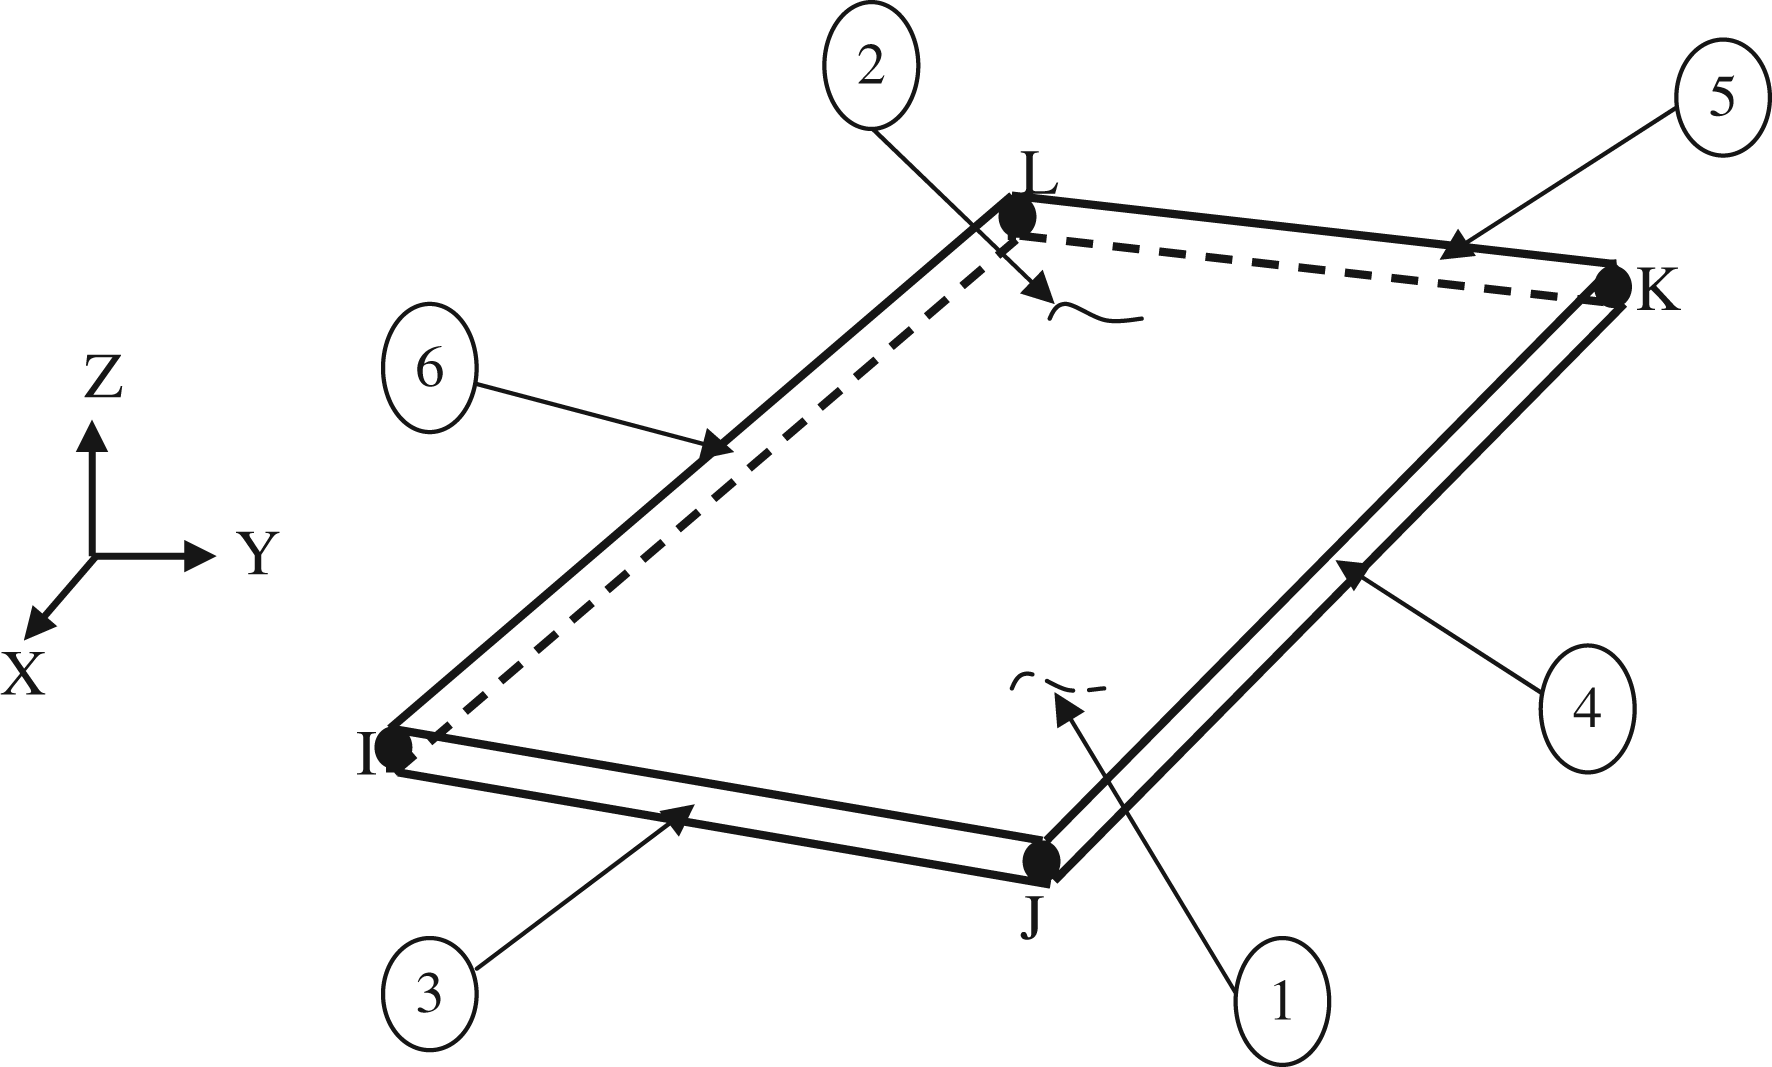
LINK ELEMENT (LINK8 AS DENOTED IN ANSYS)
This element can be used to model trusses, sagging cables, links, springs, etc. The 3D spar element is a uniaxial tension–compression element with three degrees of freedom at each node: translations in the nodal x, y, and z directions. As in a pin-jointed structure, no bending of the element is considered. Plasticity, creep, swelling, stress stiffening, and large deflection capabilities are included [13]. The element is defined by two nodes. The cross-section area, initial stress, the material properties, the element geometry, node locations, and the coordinate system for this element are shown in Figure 3.
LINK8 element geometry [13].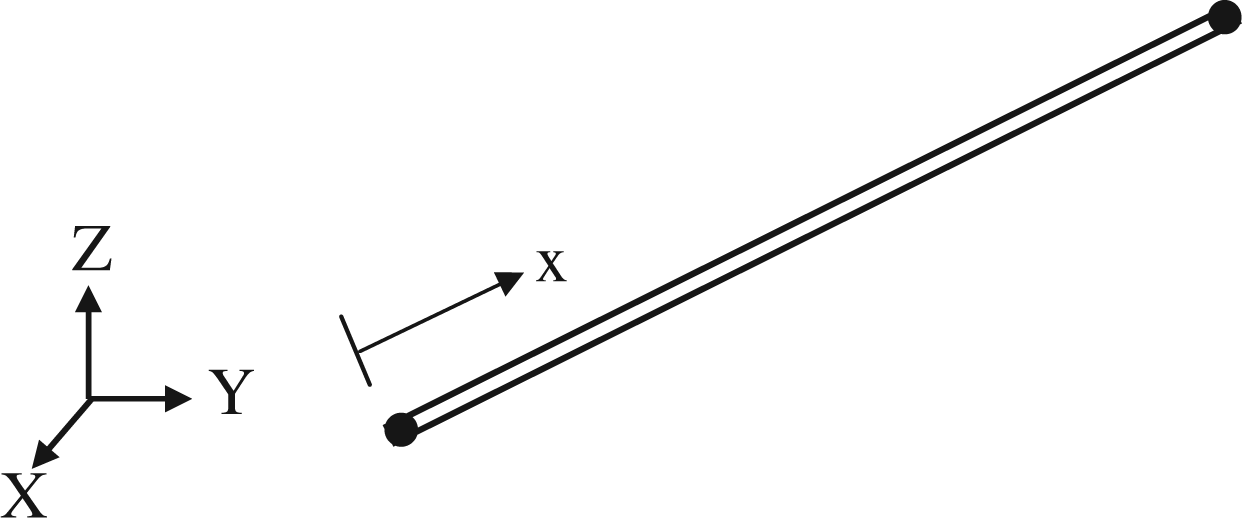
Material
The HSC used in this study is modeled using nonlinear stress–strain relationship. The nonlinear stress–strain relationship is obtained by testing five specimens as shown in Figure 4. The average curve shown was used to model the concrete in FE analysis.
Stress–strain diagram for HSC [12].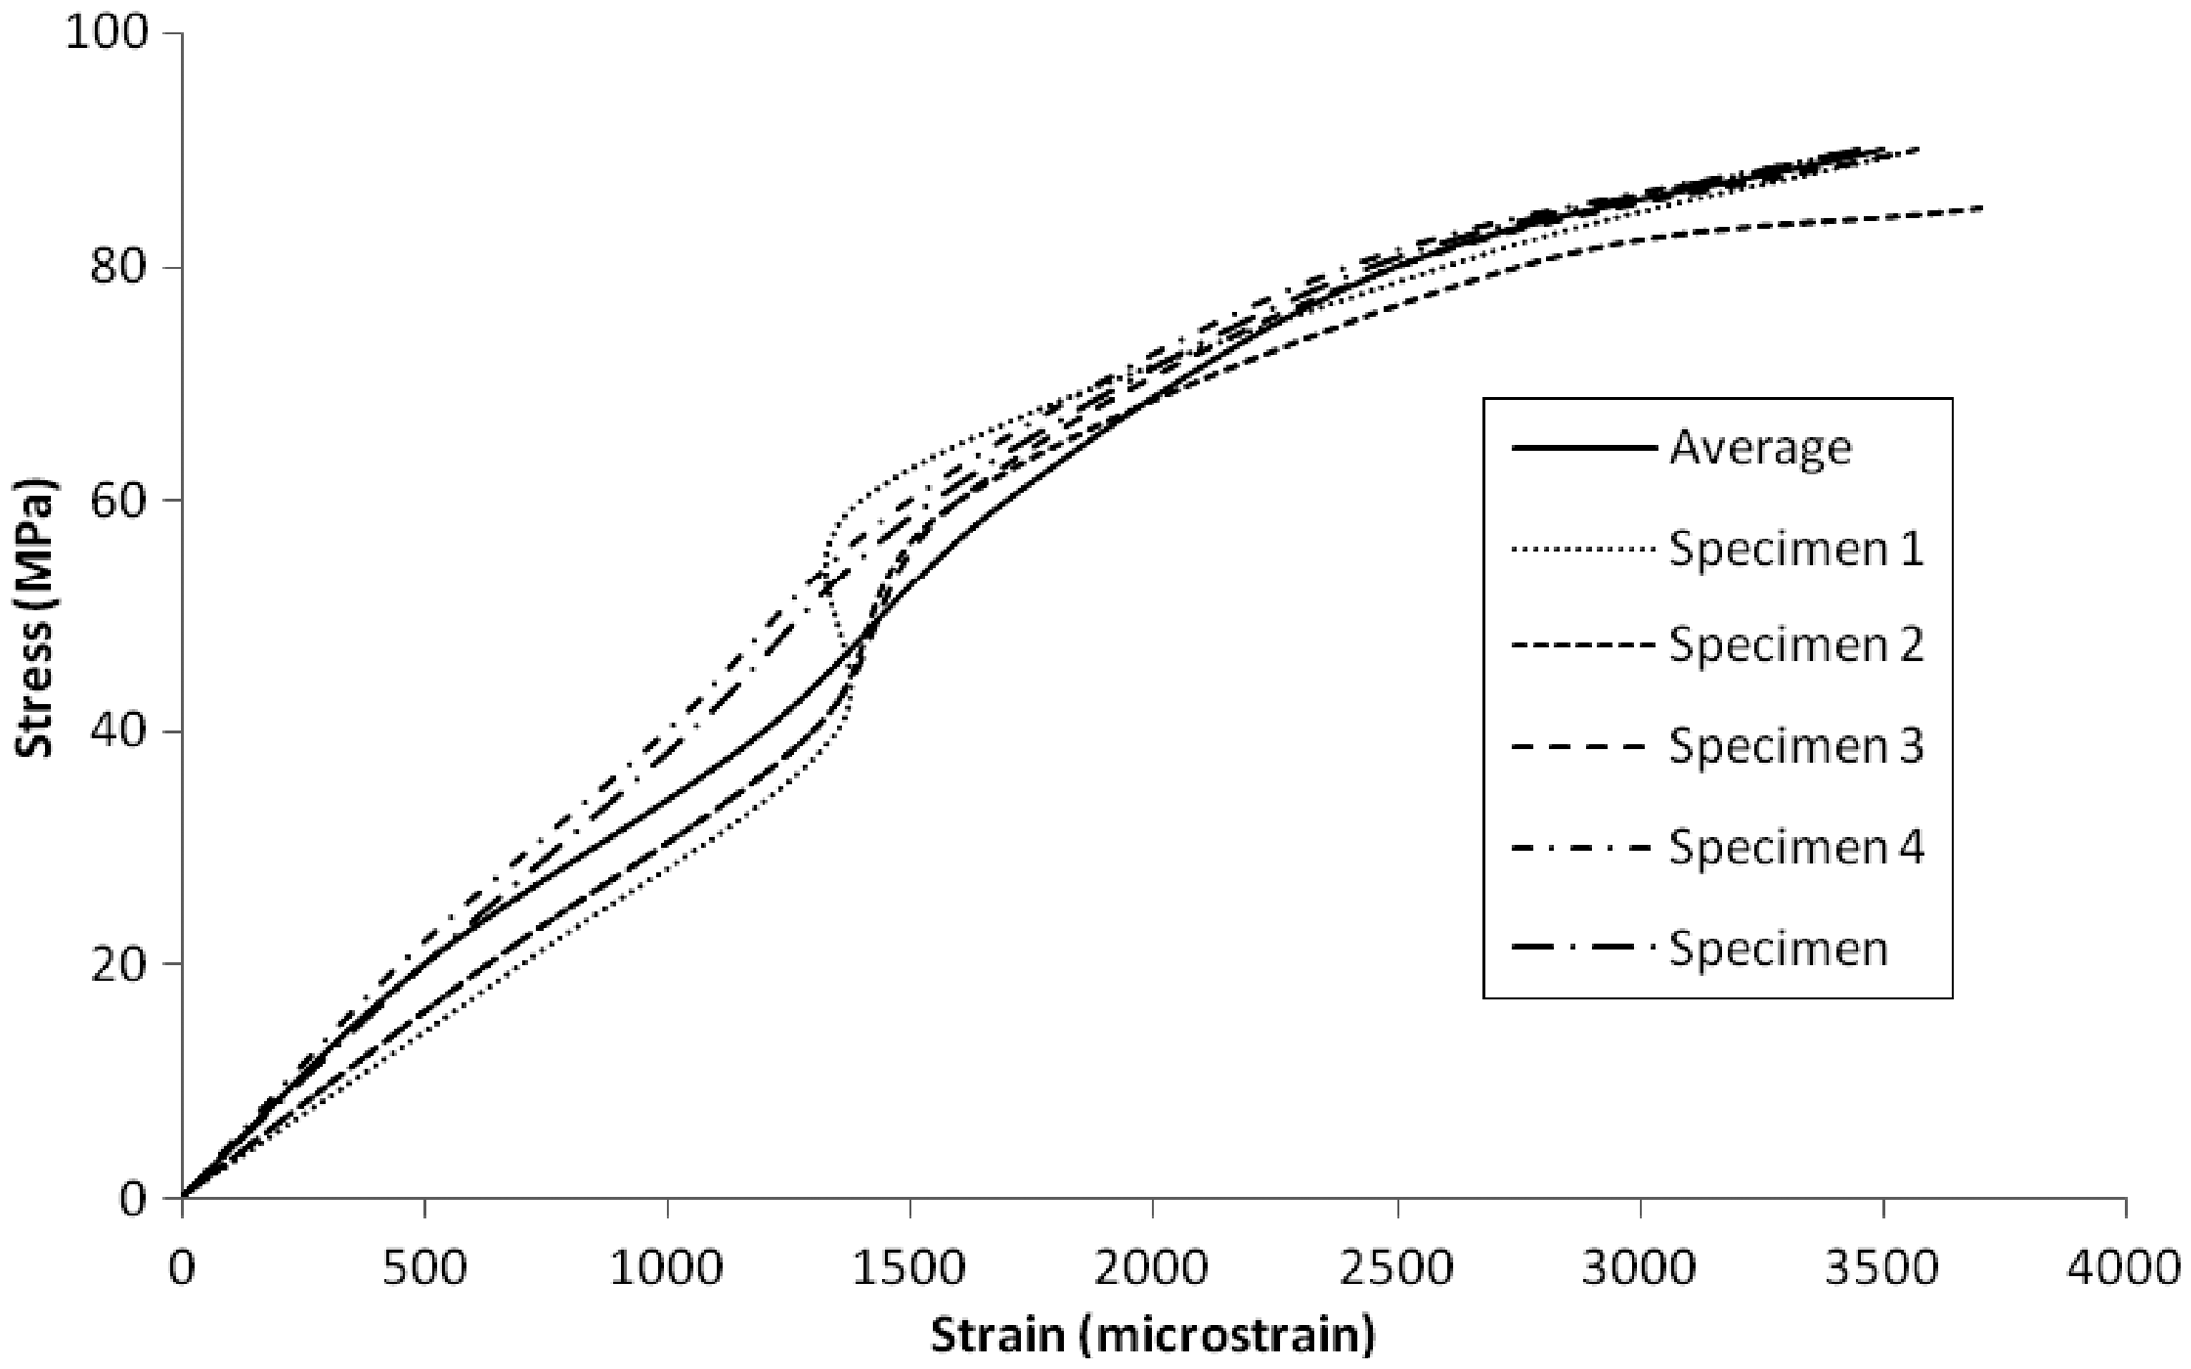
In a concrete element (SOLID65), cracking occurs when principle tensile stress lies outside of the failure surface (Figure 5). When cracking occurs, the elastic modulus of the concrete element is set to zero in the direction parallel to the principle tensile stress direction. Crushing occurs when the principle compressive stress lies outside of the failure surface. After element crushing, the elastic modulus of concrete element is set to zero in all directions.
3D-failure surface for concrete [13].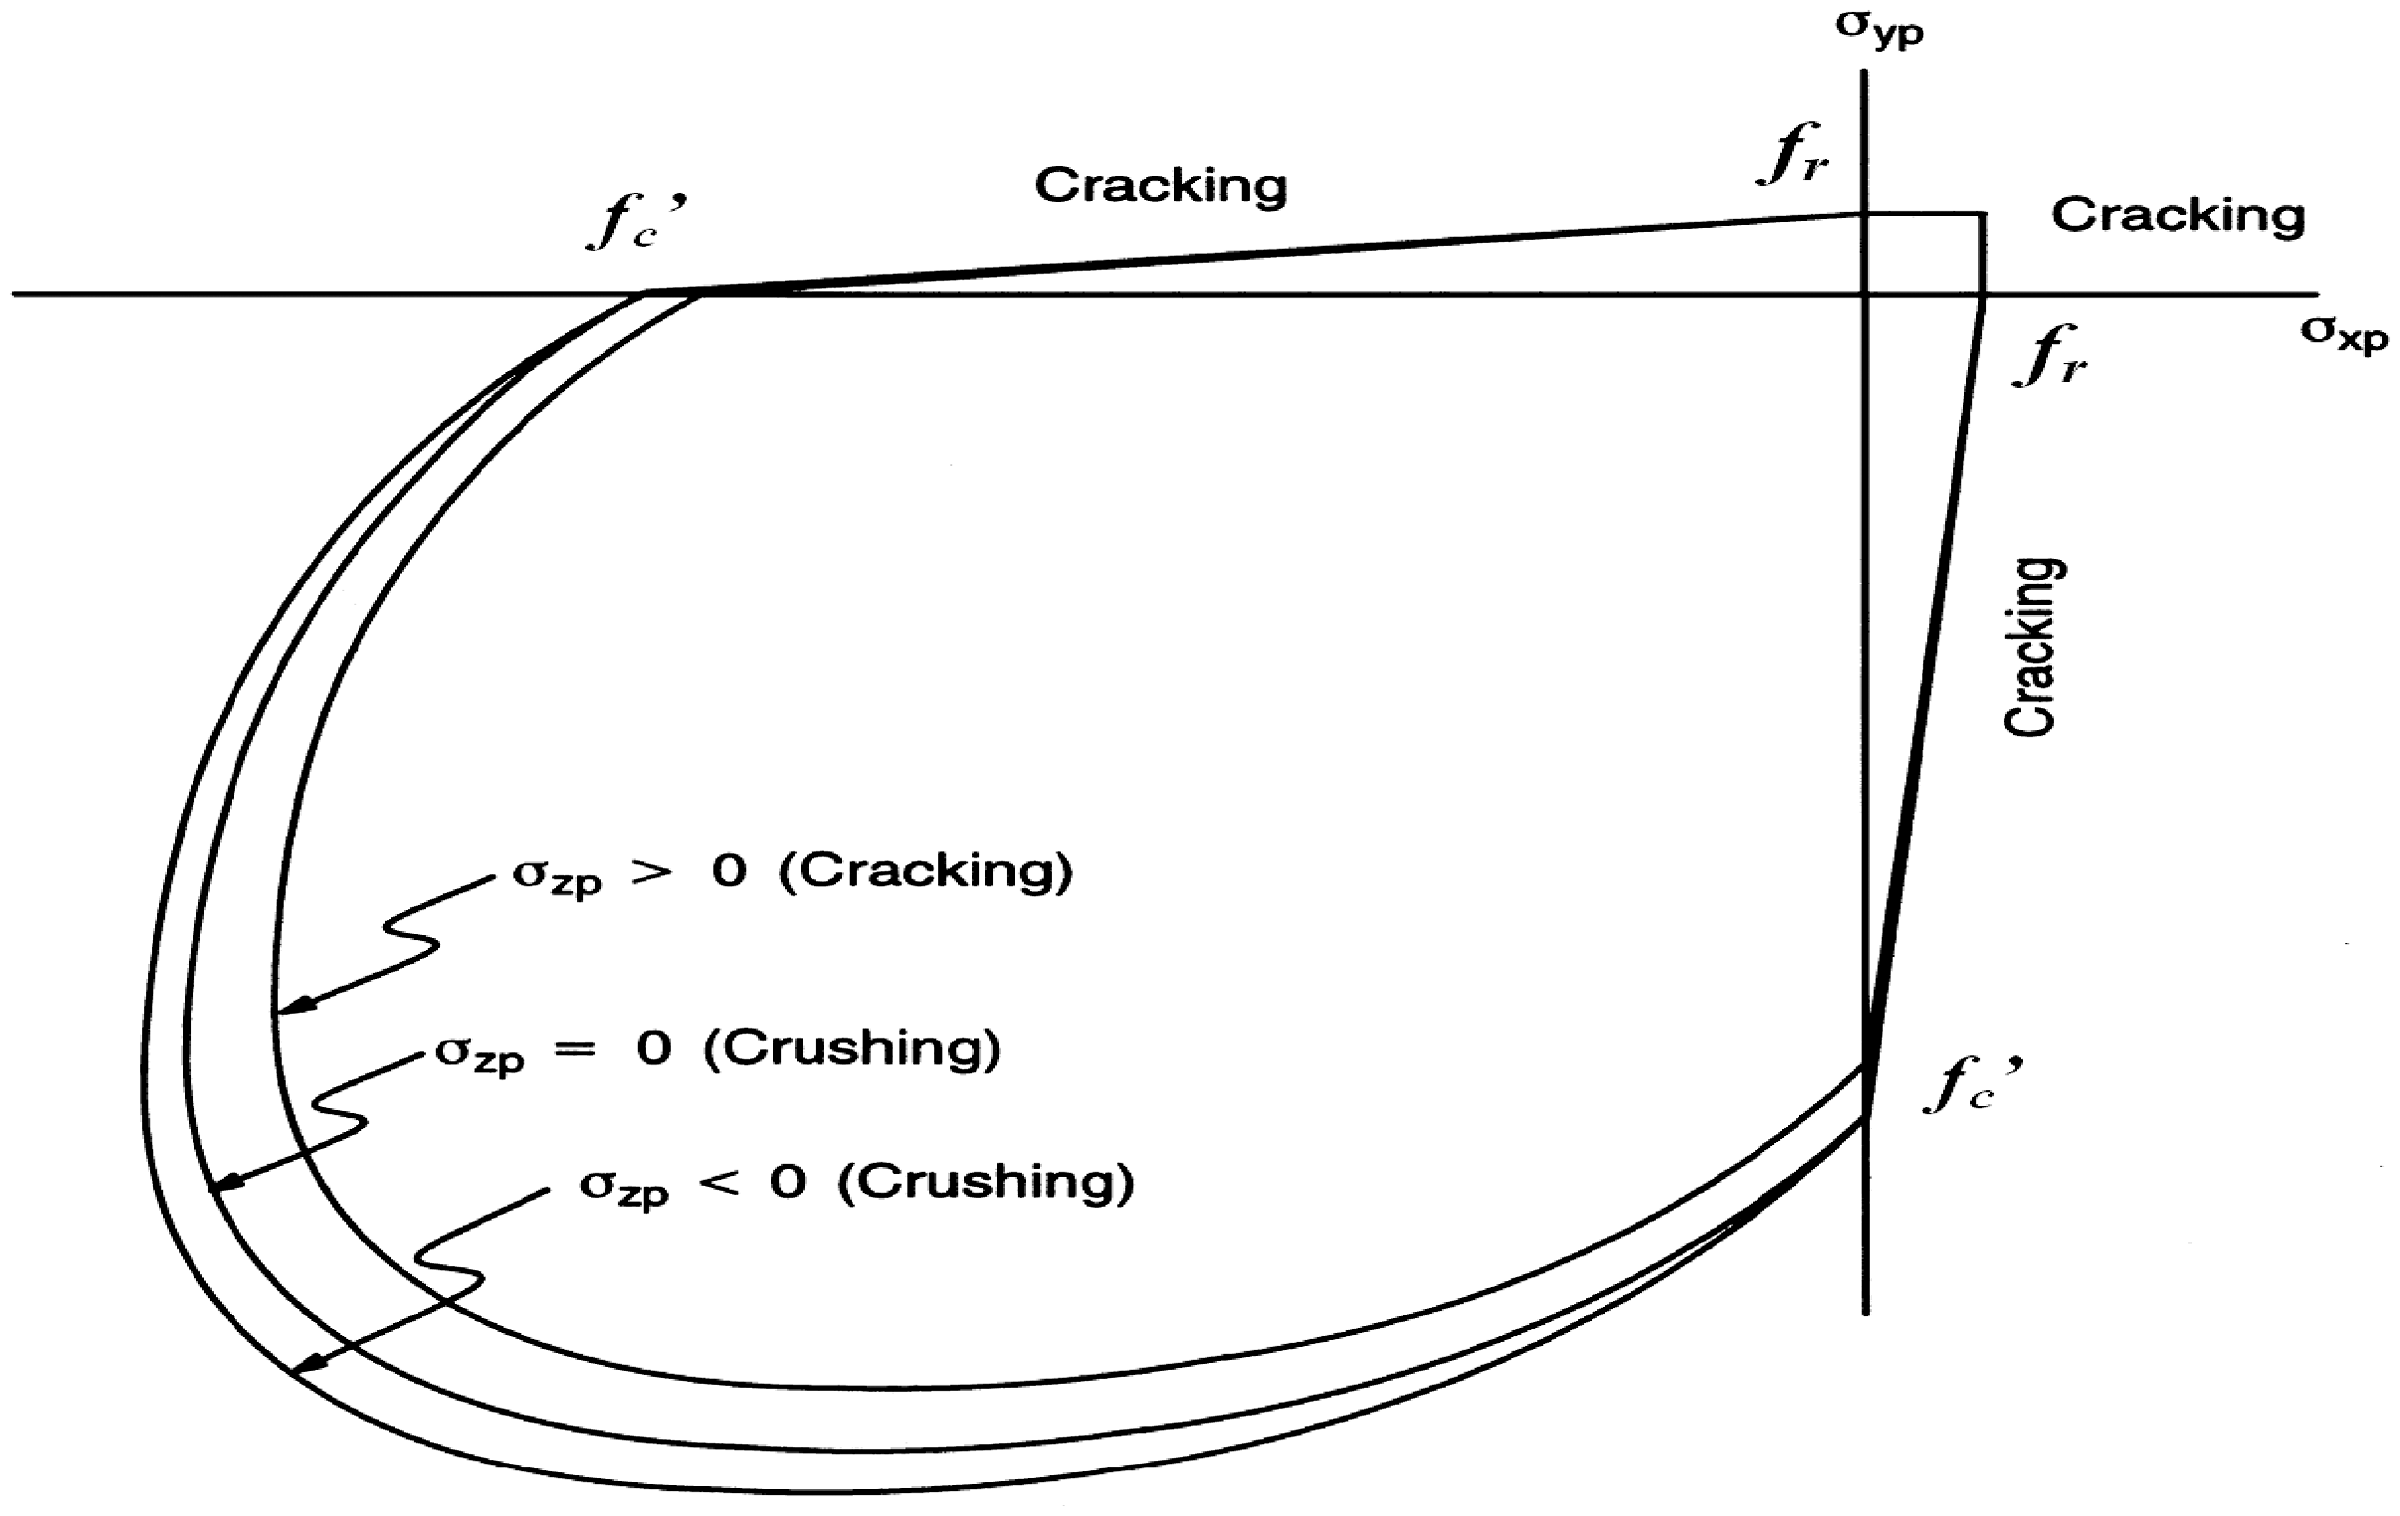
During this study, it was found that if the crushing option is turned on, the concrete elements lying under the load were crushed after several sub-steps of load, and the local stiffness of member is reduced, so that the crushing capability is turned off.
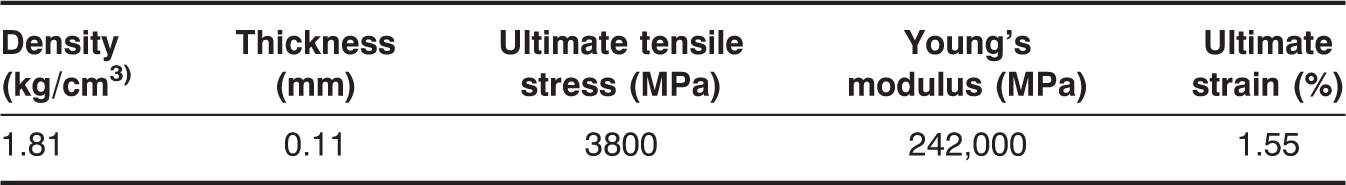
Mechanical properties of the CFRP sheets.
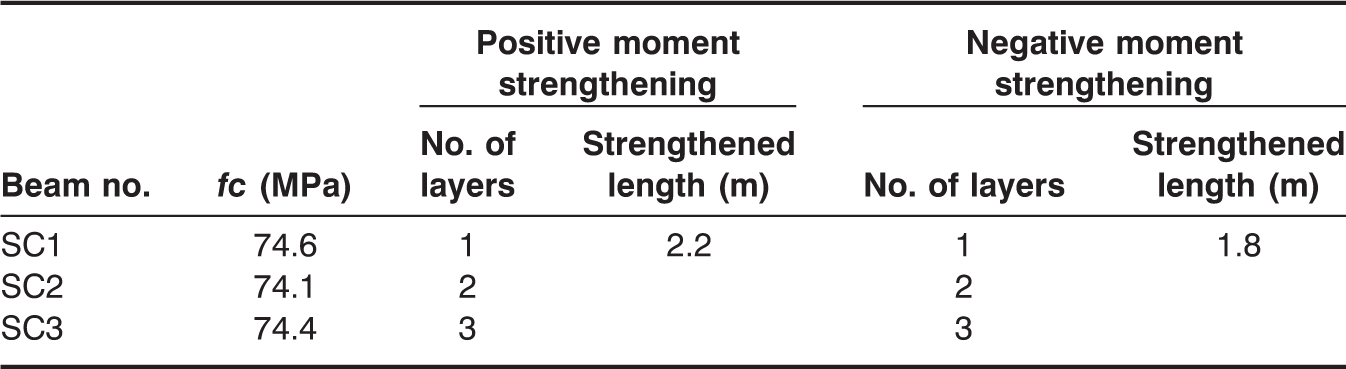
Details of the test specimens.
Continuous Beam Description
The continuous beam analysis in this study was tested by Akbarzadeh and Maghsoudi [12], three full-scale continuous beams (150 × 250 × 6000 mm3) were tested under two points load, and all the beams were strengthened by CFRP sheet in the region of tension only. The geometry, reinforced arrangement, loads, as well as support arrangements are illustrated in Figure 6.
Details of test setup and strengthened continuous RC beams [12]: (a) sagging region, (b) hogging region, and (c) longitudinal profile of beam.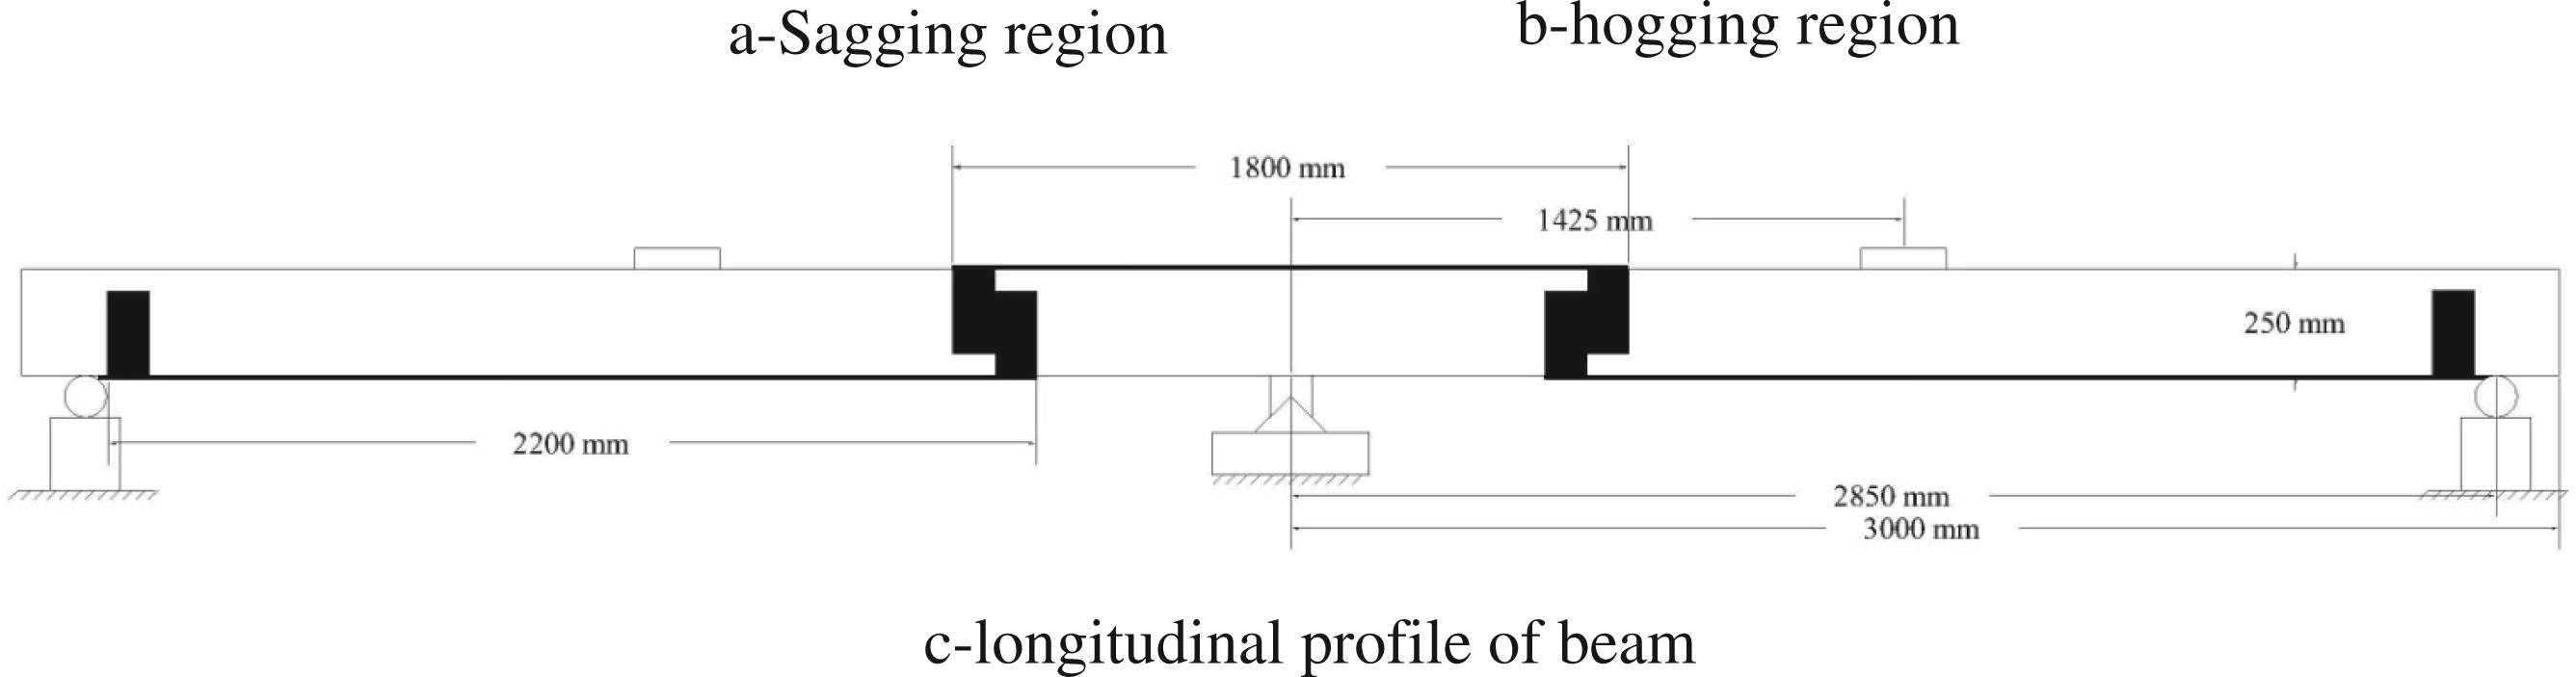
The arrangements of CFRP sheet for all beams were same in position but different in the number of layers. The CFRP sheet arrangement and number of layers for beams are shown in Figure 6 and Table 2.
RESULTS AND DISCUSSION
Validation of FE Model
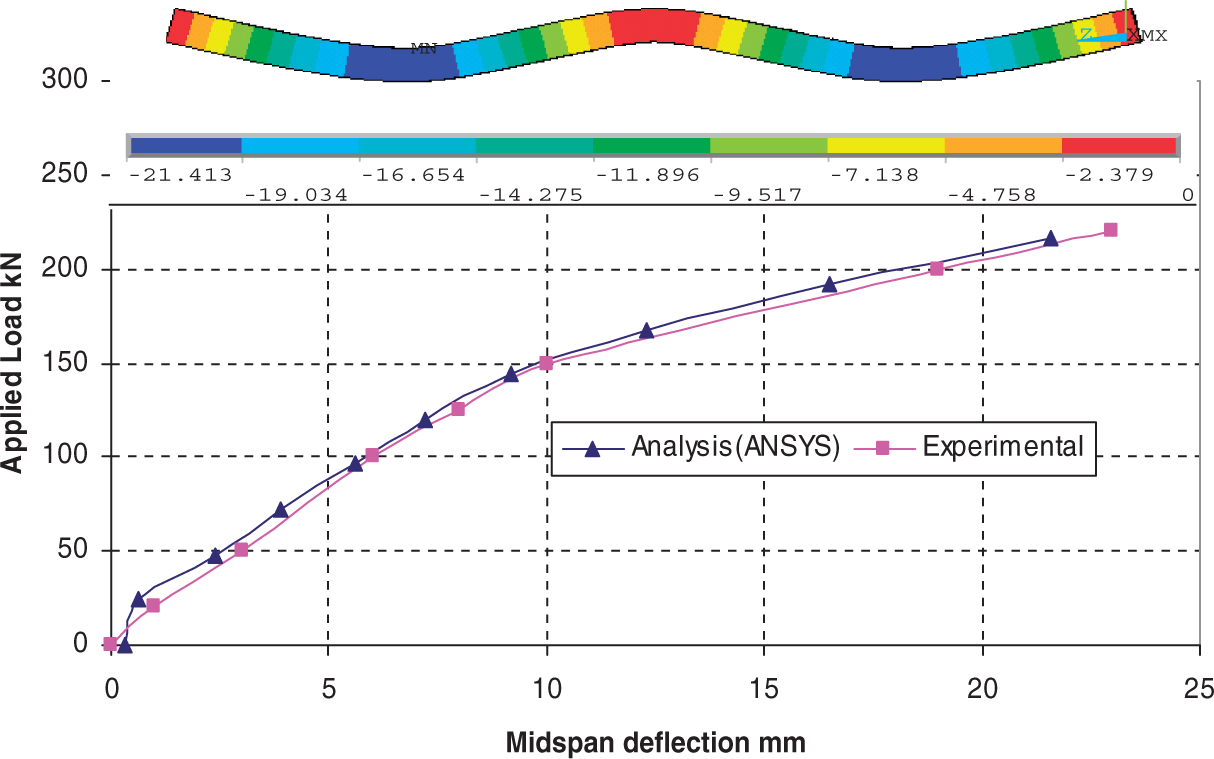
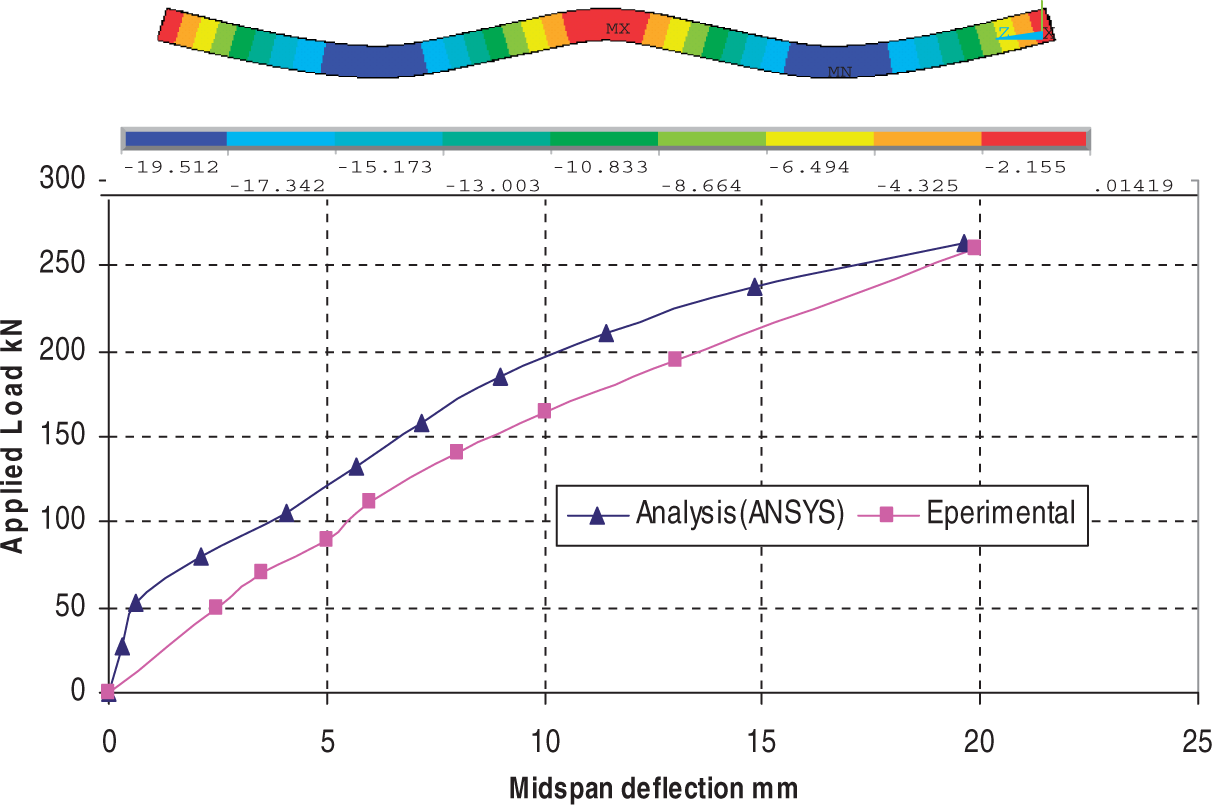
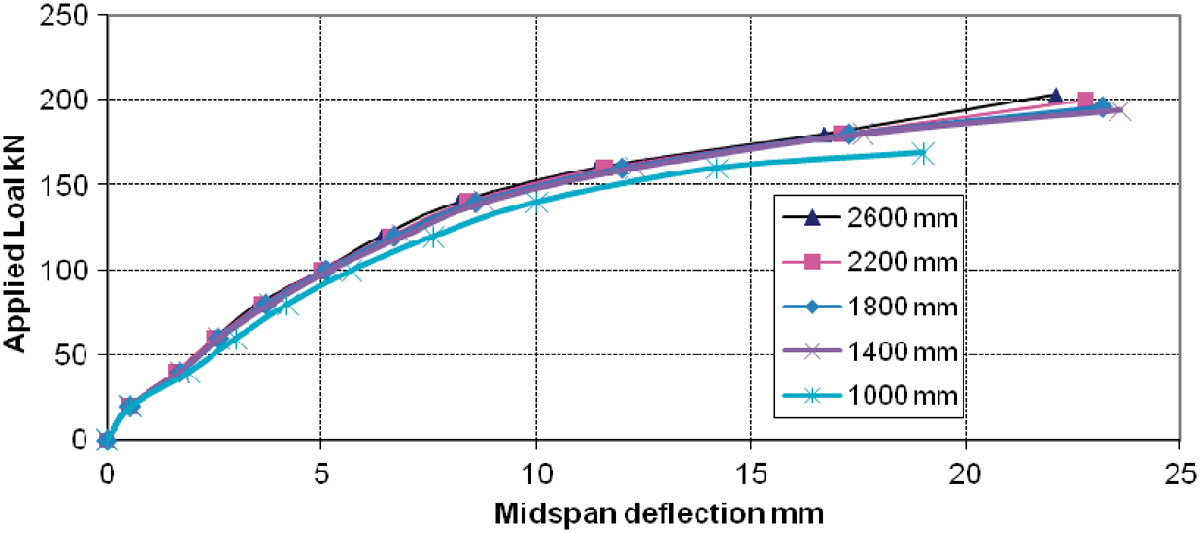
The beams described in the previous section were analyzed using the 3D nonlinear FE model investigated in this study. The applied load on the beams is divided in analysis into 40 sub-steps. The total applied load versus mid-span deflection curves of beams obtained from analytical model are in good agreement when compared with experimental load–deflection curve, as shown in Figures 7–9. Also, the deformed shape and deflection values along the beams are shown in the figures.
Load–deflection curve and deformed shape of beam SC1. Load–deflection curve and deformed shape of beam SC2. Load–deflection curve and deformed shape of beam SC3.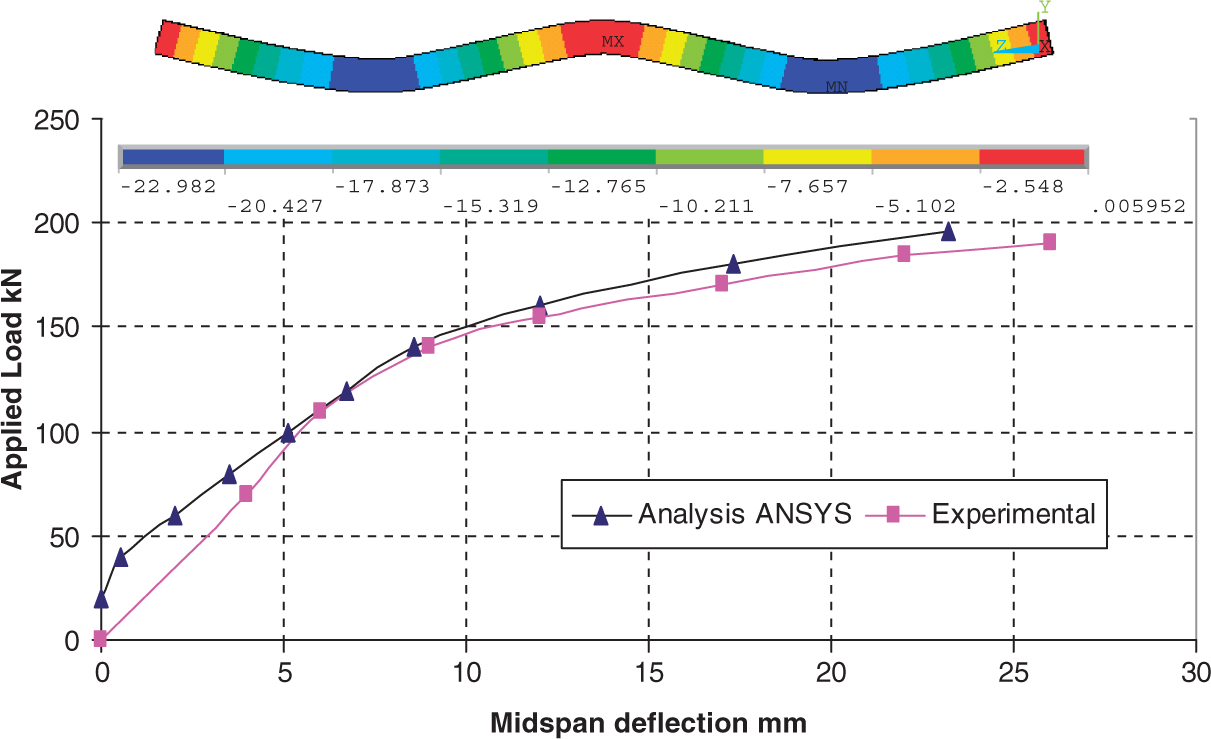
Parametric Study
The beam SC1 is used in parametric study by changing the length of CFRP sheet in the positive region with respect to the length of the span between supports, and then changing the length of CFRP sheet in negative region with different values, as shown in Figures 10 and 11. The results show that the ratio of Lsheet/Lspan for positive region reached 0.6 which gives good strength when compared with the sample strengthened with CFRP sheet which has a ratio of (Lsheet/Lspan) less than 0.6, and for negative region, the best ratio obtained from analysis is 0.45.
Load–deflection curve and deformed shape of beam SC3 with different CFRP sheet lengths (positive region). Load–deflection curve and deformed shape of beam SC3 with different CFRP sheet lengths (negative region).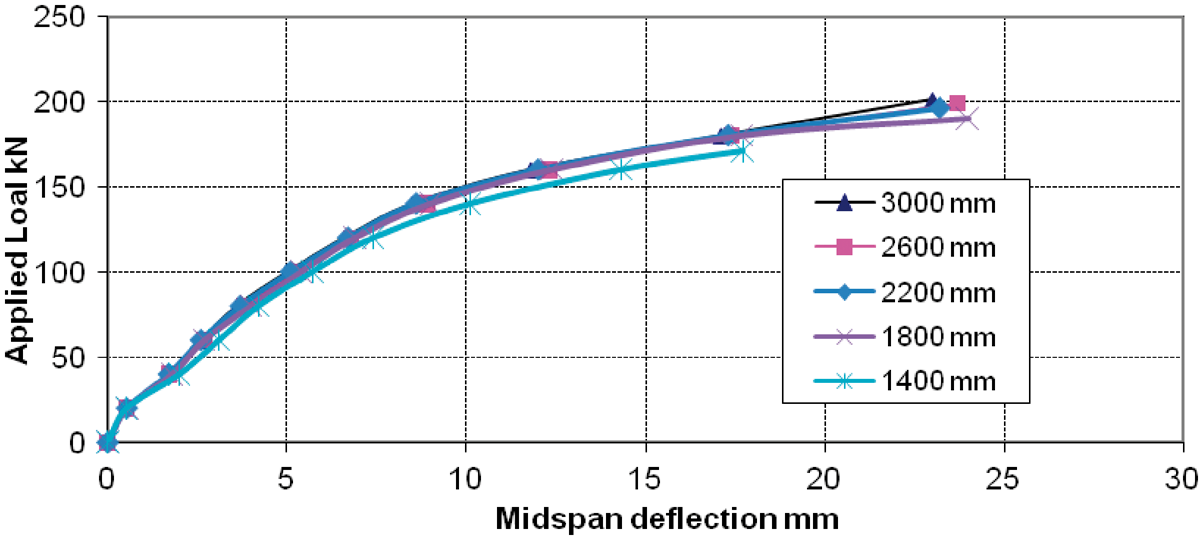
Failure Mode
The failure type is different from one beam to other depending on the number of CFRP sheet layers. When the SC1 was failed by tensile rupture of CFRP sheet over the central supports, beam SC2 was failed by debonding in CFRP sheet at hogging region and rupture and end strap at hogging region. Beam SC3 was failed by debonding at hogging region also. Figures 12–14 show the cracking pattern of beams compared with the experimental data [12] and also show that there is no or little difference in crack pattern for beams.
Crack pattern of beam SC1 (comparison between analysis and experimental). Crack pattern of beam SC2 (comparison between analysis and experimental). Crack pattern of beam SC1 (comparison between analysis and experimental).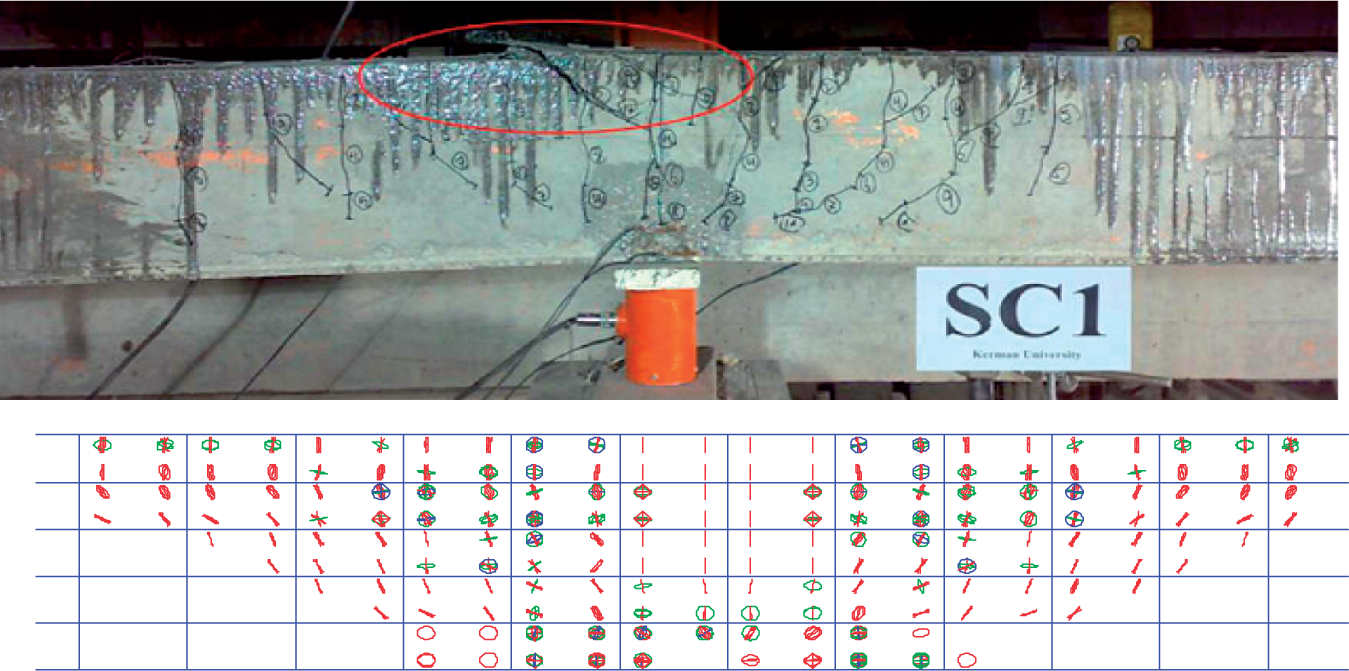
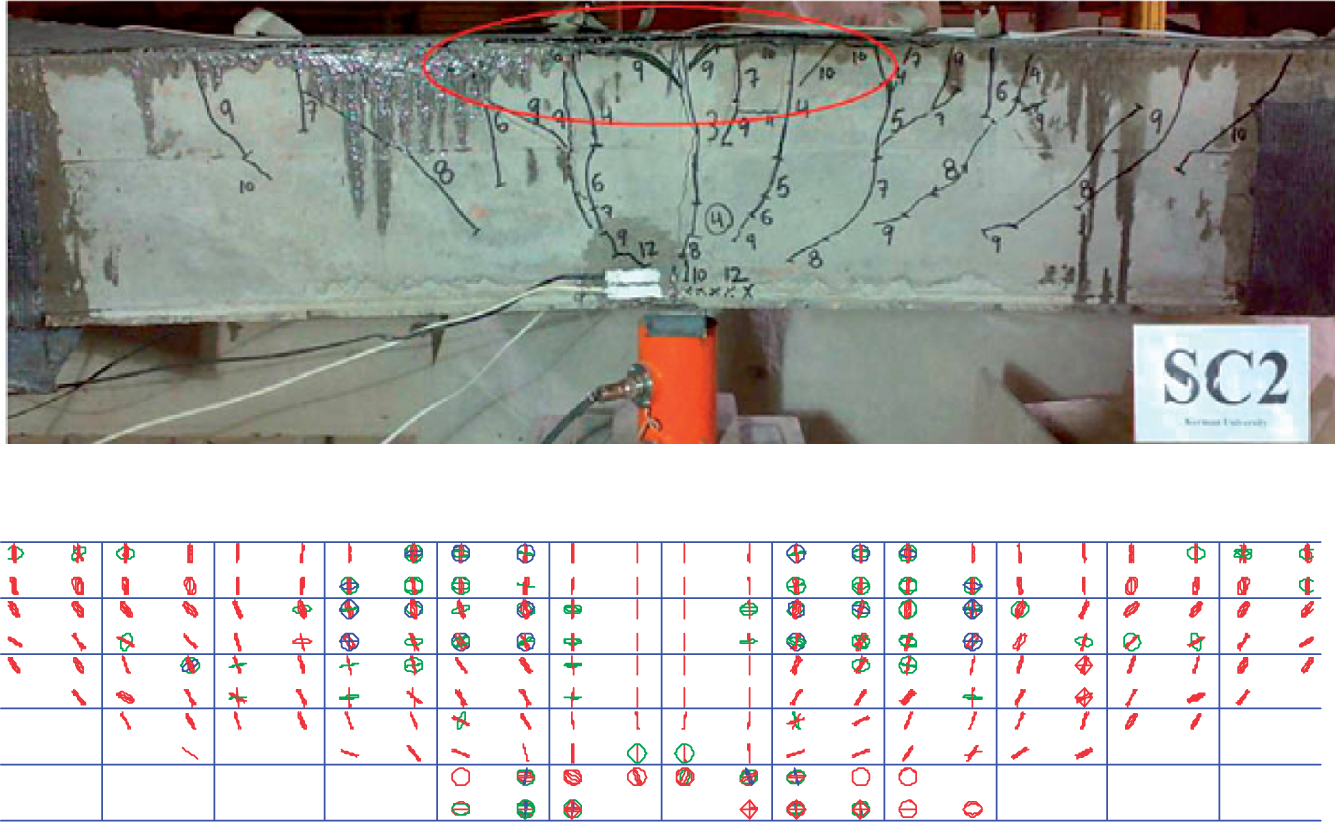
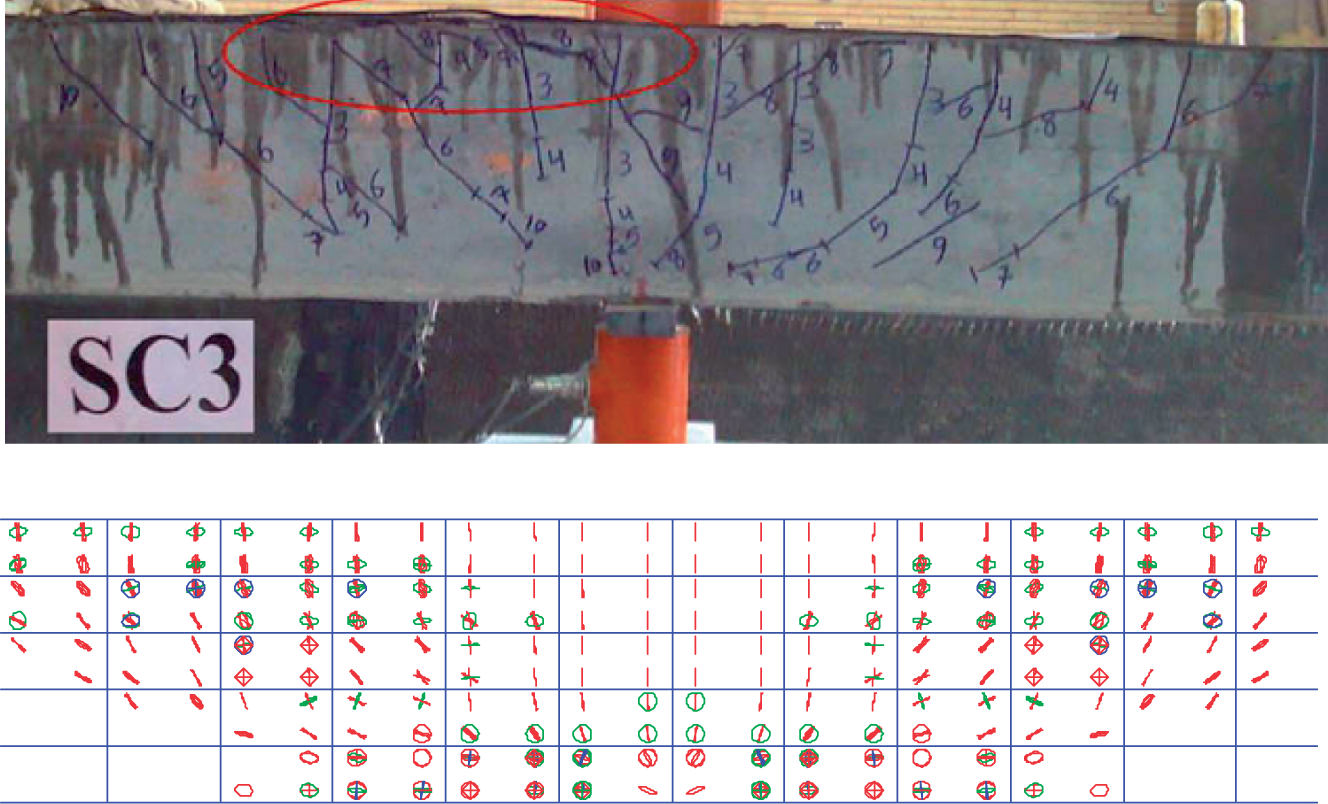
Figures 12–14 show that the crack patterns of all beams obtained from FE analysis are similar to crack patterns obtained from experimental study. The cracks in FE analysis are displayed by circles at locations of cracks in concrete element. Cracking is shown by circle outlines in the plane of the crack. Each integration point can crack in up to three different planes. The first crack is shown with a red circle outline, the second crack with a green circle outline, and the third crack with a blue outline.
CONCLUSIONS
Based on the results obtained from the investigation, the following can be concluded:
Increasing the number of CFRP sheet layers will change the failure mode from tensile rupture to intermediate crack debonding of CFRP sheets in RHSC continuous beams. Increasing the number of CFRP layers reduced loss in stiffness of strengthened beams after yielding the tensile steel. The defection ductility index was decreased by increasing the number of CFRP layers. This nonlinear FE model is a powerful tool and it can provide the researchers with a lot of important information that cannot be supplied by the experimental test.