
Abstract
Background
Enlarged perivascular spaces (EPVS) of the brain may be involved in dementia, such as Alzheimer’s disease and cerebral small vessel disease (CSVD). Hypertension has been reported to be a risk factor for dementia and CSVD, but the association between blood pressure (BP) and perivascular spaces is still unclear. The aim of this study was to determine the association between BP and EPVS volumes and to examine the interactions of relevant factors.
Methods
A total of 9296 community-dwelling subjects aged ≥65 years participated in a brain magnetic resonance imaging and health status screening examination. Perivascular volume was measured using a software package based on deep learning that was developed in-house. The associations between BP and EPVS volumes were examined by analysis of covariance and multiple regression analysis.
Results
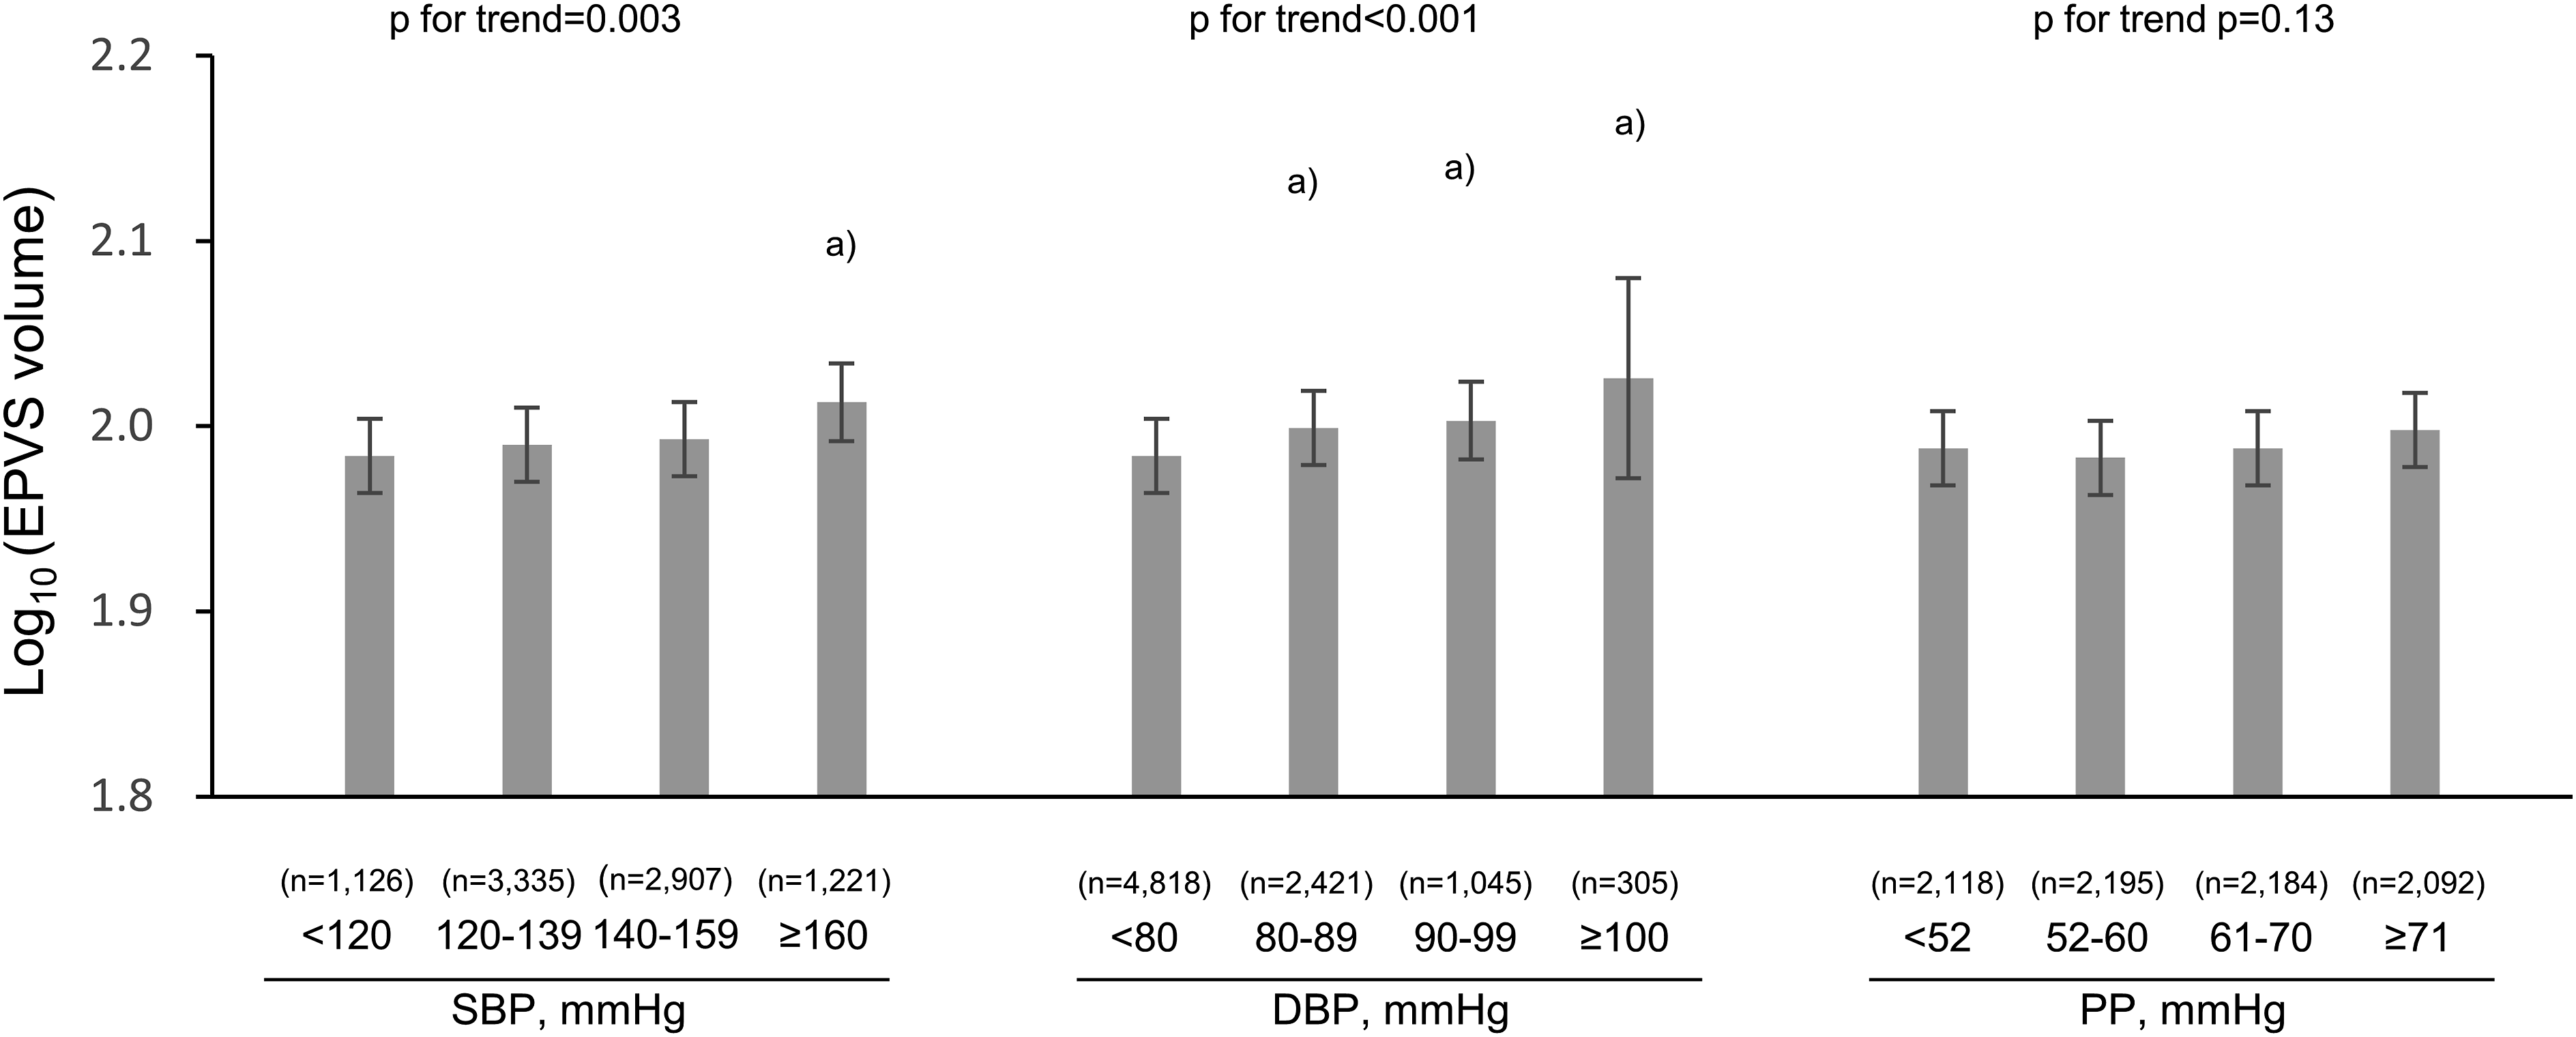
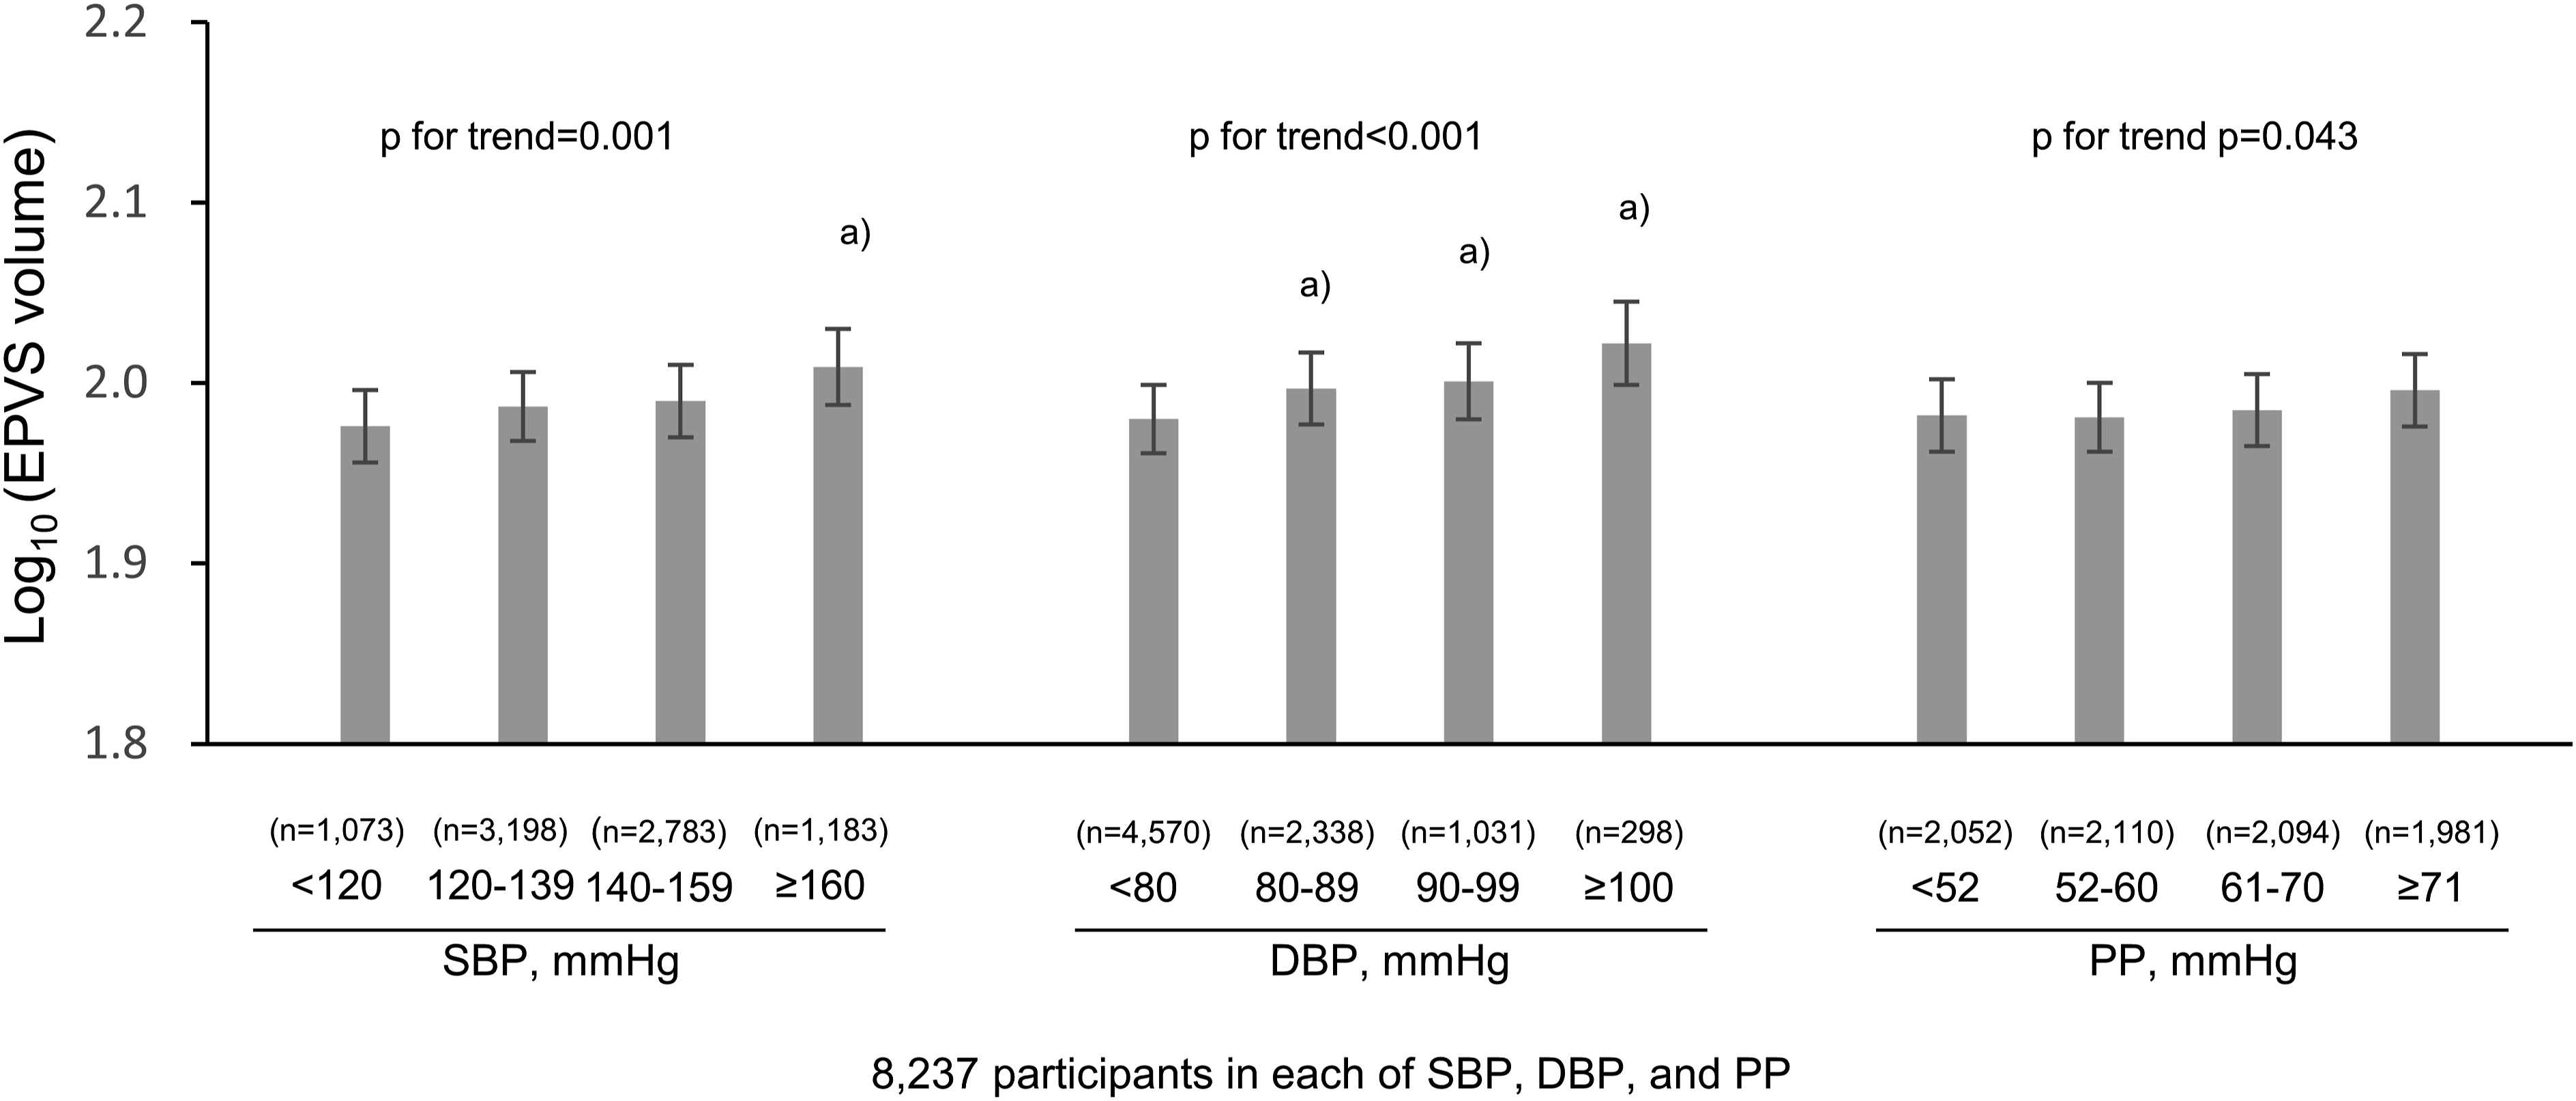
Mean EPVS volumes increased significantly with rising systolic and diastolic BP levels (P for trend = .003, P for trend<.001, respectively). In addition, mean EPVS volumes increased significantly for every 1-mmHg-increment in systolic and diastolic BPs (both P values <.001). These significant associations were still observed in the sensitivity analysis after excluding subjects with dementia.
Conclusions
The present data suggest that higher systolic and diastolic BP levels are associated with greater EPVS volumes in cognitively normal older people.
Introduction
Perivascular spaces in the brain are potential spaces containing fluid around the walls of vessels. Perivascular spaces can be visualized on magnetic resonance imaging (MRI). 1 Conventionally, the presence of enlarged perivascular spaces (EPVS) is known to be an age-related phenomenon. 2 On the other hand, perivascular spaces are considered to be involved in the clearance of waste products, including amyloid-β (Aβ), from the brain.3-5 Recent epidemiological studies have reported that EPVS are significantly associated with dementia and Alzheimer’s disease (AD).6-9 In addition, EPVS are widely recognized as a feature of cerebral small vessel disease (CSVD) associated with stroke and cognitive decline. 10 Therefore, the importance of elucidating the pathophysiology of EPVS is increasingly being recognized.
Hypertension has been acknowledged to be an important risk factor for CSVD and dementia.11,12 Recent studies using brain MRI data have investigated the association of hypertension or blood pressure (BP) with EPVS, but with varying methods of assessing EPVS, different study designs, and with inconsistent types of covariates and study populations.12-15 One study reported no association of hypertension with EPVS. 2 In addition, there have been no large-scale, population-based studies that adjusted for possible confounding factors such as environmental and genetic factors, except for 1 study. 13
The Japan Prospective Studies Collaboration for Aging and Dementia (JPSC-AD) is a multi-site, population-based, prospective cohort study designed to enroll at least 10 000 community-dwelling older residents. 16 JPSC-AD was established to identify environmental and genetic risk factors for dementia, as well as their interactions.17-19 The aim of the present study was to investigate the associations of BP with EPVS volumes and to investigate the interactions between BP and several variables, including dementia, using cross-sectional data from a general Japanese older population.
Methods
Study Population
The JPSC-AD study is a multisite, population-based, prospective cohort study of dementia involving 8 sites in Japan,
16
and the present study followed the Strengthening the Reporting of Observational Studies in Epidemiology (STROBE) checklist. This study was approved by the Medical Ethics Review Board of Ehime University (approval number 1610004) and Kyusyu University’s Institutional Review Board for clinical research (approval number 686-06). Written, informed consent was obtained from all participants. This study was performed in accordance with the Declaration of Helsinki. From 2016 to 2018, a total of 11 957 residents participated in the present study. Of these, after exclusion of 1867 participants without available brain MRI data with three-dimensional T1-weighted imaging (T1WI), 17 participants for whom an automated FreeSurfer analysis was not successfully completed, 151 participants with extreme outlier data for estimated total intracranial volume (eTIV) and regional brain volume, 443 participants aged less than 65 years, and 183 participants with missing BP data, the remaining 9296 participants were eligible for the present study (Figure 1). To define the extreme outliers, the estimated values of each brain parameter by FreeSurfer were fitted by a linear regression model including age, squared age, and sex as covariates. When the residual of the individual data was less than −4 SD or greater than +4 SD on the linear regression analysis, the data were regarded an extreme outliers. Flowchart of patient selection in this study. MRI, magnetic resonance imaging; BP, blood pressure; eTIV, estimated total intracranial volume.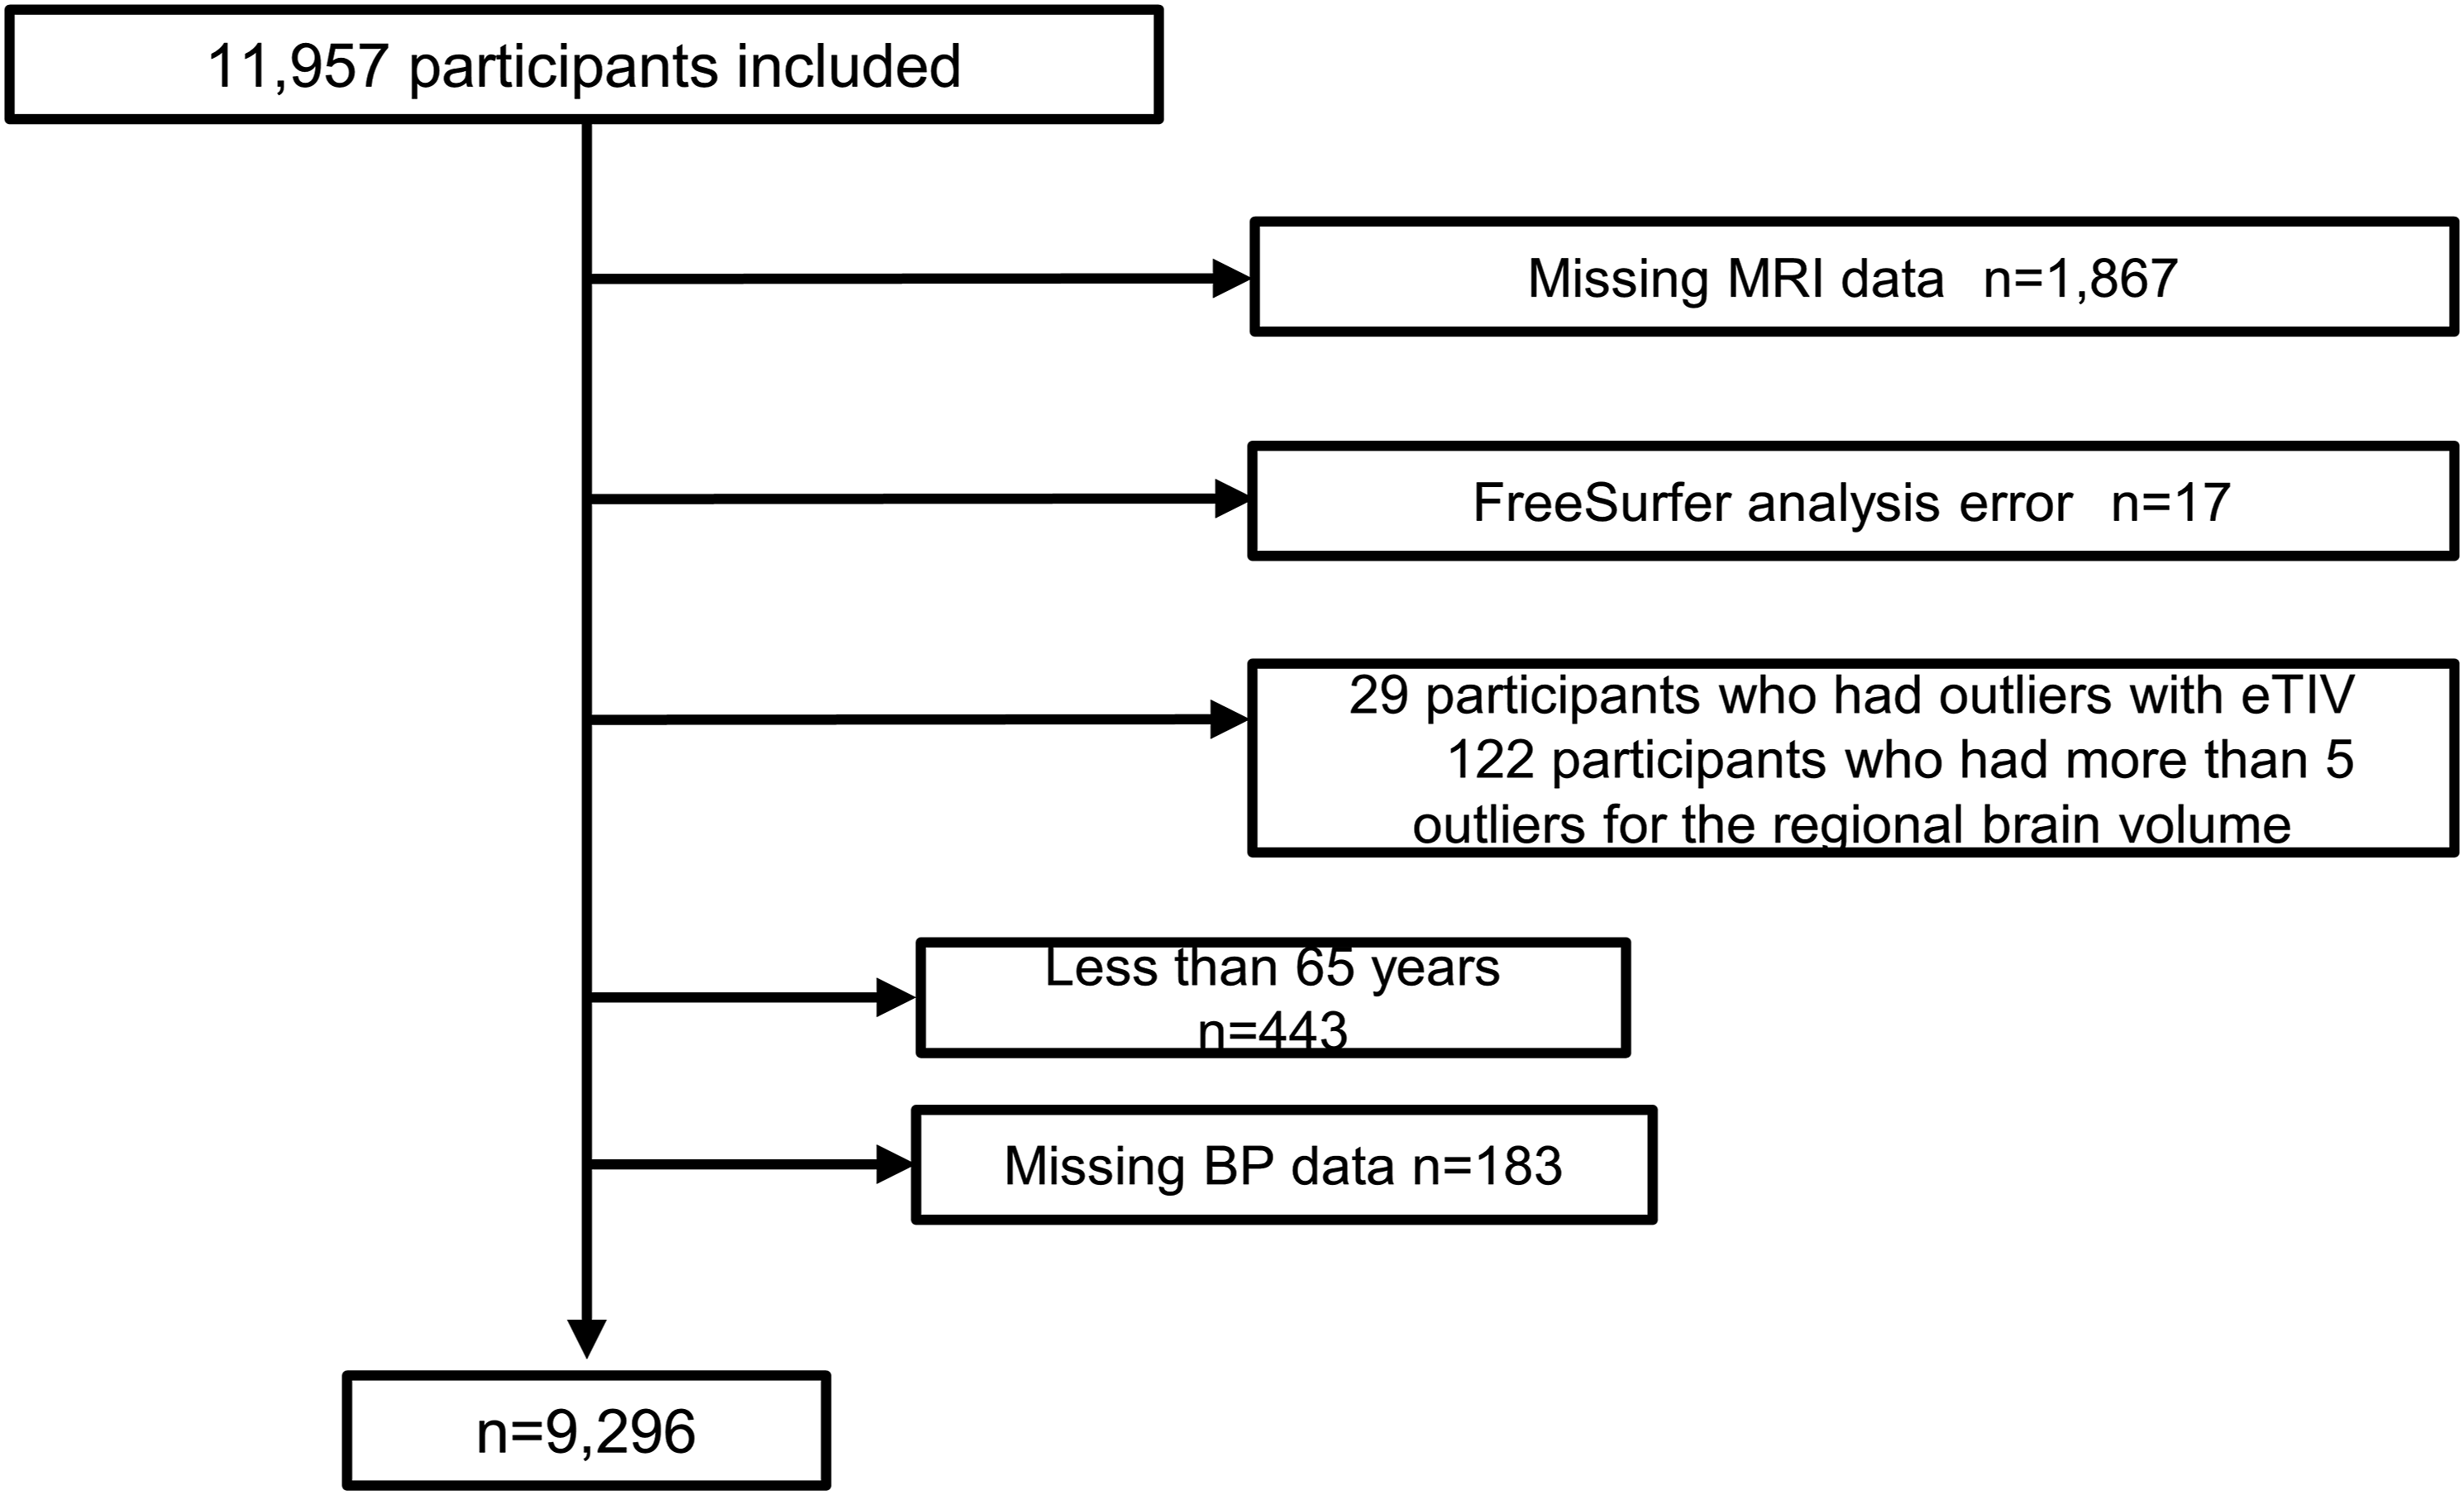
MRI Acquisition
The equipment for brain MRI was set with T1WI parameters according to the protocol of brain MRI for the Alzheimer’s Disease Neuroimaging Initiative (ADNI) study at all research sites. 20 Various scanners were used at each site, including 1.5-T MRI (4 Philips, 1 Hitachi, and 1 GE Healthcare) and 3-T MRI (1 GE Healthcare and 1 Siemens) devices (Supplementary Table 1). Details of the MRI acquisition at each site are described in Supplementary Table 1.
MRI Analysis
In this study, the focus was on analysis of the 3D T1-weighted image because it had the highest resolution of the sequence collected in the context of this JPSC-AD project. Furthermore, whereas some sites had acquired other potentially useful sequences (such as 2D T2/FLAIR), only the T1 sequence was consistently present at all sites involved, allowing analysis of a large sample. Volumetric processing and segmentation were performed using image analysis software at Tohoku University, with a systematic, automated FreeSurfer 5.3 run (http://surfer.nmr.mgh.harvard.edu) intended for general-purpose structural brain analysis, and some additional processing for vessel formation. Vessel formation was segmented using in-house software based on machine-learning, which can detect well-demarcated linear or round hypo-intensities around the putaminal region on 3D-T1WI. A visual review of the perivascular segmentations derived from the FreeSurfer software was not satisfactory for the needs of this study. Therefore, deep learning-based software was developed specifically for the present study, using a method similar to a previous process,
19
to identify and segment both the putaminal region and the perivascular space (Figure 2). Since the aim was a quantitative analysis, an objective, well-delineated, and relatively size-standardized putaminal region over which to perform the measurement was favored. A representative image of “vessel” segmentation created by in-house software (light blue areas). Light blue areas represent the segmentation of “vessel.” Yellow areas represent the putamen. One dark patch on the right side is an infarct, ie, not counted as EPVS.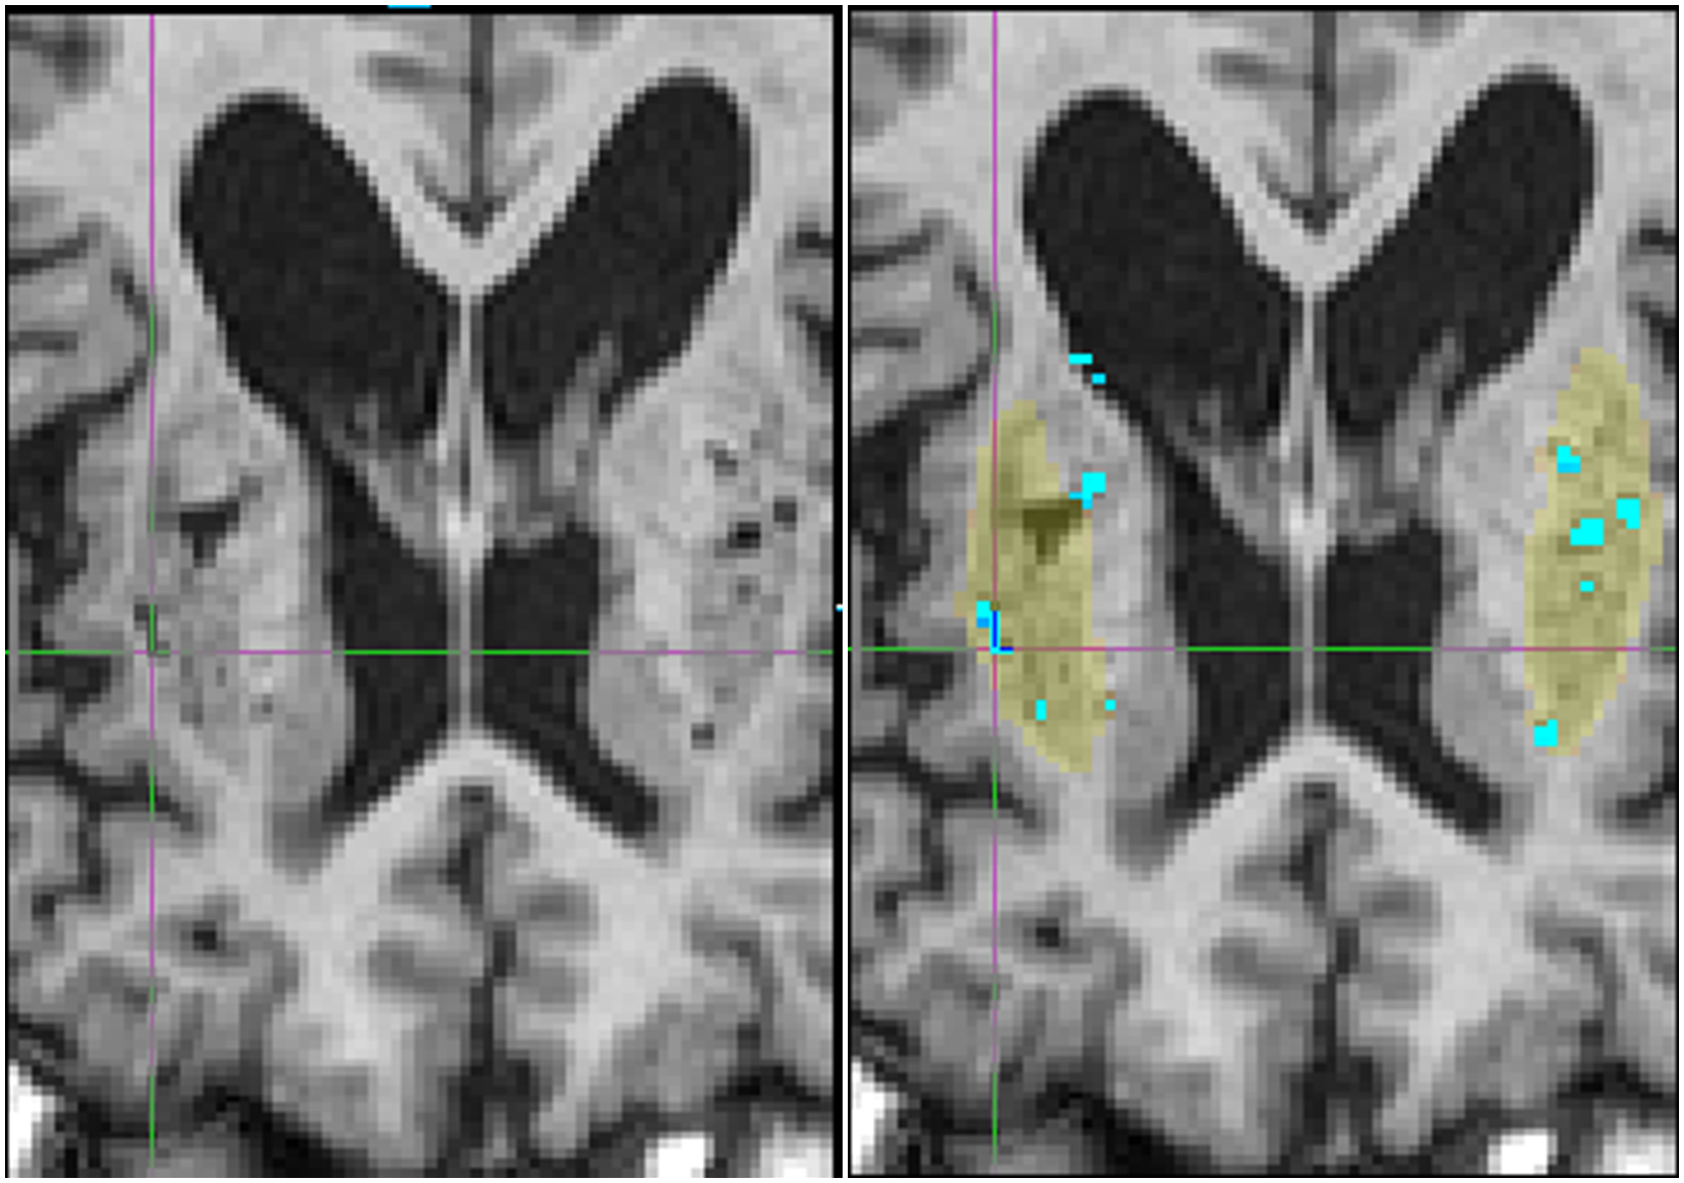
To delineate the perivascular spaces, convolutional neural networks, now a well-established image-processing technique, were used. Two successive models were trained: the first model was tasked to generally identify the bilateral putaminal regions in the full-head field-of-view at a lower-resolution, and the second model was tasked with performing the actual EPVS segmentation on these cropped regions at native resolution. Technically, both networks used three-dimensional variations of the popular U-Net topology, with 4 levels of down-scaling, followed by 4 levels of up-scaling and residual connections. Since the present model did not explicitly aim to be generalizable to other unrelated cohorts, one could assume a fixed voxel-dimension and known T1-contrast to simplify the implementation and the overall training-testing process. Finally, the EPVS statistics were derived by counting the segmented volume and connected-components within each putamen region-mask.
The first network, the putamen identifier, was simply trained to mimic the FreeSurfer Putamen masks, using 1024 random subjects. This method is known to work well, and we previously noted that it can even overcome occasional errors in the training labels.20,21 To train the second network, the EPVS segmenter, a training set was created using the following procedure. From the overwhelmingly-large initial dataset, 200 images were first extracted at random. Then a visual review was conducted, with the goal of extracting a smaller subset optimal for training. 22 The criterion for this selection was that the subset should encompass many anatomical patterns of interest, while limiting the training-set redundancy, and thus, the labelling effort. Based on previous experience, we targeted a set size of 40 training images. Two certified radiologists (Y.T, H.C.) worked on segmenting the EPVS on the MRI images in 3D using ITKSnap. 23 To ensure quality and consistent labeling, each image was segmented by 1 radiologist and checked by the other. The main criterion for labelling hypointense voxels as EPVS was their location, along the vasculature, and their tubular shape. This ensured that other types of hypo-intense areas, such as lacunar infarctions, were not erroneously included. Thirty-seven subjects, representing 74 putamen samples, were eventually included as training material of the convolutional neural network. The training procedure was a straightforward ADAM optimization on a voxel-wise L2-distance loss, similar to what we used in previous work.
To comprehensively verify the segmentation of such a large number of subjects, axial slices, which depicted the focused putamen, its mask, and its EPVS segmentation, were rendered for every subject as overlays, and all of them were visually confirmed using a convenient mosaic display. Furthermore, the population histograms of several statistics (putamen volume, EPVS volume, EPVS blobs count) were plotted, and a dozen outliers were further verified in greater detail each time. Our large sample, which was cross-sectional, did not permit the test-retest reliability of the measure itself to be evaluated. Nonetheless, in a separate and unrelated cohort sample (IRB-approved at Tohoku University) containing the longitudinal scanning of 198 subjects with 491 observations (mean entry age 76.6 years, mean longitudinal range 1.5 year, mean number of time-points 2.5), the test-retest reliability of the PVS volume was measured, with a satisfying ICC of .95/.94 (Left/Right) (Supplementary Figure 2). The segmentation quality was found to be highly satisfactory for the purpose.
All results were visually confirmed before proceeding further to the volume analysis. The eTIV of each subject was also calculated using the standard FreeSurfer processing pipeline by exploiting the relationship between the intracranial volume and the linear transformation to the atlas template. 24
EPVS Volumes
Vessel volume was used as the sum volume of perivascular space and vasculature in this study, which was calculated as the sum of the right and left vessel volumes measured by the in-house method in which images are simply mirrored to process the contralateral side. In the present study, vessel volume was evaluated as an indicator of EPVS. 25
Measurement of BP
Sitting BP was measured with an automated sphygmomanometer 3 times after at least 5 min of rest, and the mean of the 3 measurements was calculated. 26 Pulse pressure (PP) was calculated as systolic blood pressure (SBP) - diastolic blood pressure (DBP) (mmHg). 27 SBP and DBP levels were classified into 4 categories according to the criteria of the eighth report of the Joint National Committee on the Prevention, Detection, Evaluation, and Treatment of High Blood Pressure (JNC-8) 28 as follows: SBP (<120 mmHg, 120-139 mmHg, 140-159 mmHg, and ≥160 mmHg), DBP (<80 mmHg, 80-89 mmHg, 90-99 mmHg, and ≥100 mmHg). PP levels were divided into quartiles as follows: Q1 (<52 mmHg), Q2 (52-60 mmHg), Q3 (61-70 mmHg), and Q4 (≥71 mmHg).
Measurements of Other Risk Factors
Each participant answered a self-administered questionnaire that included educational background, medical history, alcohol consumption, smoking, medical treatments (antihypertensive and antidiabetic medications), and physical activity. Blood samples and electrocardiograms (ECG) were obtained at each site during the health examination. The measurement methods and instruments have been reported previously. 16 All blood samples were analyzed at the central laboratory (LSI Medience Corporation, Tokyo) using the same equipment. Each risk factor was categorized based on the following clinical criteria and references. Low educational level was defined as follows: ≤9 years. Diabetes mellitus was defined as follows: fasting glucose level ≥7.0 mmol/L, casual glucose levels ≥11.1 mmol/L, or HbA1c ≥6.5%, using the 2010 American Diabetes Association (ADA) criteria 29 and/or current use of glucose-lowering agents. Serum total cholesterol levels were measured enzymatically. Hypercholesterolemia was defined as serum total cholesterol ≥5.7 mmol/L or current use of lipid-lowering medication. 30 The body mass index (kg/m2) was measured as an indicator of obesity. Obesity was defined as body mass index ≥25 kg/m2. 31 Chronic kidney disease was defined as an estimated glomerular filtration rate <60 mL/min/1.73 m2, 32 which was calculated using the modified Chronic Kidney Disease Epidemiology Collaboration Study equation multiplied by the Japanese coefficient of .813.33,34 ECG abnormalities were defined as ST depression (Minnesota Code, 4-1,2,3), left ventricular hypertrophy (3-1), or atrial fibrillation (8-3). Regular exercise was defined as any physical activity performed for at least 30 minutes twice per week over the most recent year or longer. Alcohol consumption, smoking, and antihypertensive medications were classified as current or not.
Dementia was diagnosed according to the Diagnostic and Statistical Manual of Mental Disorders, third Revised Edition. 35 The diagnosis of dementia was made by expert psychiatrists and neurologists in the study team using a diagnostic system that was standardized across the 8 research sites. If the members of the endpoint adjudication committee were in agreement, the diagnosis was confirmed; if not, a meeting of the endpoint adjudication committee was held, and the diagnosis was confirmed through discussion. The diagnostic procedure has been reported previously. 16 The apolipoprotein E (APOE) ε4 carrier state was defined as the presence of ε2/ε4, ε3/ε4, or ε4/ε4 alleles.
Statistical Analyses
For the clinical characteristics of the study participants, the values are shown as the means (standard deviation), geometric means or frequencies, as appropriate. Clinical characteristics were evaluated using logistic regression analysis for binary variables and linear regression analysis for continuous variables. The vessel volumes (hereafter denoted as the EPVS volumes) were log-transformed because of their skewed distribution and multiplied by a factor of 102 prior to the analyses and back-transformed for data presentation to facilitate the comparisons. The age and sex-adjusted and multivariate-adjusted mean values of the log10 (EPVS volumes) in the groups defined by SBP, DBP, and PP values, respectively, were calculated using analysis of covariance (ANCOVA), and the post-hoc LSD test was performed if the main ANCOVA was significant. Their trends across SBP, DBP, and PP groups were tested by multiple regression analyses. Multivariable adjustment was performed for age, sex, low educational level, use of antihypertensive medication, diabetes mellitus, serum total cholesterol, body mass index, ECG abnormalities, chronic kidney disease, history of stroke, current smoker status, current drinker status, regular exercise, dementia, apolipoprotein E ε4 carrier status, research site, and eTIV. Of the covariates, age and eTIV were treated as continuous variables, whereas all variables except age and eTIV were treated as binary variables. The reason for adding eTIV as a covariate was to adjust for head size. Overall, 7.6% (=707/9296) of the participants selected for the analysis were excluded from the multivariable-adjusted analysis because of missing data for any covariate. The same analysis was performed on participants after excluding subjects with dementia, because dementia may affect the associations of BP with EPVS. Multiple regression analysis was used to investigate the relationships between SBP, DBP, and PP taken as continuous variables and log10 (EPVS volumes). In the multivariable-adjusted model, the abovementioned factors were included. Subgroup analyses were performed for each of age at the health examination (<75 or ≥75 years), sex, educational level (>9 or ≤9 years), use of antihypertensive medication, diabetes mellitus, hypercholesterolemia, obesity, ECG abnormalities, chronic kidney disease, history of stroke, current smoker status, current drinker status, regular exercise, dementia, and apolipoprotein E ε4 carrier status. Heterogeneity in the associations of SBP and DBP with EPVS volumes between subgroups was tested by adding a multiplicative interaction term in the relevant statistical model. P values less than .05 were considered significant. All analyses were performed using the Statistical Package for the Social Sciences (version 23; SPSS Inc., Chicago, IL, USA).
Results
Baseline Characteristics of the Study Population
Clinical Characteristics of the Study Participants by Systolic and Diastolic Blood Pressure Levels (n = 9296).
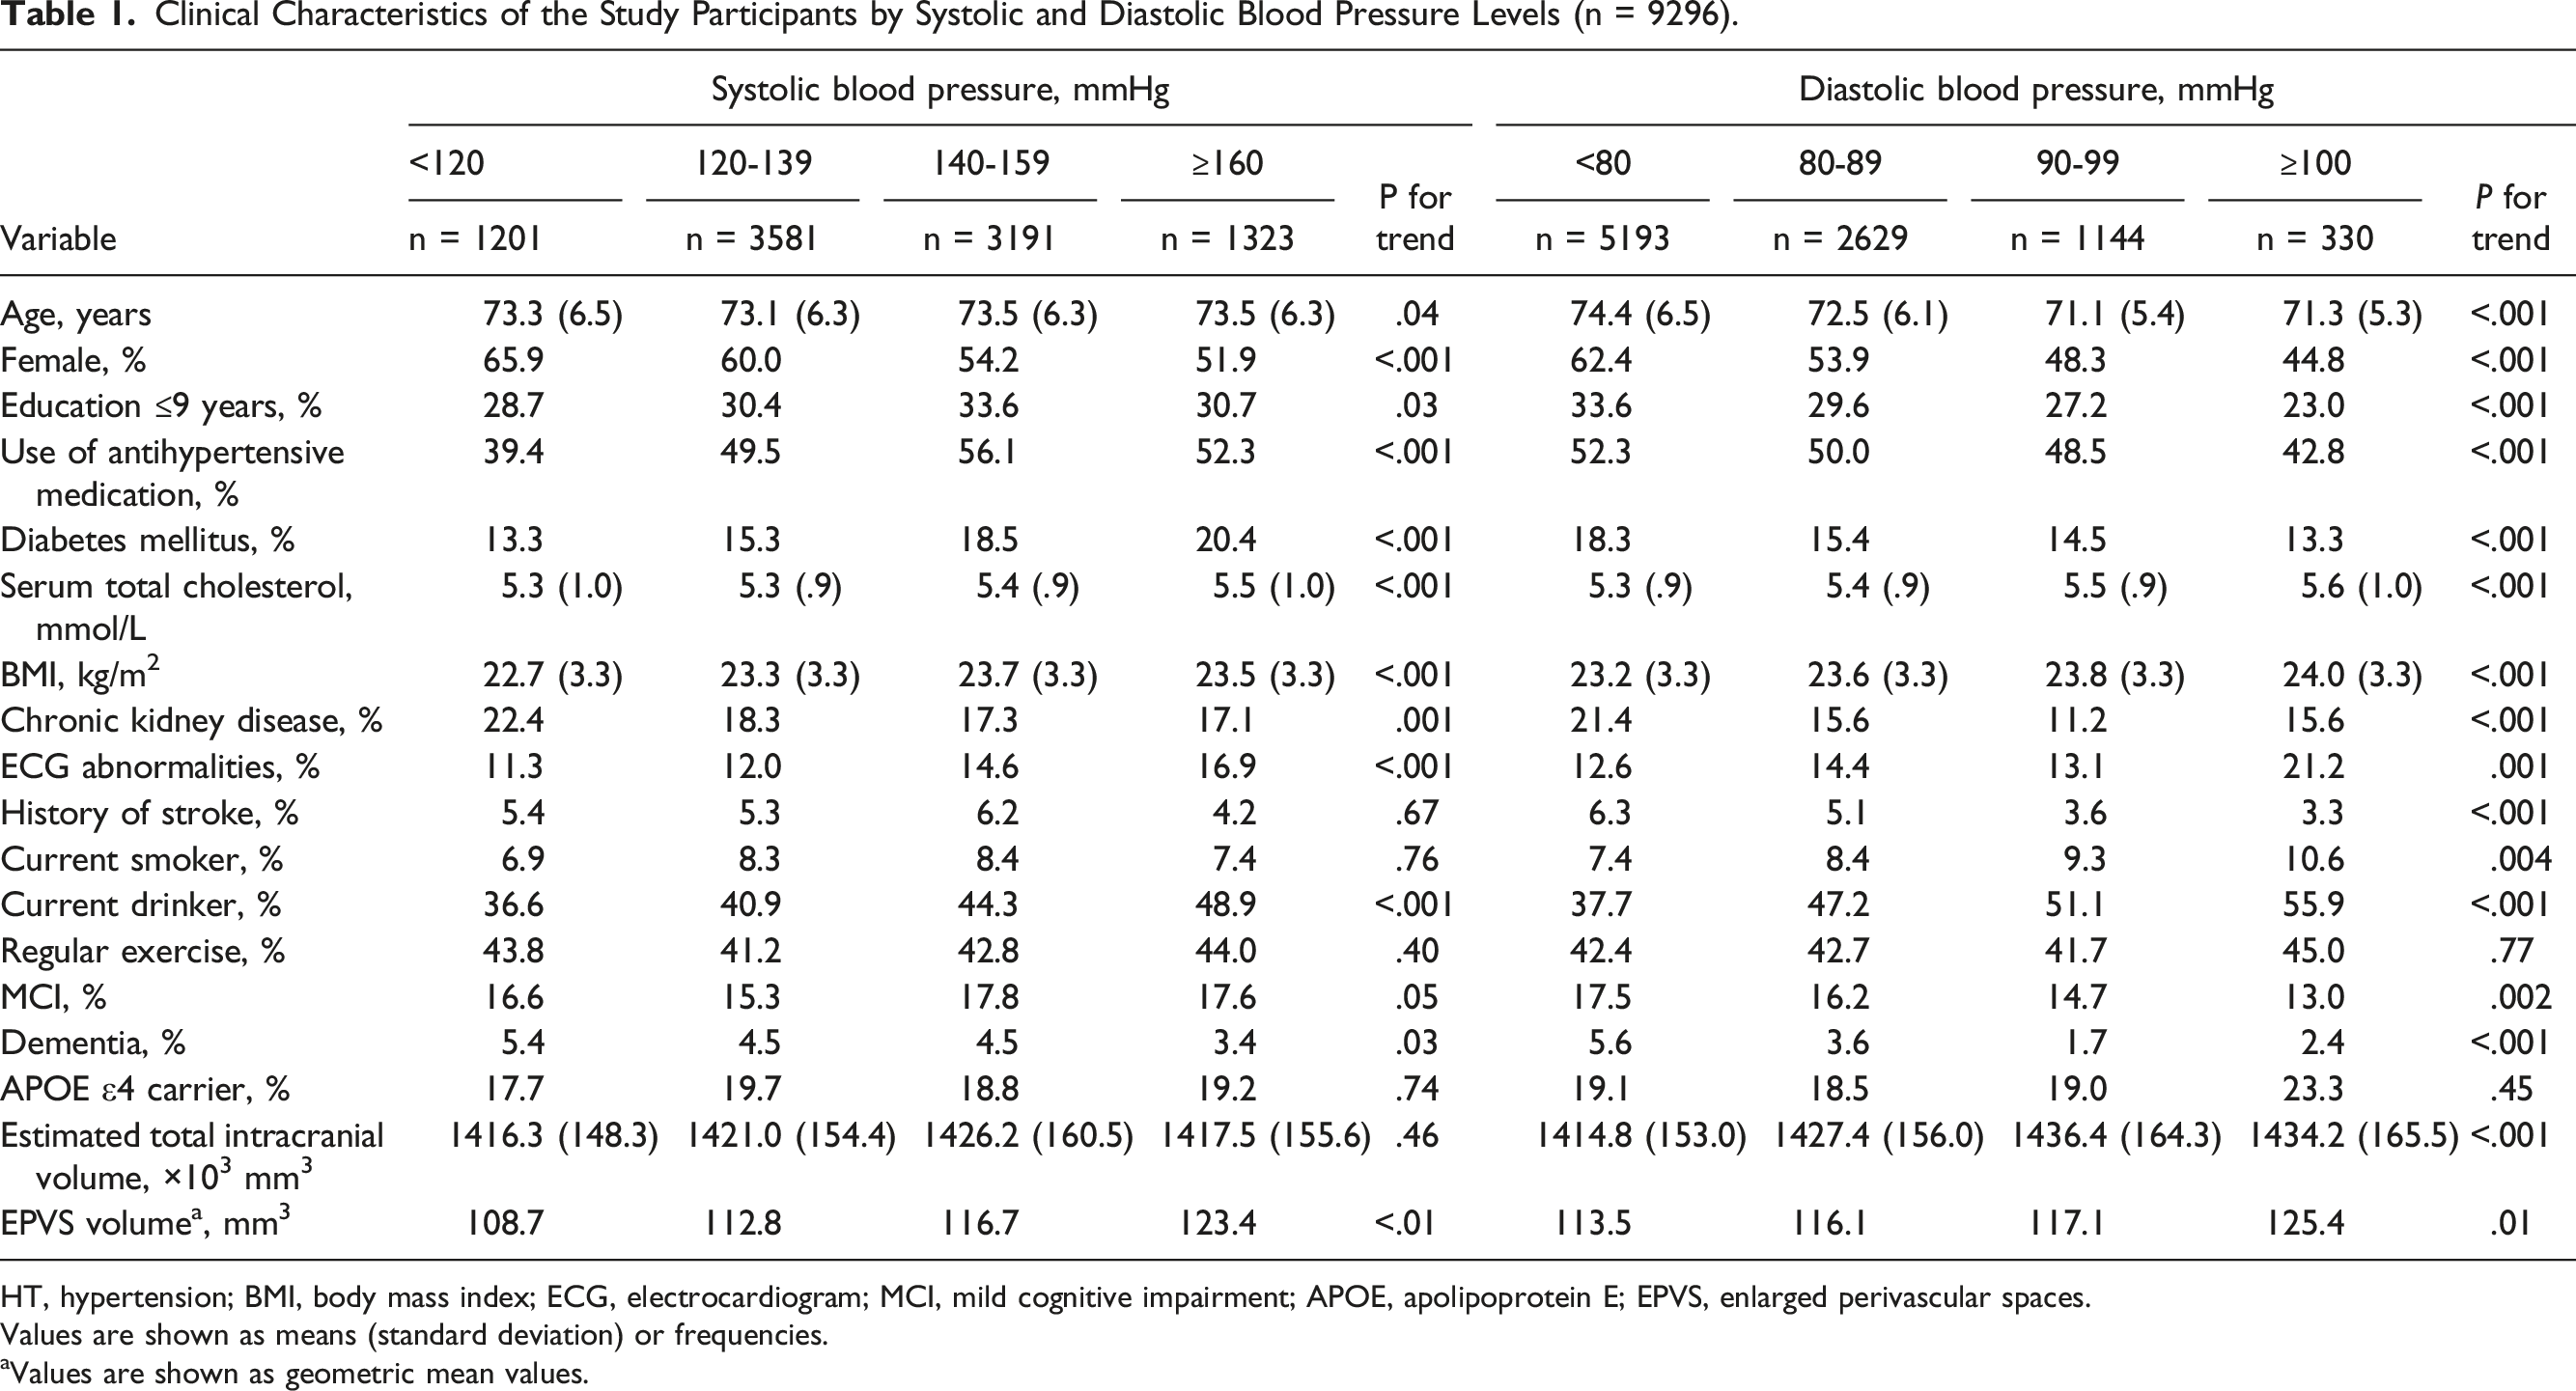
HT, hypertension; BMI, body mass index; ECG, electrocardiogram; MCI, mild cognitive impairment; APOE, apolipoprotein E; EPVS, enlarged perivascular spaces.
Values are shown as means (standard deviation) or frequencies.
aValues are shown as geometric mean values.
Associations of BP levels with EPVS volumes
First, the associations of BP levels with the EPVS volumes were investigated. As shown in Figure 3, the age- and sex-adjusted mean values of log10 (EPVS volumes) increased significantly with increased SBP levels, being 2.049, 2.061, 2.070, and 2.092, for individuals with SBP <120, 120-139, 140-159, and ≥160 mmHg, respectively (P for trend <.001). The values were significantly greater in those with SBP of 140-159 mmHg and SBP ≥160 mmHg than those with SBP <120 mmHg (P = .008 and P < .001, respectively). Similarly, higher DBP levels were significantly associated with the age- and sex-adjusted mean values of log10 (EPVS volumes), being 2.059, 2.072, 2.079, and 2.105 for individuals with DBP <80, 80-89, 90-99, and ≥100 mmHg, respectively (P for trend <.001). Individuals with DBP of 80-89 mmHg, DBP 90-99 mmHg, and DBP >100 mmHg had significantly higher adjusted mean values of log10 (EPVS volumes) than those with DBP <80 mmHg (P = .018, .010 and <.001, respectively). With regards to PP, higher levels were also significantly associated with the age- and sex-adjusted mean values of log10 (EPVS volumes), being 2.058, 2.060, 2.066, and 2.085 for individuals with PP <52, 52-60, 61-70, and ≥71 mmHg, respectively (P for trend <.001). Individuals with PP ≥71 mmHg had significantly higher adjusted mean values of log10 (EPVS volumes) than those with DBP <52 mmHg (P < .001). There were similar significant associations of both SBP and DBP levels with EPVS after adjusting for age, sex, low educational level, use of antihypertensive medication, diabetes mellitus, serum total cholesterol, body mass index, ECG abnormalities, chronic kidney disease, history of stroke, current smoker status, current drinker status, regular exercise, dementia, apolipoprotein E ε4 carrier status, research site, and eTIV, and no associations of PP levels (Figure 4). The multivariable-adjusted mean values of log10 (EPVS volumes) were 1.984, 1.990, 1.993, and 2.013 for individuals with SBP <120, 120-139, 140-159, and ≥160 mmHg (P for trend = .003) and 1.984, 1.999, 2.003, and 2.026 for individuals with DBP <80, 80-89, 90-99, and ≥100 mmHg, respectively (both P values for trend <.01). On the other hand, there was no evidence of significant associations between PP levels and the multivariable-adjusted mean values of log10 (EPVS volumes) (P for trend = .13). These significant associations of SBP and DBP with EPVS volumes were still observed in the sensitivity analysis after excluding 414 individuals with dementia (Figure 5). Age- and sex-adjusted mean log10 (EPVS volume) by blood pressure level. EPVS, enlarged perivascular spaces; SBP, systolic blood pressure; DBP, diastolic blood pressure. The data are expressed as mean values ± standard error after adjusting for age and sex. A total of 9296 participants were included in the analysis. a) P < .05, compared to the lowest blood pressure group (ie SBP <120 mmHg, DBP <80 mmHg, and PP <52 mmHg, respectively). Multivariable-adjusted mean log10 (EPVS volume) by blood pressure levels. EPVS, enlarged perivascular spaces; SBP, systolic blood pressure; DBP, diastolic blood pressure. The data are expressed as mean values ± standard error after adjusting for age, sex, low educational level, use of antihypertensive medication, diabetes mellitus, serum total cholesterol, body mass index, electrocardiogram abnormalities, chronic kidney disease, history of stroke, current smoker status, current drinker status, regular exercise, dementia, apolipoprotein E ε4 carrier status, research site, and estimated total intracranial volume. A total of 8589 participants were included in the analysis. a) P < .05, compared to the lowest blood pressure group (ie SBP <120 mmHg, DBP <80 mmHg, and PP <52 mmHg, respectively). Multivariable-adjusted mean log10 (EPVS volume) by blood pressure levels after excluding subjects with dementia. eTIV, estimated total intracranial volume; SBP, systolic blood pressure; DBP, diastolic blood pressure. The data are expressed as mean values ± standard error after adjusting for age, sex, low educational level, use of antihypertensive medication, diabetes mellitus, serum total cholesterol, body mass index, electrocardiogram abnormalities, chronic kidney disease, history of stroke, current smoker status, current drinker status, regular exercise, dementia, apolipoprotein E ε4 carrier status, research site and estimated total intracranial volume. A total of 8237 participants were included in the analysis. a) P < .05, compared to the lowest blood pressure group (ie SBP <120 mmHg, DBP <80 mmHg, and PP <52 mmHg, respectively).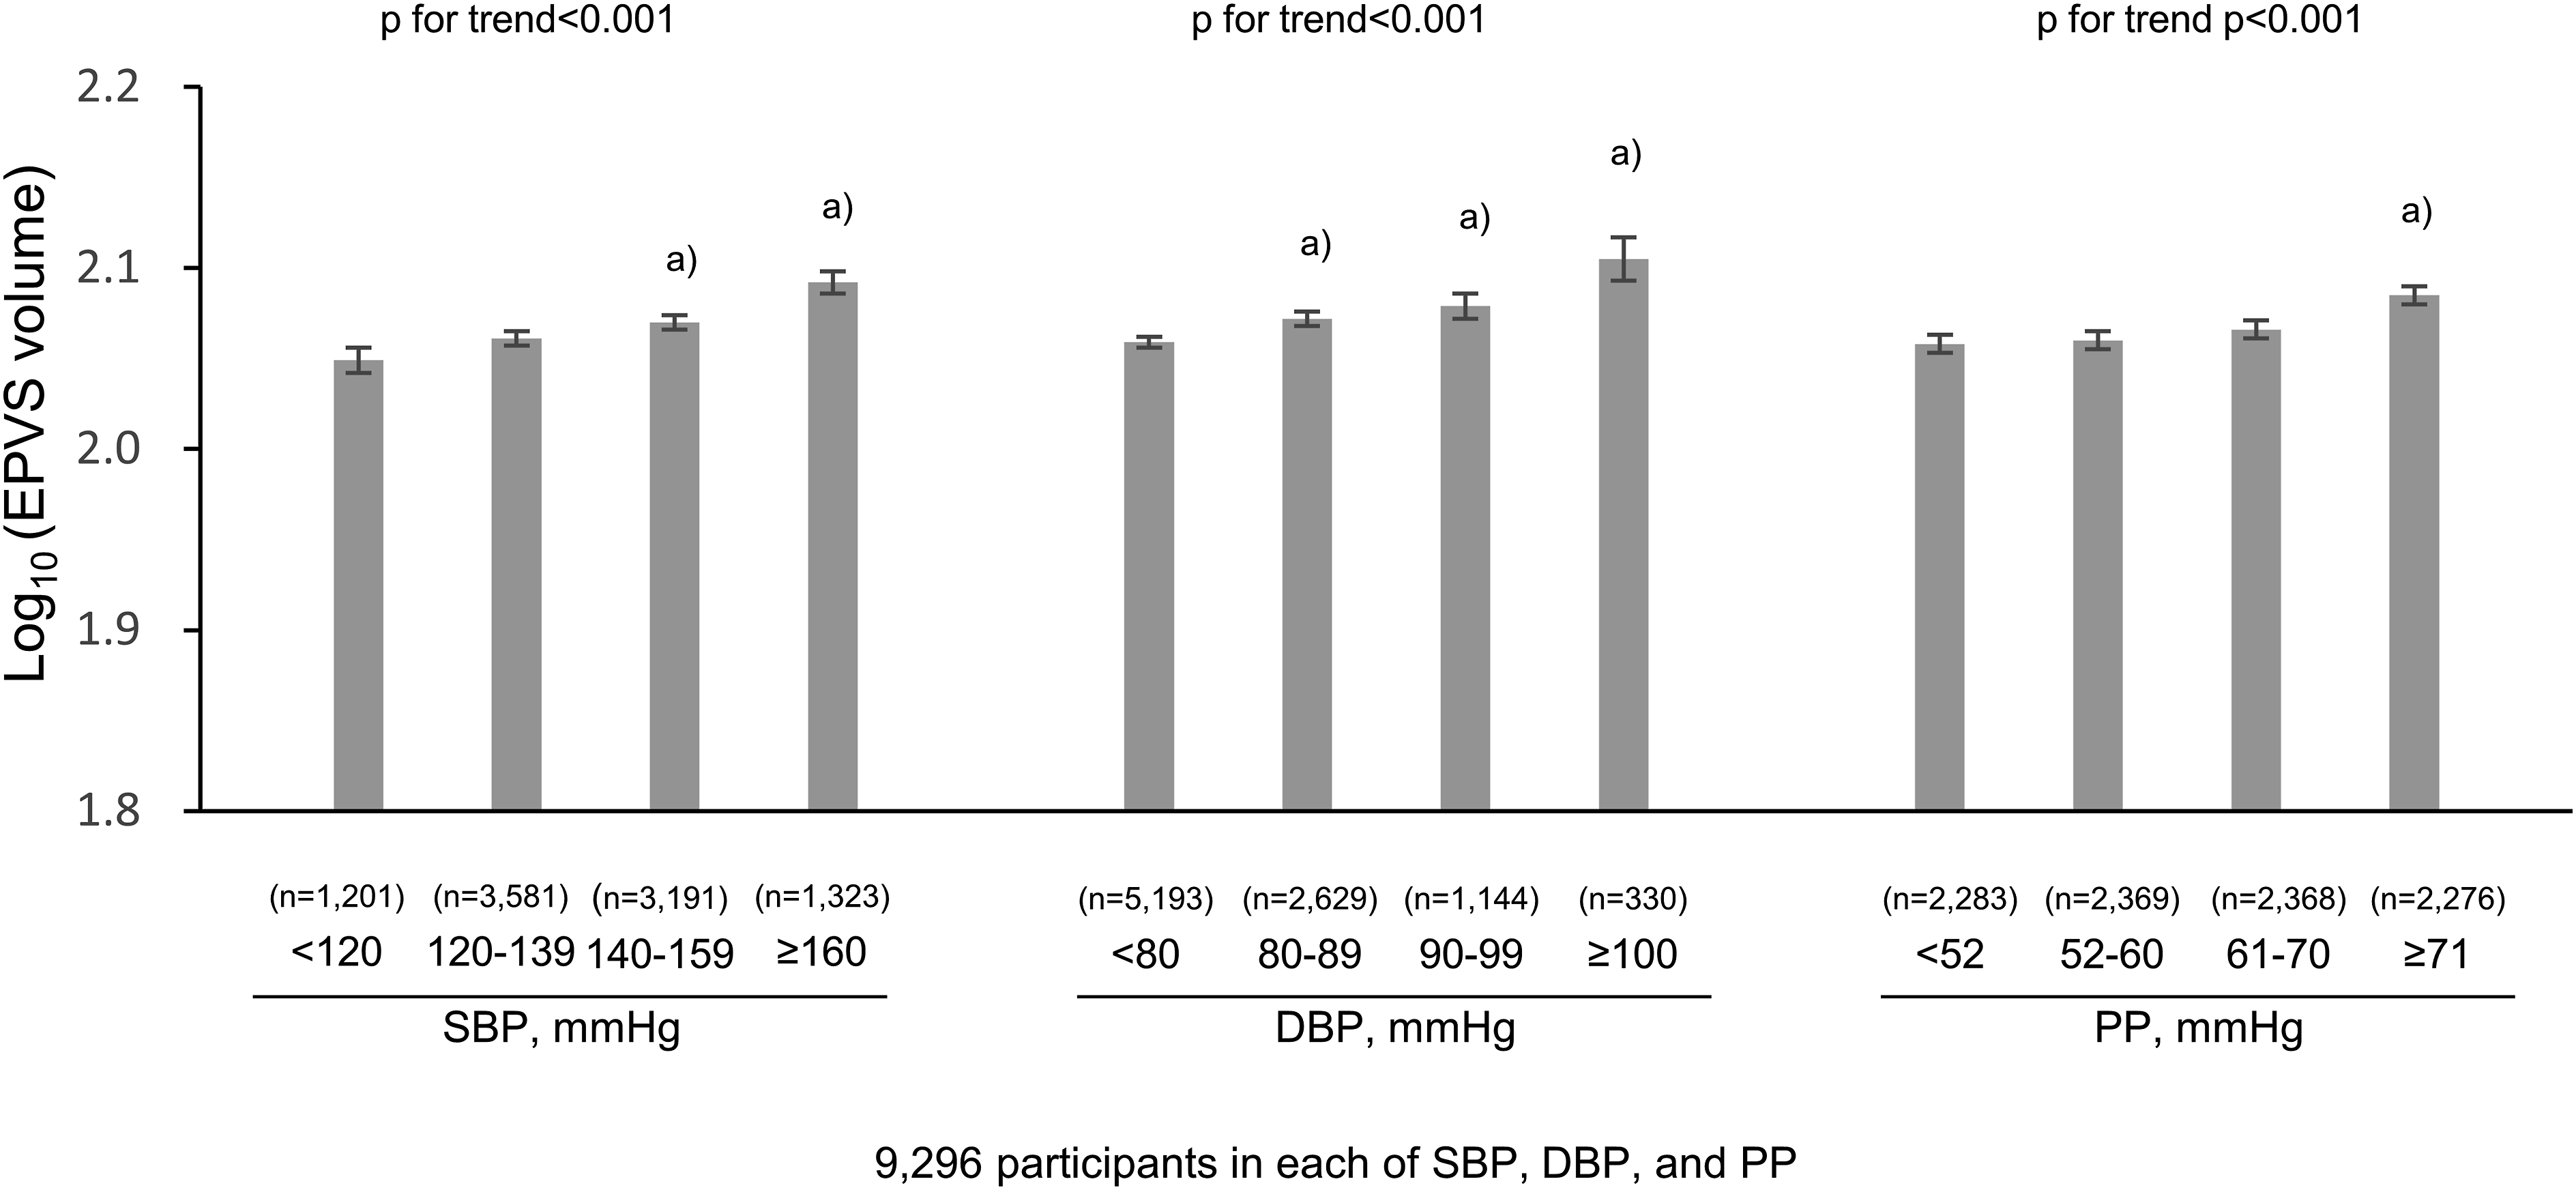
Change in Multivariable-Adjusted Mean Values of log10 (EPVS Volumes) per Every 1-mmHg-increment in Systolic Blood Pressure and Diastolic Blood Pressure in Overall Study Participants and in Subgroups of Each Covariate.
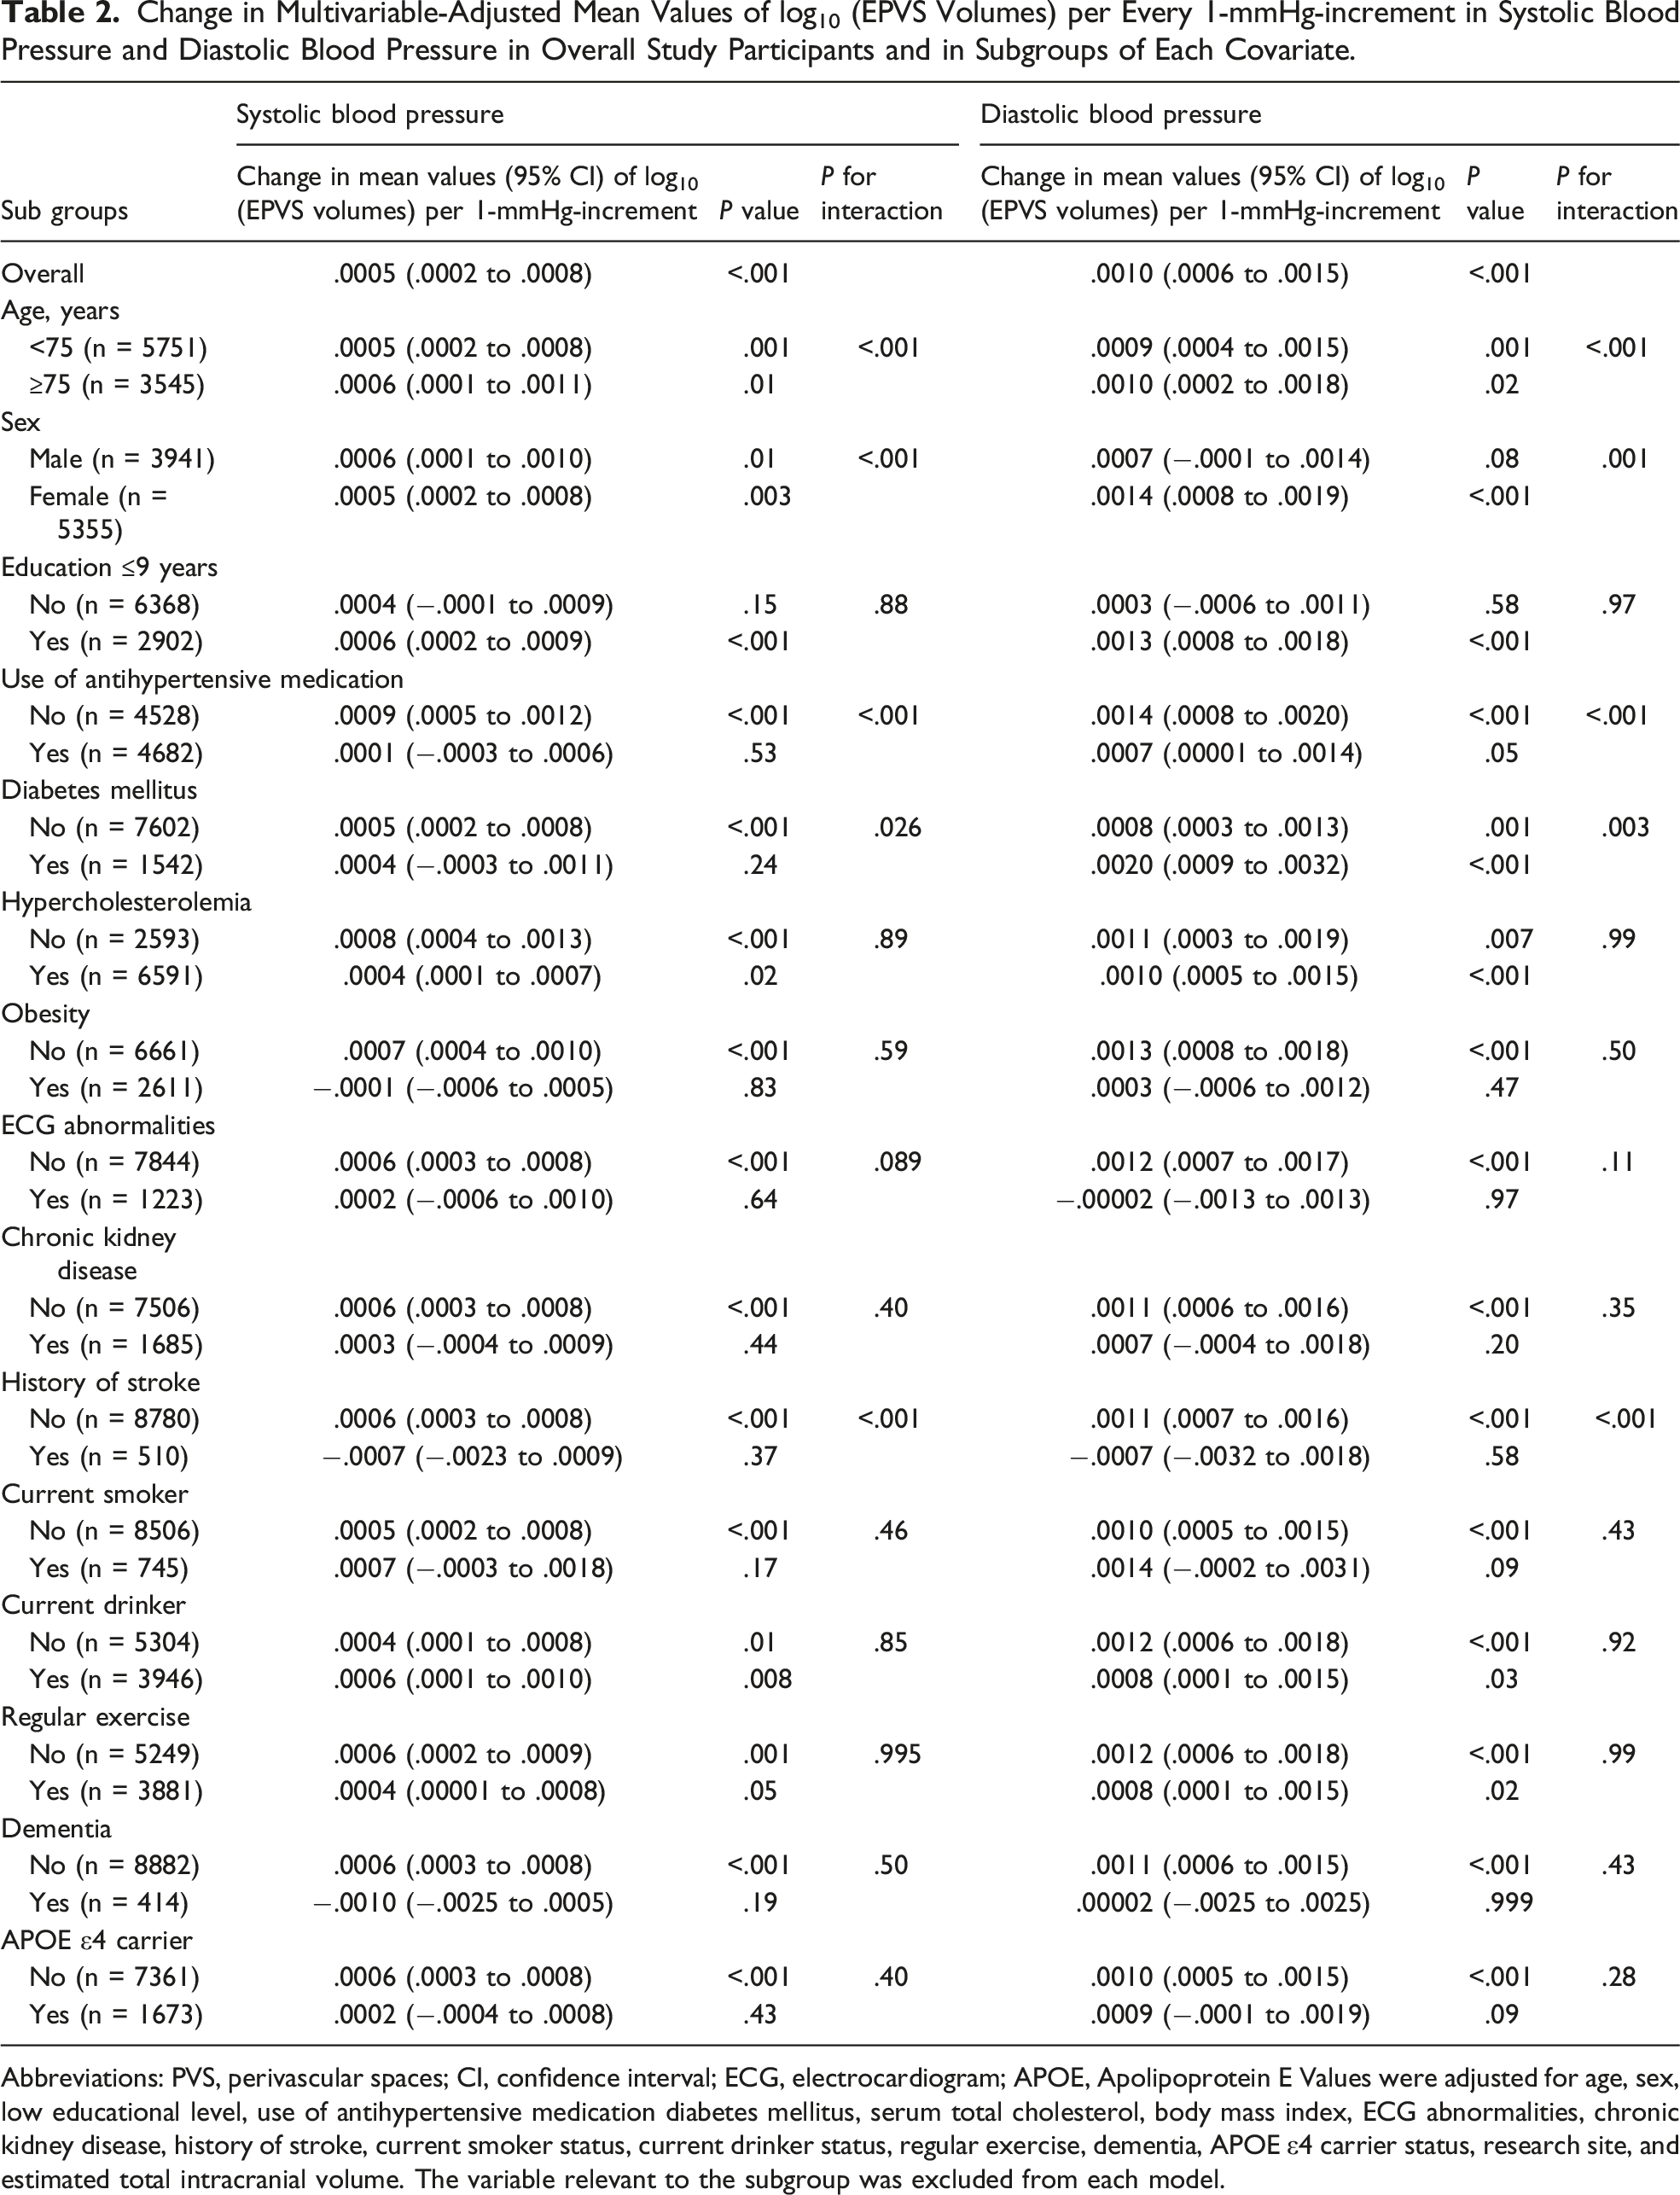
Abbreviations: PVS, perivascular spaces; CI, confidence interval; ECG, electrocardiogram; APOE, Apolipoprotein E Values were adjusted for age, sex, low educational level, use of antihypertensive medication diabetes mellitus, serum total cholesterol, body mass index, ECG abnormalities, chronic kidney disease, history of stroke, current smoker status, current drinker status, regular exercise, dementia, APOE ε4 carrier status, research site, and estimated total intracranial volume. The variable relevant to the subgroup was excluded from each model.
In addition, subgroup analyses of the associations of SBP or DBP with EPVS volumes for age (<75 or ≥75 years), sex, educational attainment, use of antihypertensive medication, diabetes mellitus, hypercholesterolemia, obesity, ECG abnormalities, chronic kidney disease, history of stroke, current smoker status, current drinker status, regular exercise, dementia, and APOE ε4 carrier status were performed. There was significant heterogeneity in the associations of SBP or DBP with EPVS volumes by age group, sex, use of antihypertensive medication, diabetes mellitus, and history of stroke (all P values for heterogeneity <.05) after adjustment for other variables (Table 2).
Discussion
The present study showed associations of higher SBP and DBP levels with greater EPVS volumes in a general older Japanese population. Even after multivariable adjustment, the EPVS volumes increased with rising SBP and DBP levels. SBP and DBP taken as continuous variables were positively correlated with EPVS volumes, indicating a dose-effect relationship. In addition, these associations remained significant even in participants without dementia.
Hypertension in midlife was shown to be a risk factor for dementia in a recent meta-analysis. 36 The Hisayama Study also showed that higher BP levels are associated with a higher risk of dementia. 37 The present finding may lead to the hypothesis that elevated BP is associated with CSVD as a risk factor for dementia. Therefore, it would be reasonable to suppose that the optimal control of BP levels is clinically important to reduce the risk of dementia via EPVS.6-9 It may also be possible to confirm EPVS with imaging studies in routine clinical practice to confirm decreased excretion of perivascular waste products and increased risk of dementia.
Studies have accumulated examining the association between hypertension or BP and EPVS.2,13-15,38 However, only 3 studies have examined the associations of BP levels with EPVS.13,15,38 One study reported the association of hypertension with EPVS, but no associations were found between SBP, DBP, or PP and EPVS. 15 Another study reported the association of higher SBP or PP with EPVS, whereas no association of DBP with EPVS was observed, 38 at least in terms of statistical significance. Yet another study reported that higher day SBP and DBP levels were associated with EPVS, but PP levels were not examined. 13 The present findings were consistent with this study 13 and may be more generalizable to older people than previous studies because of the larger sample size and the ability to adjust for confounding factors.
There may be several mechanisms underlying the associations between rising SBP and DBP levels and EPVS. Arterial wall motion is the principal mechanism driving the flow of cerebrospinal fluid through perivascular spaces in mice. 39 That study also provides evidence that hypertension causes arterial stiffness, which in turn induces changes in vessel dynamics and decreases flow in perivascular spaces. The result of reduced fluid flow in perivascular spaces is impaired drainage of excretions. Therefore, rising SBP and DBP levels may decrease perivascular pumping and secondarily enlarge perivascular spaces. Another possible mechanism is that rising intraluminal pressure might increase extravasation of fluid through the small arteries into perivascular spaces, causing EPVS. This hypothesis is supported by the finding that the permeability of endothelial cells increases in hypertension. 40
In the subgroup analyses, there was no evidence of heterogeneity in the associations of SBP or DBP with EPVS volumes in most of the subgroups by background factors, but significant heterogeneity in the association was detected among the subgroups by age, sex, use of antihypertensive medication, diabetes mellitus, and history of stroke. Although there was significant heterogeneity in the associations among the subgroups by age and sex, the magnitude of the association was similar among each of the subgroups. On the other hand, the exact reasons for the heterogeneity in the associations among the subgroups by use of antihypertensive medication, diabetes mellitus, and history of stroke are unclear. The strength of the association between DBP and EPVS volumes was greater in the subgroup with diabetes mellitus than in that without diabetes mellitus. This finding may be the result of chance, or it may suggest that some diabetic factor affects the association between BP and EPVS. On the other hand, EPVS volumes are likely to be affected by the use of antihypertensive medication or history of stroke. Certainly, the EPVS volumes were greater in the participants on antihypertensive medication or with a history of stroke than in those without, even at lower BP levels (Supplementary Figure 1). PVS may be enlarged even at lower BP levels due to exposure to hypertension possibly associated with EPVS in antihypertensive medication users. With regard to a history of stroke, the previous study showed the association of SBP and DBP with EPVS in participants with a history of stroke, 13 but the present study found no significant association. The small sample size of participants with a history of stroke may have affected the results. Moreover, participants with a history of stroke are likely to be undergoing therapeutic treatment related to BP or other risk factors.
The strengths of the present study are the large sample size and sufficient power to detect small changes. This gave the opportunity to adjust for possible confounding factors. In addition, the parameter used as an indicator of perivascular spaces is highly accurate. However, several limitations should be noted. First, this was a cross-sectional study. Therefore, the causal association between BP levels and perivascular spaces could not be evaluated. Second, the volume of perivascular spaces was calculated as the sum of the right and left vessel volumes, and estimated using in-house ROI software, with vessels that do not label a specific region, but rather contain several structures. This may have led to underestimation or overestimation of the volume of perivascular spaces. It is important to examine the association between BP and EPVS in each brain region, not only the putamen, but also the centrum semiovale and hippocampus, to elucidate the pathophysiology as risk factor of dementia in the future. Third, individuals who did not undergo brain MRI were excluded from the present study. This might have resulted in selection bias. Fourth, BP was measured during daytime checkups, and the time of measurement varied among participants. Finally, the generalizability of the present findings to other ethnic populations may be limited due to differing lifestyles and genetic backgrounds.
Conclusions
The present data showed that rising SBP and DBP levels are significantly associated with EPVS in cognitively normal older people. Further prospective longitudinal and basic research studies are required to clarify causal associations.
Supplemental Material
Supplemental Material - Late-Life High Blood Pressure and Enlarged Perivascular Spaces in the Putaminal Regions of Community-Dwelling Japanese Older Persons (JPSC-AD)
Supplemental Material for Late-Life High Blood Pressure and Enlarged Perivascular Spaces in the Putaminal Regions of Community-Dwelling Japanese Older Persons (JPSC-AD) by Ayumi Tachibana, Jun-ichi Iga Yasuko Tatewaki, Benjamin Thyreau, Hongkun Chen, Tomoki Ozaki, Taku Yoshida, Yuta Yoshino, Hideaki Shimizu, Takaaki Mori, Yoshihiko Furuta, Mao Shibata, Tomoyuki Ohara, Jun Hata, Yasuyuki Taki, Shigeyuki Nakaji, Tetsuya Maeda, Kenjiro Ono, Masaru Mimura, Kenji Nakashima, Minoru Takebayashi, Toshiharu Ninomiya, and Shu-ichi Ueno for the JPSC-AD study group in Journal of Geriatric Psychiatry and Neurology
Footnotes
Acknowledgments
Author Contributions
AT, JI, TM, YT, and TN designed the research; BT, YT, HC, TO, TY, YY, HS, TM, YT, SN, TM, KO, MM, KN, JI, TN, and MT contributed to the acquisition of data and critical revision of the manuscript. YF, MS, TO, and JH contributed to critical revision of the manuscript; AT, JI, and SU wrote the paper with input from all authors. All authors read and approved the final manuscript.
Declaration of Conflicting Interests
The author(s) declared the following potential conflicts of interest with respect to the research, authorship, and/or publication of this article: Toshiharu Ninomiya received funds from the Japan Agency for Medical Research and Development and Suntory Holdings Limited (Osaka, Japan). The other authors assert that they have no competing interests.
Funding
The author(s) disclosed receipt of the following financial support for the research, authorship, and/or publication of this article: This work was supported by the Japan Agency for Medical Research and Development (JP22dk0207053) and Suntory Holdings Limited (Osaka, Japan). The funders had no role in the design of the study, the collection, analysis, and interpretation of data, or the writing of the manuscript.
Data Availability
All processed data generated during this study are provided in the main article and Supplementary Information. The raw data are not openly available to protect the confidentiality of participants and to comply with the terms of participant consent. Requests related to the raw data should be addressed to the principal investigator, Toshiharu Ninomiya (Department of Epidemiology and Public Health, Graduate School of Medical Sciences, Kyushu University, Fukuoka, Japan) [ninomiya.toshiharu.734@m.kyushu-u.ac.jp] and the Japan Agency for Medical Research and Development.
References
Supplementary Material
Please find the following supplemental material available below.
For Open Access articles published under a Creative Commons License, all supplemental material carries the same license as the article it is associated with.
For non-Open Access articles published, all supplemental material carries a non-exclusive license, and permission requests for re-use of supplemental material or any part of supplemental material shall be sent directly to the copyright owner as specified in the copyright notice associated with the article.