
Abstract
Research on people’s tendencies to over-, under-, or accurately estimate their abilities relies on assessments of self-perceived ability. Here, we investigated how the choice of an assessment method influences the conclusions drawn in research on two perspectives on accuracy. First, studies using the rank-order perspective are concerned with the correlation between self-perceived ability and an objective measure of “real” ability across individuals. Second, studies using the level perspective view the discrepancy between a person’s levels of self-perceived and real ability as an indicator of the degree of bias (vs. accuracy) and investigate the average discrepancy across people, individual differences in people’s discrepancies, or the association between the individual discrepancies and some outcome variable. In a cross-sectional survey of 281 participants, we assessed self-perceived intelligence in two domains (vocabulary knowledge, reasoning ability) with three measures each (percentile rank, IQ score, number of correct items). “Real” ability was measured with objective tests and transformed to match the scales of the self-assessments. We found that the measure for self-perceived intelligence impacted the conclusions drawn in analyses within the level but not the rank-order perspective. We discuss implications for the robustness of past findings and for the assessment of self-perceived intelligence in future studies.
Plain Language Summary
People’s views of their own cognitive abilities are not necessarily correct. While some people judge their skills quite accurately, others overestimate or underestimate their abilities. Researchers are interested in how accurate people see themselves, and whether differences between people in this accuracy are linked to outcomes such as life satisfaction. To study these questions, researchers need to decide how to ask people about their abilities. There are different ways to do this. The aim of our study was to examine whether different assessment methods lead to different findings on accuracy and its link to personal outcomes. We asked 281 participants to rate their vocabulary and reasoning skills using three different types of questions. We then compared how accurate these ratings were across methods. We found that the three methods led to different conclusions about how much people, on average, overestimated or underestimated their abilities. They also differed in how accuracy varied across individuals, for example, in how many people over- or underestimated their cognitive skills. Moreover, the relationship between accuracy and life satisfaction depended on how self-viewed ability was measured. In contrast, people’s accuracy in judging their relative position as compared to others remained consistent across methods. Overall, our results show that findings on how accurately people judge their own abilities, and how this accuracy relates to personal outcomes, can depend on how these judgments are measured. Researchers should therefore take care in selecting how they assess people’s views of their abilities.
Do people have insight into their cognitive abilities? That is, how accurate are people’s self-perceptions of their own intelligence in comparison with their “real” ability? And is it consequential to have an accurate, an overly positive, or an overly negative view of one’s own abilities? These questions about how accurately people see themselves and what this accuracy means for real-life outcomes become pressing in a world that is increasingly defined by narratives rather than truths. Despite the relevance of these questions and the extensive empirical investigations they have prompted, the field is still far from providing definite answers, as studies have delivered diverging and often even contradictory findings on how accurate people’s self-perceptions are (e.g., Gignac & Zajenkowski, 2019; Hofer et al., 2022; Mabe & West, 1982) as well as on whether individual differences in accuracy relate to real-life outcomes, such as life satisfaction (e.g., Dufner et al., 2019; Humberg et al., 2019).
In the present study, we considered two potential reasons that may account for the contradictory conclusions of previous research. First, previous studies have differed in whether accuracy was defined as the across-persons rank-order similarity between self-perceived ability and some objective measure that served as an indicator of “real” ability (rank-order perspective; e.g., Borkenau & Liebler, 1993; Chamorro-Premuzic et al., 2004; DeNisi & Shaw, 1977; Furnham & Chamorro-Premuzic, 2004) or as the (average or individual) degree of deviation between the levels of people’s self-perceptions and their real abilities (level perspective, e.g., Gignac & Zajenkowski, 2019; Noble et al., 2011; Robins & Beer, 2001; Westbrook et al., 1994). Second, within both perspectives, studies have differed in how they have assessed self-perceived intelligence, for example, by using rating scales, percentile ranks, IQ scales, or an estimate of the number of correct answers on an intelligence test (e.g., Ackerman & Wolman, 2007; Bipp et al., 2012; Furnham & Grover, 2020; Noble et al., 2011). The goal of our research was to investigate whether these two sources of variation may explain differences in empirical findings on the accuracy of ability self-perceptions and the relationship between individual differences in this accuracy and personal outcomes.
Previous studies that aimed to explain the inconsistencies in findings on the accuracy of self-perceptions and the consequences of individual differences in this accuracy have emphasized the conceptual difference between the rank-order perspective and the level perspective (e.g., Gignac & Zajenkowski, 2019; John & Robins, 1994) and between results obtained with different assessment methods for self-perceived intelligence (e.g., Freund & Kasten, 2012; Holling & Preckel, 2005; Mabe & West, 1982; von Stumm, 2014). However, these previous studies have been confined to comparing rating-scale measures with alternative formats. This focus has imposed two major limitations. First, the studies have been limited in terms of their informativeness when taking a level perspective because rating-scale measures are inherently incommensurate with measures of objective intelligence, thereby preventing comparisons between self-perception and intelligence levels. Second, different measures of self-perceived ability that can be applied within both the rank-order and level perspectives have never been compared directly.
With the present study, we aimed to overcome these limitations by directly comparing three commensurable measures (percentile rank, IQ score, number of correct items) with respect to the accuracy of self-perceived intelligence and the relationship between individual differences in accuracy and personal outcomes. We expanded the scope to four relevant research questions. Specifically, we investigated whether differences in the measurement of self-perceived intelligence affect findings about (1) the rank-order similarity between self-perceived and real ability, (2) people’s average difference between self-perceived and real ability, (3) the distribution of the individual discrepancy scores of self-perceived and real ability, and (4) the relationship between individual discrepancy scores and personal outcomes. In a nutshell, we aimed to show that the choice of method for assessing self-perceived intelligence is influential for answering questions about accuracy and its real-life relevance. As we discuss below, we hope that our study will thus raise awareness for a justified selection of assessment methods, and ultimately, will lead to more stringent conclusions about the accuracy of people’s self-perceptions and what individual differences in accuracy means for personal outcomes in future studies on self-perceived intelligence.
Two Perspectives on the Accuracy of Self-Perceived Ability
Generally, research on the accuracy of people’s ability self-perceptions can be allocated to two research perspectives (for a similar differentiation, see Gignac & Zajenkowski, 2019; John & Robins, 1994; Robins & John, 1997). The first perspective is the rank-order perspective, which addresses the extent to which the rank-order of people’s self-perceptions is in line with their true ability positions relative to each other. Conclusions about accuracy are usually based on the correlation between some measure of self-perceived ability and an objective measure of “real” ability (John & Robins, 1994; e.g., Borkenau & Liebler, 1993; Chamorro-Premuzic et al., 2004; DeNisi & Shaw, 1977; Furnham & Chamorro-Premuzic, 2004). Likewise, research taking the rank-order perspective has tackled questions referring to this rank-order correlation, for example, the strength of this correlation for different ability domains (Ackerman & Wolman, 2007; Freund & Kasten, 2012; Mabe & West, 1982), its comparison with the rank-order similarity of traits other than intelligence (e.g., personality traits; Chamorro-Premuzic et al., 2004; Furnham & Chamorro-Premuzic, 2004), or the extent to which it depends on gender or cultural group membership (Freund & Kasten, 2012; Furnham & Fong, 2000; Furnham & Rawles, 1999; Reilly et al., 2022). Notably, within the rank-order perspective, accuracy is defined across a group of people. Thus, research taking the rank-order perspective can investigate the accuracy for a certain group or compare accuracy across groups, whereas this perspective does not allow investigations of individual differences in accuracy or their relation with individual differences in outcome variables.
One important attribute of accuracy as defined within the rank-order perspective is that, because it is concerned with comparing the rank-orders of self-perceptions and real abilities across people, it is insensitive to potential differences in the levels of the two variables (John & Robins, 1994; Robins & John, 1997). For example, the rank-order accuracy would be perfect (correlation of 1) in a sample of people whose self-perceptions consistently exceeded their ability levels by the same amount (e.g., if all individuals’ estimates of their intelligence were 10 IQ points higher than their actual intelligence).
By contrast, the level perspective focuses on the degree to which the levels of people’s self-perceived and real abilities are similar. For this purpose, some measure of discrepancy between self-perceived and real ability is calculated to depict level deviation. For example, a common choice is the algebraic difference between the self-perception score and the real ability score (e.g., self-estimated IQ score minus objectively measured IQ score; Gignac & Zajenkowski, 2019). The resulting discrepancy score indicates an (almost) accurate self-perception when it is (close to) zero, a respective amount of overestimation when it is positive (self-perception higher than real ability), and underestimation when it is negative (self-perception lower than real ability). The discrepancy score can thus be calculated for individuals and across groups and can be interpreted with respect to both size and direction (John & Robins, 1994; Schriber & Robins, 2012).
Within the level perspective, different research questions have evolved throughout the years. Early studies in this field typically investigated whether, on average, people tend to overestimate their ability level or whether they instead tend to maintain an accurate or even deflated view of their abilities (Dunning et al., 2004; e.g., Gabriel et al., 1994; Gignac & Zajenkowski, 2019; Reilly & Mulhern, 1995). For example, when the average self-assigned IQ score was found to be higher than the average objectively measured score, it was concluded that, on average, people tended to overestimate their intellectual ability. Other studies zoomed in on potential differences between people in terms of their tendencies to over-, under-, or accurately estimate their ability (Schriber & Robins, 2012; e.g., Dufner et al., 2012; Luo et al., 2020; Stankov & Crawford, 1996). To this aim, researchers have considered the distribution of individual discrepancy scores, which was typically found to show substantial variation across individuals (Chung et al., 2016; John & Robins, 1994; Schriber & Robins, 2012; Westbrook et al., 1994). Whereas this variation in itself has often been of interest, it has also motivated a large body of research investigating how this variation is related to individual differences in personal outcomes, especially in personal adjustment (e.g., Colvin et al., 1995; Dufner et al., 2019; He & Côté, 2019; Humberg et al., 2019; Taylor & Brown, 1988).
Relevance of the Method Used to Assess Self-Perceived Ability
Although a large body of research has targeted the accuracy of self-perceived intelligence and the consequences of individual differences in accuracy, the accumulated evidence is still highly inconclusive—even when comparing studies that took the same perspective on accuracy. Within the rank-order perspective, conflicting evidence has been reported about the question of whether and to what extent people can accurately estimate their ability rank. Estimations of the rank-order correlation summarized in the meta-analysis by Mabe and West (1982) ranged from −.26 to .80, and further studies as well as a meta-analysis by Freund and Kasten (2012) could only partly reduce divergence in these findings. Turning to the level perspective, individuals’ average degree of accuracy in assessing their abilities remains unclear. Whereas some studies have identified a tendency for people to overestimate (Gignac & Zajenkowski, 2019; Heck et al., 2018), others have suggested that people underestimate their abilities on average (Hofer et al., 2022). Moreover, numerous articles that have addressed the relationship between individual differences of accurate self-perceptions and personal outcomes have delivered arguments and evidence for a variety of different, even contradictory hypotheses. For example, whereas some studies have indicated benefits of accurate self-estimations (Kim & Chiu, 2011; Kim et al., 2010), others have suggested that self-views need to be as positive as possible (and thus potentially exaggerated) to yield the most positive personal outcomes (Dufner et al., 2019; see Humberg et al., 2019, for a full overview of competing hypotheses).
One potential explanation for the inconsistencies in findings within each perspective is that studies have varied in the method they applied to assess people’s self-perceived intelligence (e.g., Freund & Kasten, 2012; Holling & Preckel, 2005; Mabe & West, 1982; von Stumm, 2014). A common approach for assessing self-perceived intelligence is to use items that ask participants to estimate their intelligence on a Likert scale (e.g., ranging from 1 = very low intelligence, to 7 = very high intelligence; Bipp et al., 2012; Dufner et al., 2013; Zajenkowski et al., 2016) or on a continuous rating scale (e.g., a visual analogue scale ranging from −3 = very low intelligence, to 0 = average intelligence, to +3 = very high intelligence; Rammstedt & Rammsayer, 2000, 2002). Rating-scale items have the advantage that they are straightforward to implement in standard self-report questionnaires. However, one major disadvantage is that they are applicable only when taking a rank-order perspective, whereas they are not suitable when taking a level perspective. The reason is that comparing the levels of self-perceived and real ability is only meaningful if the two variables are assessed on commensurable scales—that is, when they refer to the same construct and are available at the same numerical scale (Schönbrodt, 2016). Only if commensurability is given does it make sense to compute and inspect the discrepancy between people’s self-perceived and real ability scores. If, by contrast, self-perception is assessed with a rating scale (e.g., is a number between 1 and 7), it cannot be reasonably compared with the number of items solved correctly (e.g., a number between 0 and 37) on an intelligence test.
Some studies that have taken a level perspective have nevertheless employed rating-scale measures. The resulting problem of incommensurability in these studies has typically been addressed by z-standardizing the self-perceived and real ability scores to force them onto the same numerical scale (e.g., Humberg et al., 2018). However, this procedure has the limitation that the conceptual meaning of accuracy refers to accuracy in terms of z-scores. In particular, the question of whether a person’s self-assessment is considered accurate strongly depends on the characteristics of the other people in the sample at hand, a practice that seems unjustified and does not reflect the arguments of psychological accuracy theories (Humberg et al., 2022). In our view, rating-scale assessments should therefore be avoided when taking the level perspective and should be replaced by an assessment method that allows for a commensurable measurement of self-perceived and objective intelligence in the first place.
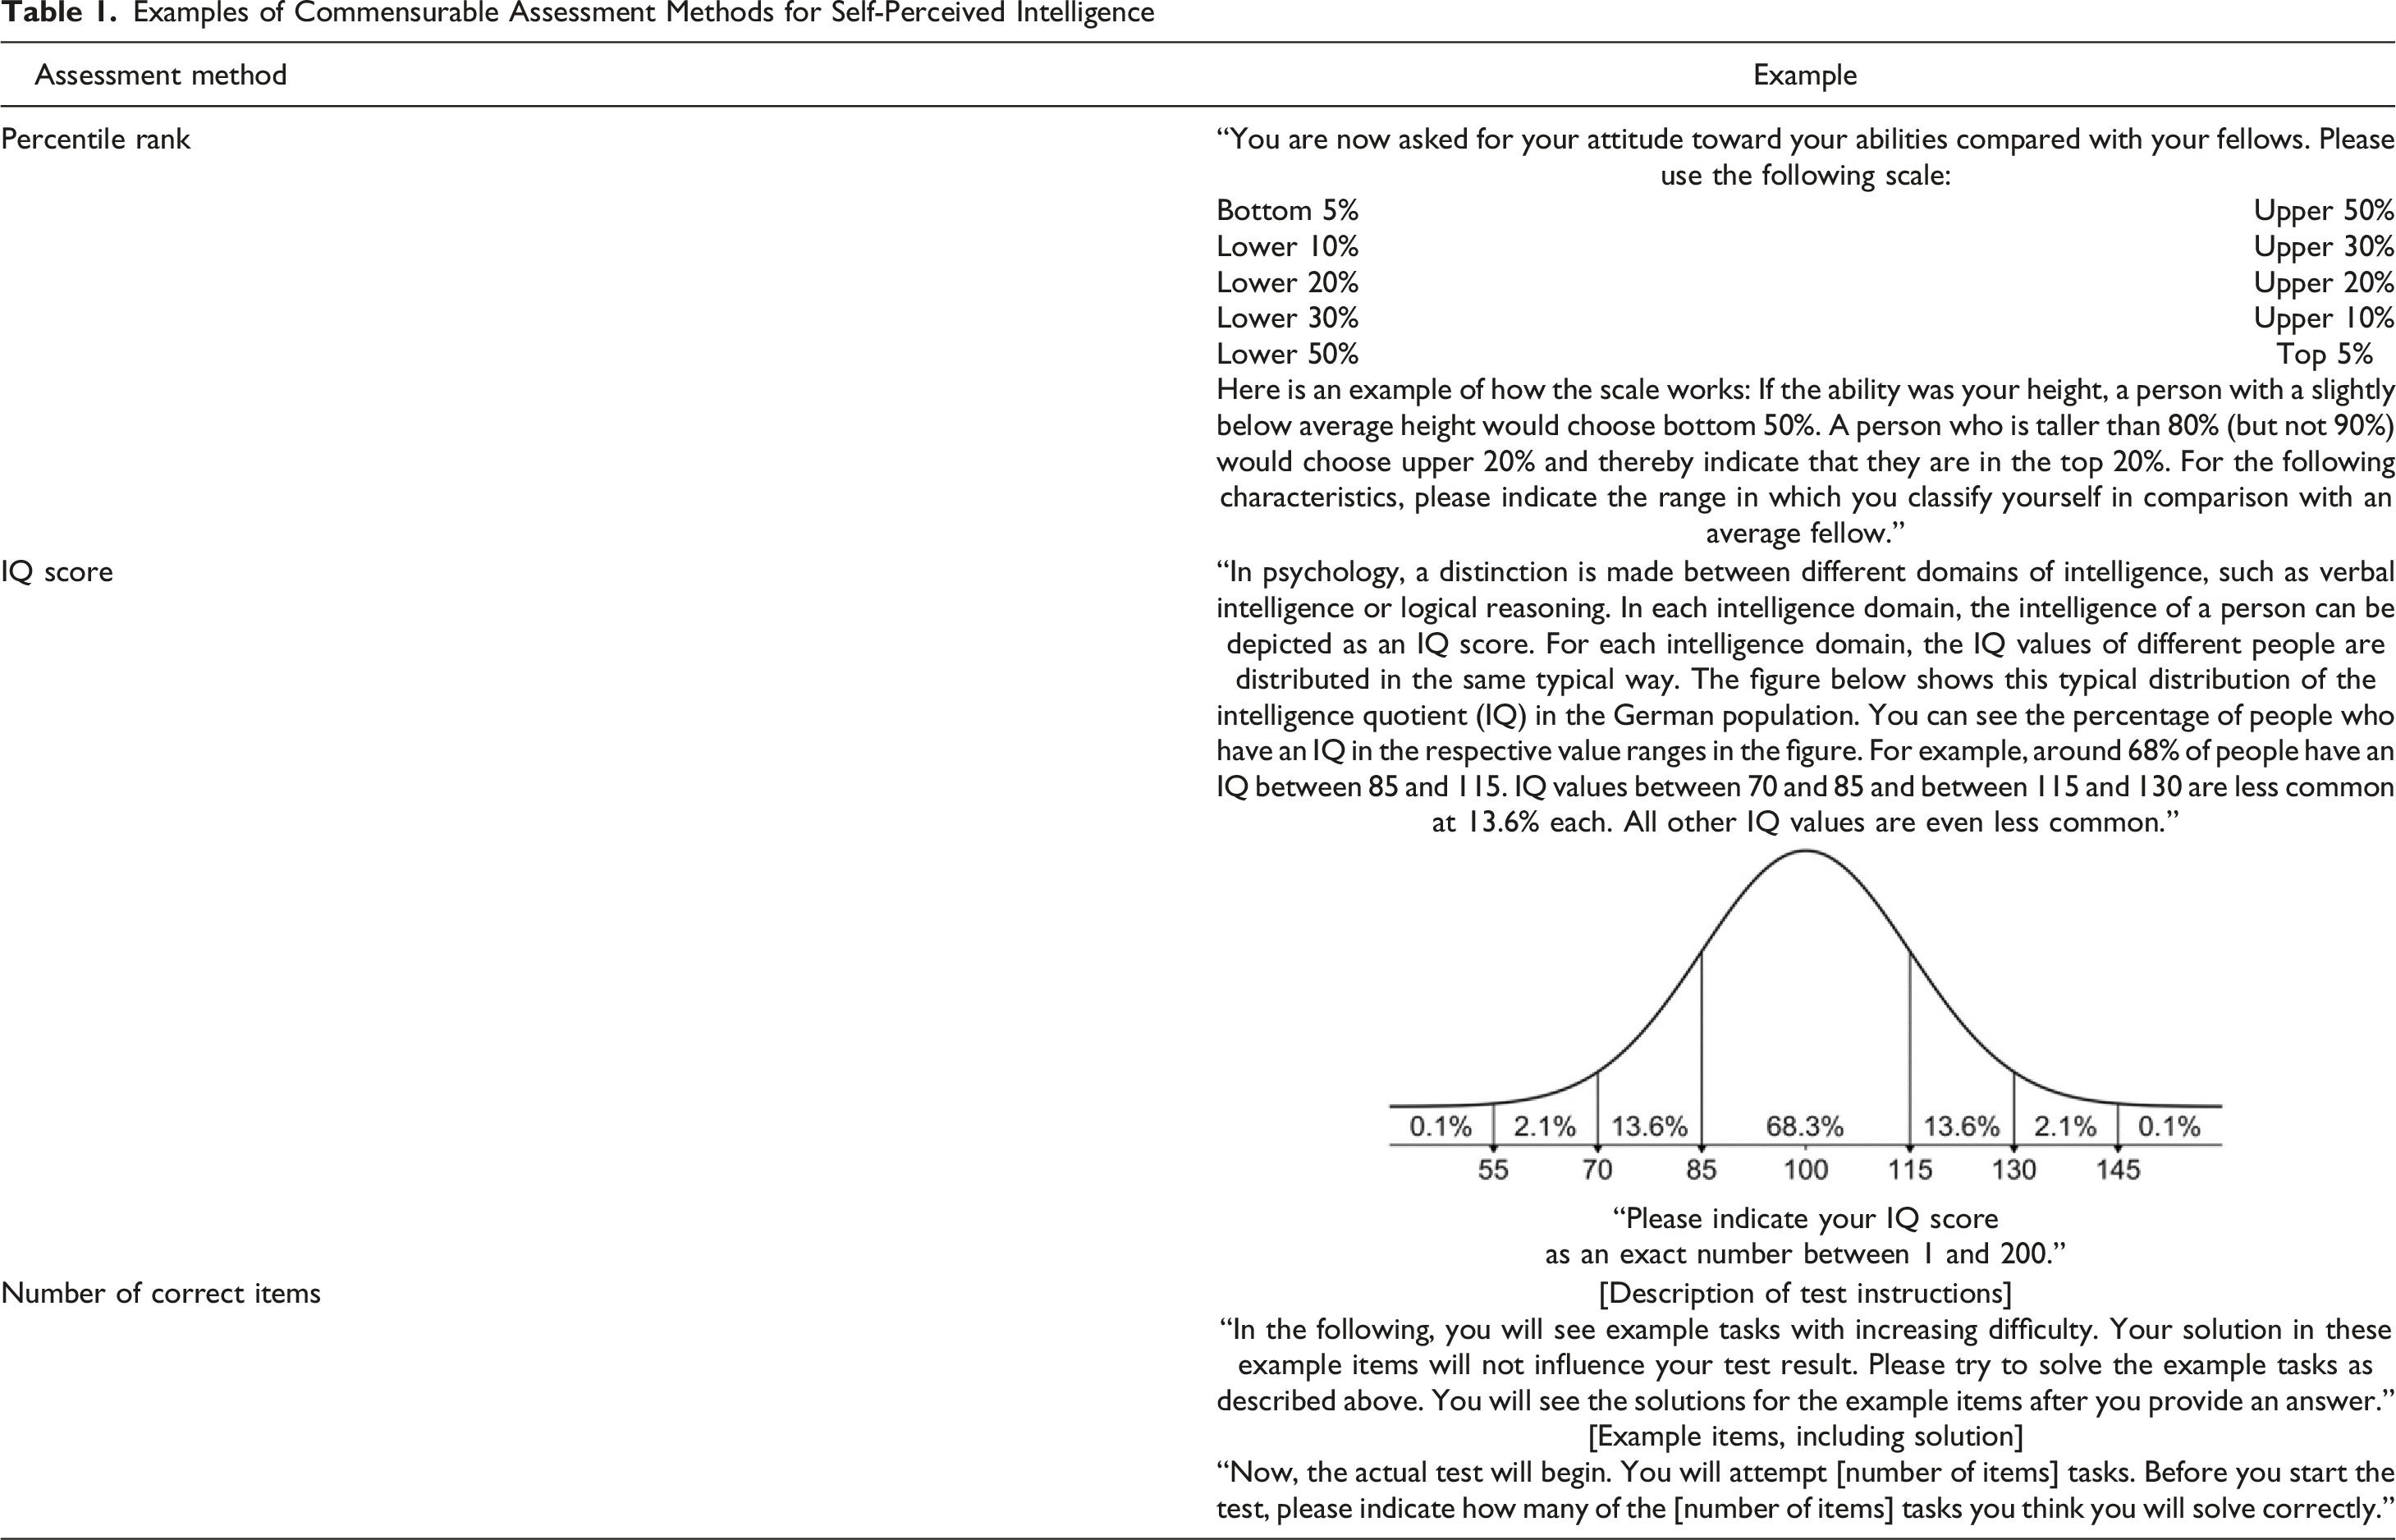
Examples of Commensurable Assessment Methods for Self-Perceived Intelligence
Operationalization of Accuracy by Perspective and Assessment Method
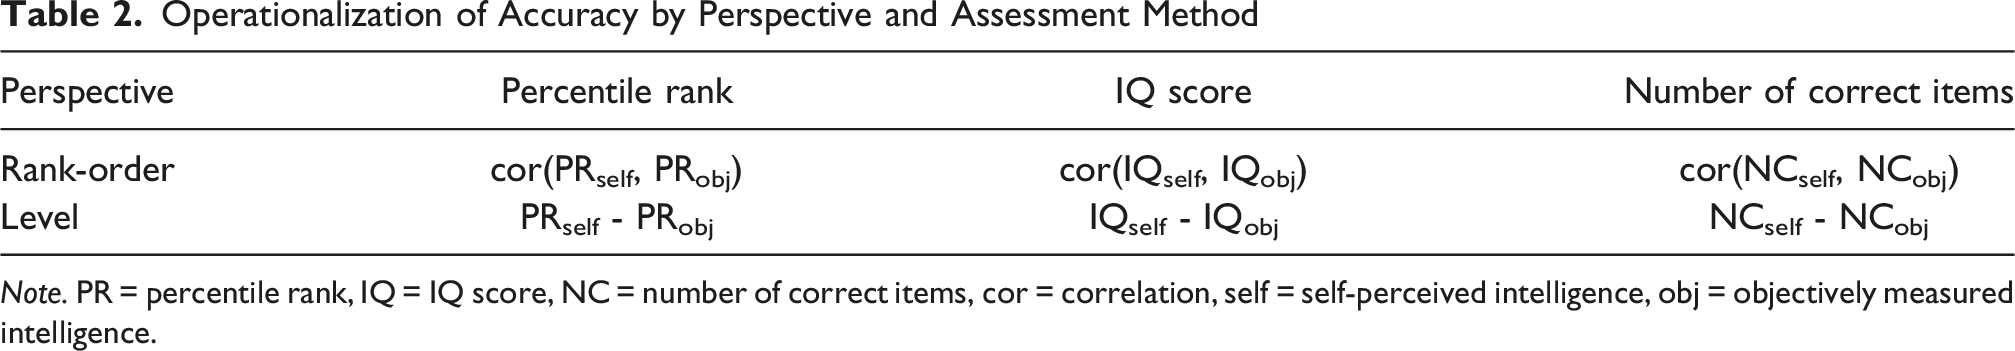
Note. PR = percentile rank, IQ = IQ score, NC = number of correct items, cor = correlation, self = self-perceived intelligence, obj = objectively measured intelligence.
There is initial evidence that the variability in the methods used to assess self-perceptions may partly explain the inconsistencies in the findings on accuracy and the consequences of individual differences in accuracy. Specifically, multiple studies from the rank-order perspective have found that the size of the correlation between self-perceived and real ability differed when comparing some rating-scale method with another rating-scale measure (Paulhus et al., 1998) or with an IQ score assessment (von Stumm, 2014; but see Hofer et al., 2022). The correlation was also found to be affected by characteristics of the instructions (e.g., provision of a general vs. specific social comparison group; Freund & Kasten, 2012; Mabe & West, 1982) and the time point of the self-assessment (providing the estimation before vs. after the ability test; Ackerman & Wolman, 2007). Thus, conclusions concerning the fundamental question of whether people perceived their intelligence accurately with respect to rank order seem to vary on the basis of differences in assessment methods. A similar observation holds for studies that have taken a level perspective. That is, conclusions about the average degree of accurate, over- or underestimation have differed when comparing a percentile rank with a rating scale (Holling & Preckel, 2005) and when comparing an IQ measure with a rating-scale measure (von Stumm, 2014). Also, studies that have used different assessment methods have arrived at different conclusions about how individual differences in accuracy relate to personal outcomes (e.g., Noble et al., 2011; Zajenkowski, 2021).
Despite the fact that such prior work has pointed to the influence of the assessment method on findings on accuracy and the consequences of individual differences in accuracy, empirical studies within both perspectives have frequently included only a single assessment method, usually without a clear justification for its choice. This practice raises the concern that the choice may be somewhat arbitrary while heavily influencing the studies’ results. One reason for this lack of transfer of the results into practice may be that all studies comparing assessment methods have, to our knowledge, compared a rating-scale measure with an alternative assessment method, for example, a percentile rank (Hofer et al., 2022; von Stumm, 2014) or an IQ scale (Holling & Preckel, 2005). This focus on rating-scale measures limits the applicability of results in two ways.
First, comparing a rating scale with an alternative measure is in our view only useful within the rank-order perspective due to the incommensurability of the rating-scale measure. The directed difference between self-perceptions answered on a rating scale and an ability test score are inherently meaningless, and thus, cannot reasonably be compared across the methods used to assess self-perceptions. Second, we are not aware of any studies that have compared findings on accuracy and the consequences of individual differences in accuracy using percentile rank versus IQ or versus the number of items that the participant correctly estimated within the rank-order perspective or the level perspective. For these three assessment methods, it is thus unclear whether the choice of one method influences the subsequent findings on the accuracy of self-perceptions or on how individual differences in accuracy are associated with outcomes. In the present research, we addressed the limitations of previous research by providing a comprehensive comparison of the three commensurate assessment methods (percentile rank, IQ score, number of correct items) from the two research perspectives (rank order, level) with regard to four research questions (rank-order similarity, average of individual discrepancy scores, distribution thereof, and their relationship with life satisfaction). We thus aimed to provide a comprehensive evaluation of how the method used to assess self-perceived intelligence influences findings on accuracy and the consequences of individual differences in accuracy, and ultimately, to make suggestions for researchers selecting an assessment method for self-perceived intelligence.
The Present Study
The goal of the present research was a comprehensive investigation of how the choice of a measure of self-perceived intelligence influences empirical findings on the accuracy of self-perceptions and the relationship between individual differences in accuracy and personal outcomes. To this end, we compared results on the accuracy of self-perceptions and consequences of individual differences in accuracy obtained using three commensurable assessment methods, namely, percentile rank, IQ score, and number of correct items. For the rank-order perspective, we examined whether empirical findings on the rank-order similarity between self-perceived and real ability are influenced by the choice of assessment method. For the level perspective, we first considered whether the assessment method affects the discrepancy between people’s average self-perceived ability and their average real ability as an estimate of people’s average tendency to over- or underestimate their ability. Second, we considered effects of the assessment method on the distribution of the individual discrepancies between self-perceived and real ability, which, inter alia, reflect the amount of variation across people. And third, we examined whether findings on the relationships between these individual discrepancies and personal outcomes differed depending on the measurement of self-perceived ability. Here, we focused on personal adjustment as an outcome variable because a large body of research on the consequences of individual differences in self-perception accuracy addressed well-being (e.g., Dufner et al., 2012; He & Côté, 2023; Robins & Beer, 2001). We chose life satisfaction as an indicator of personal adjustment because of its frequent use in capturing the cognitive aspect of well-being (Eid & Diener, 2004) and in research on the consequences of individual differences in self-perception accuracy (e.g., Humberg et al., 2019; Zajenkowski, 2021). In line with the two-factor theory of intelligence by Cattell (1941, 1963), we differentiated between the domains of crystallized (vocabulary knowledge) and fluid (reasoning ability) intelligence. Our study was exploratory in nature.
Method
The data for this study were collected at the universities of Leipzig and Münster in 2018, so during a time when it was not yet mandatory to obtain ethical permission for nonmedical research. The research was conducted ethically in accordance with the World Medical Association Declaration of Helsinki.
Before any analyses were run, the research questions and analytical strategy were preregistered (osf.io/mebt9). The first author was the first to analyze these data and gained access to them after the preregistration had been completed.
Sample
The recruitment for the study mainly addressed university students. A total of 296 participants took part in the study. Participants were excluded from the analyses if they were younger than 18 (N = 4), not fluent in German (N = 7), or showed evidence of careless responding (N = 4; see preregistration at osf.io/mebt9 for details on these criteria), resulting in a final sample size of N = 281. To check whether our analyses were sufficiently powered, we conducted a simulation-based power analysis with this sample size (see Supplement A at osf.io/kg8v4 for more details). The results showed that we were able to detect meaningful differences between assessment methods with a power that ranged from 73% and 99% per analysis set.
Eighty six percent of the participants were female, 12% were male, and 1% indicated another sex. The sample had a mean age of 23.76 (SD = 6.33). Fifty four percent of the participants studied psychology, 26% studied another subject, and 20% were nonstudents. As compensation, the participants took part in a lottery for vouchers and could receive feedback on their cognitive abilities. Participants studying psychology also earned partial course credit.
We had no missing data but removed between zero and four outliers per variable (i.e., at most, 1.4% of the values; see preregistration at osf.io/mebt9 and Supplement B at osf.io/kg8v4 for details). We handled the resulting missingness with pairwise deletion when computing correlations or descriptive statistics (means, standard deviations) and with FIML estimation in the analysis on the relationship between the individual degree of accuracy and life satisfaction.
Procedures
The data were collected via an online survey that participants completed on their personal devices, taking about 25 to 45 min (Mdn = 32.62, q0.25 = 26.28, q0.75 = 43.06). All participants provided written informed consent before participating in the study. Participants first completed demographic and personality questionnaires, including a measure of life satisfaction. Then, they provided estimates of their intelligence as a percentile rank, IQ score, and the number of correct items. Finally, they completed two psychometric intelligence tests.
Measures
We used a subset of all the data that had been collected for our analyses (complete codebook available at osf.io/kg8v4). The intercorrelations of all measures we used can be found in Supplement C (osf.io/kg8v4). Next, we describe the respective measures, organized by construct. The chronological sequence of administration is detailed in the Procedures section and documented in the codebook (see osf.io/kg8v4).
“Real” Intelligence
Participants’ vocabulary knowledge, as an indicator of their crystallized intelligence, was measured with the MWT-B (Mehrfachwahl-Wortschatz-Intelligenztest, version B; Lehrl, 2005). The MWT-B is a German vocabulary knowledge test consisting of 37 items. Each item presents five “words,” only one of which is a real German word. Participants are instructed to detect the correct word. We summed the number of correctly solved items, and used norms provided by Lehrl (2005) to achieve PRs and IQs. On average, participants completed 29.67 items correctly (SD = 2.95), corresponding to an average percentile rank of 68.63 (SD = 19.08) and an average IQ of 109.29 (SD = 11.95). The internal consistency of the MWT-B was .65.
Participants’ reasoning ability, as an indicator of fluid intelligence, was assessed with a 15-item version (Denissen et al., 2011) of Raven’s advanced progressive matrices, set II (Raven et al., 1962b). Participants were asked to choose a figure from eight alternatives to complete a 3 × 3 matrix per item. We summed the number of correct items and converted it to PRs and IQs using data from Geukes et al. (2019; PILS study; osf.io/q5zwp) as a norming sample. Participants solved an average of 9.24 items (SD = 2.98), which corresponds to an average percentile rank of 64.78 (SD = 27.90) and an average IQ of 105.34 (SD = 14.56). The internal consistency was .74.
Self-Perceived Intelligence
First, participants estimated their intelligence in terms of a percentile rank. To this aim, they were asked to indicate their vocabulary knowledge and reasoning ability using the instructions and scale of the Self-Attributes Questionnaire (SAQ; Pelham & Swann, 1989), as shown in Table 1. We transferred the resulting percentile rank ranges (e.g., “bottom 5%”) to the minimal percentile rank in the respective range (e.g., 0) to achieve commensurability with the exact PRs obtained with the objective intelligence tests. Thus, the resulting PRs were 0 (“bottom 5%”), 6 (“lower 10%”), 11 (“lower 20%”), 21 (“lower 30%”), 31 (“lower 50%”), 50 (“upper 50%”), 70 (“upper 30%”), 80 (“upper 20%”), 90 (“upper 10%”), and 95 (“top 5%”). Participants’ average self-estimated percentile rank was 63.80 (SD = 21.27) for vocabulary knowledge and 66.18 (SD = 20.34) for reasoning ability.
Second, participants estimated their abilities as IQ scores. The introductory text explained the intelligence quotient with a depiction of a normal curve, as shown in Table 1. Participants indicated their IQ for vocabulary knowledge and reasoning ability separately, using a slider ranging from 1 to 200. The average self-perceived IQ was 111.99 (SD = 12.13) for vocabulary knowledge and 108.77 (SD = 13.02) for reasoning ability.
Third, participants estimated the number of correct items they thought they would answer in the following ability tests after they had read the tests’ instructions and saw three example items from the tests’ parallel versions (MWT-A; Lehrl et al., 1974; Raven Advanced Progressive Matrices, set I; Raven et al., 1962a; see Table 1 and the Codebook at osf.io/kg8v4). The average self-perceived number of correct items was 23.98 (SD = 6.18) for vocabulary knowledge and 8.76 (SD = 2.33) for reasoning ability.
Life Satisfaction
As an indicator of personal adjustment, we assessed life satisfaction using the German version (Schumacher, 2003) of the Satisfaction With Life Scale (SWLS; Diener et al., 1985). The SWLS consists of five items (e.g., “In most ways my life is close to my ideal”), rated on a scale ranging from 1 (strongly disagree) to 7 (strongly agree). For each participant, we used the mean across the five items as a measure of their life satisfaction. The average score across individuals was 4.78 (SD = 1.42). The SWLS had an internal consistency of .90.
Results
Descriptive Coefficients on the Accuracy of Self-Perception
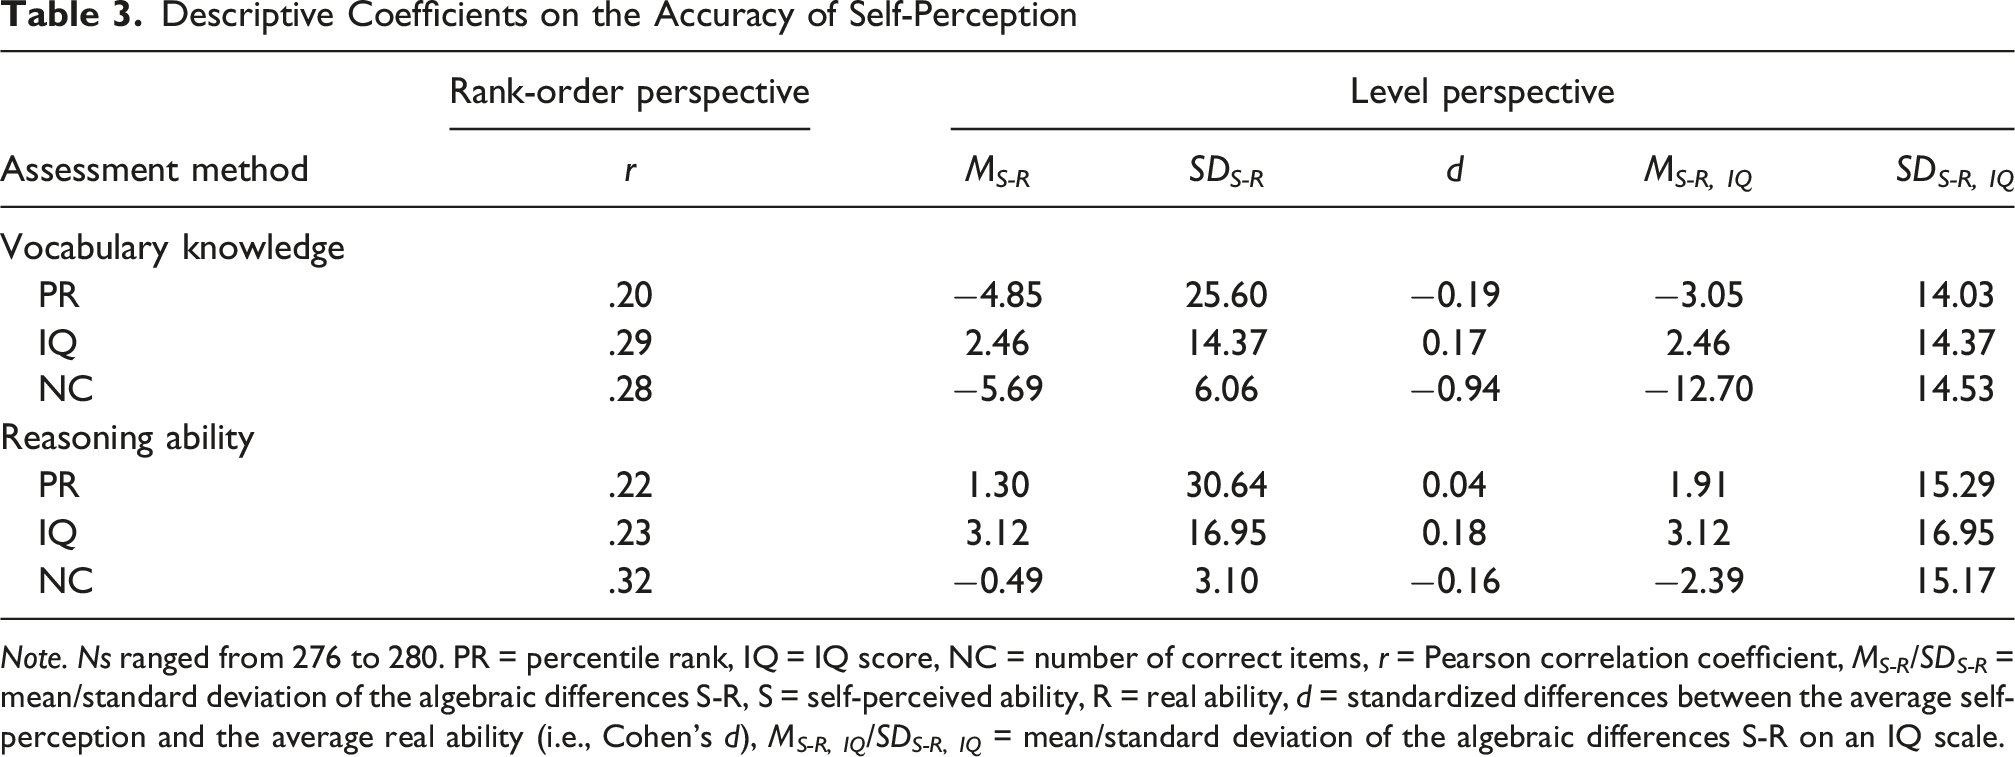
Note. Ns ranged from 276 to 280. PR = percentile rank, IQ = IQ score, NC = number of correct items, r = Pearson correlation coefficient, M S-R /SD S-R = mean/standard deviation of the algebraic differences S-R, S = self-perceived ability, R = real ability, d = standardized differences between the average self-perception and the average real ability (i.e., Cohen’s d), MS-R, IQ/SDS-R, IQ = mean/standard deviation of the algebraic differences S-R on an IQ scale.
Comparisons of Assessment Methods
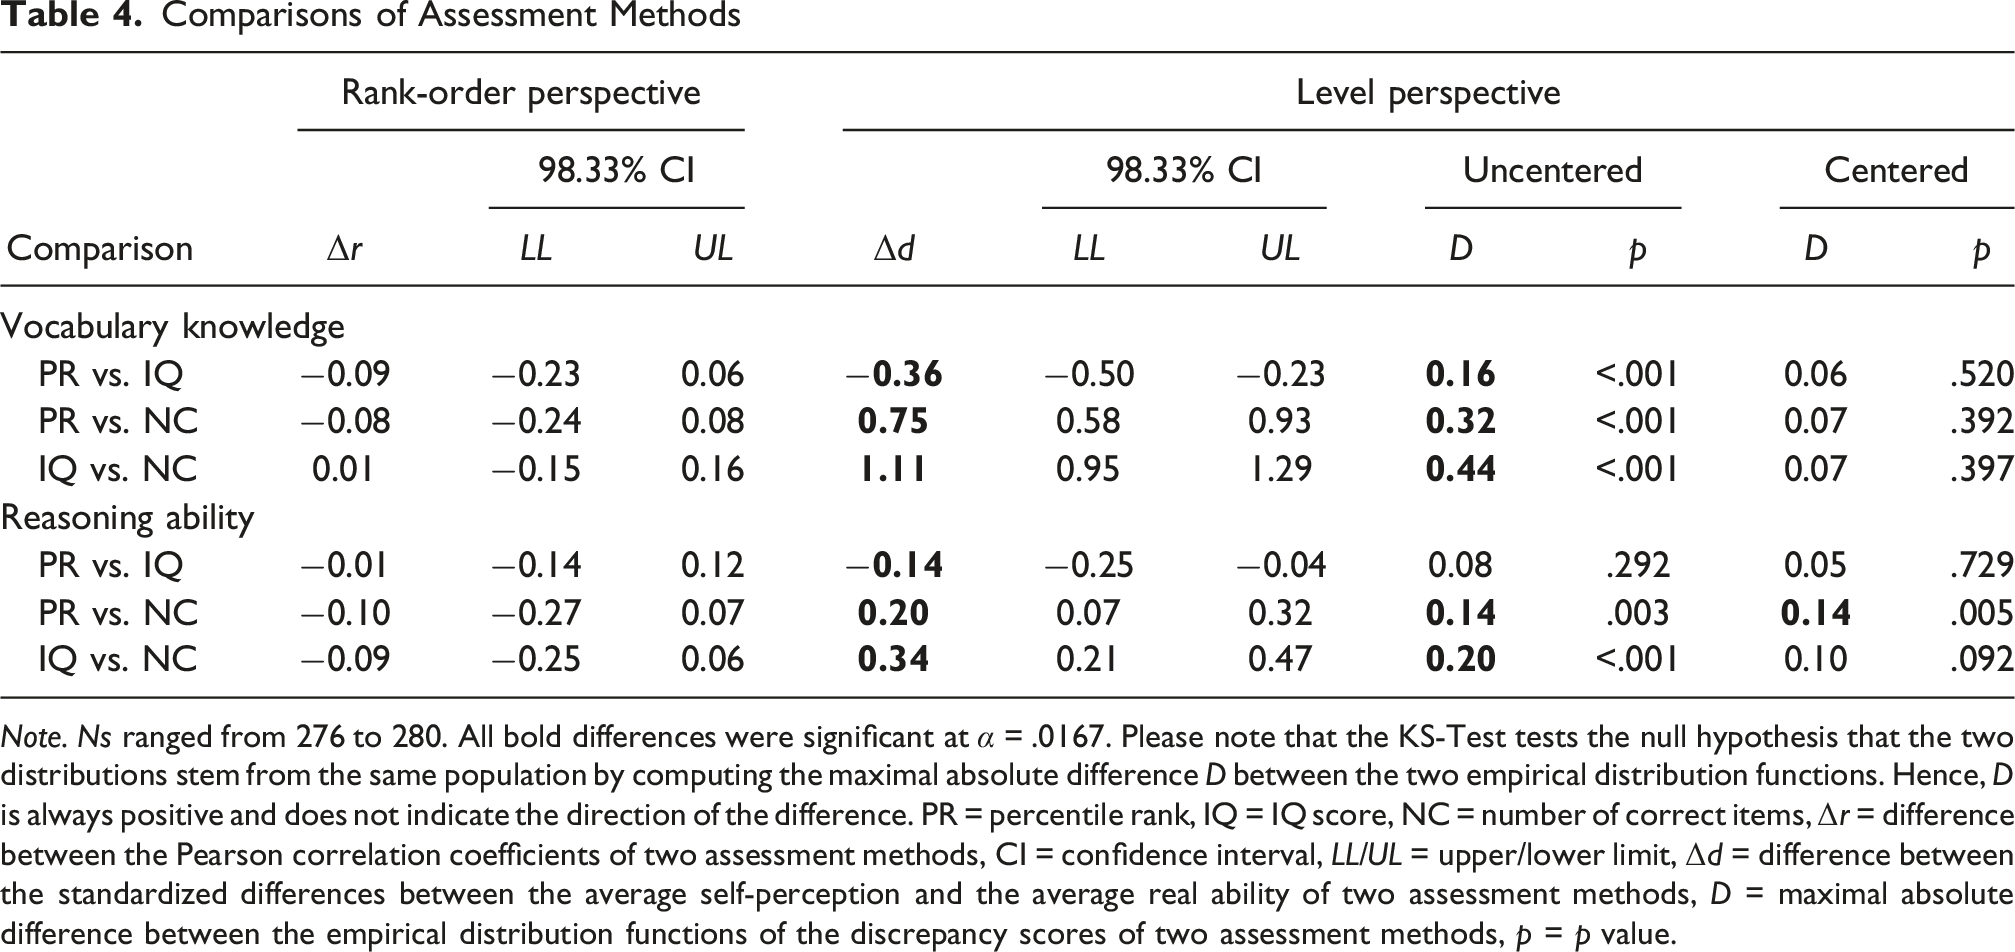
Note. Ns ranged from 276 to 280. All bold differences were significant at
Rank-Order Perspective
From the rank-order perspective, the across-persons rank-order similarity between self-perceived and real ability is considered an indicator of the overall accuracy in people’s self-perceptions. To compare the three methods in terms of accuracy as defined in the rank-order perspective, we first calculated the Pearson correlation between self-perceived and real ability for each of the three assessment methods. For all assessment methods and in both intelligence domains, these correlations were moderate in size, ranging from .20 (percentile rank, vocabulary knowledge) to .32 (number of correct items, reasoning ability; see Table 3). We then compared the three correlation coefficients in both ability domains and computed the confidence intervals of their pairwise differences to test whether the correlations significantly differed. We computed the confidence intervals with Zou’s (2007) formula for nonoverlapping dependent groups, using the R package cocor (Diedenhofen & Musch, 2015). This formula accounts for the fact that the three correlations are based on the same assessment of real ability, but, due to the conversion of the real ability scores, are not fully interchangeable (i.e., real ability scores are strongly correlated but not exactly at 1; see Supplement D at osf.io/kg8v4 for a replication with the same, i.e., number of correct items, real ability scores for all correlations). To correct for multiple testing, we calculated 98.33% confidence intervals (Bonferroni-corrected significance level
Level Perspective
From the level perspective, accuracy in self-perceptions is depicted by agreement between the self-perceived and real ability scores. People with higher self-perceived than real ability are considered to overestimate their ability, and people with lower self-perceived than real ability to underestimate their ability. We applied a common operationalization to depict each participant’s degree of over-, under-, or accurate estimation by computing the algebraic difference between their self-perceived and real ability scores, separately for each intelligence domain and assessment method (i.e., resulting in six discrepancy scores per participant). Means and standard deviations are presented in Table 3 for each discrepancy score.
Average Discrepancy Across People
A first research question that is often of interest from the level perspective is whether, on average, people have an accurate self-perception. Thus, we aimed to compare the average discrepancy score for the three assessment methods. Because the discrepancy scores for the different assessment methods inherit the scale of the respective assessment method (percentile rank, IQ score, or number of correct items), their means cannot be compared with regular t tests. Thus, we computed the scaled average discrepancy between the self-perceptions and ability scores per assessment method. The scaled average discrepancy is the standardized difference between the average self-perception and the average real ability (i.e., Cohen’s d; see Table 3). For vocabulary knowledge and the assessment method IQ (d = 0.17), this average discrepancy was positive, indicating that people on average overestimated their verbal ability. The score was negative for the percentile rank measure (d = −0.19) and much lower for number of correct item measure (d = −0.94). For reasoning ability, the highest and positive score again resulted for the IQ assessment method (d = 0.18), followed by the score for the percentile rank (d = 0.04) and number of correct items measure (d = −0.16).
To statistically compare d across assessment methods, we used bootstrapped confidence intervals because we were not aware of a significance test for this scenario. We simulated the distribution of the differences between two d scores by drawing 281 blocks (each representing one participant; with replacement) per iteration for 10,000 iterations. Finally, we calculated the Bonferroni-corrected 98.33% confidence interval for each simulated distribution to test the pairwise differences between the three assessment methods’ Cohen’s d scores. In both intelligence domains, the Cohen’s d values differed across all the assessment methods (see the level perspective column in Table 4 for test statistics). Hence, the results indicated that the three assessment methods differed in the standardized discrepancy between the average self-perceived versus real ability, and thus, conclusions about people’s average tendency to over-, under-, or accurately estimate their abilities.
Distribution of Discrepancy Scores Across People
A second research question within the level perspective concerns the between-person variation in the discrepancy between self-perceived and real ability, or more generally, the distribution of the discrepancy scores across people. To enable a comparison of the distributions across assessment methods despite the methods’ different scales, we transformed the percentile rank and number of correct items self-perception scores into an IQ scale, using the above-described norms of the ability measures and assuming a normal distribution. Subsequently, we computed the IQ-scaled discrepancy scores for all methods and inspected their means, standard deviations (Table 3), and distributions (Figure 1). Because all scores were now on the same (IQ) scale, we could compare the distributions across methods. As can be seen in Figure 1, the distributions for all three assessment methods and both intelligence domains followed quite a consistent bell curve and were rather symmetrical and peaked. All discrepancy score distributions had rather similar spreads, with slightly larger spreads for reasoning ability (SDMax = 16.95 for IQ measu) than for vocabulary knowledge (SDMax = 14.03 for percentile rank). A comparison of the distributions’ means in Figure 1 shows that the average discrepancy was highest for the IQ scale, followed by the percentile rank and then the number of correct items scale. This pattern equals the one described above for the standardized averages, which is natural because the means in Figure 1 are unstandardized versions of Cohen’s d inspected above. IQ-scaled discrepancy score distributions. Note. Ns ranged from 276 to 280. All scores were transformed into the IQ scale. The vertical bars indicate the mean per assessment method. PR = percentile rank, IQ = IQ score, NC = number of correct items, S = self-perceived ability, R = real ability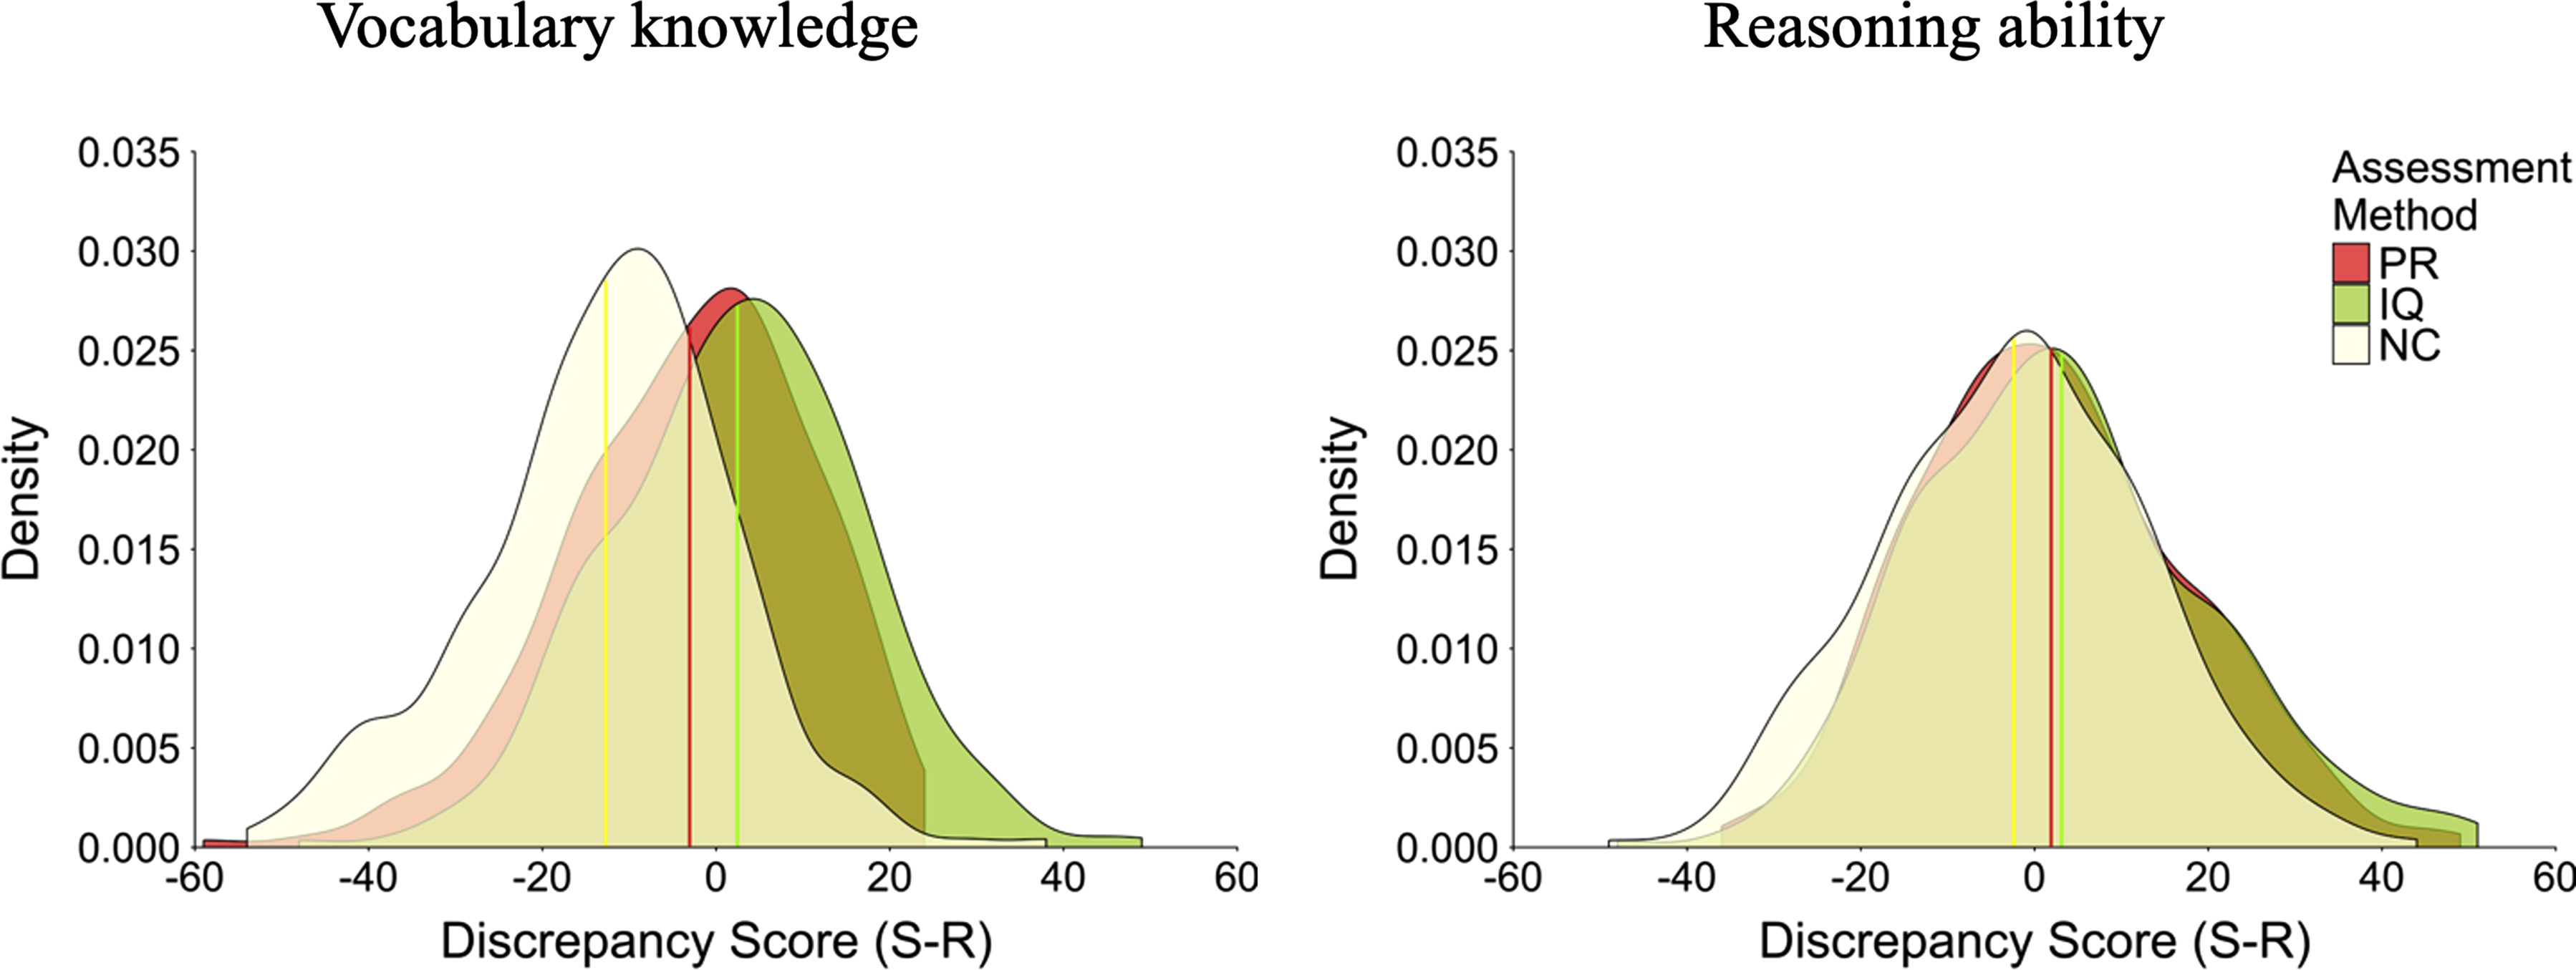
We conducted pairwise comparisons of the distributions with two-sided Kolmogorov-Smirnov (KS) tests (Bonferroni-corrected significance level
One potential explanation for the significant differences between the distributions can be found in the significant differences in their means that we reported above when comparing the scaled averages (see Table 4). We explored this possibility with an additional (not preregistered) analysis, aiming to reveal whether the differences in the distributions resulted “only” from differences in the distributions’ central tendency or also from differences in the distributions’ shape (e.g., skewness, kurtosis, spread). Thus, we repeated the two-sided KS tests using centered versions of the IQ-scaled discrepancy scores (Bonferroni-corrected
How Individual Differences in Accuracy Are Associated With Life Satisfaction
Turning to the third central research question within the level perspective, we investigated whether the method used to assess self-perceived ability impacted conclusions about whether and how individual differences in self-perception accuracy relate to personal outcomes. The literature provides multiple, partly contradictory hypotheses on these potential relationships, with no definite empirical support for one or another (for an overview, see Humberg et al., 2019). To compare all of these hypotheses simultaneously in terms of their empirical support, we adopted an analytical strategy from Humberg et al. (2019) that simultaneously considers several plausible patterns of the relationship and indicates the empirical evidence that each of the patterns has in the data. For example, this procedure can uncover whether personal outcomes are related to individual differences in people’s self-perception, their real ability, and/or to the discrepancy between self-perceived and real ability (i.e., self-perception accuracy).
Technically, the strategy is a combination of an information-theoretic (IT) approach (Burnham & Anderson, 2002) for model comparison and response surface methodology for deriving models that represent the plausible patterns (Edwards, 2002; Edwards & Parry, 1993). The details of the analytical strategy are described in the preregistration (osf.io/mebt9; for more details, see Humberg et al., 2019). In short, we considered all patterns of relationships that were theoretically plausible (see the preregistration at osf.io/mebt9 or Supplement E at osf.io/kg8v4 for an overview of hypotheses, graphical demonstrations, and mathematical formulations), estimated the corresponding models per assessment method with lavaan (version 0.6-18; Rosseel, 2012), and computed the Akaike weight w (Burnham & Anderson, 2002) for each model using the R package AICcmodavg (version 2.3-3; Mazerolle, 2023). A model’s Akaike weight can be interpreted as the probability that this model is the best model (in the sense of having a good fit while also being parsimonious) for describing the data from all alternative models that were considered. To ease interpretation, we determined, separately for each combination of assessment method and intelligence domain, the 95% confidence set of models that included the model with the highest Akaike weight and all next best models until the sum of their weights exceeded 95% (Burnham & Anderson, 2002; Humberg et al., 2019). Finally, after conducting this analysis for each assessment method separately, we descriptively compared the results across the three methods.
Comparisons of Assessment Methods: Vocabulary Knowledge
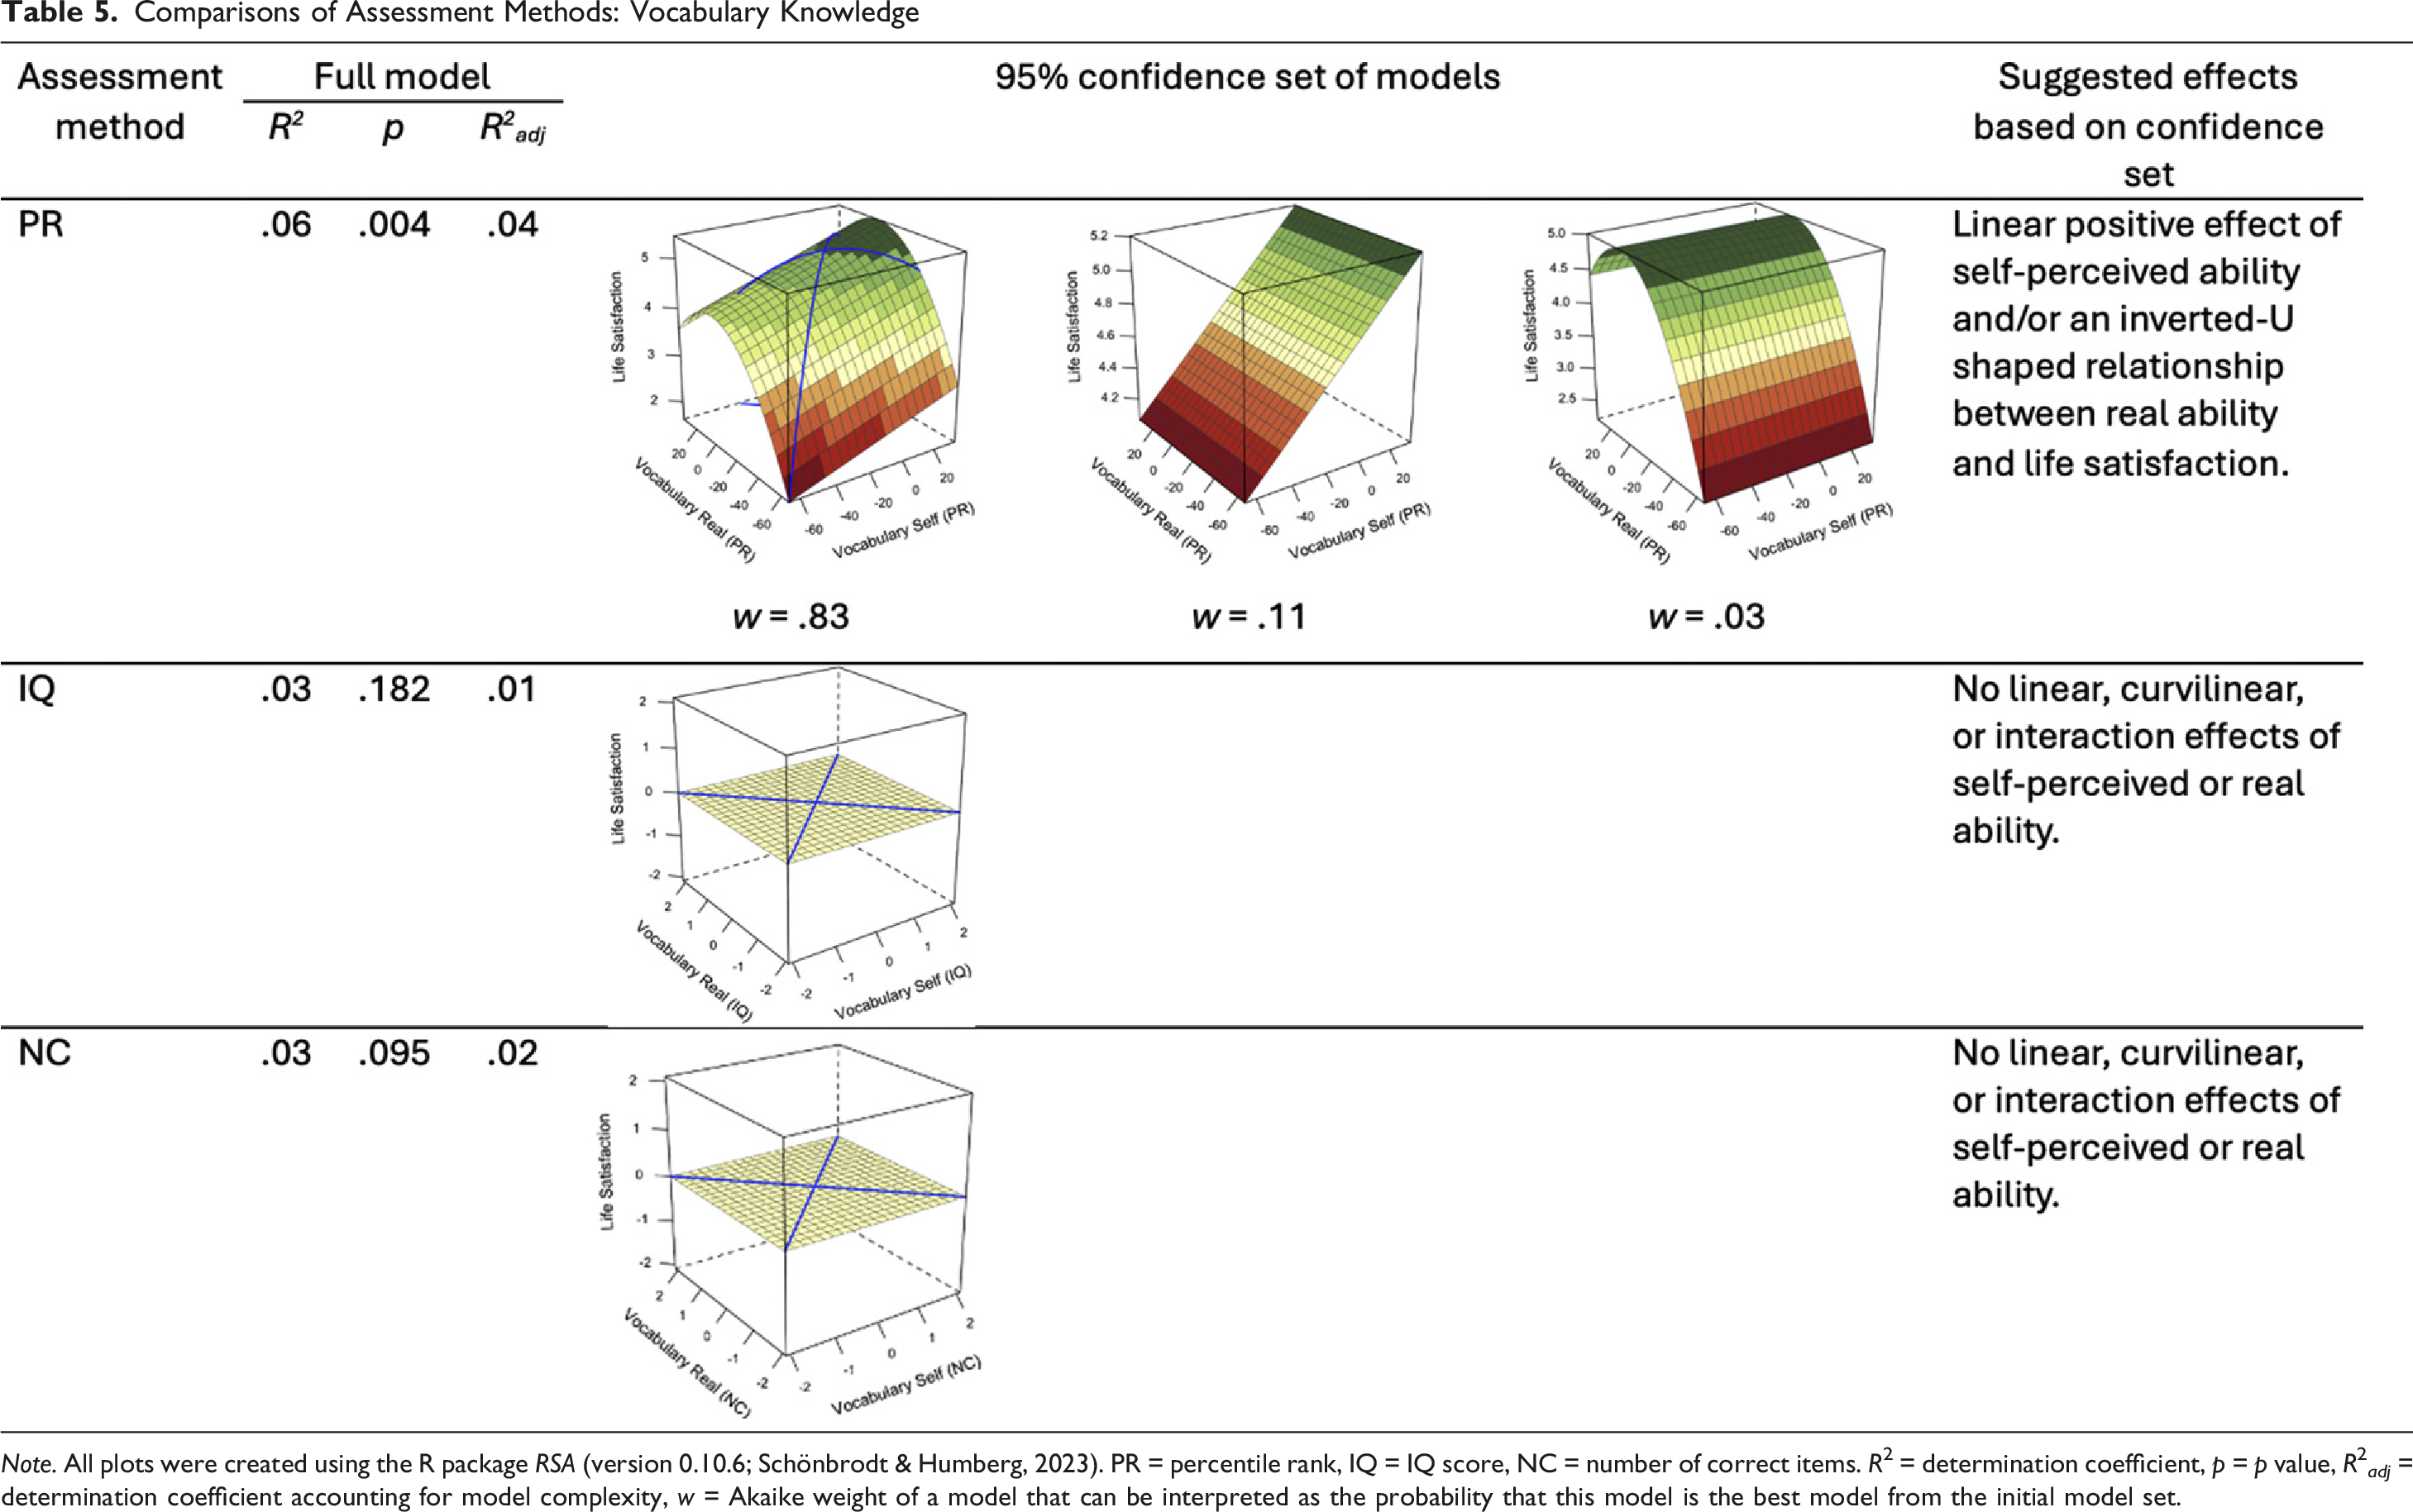

Note. All plots were created using the R package RSA (version 0.10.6; Schönbrodt & Humberg, 2023). PR = percentile rank, IQ = IQ score, NC = number of correct items. R2 = determination coefficient, p = p value, R2 adj = determination coefficient accounting for model complexity, w = Akaike weight of a model that can be interpreted as the probability that this model is the best model from the initial model set.
Comparisons of Assessment Methods: Reasoning Ability
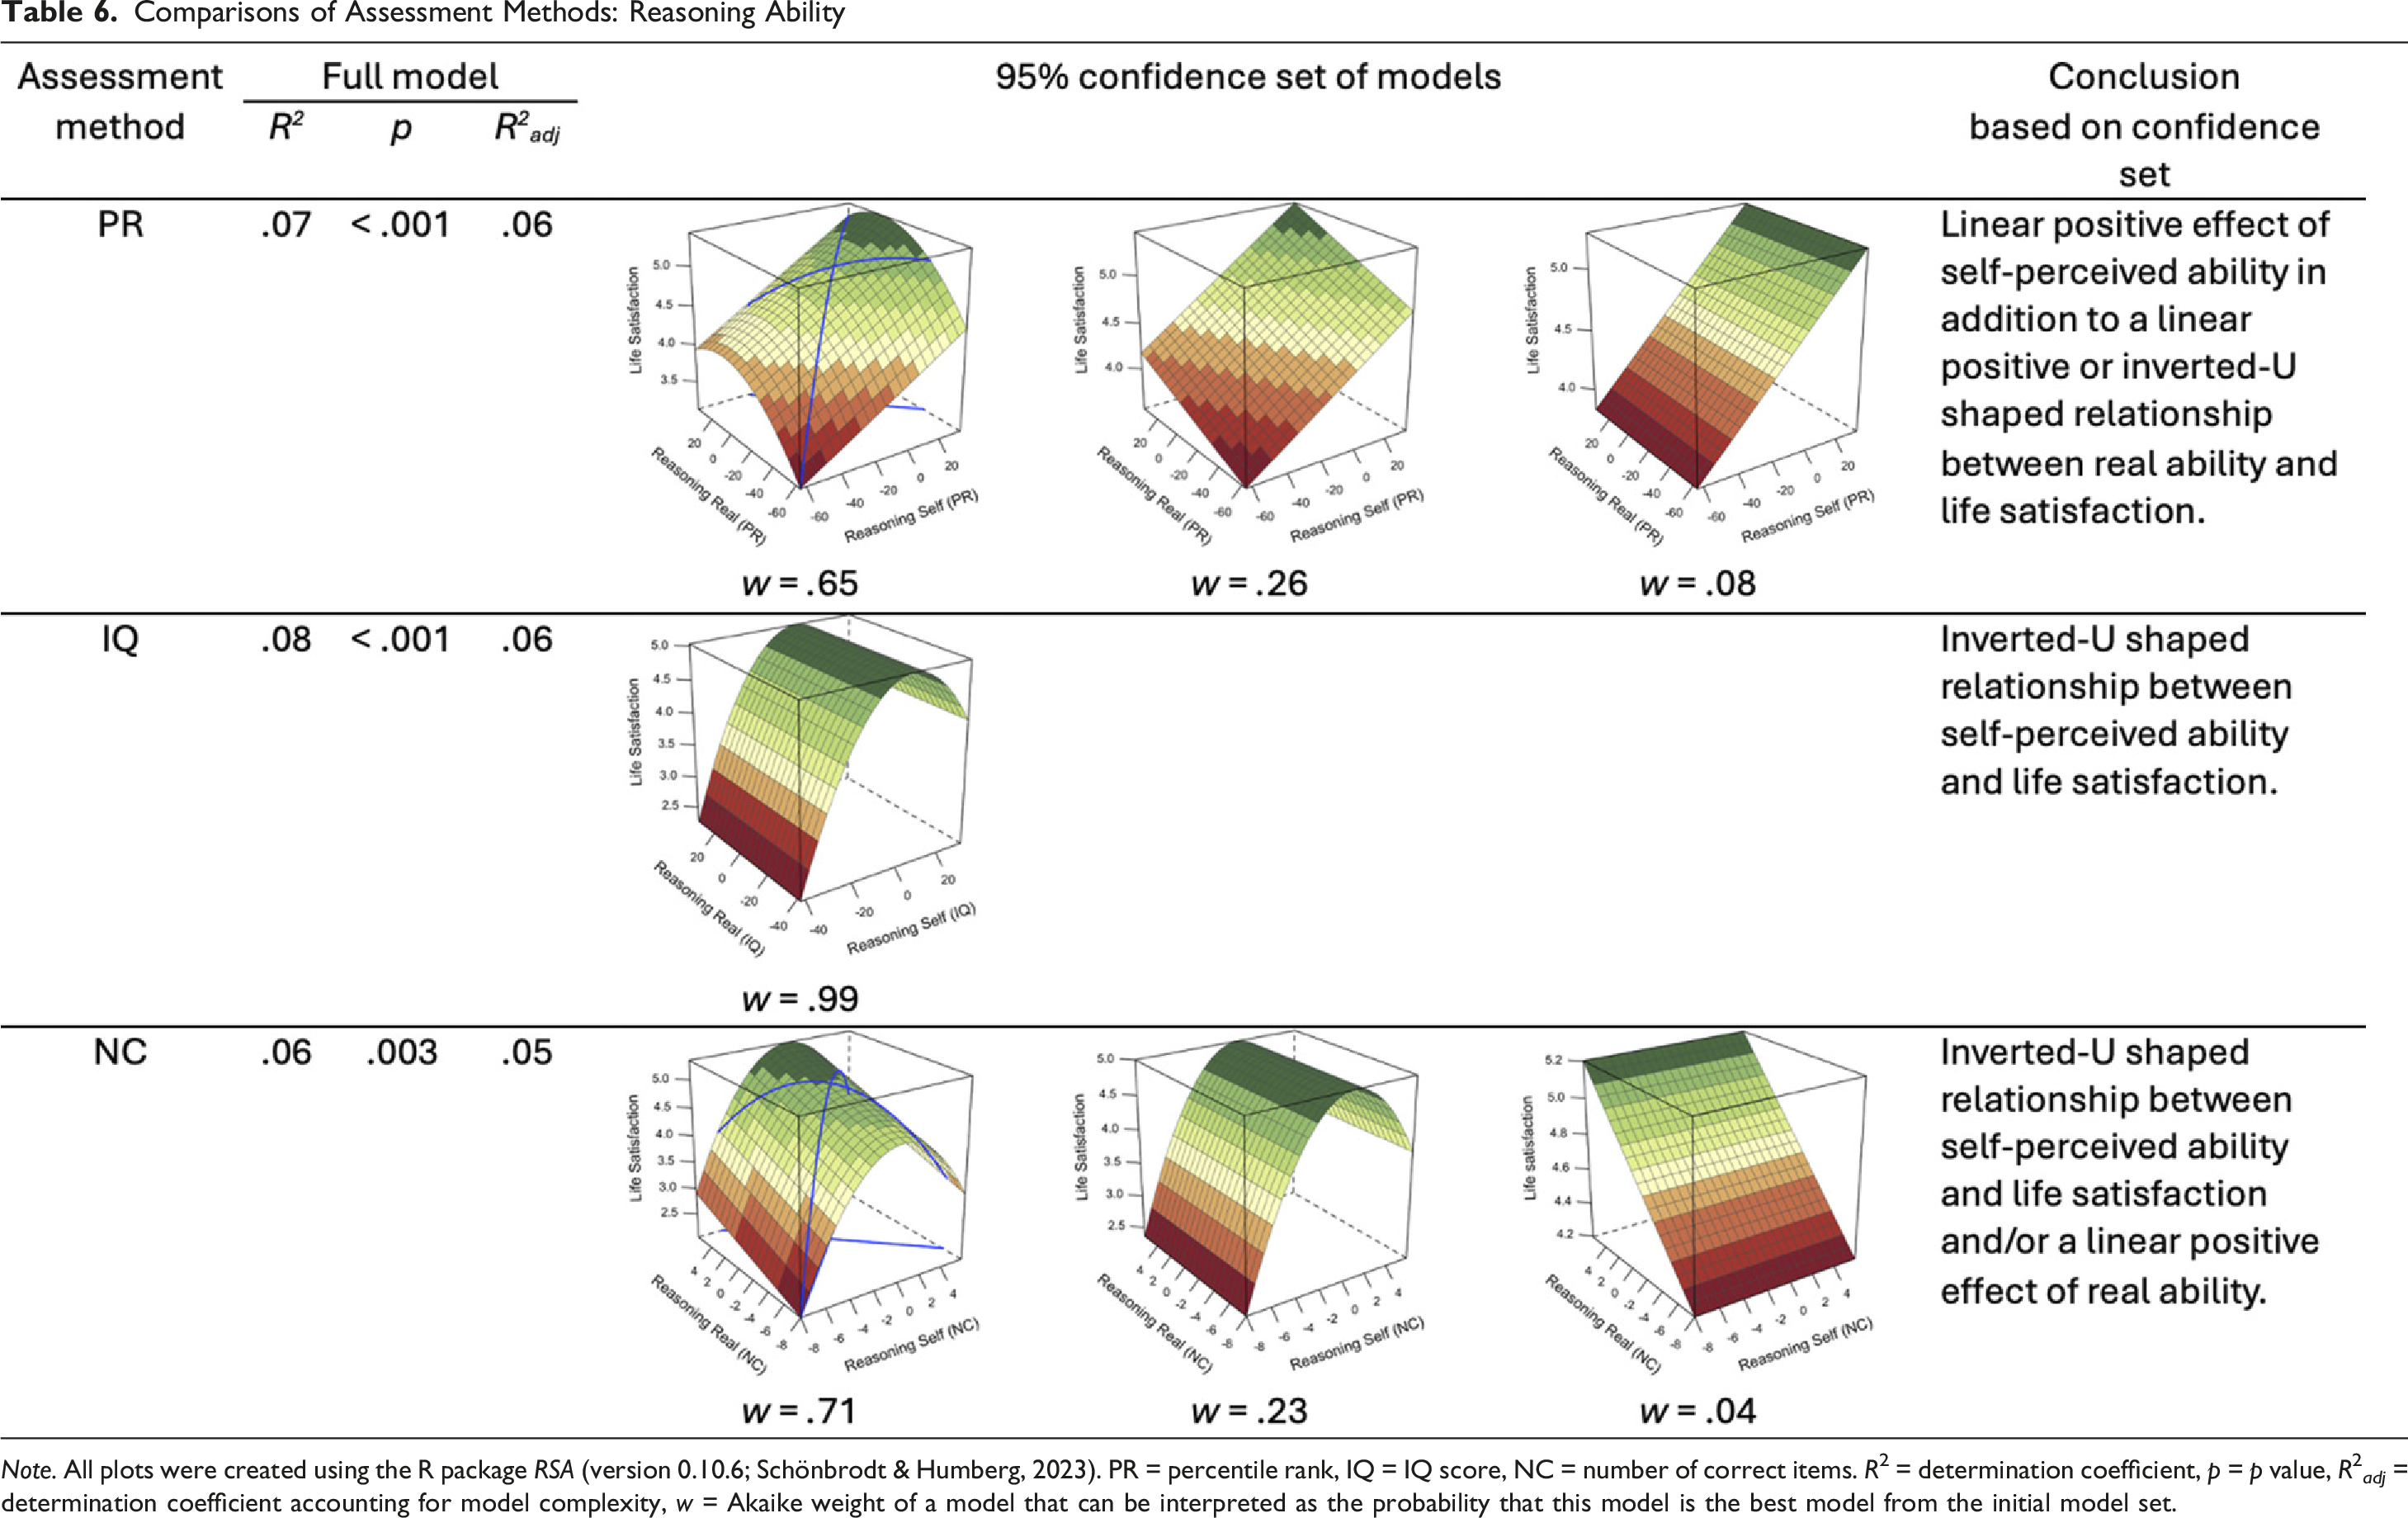

Note. All plots were created using the R package RSA (version 0.10.6; Schönbrodt & Humberg, 2023). PR = percentile rank, IQ = IQ score, NC = number of correct items. R2 = determination coefficient, p = p value, R2 adj = determination coefficient accounting for model complexity, w = Akaike weight of a model that can be interpreted as the probability that this model is the best model from the initial model set.
For reasoning ability, all analyses suggested relationships with either self-perceived or real ability (or both). However, the assessment methods differed in the suggested composition (i.e., an effect of self-perceived or real ability alone or together) and the form (i.e., linear or curvilinear effect, see Table 6). For the percentile rank assessment, the analysis suggested strong evidence of a curvilinear effect of real ability and a linear effect of self-perceived ability, whereas with the IQ scale, a curvilinear (nonlinear) effect of self-perceived ability and no relationship between real ability and life satisfaction was identified. The analysis for the number of correct items assessment method in turn spoke of a linear main effect of real ability in addition to the curvilinear relationship between self-perceived ability and life satisfaction. In sum, conclusions about how life satisfaction was related to self-perceived and real reasoning ability differed fundamentally across the three assessment methods.
Robustness Analyses
To investigate the robustness of the results, we repeated all the analyses involving PRs with the original SAQ scale (1 [bottom 5%] to 10 [top 5%]). We obtained commensurable ability scores by sorting the percentile ranks obtained with the objective tests into the SAQ percentile categories. Additionally, to rule out potential influences of prior test experience, we repeated all analyses while excluding participants who indicated that they had completed the respective ability test in the past (MWT-B: N = 25, Raven: N = 35). Note that we preregistered the exclusion of careless responders as an additional robustness analysis but did not have to run this analysis because no participants satisfied the preregistered criterion for exclusion (osf.io/mebt9). In the following, we briefly summarize the results of the robustness analyses (for details, see Supplements F and G at osf.io/kg8v4).
For the rank-order perspective, all results were replicated in both robustness analyses. For the level perspective, the comparisons of the scale averages were also replicated, with the only exception that no difference between the average discrepancy score for the percentile rank and IQ score assessment was found for reasoning ability in the analyses with the SAQ percentile categories (Supplement G at osf.io/kg8v4). For the comparison of the distributions, the robustness analyses from which we excluded participants with test experience replicated all the results (Supplement F at osf.io/kg8v4). The robustness analyses using SAQ percentile categories replicated the differences between the uncentered distributions for percentile rank versus number of correct items and IQ score versus number of correct items for vocabulary knowledge. Almost all other comparisons that were significant for the uncentered discrepancies in the main analyses (see Table 4) were instead significant for the centered discrepancies in this robustness analysis, except for the comparison between percentile rank and IQ score for reasoning ability (Supplement G at osf.io/kg8v4). Thus, caution should be exercised when interpreting the comparisons of the distributions, especially for the percentile rank scale. For the analyses on the relationship between individual differences in self-perceived ability, real ability, their discrepancy and life satisfaction, we found slightly different confidence sets within each assessment method and ability domain, for both the exclusion of participants with test experience (analyses for percentile rank, vocabulary knowledge, and percentile rank and number of correct items, reasoning ability; Supplement F at osf.io/kg8v4) and for the alternative SAQ scores (percentile rank, vocabulary knowledge; Supplement G at osf.io/kg8v4). However, the differences resulting from the comparison between the assessment methods were largely replicated. The only exception was that discrepancy models could not be excluded in all cases, which is an interesting finding in general but is less important for our purposes here.
Discussion
In the present research, we differentiated between two research perspectives for investigating how the choice of method for assessing self-perceived intelligence influences findings on the accuracy of self-perception and on the relationship between individual differences in accuracy and personal outcomes. Specifically, we compared three assessment methods: percentile rank, IQ score, and number of correct items. We found no impact of the assessment method on the rank-order similarity of self-perceived and real ability (rank-order perspective), but we found that it essentially affected the scaled average discrepancy between self-perceived and real ability, the distribution of individual discrepancy scores, and the relationship between self-perceived ability, real ability, individual discrepancy scores, and life satisfaction (level perspective). Thus, it seems that empirical insights that refer to the extent to which people’s self-assigned intelligence level diverges from their true intelligence, and how individual differences in this divergence relate to personal outcomes, depend on the method that was used to assess self-perceived intelligence. In the following, we discuss the implications of these findings for past and future research on the accuracy of intellectual self-perceptions.
Influences of the Choice of Assessment Method Within the Two Research Perspectives
An overall view on our findings shows that the influence of the assessment method depended on the research perspective and ability domain. For the rank-order perspective, we found no evidence that the assessment method affected the results. Our findings therefore indicate that measurement differences may not be the primary source of the inconsistent results reported in the literature taking a rank-order perspective (e.g., Freund & Kasten, 2012; Mabe & West, 1982). Instead, other study characteristics may account for these inconsistencies, for example, the specific ability being assessed (see Ackerman & Wolman, 2007; Freund & Kasten, 2012) or sample characteristics such as gender (Reilly et al., 2022) or educational background (Heine et al., 2025). At the same time, we consider it interesting to compare our findings with previous research reporting influences of the assessment method on the rank-order similarity between self-perceived and real ability (e.g., Freund & Kasten, 2012; Mabe & West, 1982). A key difference is that these earlier studies typically considered a single assessment characteristic in isolation (e.g., social comparison, participants’ knowledge about the ability construct, specificity of the ability domain), whereas our study compared assessment methods that varied along several of these domains. For example, the percentile rank and IQ score measures involved social comparison with a defined reference group (Freund & Kasten, 2012; Mabe & West, 1982), the IQ score and number-of-correct-items measures provided participants with clear information about the construct or task (Mabe & West, 1982; Westbrook et al., 1994), and the number-of-correct-items measure assessed an estimation of performance rather than ability (Mabe & West, 1982). Because our study did not focus on single assessment characteristics alone, we cannot draw conclusions about their respective influences on rank-order accuracy. However, based on our results, we may conclude that the three assessment methods investigated here do not differ in their estimation of rank-order similarity within a given sample and ability domain.
Closely related to influences on the rank-order accuracy is the broader question of how to interpret the magnitude of correlation coefficients depicting rank-order similarity (e.g., r = .30). We think that such evaluations of magnitude are inherently context dependent. For instance, the question of whether a given coefficient reflects high (enough) accuracy may be answered differently if a researcher plans to use self-assessments as a substitute for objective measures (e.g., intelligence tests), versus if they aim to use it as an incremental source of information beyond such measures (see Ackerman & Wolman, 2007; Freund & Kasten, 2012; Paulhus et al., 1998 for further discussions). In this regard, we think that future research within the rank-order perspective would benefit from more differentiated tools for evaluating accuracy coefficients. Possible approaches include the binomial effect size display (Rosenthal & Rubin, 1989) or a regression-based approach suggested by Holling and Preckel (2005).
For the level perspective, we found influences of the assessment method for all three research questions that are frequently of interest within this perspective. First, conclusions about the average discrepancy between self-perceived and real ability depended greatly on the assessment method. Whereas the results for the IQ measure indicated an average tendency for overestimation, the results for the number of correct items measure indicated an average tendency for underestimation in both ability domains. Thus, the present results may raise doubts about the generalizability of prior results on average self-perceptions, for example, the prior finding that people from Western cultures have a general tendency to overestimate their (favorable) abilities (e.g., Dunning et al., 2004; Gignac & Zajenkowski, 2019; Heck et al., 2018). Moreover, we find it notable that the percentile rank and IQ score assessment, which include a social comparison, resulted in higher average self-perceptions than the number of correct items assessment method. Potentially, people tend to assign higher ability levels to themselves when they are asked to assess their abilities in relation to others, that is, when self-perceptions are comparative (i.e., as in the percentile rank and IQ score assessment methods) but not in general (Chambers & Windschitl, 2004). Still, the percentile rank and IQ score assessment, despite both including a social comparison, resulted in different average self-estimations. One potential explanation is that the framing of the abilities as intelligence domains, emphasized in the instructions for the IQ method but not for the percentile rank method (see Table 1), resulted in different degrees of trait desirability. This desirability may have increased participants’ motivation to perceive themselves as above average in the IQ assessment (see also Alicke, 1985; Alicke & Govorun, 2005; Leising et al., 2016). In sum, the precise causes for the different impacts of the assessment methods need a more fine-grained investigation. Nevertheless, we found that the average discrepancy between self-perceived and real ability was affected by the assessment method, and that general overestimation tendencies were only present for specific assessments.
Second, the distribution of the discrepancies between individuals’ self-perceived and real ability differed for most comparisons. Though all discrepancy score distributions were unimodal and showed substantive variation across individuals (see also John & Robins, 1994; Schriber & Robins, 2012; Westbrook et al., 1994), the precise shape of the distribution depended on the method used to assess self-perceived ability, the ability domain under investigation, and the specific combination of the assessment method and ability domain. In our view, these findings emphasize the importance of considering individual differences when aiming to explain the mechanisms underlying self-perceptions. For example, individuals potentially differ in how the assessment method affects the accuracy of their self-perceptions due to individual characteristics such as educational background (e.g., prior experience in psychometrics, with self-estimation or intelligence tests; Mabe & West, 1982) or personality traits (e.g., neuroticism or narcissism; Bipp & Kleingeld, 2012; Gabriel et al., 1994; Mielke et al., 2021), which may make people more or less sensitive to the influences of (specific) assessment methods. Additionally, it could be interesting to consider intraindividual differences (i.e., how the assessment method affects a specific person’s self-estimation) in repeated assessments in order to explain the current pattern of results.
Third, the assessment method affected conclusions about how life satisfaction is related to individual differences in self-perceived and real intelligence. That is, the choice of method for assessing self-perceived intelligence can influence whether a pattern (vocabulary knowledge) or which pattern (reasoning ability) is found in the relationships between self-perceived ability, real ability, and life satisfaction. This finding is highly relevant for theory development because even seemingly small differences in empirical findings can be considerable in terms of theoretical implications, for example, when they refer to the question of whether an association is curvilinear or linear (Edwards & Berry, 2010): Is a more positive self-perception universally beneficial for intrapersonal adjustment, or are there limits, such that even self-perceptions that are too high are detrimental? Furthermore, the results of our study add to prior research, which showed that conclusions about this relationship depend a great deal on researchers’ choices in a respective study. For example, it has been shown that the results are influenced by the choice of a specific rater of personal adjustment (i.e., self- or peer-rated; Kurt & Paulhus, 2008), adaptiveness outcome (e.g., Dufner et al., 2019; He & Côté, 2019; Humberg et al., 2019), and discrepancy measures (e.g., Dufner et al., 2012; Humberg et al., 2018). We consider it a promising direction for future research to comprehensively investigate not only the individual effects but also the combined influences of constellations of these factors, including the assessment method, to consolidate findings on the consequences of more or less accurate self-perceptions.
Toward Suggestions for Future Studies
In sum, the results of our study show that the choice of method for assessing self-perceived intelligence influences a study’s results. In some regard, the reported findings can inform the selection of an assessment method. They show which method tends to produce the most accurate self-perceptions within each research perspective (i.e., the highest rank-order similarity, the lowest average discrepancy, the lowest variance in individual discrepancy scores). Selecting the method that optimizes accuracy may be desirable when aiming to use people’s self-perceptions as an economic replacement for an intelligence test, for example, in the context of personnel selection (DeNisi & Shaw, 1977; Holling & Preckel, 2005; Paulhus et al., 1998), or when aiming to investigate the circumstances under which people hold the most accurate self-perceptions (Freund & Kasten, 2012; von Stumm, 2014). However, a crucial point to keep in mind is that the results of our study do not allow for any inferences about how the assessment methods compare in terms of their validity, that is, which assessment method assesses people’s “true” self-perceptions, and thus, which method is best suited for studies investigating the degree, distribution, or consequences of (in)accurate self-perception. In fact, the different assessment methods may even assess different constructs. For example, the methods could activate distinct evaluative processes. For example, asking participants to estimate their IQ score could activate a comparative self-other estimation process that is guided by social experiences (see Chambers & Windschitl, 2004), whereas asking participants to estimate the number of correct items could tap into a self-evaluation that is guided by performance experiences (see Furnham et al., 2005). Inherently, these potential differences in processes and measured constructs are not problematic. The problems occur when researchers assume that they are measuring the same thing when applying the different assessment methods, even though they might not be.
Whereas we think that there is still too little evidence to offer clear suggestions for how to select the best assessment method in future studies, we feel confident in emphasizing three considerations that may support the selection. First, it seems important to consider the research perspective that is being addressed. For once, the results on the influence of the assessment method depended on the research perspective and showed that all the assessment methods we compared resulted in comparable results for the rank-order but not for the level perspective. For another, researchers who consider questions within the level perspective should generally be concerned about the requirement to ensure the commensurability of their measures (see Humberg et al., 2022; Schönbrodt, 2016). We hence expect that the assessment methods percentile rank, IQ score, and number of correct items will need to be preferred over rating scales in many applications within the level perspective. Second, the selection of a method for assessing self-perceived ability needs to incorporate the respective theoretical understanding of the self-perception and accuracy phenomenon of interest. For example, some researchers distinguish self-estimated intelligence assessed before the ability test from self-evaluation of performance assessed afterwards (Furnham et al., 2005). Likewise, researchers may justify their choice for a number of correct items scale by their aim to investigate self-perceptions that refer to performance, and their use of a percentile rank or IQ scale by a focus on self-perception referring to abilities—depending on their theoretical understanding. Third, when there are no theoretical reasons for selecting one or another assessment method, we consider it reasonable to include several methods in the study to increase the robustness of the conclusions (e.g., as implemented by Heine et al., 2025; Kim et al., 2010; Kim & Chiu, 2011).
Limitations and Future Directions
Our study had some limitations that may be improved in future research. First, for the intelligence domain of reasoning ability, the reference norms for computing percentile rank and IQ scores were drawn from a student sample. Because the instructions before the self-estimations referred to “fellows” (who could not be students) for percentile rank and “the average German population” for IQ scores, the discrepancy scores for reasoning ability might be artificially exaggerated. This inflation may limit the results between percentile rank and number of correct items for the level comparisons and between IQ and number of correct items for reasoning ability, whereas other comparisons may remain unaffected, that is, those between percentile rank and IQ, all comparisons within the rank-order perspective, and all comparisons for vocabulary knowledge. Nevertheless, future studies taking a level perspective should aim for a better fit of the norm sample for the ability test and the reference group provided in the self-estimation instructions.
Second, self-perceived ability and life satisfaction were both assessed via self-reports, so common method bias might have affected the results (Colvin & Griffo, 2008; Shedler et al., 1993; see also Wojcik & Ditto, 2014). We consider it difficult to avoid this problem completely because we think that individual life satisfaction can most validly be indicated by the individual themselves (Kurt & Paulhus, 2008). Still, it would be interesting to compare the present results with results from studies that assessed self- and informant-reported adjustment (e.g., He & Côté, 2023; Kurt & Paulhus, 2008) or ones that applied strategies for reducing common method bias (Podsakoff et al., 2012; e.g., He & Côté, 2019).
Third, this study cannot answer why the choice of an assessment method influenced findings on people’s accuracy in self-perception and the consequences of individual differences in accuracy. In our investigation, the characteristics of the assessment methods differed in multiple features (i.e., scale, instruction, reference group). Also, all assessment methods were presented in the same sequence for all participants, and thus, order effects cannot be ruled out. Thereby, we can derive no definite insights into the specific properties of the measures that impacted the results. Future investigations could replicate our study and systematically manipulate the sequence of the items. They could also manipulate the assessment methods in more fine-grained ways, focusing on one specific feature of the measures at a time, such as instructional characteristics (e.g., existence of social comparison and type of reference group; Bipp & Kleingeld, 2012; Mabe & West, 1982) or the scale’s resolution (e.g., number of response options; Heck et al., 2018; Lee & Paek, 2014).
Finally, it would be meaningful to replicate our findings in samples that are more heterogenous than our student sample and that address alternative self-perception domains, for example, task performance (e.g., Ackerman et al., 1995) or personality traits (e.g., Borkenau & Zaltauskas, 2009; Church et al., 2014). Also, whereas we focused on self-perception in the intelligence ability domain, where high consensus exists with respect to the choice of a reality criterion (i.e., psychometrically validated intelligence tests; Kwan et al., 2004), future research could extend our considerations to research questions that involve comparing people’s self-perceptions against nonobjective criteria. For example, such studies can include comparing a person’s self-perceived ability with the person’s estimate of their peer’s ability (Kwan et al., 2008; Polzer et al., 1997) or comparing a person’s self-perceived ability with a peers’ estimates of the person’s ability (John & Robins, 1994; Kwan et al., 2008; Paulhus, 1998).
Conclusion
Overall, our study showed that the choice of method for assessing self-perceived intelligence can substantially affect a study’s conclusions about people’s tendencies to over-, under-, or accurately estimate their intellectual ability, and whether individual differences in accuracy relate to personal outcomes. We are convinced that taking this knowledge into account when planning future investigations will help bring research even closer to fully answering questions about the insights that people have into their cognitive skills and whether individual differences in these insights have consequences for personal adjustment.
Supplemental Material
Supplemental Material - Empirical Findings on the Accuracy of Intellectual Self-Perceptions Depend on the Method Used to Assess Self-Perceived Ability
Supplemental Material for Empirical Findings on the Accuracy of Intellectual Self-Perceptions Depend on the Method Used to Assess Self-Perceived Ability by Ida Schulze Tast, Steffen Nestler, Sarah Humberg in European Journal of Personality.
Footnotes
Ethical Considerations
The sample was assessed during a time when it was not yet mandatory to obtain ethical permission for nonmedical research. The research was conducted ethically in accordance with the World Medical Association Declaration of Helsinki.
Consent to Participate
All participants provided written informed consent before participating in the study.
Funding
The authors received no financial support for the research, authorship, and/or publication of this article.
Declaration of Conflicting Interests
The authors declared no potential conflicts of interest with respect to the research, authorship, and/or publication of this article.
Open Science Statement
The study materials, data, and analysis scripts for this article are available at https://osf.io/kg8v4. The preregistration is available at ![]() .
.
Supplemental Material
Supplemental material for this article is available online.
References
Supplementary Material
Please find the following supplemental material available below.
For Open Access articles published under a Creative Commons License, all supplemental material carries the same license as the article it is associated with.
For non-Open Access articles published, all supplemental material carries a non-exclusive license, and permission requests for re-use of supplemental material or any part of supplemental material shall be sent directly to the copyright owner as specified in the copyright notice associated with the article.