
Abstract
Personality development theories and descriptive evidence highlight young adulthood as a period conducive to personality change. Young adults experience important transitions, such as starting university education, and establish new relationships. However, few empirical tests of the direct influence of university student peer groups on individual change in personality traits exist. Here, we conceptually replicated an earlier study and randomly allocated students (N = 351) to study groups of 3 to 6 peers that met over the course of the first semester. This randomization approach allowed the estimation of peer group socialization effects unconfounded by selection effects. We conducted a series of robustness checks to determine whether regression to the mean constitutes an alternative explanation for the results. The preregistered, confirmatory models seemed to support the hypothesis of peer group influence for all Big Five traits, showing patterns of assimilation where an individual’s personality became more similar to the personality of the remaining group members over time. Robustness checks, however, demonstrated convincingly that these patterns were due to the statistical artifact of regression to the mean and should not be interpreted as substantive evidence for peer group influence. We discuss theoretical and methodological implications for studying personality development through social relationships.
Plain Language Summary
Personality traits are still relatively malleable and subject to change during the developmental period of young adulthood. This is also supported by theories of personality development and descriptive evidence. During this time, young adults experience important transitions, such as starting university education, and establish new relationships. So far, few studies have looked at the influence of peer groups formed at university on individual change in personality traits. Here, we attempted to replicate an earlier study and randomly allocated students (N = 351) to study groups of 3 to 6 students. These student peer groups met over the course of the first semester. This random allocation allowed us to estimate how peer groups influence personality development. At the same time, it allowed us to account for selection effects, that is, the typical processes when people choose their friend groups based on personality matches. We conducted a series of checks to determine whether a statistical artifact, called regression to the mean, could also explain the results. At first glance, we found support for our expectation that peer groups influence how personality traits change. Over time, an individual's personality became more similar to the personality of the remaining group members. The statistical checks we conducted, however, showed that these patterns were due to regression to the mean. Therefore, they should not be interpreted as evidence for peer group influences on personality change. We discuss what this means for theories and methods that are used when studying personality development through social relationships.
Keywords
Introduction
Young adulthood and the transition to university have been described as a life stage that is more conducive to personality development than later stages (Bleidorn et al., 2018, 2022; Lüdtke et al., 2011; Ringwald et al., 2023). However, mechanisms of change in young adulthood are still debated, and average effects of life events, such as graduation or a new romantic relationship, on personality development tend to be small and isolated on a few specific traits (Bühler et al., 2023; de Moor et al., 2023; Neyer & Lehnart, 2007). One rationale for the theorized effects of life events and transitions was that the exposure to new social circles and the adoption of new social roles would change people’s routines and habits in ways that may eventually lead to changes in personality traits (Bleidorn, 2015; Bleidorn et al., 2013; Roberts & Nickel, 2017). Yet, while some studies investigated the influence of specific friendship and sibling dyads on adolescents’ personality development (with little empirical evidence for codevelopment, e.g., Borghuis et al., 2017), less is known regarding the personality make-up of new peer groups that young adults establish during this transitional time and how their group composition influences one’s own personality change.
In this experimental study, we tested whether the personality features of student peer groups could affect individual personality change. We randomly assigned two cohorts of first-semester university students to study groups of three to six unacquainted peers who then met multiple times during the semester. In doing so, we conceptually replicated and extended a study by Shan and Zölitz (2022) who found peer group influence effects for conscientiousness and openness. The randomization approach had the advantage that the initial composition of the group members’ personality traits was random, allowing us to examine its effect on individual personality development over the course of one semester, independent of relationship selection effects. Moreover, because the students were new to university it is possible that these peer groups would be influential in establishing the kinds of social networks previously theorized to impact personality development. Across several robustness checks, we then compared and scrutinized different analytical approaches that offered diverging conclusions to the question of how peer groups influence personality development.
The role of social relationships and peer groups in personality trait development
Several theoretical frameworks of lifespan personality development place a key emphasis on changes in social relationships as potential mechanisms that shape personality change in young adulthood (Back et al., 2023; Reitz et al., 2014). For example, within the TESSERA framework (Wrzus & Roberts, 2017), social experiences and roles are considered to act as triggering situations that describe unfamiliar or new situations (e.g., new social interaction partners). These situations can elicit certain personality states (e.g., being more outgoing than usual), which—if repeated over time—can become habits that are integrated into the perception of the self and thus ultimately lead to sustained trait change (see also Jackson & Wright, 2024; Specht et al., 2014). Similarly, the PERSOC framework emphasizes that the influence of social interactions on personality development is driven by social behavior in peer relationships and interpersonal perception in a bottom-up fashion (Back et al., 2011). In addition, for development in childhood and adolescence, group socialization theory states that a substantial portion of development can be explained by peer influences (J. R. Harris, 1995; Loehlin, 1997).
Empirically, a meta-analysis of studies with children and adolescents summarized peer effects on behavioral outcomes as small but robust (beta = 0.08; Giletta et al., 2021). However, this meta-analysis focused on behaviors, psychopathological symptoms, and attitudes while excluding personality traits as outcomes. One study of adolescent friend and sibling dyads (aged 12–22) found no evidence for dyadic codevelopment or assimilation of personality traits within these dyads (Borghuis et al., 2017). Still, there is some research to indirectly suggest that the theoretical framework of group socialization can be applied to young adults. For example, high school graduates who moved in with new roommates have been found to increase in openness compared to those who stayed in their parental homes (Jonkmann et al., 2014). Similarly, there is evidence that young adult peers can influence each other’s personality, depending on how a friend group is composed in terms of their initial trait levels. Specifically, peers appear to become more similar to each other over time, especially in their levels of extraversion (Back et al., 2023; van Zalk et al., 2020; Wrzus & Neyer, 2016), which may be explained by mechanisms like behavioral mimicry (van Zalk et al., 2020) and is consistent with earlier findings of assimilation in mismatched friendship dyads, where one person is highly extraverted and the other introverted (Nelson et al., 2011). Further, changes in the social networks with friends and romantic partners have been associated with changes in personality, especially on the level of personality facets and regarding conflict or insecurity in relationships (Mund & Neyer, 2014).
However, on the whole, empirical tests of such peer group effects on individual personality development have been rare (for reviews, see Finn et al., 2017; Reitz et al., 2014), and there is a lack of research on how social interactions in newly formed peer groups may affect people’s personality during life transitions. In other words, it is unclear to what extent individual personality development during such a life transition depends on the composition of one’s new peer group in terms of their personality. For example, it might be possible that someone increases in conscientiousness if members of the peer group are initially considerably higher in conscientiousness.
Methodological issues
Confounding by social relationship selection effects
One factor complicating tests of peer group socialization effects is that personality traits are involved in the selection of peer relationships (Back, 2021; Back et al., 2023; Back & Vazire, 2015; K. Harris & Vazire, 2016). Such selection effects are difficult to distinguish from peer socialization effects on personality change in observational studies (i.e., selection effects confound group socialization effects). This is because the peers with whom someone interacts in the medium- and long-term are usually not randomly picked or assigned but selected by the individual based on mutual attraction, liking, and similarity in personality traits (Asendorpf & Wilpers, 1998; Cuperman & Ickes, 2009; Selfhout et al., 2010).
A potential remedy to this confounding would be a random grouping of peers which is, however, difficult to observe in practice in naturalistic contexts. In the context of college students’ adjustment to university life, we harnessed the advantage of being able to randomly assign first-year students to voluntary study groups that got to know each other throughout the semester. This allowed us to test whether personality development operates through group processes of assimilation and differentiation, independent of initial selection effects into relationships. Previously, Shan and Zölitz (2022) conducted a study that also used random assignment of students into study groups. They conducted their study with first-year economics undergraduate students (N = 543) and found that students increased in openness and conscientiousness over 3–4 months when they were assigned to groups that were on average higher in openness and conscientiousness, respectively. However, effects were small with 0.056/0.057 SD increases in openness and conscientiousness if the trait level of the remaining group members was 1 SD higher.
Relation of individual and peer group
But what does higher mean exactly? Different conceptualizations of how individuals and peer groups relate to each other may lead to different conclusions about peer group influences on personality development. This issue of comparison relates to the distinction of grand-mean centering and group-mean centering of predictors in the multilevel modeling literature (Hoffman, 2019; Hoffman & Walters, 2022), where group-mean centering is usually preferred when one wants to interpret effects of lower-level predictors without the influence of higher-level variance. Although not stated explicitly, the description of the standardization procedure in Shan and Zölitz (2022, p. 10) seems to imply that the effects described above refer to increases in individual personality that occur when one’s group is higher than the sample grand mean. Grand-mean centering, however, would make the obtained effect estimates difficult to interpret and compare across studies because they depend on both the sample mean (which might vary across samples) and the group means of the remaining group members. Additionally, within this approach, the individual’s initial trait level is not directly represented when interpreting the average personality level of the remaining group members as a predictor. This is an issue because there are, for example, individuals where the peer group personality is above the grand mean, but the individual personality score is even higher than the peer group personality.
Overview of Personality Variables Constructed From Scale Scores, Exemplary for Extraversion.
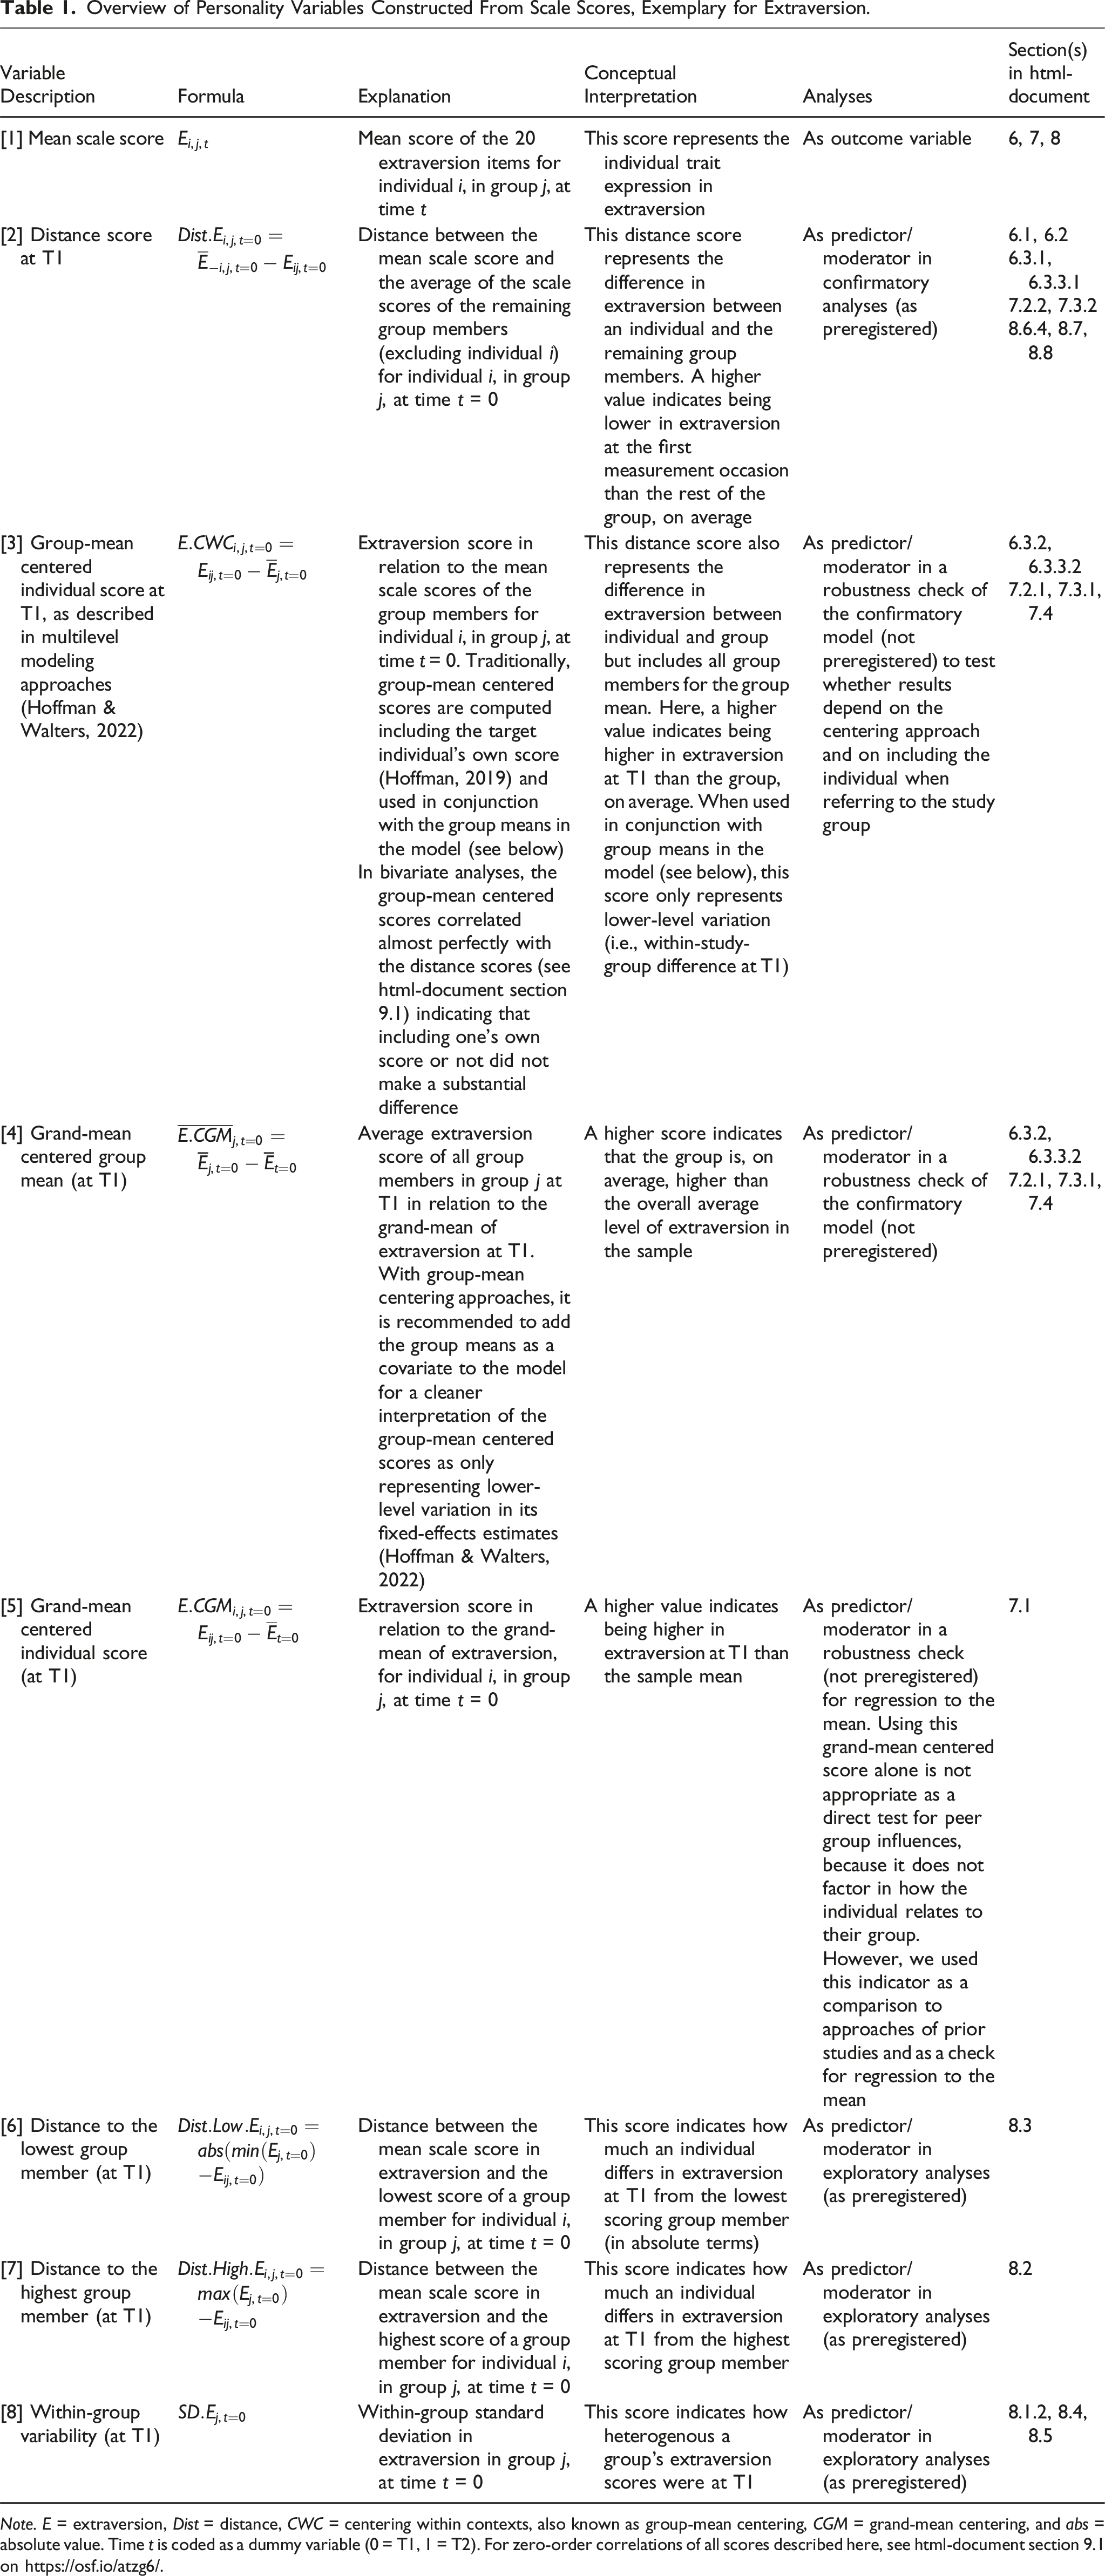
Note. E = extraversion, Dist = distance, CWC = centering within contexts, also known as group-mean centering, CGM = grand-mean centering, and abs = absolute value. Time t is coded as a dummy variable (0 = T1, 1 = T2). For zero-order correlations of all scores described here, see html-document section 9.1 on https://osf.io/atzg6/.
Regression to the mean
Based on these considerations, we focused on predicting that peoples’ personalities would be directly influenced by the group they are in. For example, if a person who was low in conscientiousness, relative to others in their group, they would become more conscientious over the course of the semester. However, another methodological issue with this comparison is that an individual’s relation to the group and their relation to the sample mean are positively correlated. This means that a person who is low in conscientiousness relative to others in their group also has a higher likelihood to be low in conscientiousness relative to the overall sample. Thus, any observed changes, independent of the centering strategy, may at least partially reflect regression to the mean. Regression to the mean describes a statistical artifact by which observations closer to the extremes of a distribution tend move closer to the mean across assessments (Barnett et al., 2005). Although this is caused by non-systematic variation in observed scores around the true scores, the effect is systematic.
In our case, the challenge was to disambiguate regression to the mean from the hypothesis that people who are low in a trait relative to their group would increase or that those who are high in a trait relative to their group would decrease. There are several ways to investigate regression to the mean. First, we compared results from group-mean centered models with the grand-mean centered estimates. While this is not a definitive check of regression to the mean, high similarity of results between the two approaches would be a first indication of such confounding. Second, in the context of peer-group effects, we expected differential change depending on the composition of the assigned group. To test this, we re-shuffled study group allocation randomly after data collection and compared effect sizes of models based on these artificial groups (who have likely never met as a group) with those obtained with the true group composition to evaluate whether results can be explained by regression to the mean. Third, with longitudinal data it is possible to artificially reverse the ordering of assessments over time (i.e., predicting changes from T2 to T1; Sorjonen et al., 2022). Obtaining similar results with this artificial temporal ordering is another strong indication for regression to the mean to be responsible for the observed effects.
The current study
Based on these considerations, we conceptually replicated the study by Shan and Zölitz (2022) and extended it by situating the project more closely in the literature on peer influences of personality development, using a more comprehensive and reliable inventory to measure personality, and considering different metrics of how each target student relates to his or her study group in terms of their personality traits. Subsequently, we conducted a series of robustness checks, inter alia, to rule out regression to the mean as the alternative explanation for potentially observed change effects.
We preregistered the following hypotheses at https://osf.io/2xypa: • H1: Students increase in conscientiousness if their peer group personality composition at baseline is higher in conscientiousness than their own conscientiousness at baseline. • H2: Students increase in openness if their peer group personality composition at baseline is higher in openness than their own openness at baseline. • H3: Students increase in extraversion if their peer group personality composition at baseline is higher in extraversion than their own extraversion at baseline.
So far, effects of peer group composition on individual personality development have been reported for extraversion (van Zalk et al., 2020), as well as conscientiousness and openness (Shan & Zölitz, 2022). However, we also explored equivalent effects for the other Big Five traits, agreeableness and neuroticism. In addition, we preregistered tests using different metrics of how the individual related to their group including the distance of the individual to the lowest and highest scoring group member. 1
Method
Procedure
We invited two cohorts of first-semester psychology students (2022 and 2023) from a German-speaking Swiss university to take part in a study on personality development and adjustment to university life. This study was advertised as an optional component of a mandatory course for first-semester students. Thus, all first-semester students could participate on a voluntary basis. As compensation, participants received partial course credit (which could also be gained by other means), cash vouchers for a local student café, and tickets for a lottery to win three iPads (approx. 500 USD each) per cohort.
Participating students were then randomly assigned to study groups of usually four (min. three, max. six) peers that were encouraged to meet and study together over the course of the semester. In the first two weeks of the semester, participants completed a baseline survey (T1) measuring their socio-demographic characteristics, personality traits, well-being, and cognitive abilities (for a full documentation of assessed constructs and time schedule of assessments, see codebook on https://osf.io/atzg6/).
Over the course of the semester, students were encouraged to attend meetings with their study group. The study groups met on their own and completed course assignments, extracurricular tasks, and learning activities. At two occasions during the semester, study groups were specifically invited to meet and work together on tasks in order to get to know each other better (which was incentivized by the café vouchers), but students also met outside these occasions as a group. In addition, they saw each other during class, although in this case other students outside of assigned study group were also present. At the end of the semester, during the last two weeks of lectures (i.e., roughly 80 days after T1 for the 2022 cohort and 70 days for the 2023 cohort), participants completed the post-survey (T2). Each of the surveys took approximately 60 minutes to complete, and they were answered independently (e.g., from home) and online (e.g., on a computer or smartphone).
Sample
All in all, 922 longitudinal observations from 483 students were recorded in the two cohorts. The sample size was based on all willing participants at the local institution and resource constraints regarding the number of cohorts that the study could be repeated with (Lakens, 2022).
As described in our preregistration, we removed cases with invalid longitudinal identifiers (2 observations) or missing study group indicators (63 observations), excluded students with only one assessment wave (3 observations), and excluded cases (14 observations) who failed the attention checks or showed signs of careless responding (longstring indicator; Meade & Craig, 2012). We also excluded groups with unrealistic, larger than intended reported group sizes because they likely disregarded the random group allocation (122 observations).
In the end, we included N = 351 participants (i.e., 702 longitudinal observations; M
age
= 20.88, SD
age
= 3.78, range
age
= 17–57; 267 women, 77 men, and 7 gender-diverse or no answer) nested in 92 study groups. There were 174 participants in 47 groups in the first cohort, and 177 participants in 45 groups in the second cohort. Factual study group sizes of participating students ranged from 2 to 6 (M = 4.00, SD = 0.81). Post hoc power simulations indicated that this final sample size was appropriate to detect a smallest effect of interest, namely, the interaction effect of time * distance, of size b = .07 (corresponding to
Measures
Personality
Big Five personality traits were assessed with the German version of the Big Five Aspects Scales (BFAS-G; DeYoung et al., 2007; Mussel & Paelecke, 2018). Each dimension was measured with 20 items which were answered on a 5-point Likert scale (1 = strongly disagree, 3 = neither agree nor disagree, 5 = strongly agree). Example items included “I believe in the importance of art” (openness), “I like order” (conscientiousness), “I take charge” (extraversion), “I sympathize with others’ feelings” (agreeableness), and “I worry about things” (neuroticism). Internal consistencies ranged from
We calculated observed mean scale scores for each individual. Next, we constructed several measures of how each individual related to their peer group in terms of each personality trait at the first measurement wave. For confirmatory analyses, we calculated the distance at T1 by subtracting the individual score from the average of the scores of the remaining group members (see Table 1, row 2). Thus, this variable also varied within groups, and a higher distance score indicated being lower in a trait than the remaining group members, on average. As a robustness check of this model, we also employed group-mean centering approaches (Hoffman & Walters, 2022), where the individual score was also considered when forming the group mean (see Table 1, rows 3 and 4). Here, a higher score of the group-mean centered variable indicated being higher in a trait than all group members. As preregistered, we explored several other measures of how the individual related to the group including the distance to the lowest-scoring group member, the distance to the highest-scoring group member, and the overall within-group variability (see Table 1, rows 6–8).
Covariates
Frequency of Group Meetings
To assess how often study groups met over the course of the semester, we asked at T2 “How often did you meet with your fellow students for the Interactive Proseminar (IPS)? For example, to attend practice groups, to solve exercises or to study seminar materials, etc.” and “How often have you done something outside the university together with your study group colleagues? For example, playing sports together, watching movies, going out for a drink or a meal, etc.” Both items were answered on a 6-point scale (1 = never, 2 = less than once a month, 3 = once a month, 4 = two to three times a month, 5 = once a week, 6 = several times a week).
Gender
We assessed gender with the question “Which gender do you identify with?”, which we dummy-coded (0 = men, 1 = women) and set to missing for gender diverse answers (6 individuals) for gender-related analyses.
Analytical strategy
Manipulation Check
We first performed a manipulation check of successful randomization of students to study groups with regard to their personality traits. We predicted participants’ trait scores at T1 by the mean score of the remaining group members in linear regression models, controlling for cohort differences. 2 We expected no significant relation of target student personality and peer group personality to consider the manipulation check successful.
Group influence on personality
Because of the nested structure of the data with three levels (observations nested in individuals nested in study groups), we used multilevel regression models to test the hypotheses for each Big Five domain in a separate model. For the main confirmatory models, we predicted individual personality trait scores by time (0 = T1, 1 = T2), the distance to the remaining group members’ average personality at T1, and their interaction. Thus, the interaction represented the effect of interest, that is, whether the peer group composition at T1 was associated with differential change over time. We also controlled for cohort differences with a dummy variable (0 = 2022/23 cohort, 1 = 2023/24 cohort) in all models. We ran random intercept models because random slope models often did not converge with the more complicated three-level structure of the data. The equation for an exemplary model for extraversion (E) for individual i, in group j, at time t is as follows (see also Table 1):
Robustness checks
As there are several different approaches to analyze such a repeated measures design with additional nesting in groups, we ran two robustness checks with different model specifications. First, instead of the models with the distance measure, we used multilevel models with the group-mean centered individual score at T1 and grand-mean centered group means at T1 as predictors (see Table 1, rows 3 and 4) that were both interacted with the time dummy. We did this to test whether our preregistered approach using the distance measure lead to similar results as more traditional centering approaches described in the multilevel modeling literature (Hoffman, 2015; Hoffman & Walters, 2022). By adding the group means as additional predictors, the interpretation of the predictor of interest (group-mean centered scores) is shifted and assumed to only contain lower-level variation (i.e., within-study-group difference at T1; Hoffman, 2019). Second, we collapsed the three-level nesting structure to a two-level structure (individuals nested in groups) by forming a difference score for each trait (T2-T1). This difference score was then also predicted by either the distance measure in the respective trait or the group-mean centered trait at T1 plus the added group mean. This model specification was more parsimonious by avoiding the three-level nesting structure (which might lead to some convergence problems).
Based on the three-level model specifications (with random intercepts and fixed slopes), we then applied further robustness checks as described above in the section Regression to the Mean by (a) testing grand-mean centered scores as predictors, (b) randomly shuffling group allocation, and (c) reversing the time sequence.
Last, we used structural equation modeling to test for measurement invariance over time and to specify latent change score models. Latent change score models (Kievit et al., 2018) with three item parcels as indicators for the latent Big Five dimensions (Little et al., 2002) were established to test dimension-level change over time and then extended to test moderation of this change by the distance to the remaining study group members in the respective trait dimension. This had the purpose to create models conceptually equivalent to the multilevel models and test whether using manifest personality scores as the outcome differed from using latent scores due to measurement error.
Software
We used the tidyverse packages for data cleaning and plotting (Wickham et al., 2019) and the nlme and lme4 packages (Bates et al., 2015; Pinheiro et al., 2017) for multilevel modeling in R (Version 4.3.1; R Core Team, 2023), and the lavaan package for structural equation modeling (Rosseel, 2012). Our main inference criterion was
Results
Descriptives
Means and Standard Deviations in the Big Five on the Individual Level Across Cohorts and Time.
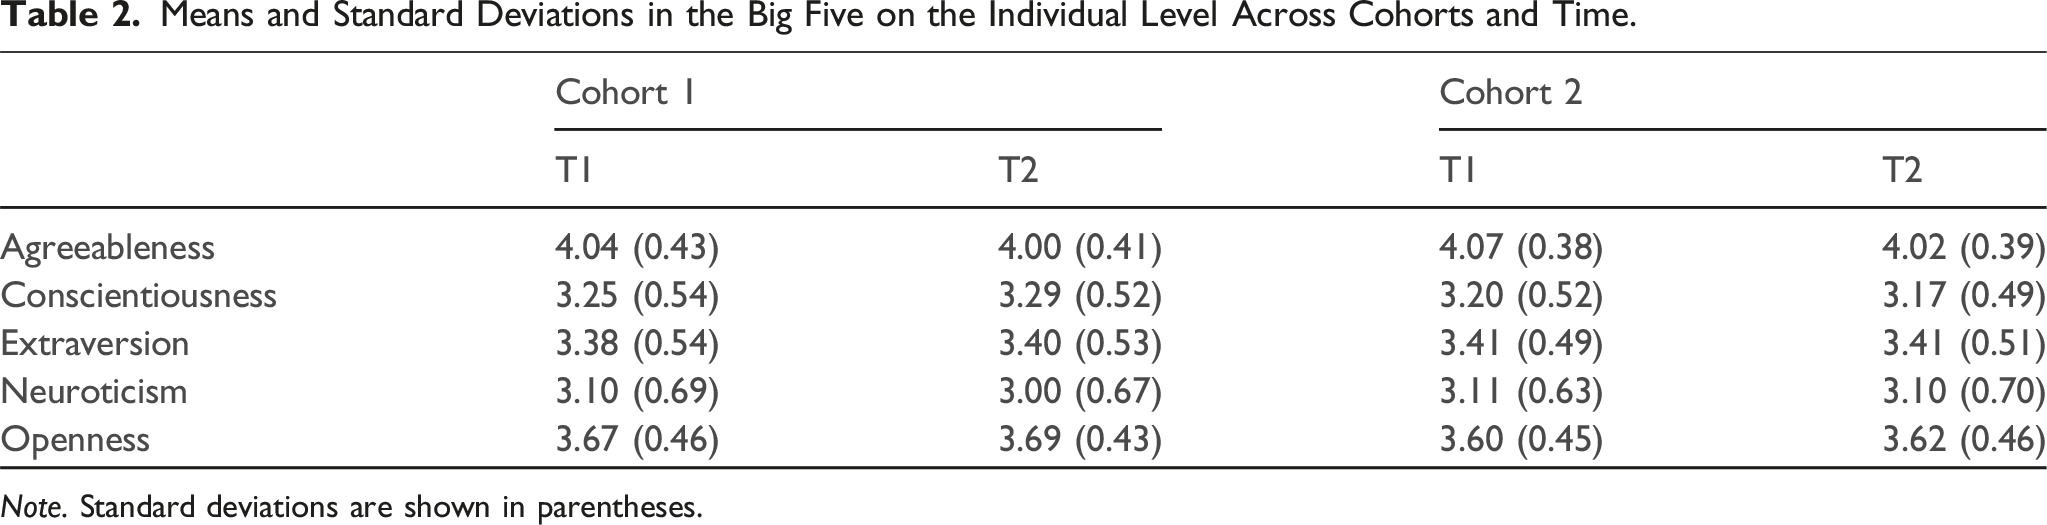
Note. Standard deviations are shown in parentheses.
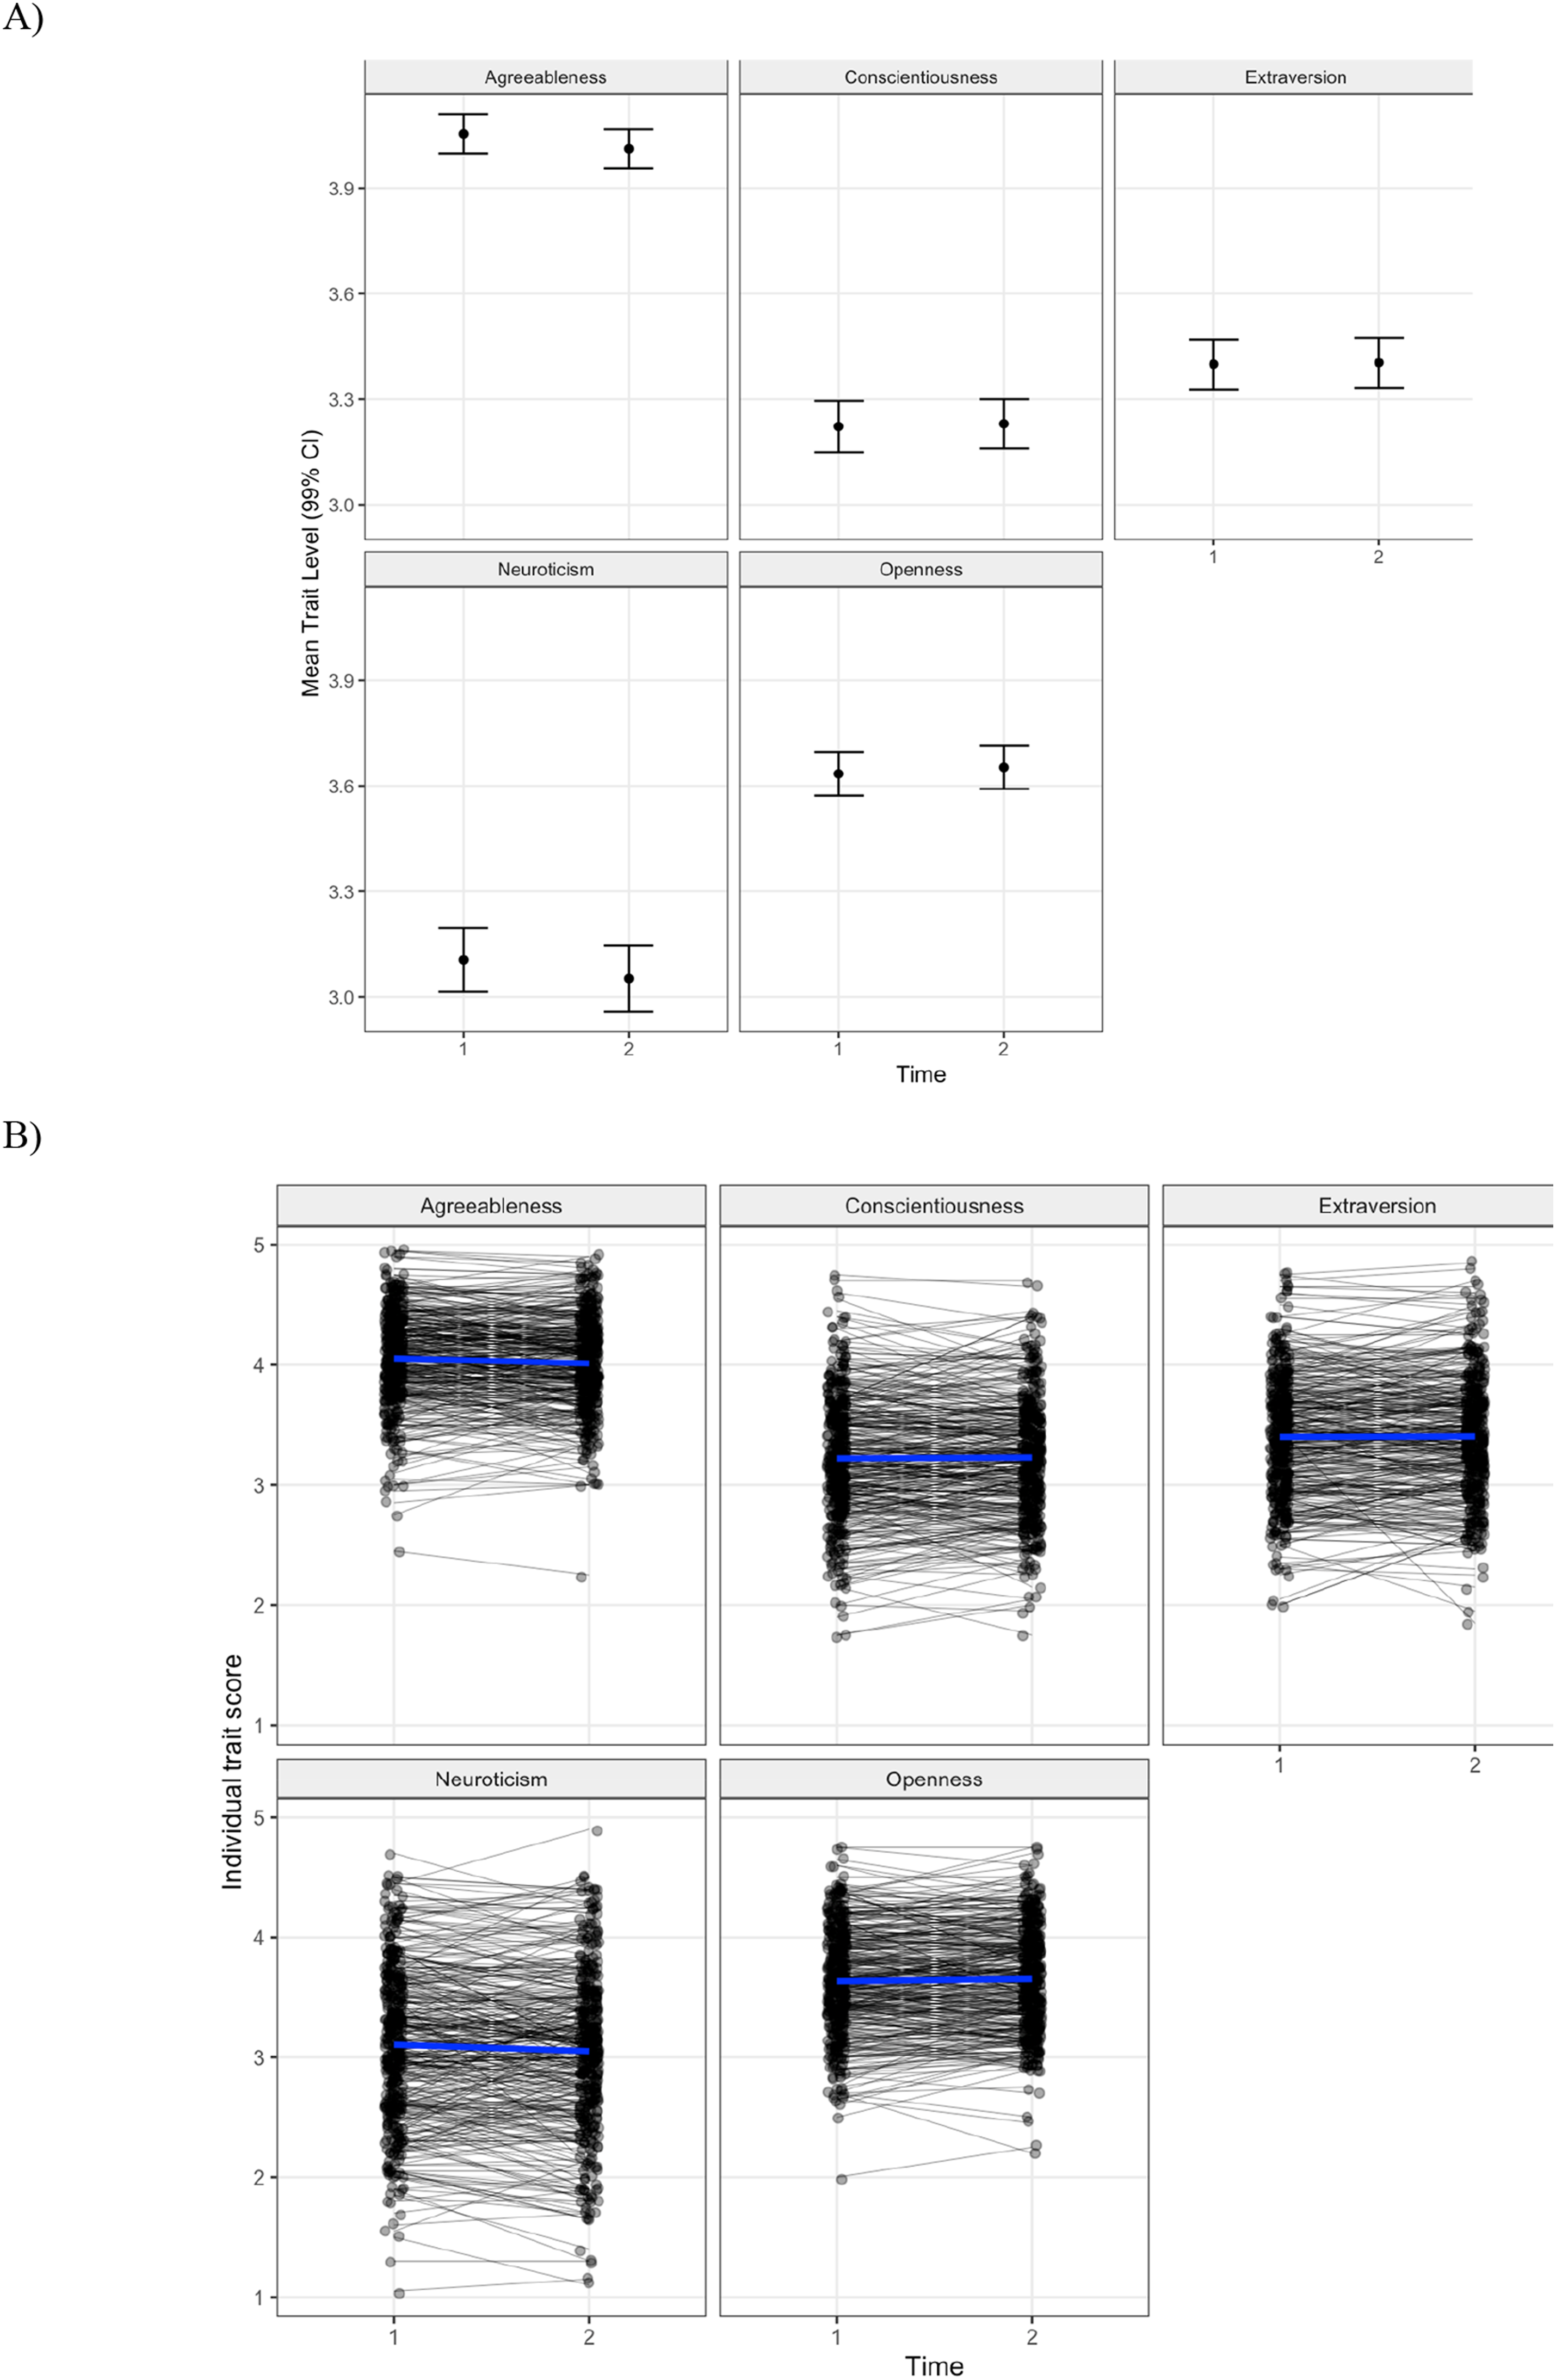
Personality mean levels and individual differences in change. Note. Shown are mean levels and their 99% confidence intervals in plot A. Plot B is based on the raw mean scores across time, with the blue line indicating average change, whereas each gray line represents one participant’s scores.
Study groups varied in how often they reported having met over the course of the semester, with meetings for study purposes occurring more often (M = 3.04, SD = 0.97, range = 1.33–5) than meetings for private purposes where the majority of groups reported having never met privately (M = 1.29, SD = 0.44, range = 1–3; for histograms, see html-document section 8.7 on https://osf.io/atzg6/).
Within the nesting structure, intraclass coefficients (ICCs) showed that a majority of variance lay at the person level (ICC range: .82–.87). Little variance was explained by the study group level (ICC range: .10–.23). This proportion of explained variance was even lower when only considering nesting in study groups individually at each time point (ICC range: <.001–.13). Very little additional variance was explained by the study group level in three-level models 3 (see html-document section 4.6 on https://osf.io/atzg6/).
Structural equation models demonstrated strict measurement invariance over time for all Big Five traits (see html-document section 8.6.2 on https://osf.io/atzg6/), although this was only possible with models containing parcels as indicators (Meade & Kroustalis, 2006).
Manipulation check
The manipulation check indicated that, for all traits except conscientiousness, there was no significant relationship between individual and group personality at T1 when study groups were randomly assigned (all p > .05; see also Figure 2). However, for conscientiousness there was a slight positive effect such that with higher individual conscientiousness at T1 there was a slightly higher likelihood of ending up in a study group with initially higher conscientiousness scores, b = 0.26, 99% CI [0.05; 0.46], p = .001. Therefore, we found strong support that random assignment to the study groups worked, with a slight caveat for conscientiousness. Manipulation check of the relation of individual and group personality at T1 Note. Shown are levels of personality traits at T1 on the Big Five Aspects Scales ranging from 1 to 5.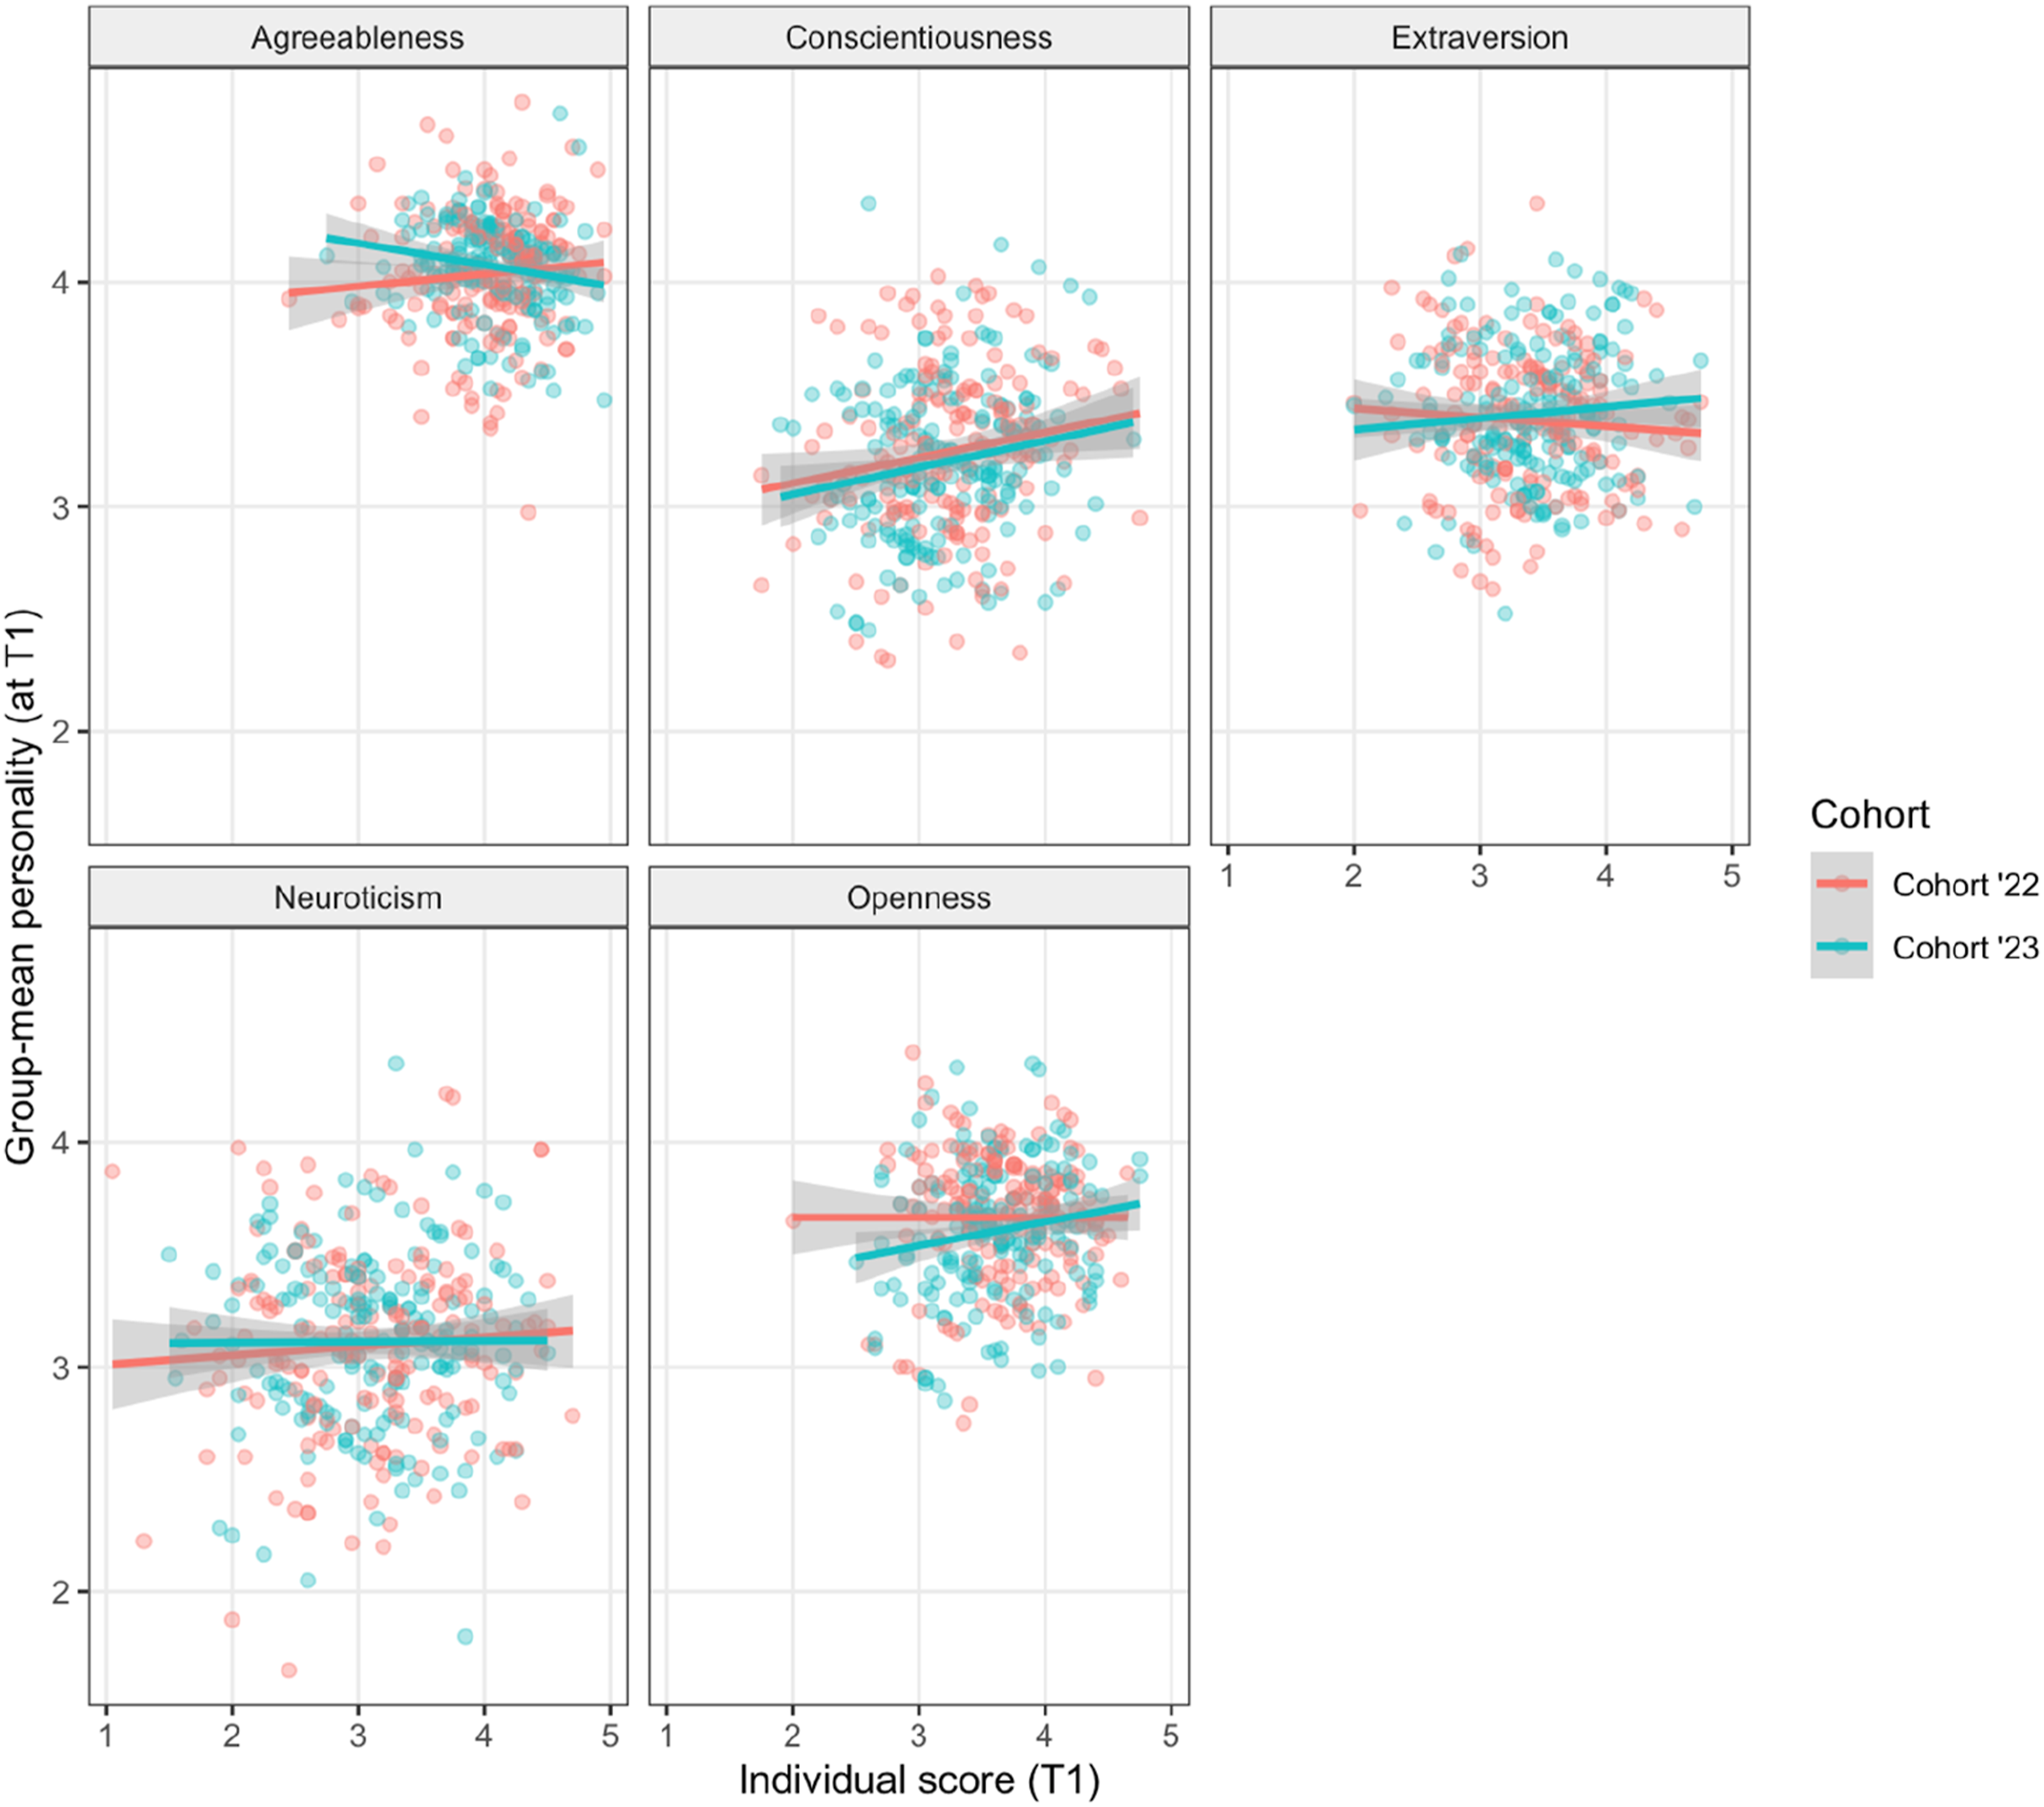
Confirmatory models
The effects of interest from the confirmatory multilevel models referred to the interaction effect of time and the distance between individual and group personality at T1. We found small but significant interaction effects for all five traits (openness: b = 0.13, 99% CI [0.07; 0.19], p < .001; conscientiousness: b = 0.13, 99% CI [0.07; 0.19], p < .001; extraversion: b = 0.07, 99% CI [0.01; 0.13], p = .003; agreeableness: b = 0.14, 99% CI [0.07; 0.20], p < .001; neuroticism: b = 0.07, 99% CI [0.01; 0.13], p = .003; see Figure 3). This suggested that, if the target student started out in a study group where the remaining group members had higher scores in a trait than the target student, the target student would increase more strongly in that trait compared to someone who had the same initial level as their group. Conversely, if the target student was in a study group where the remaining group members had lower scores in a trait than the target student did, the target student would decrease more strongly than someone with the same initial level as their group. This pattern would appear to suggest socialization effects, such that group personality influenced individual personality change over the course of the semester. Personality trait change depending on distance of individual and group personality at T1. Note. Distance represents the difference between an individual i’s personality score and the scores of the remaining group members (excluding individual i) at T1. A higher value indicates being lower in a trait at T1 than the group, on average (see Table 1, row 2). Shown are the model-based predictions. Effects reflect changes in personality outcomes on the Big Five Aspects Scales ranging from 1 to 5. Confidence bands (99%) reflect the precision of the estimated effects.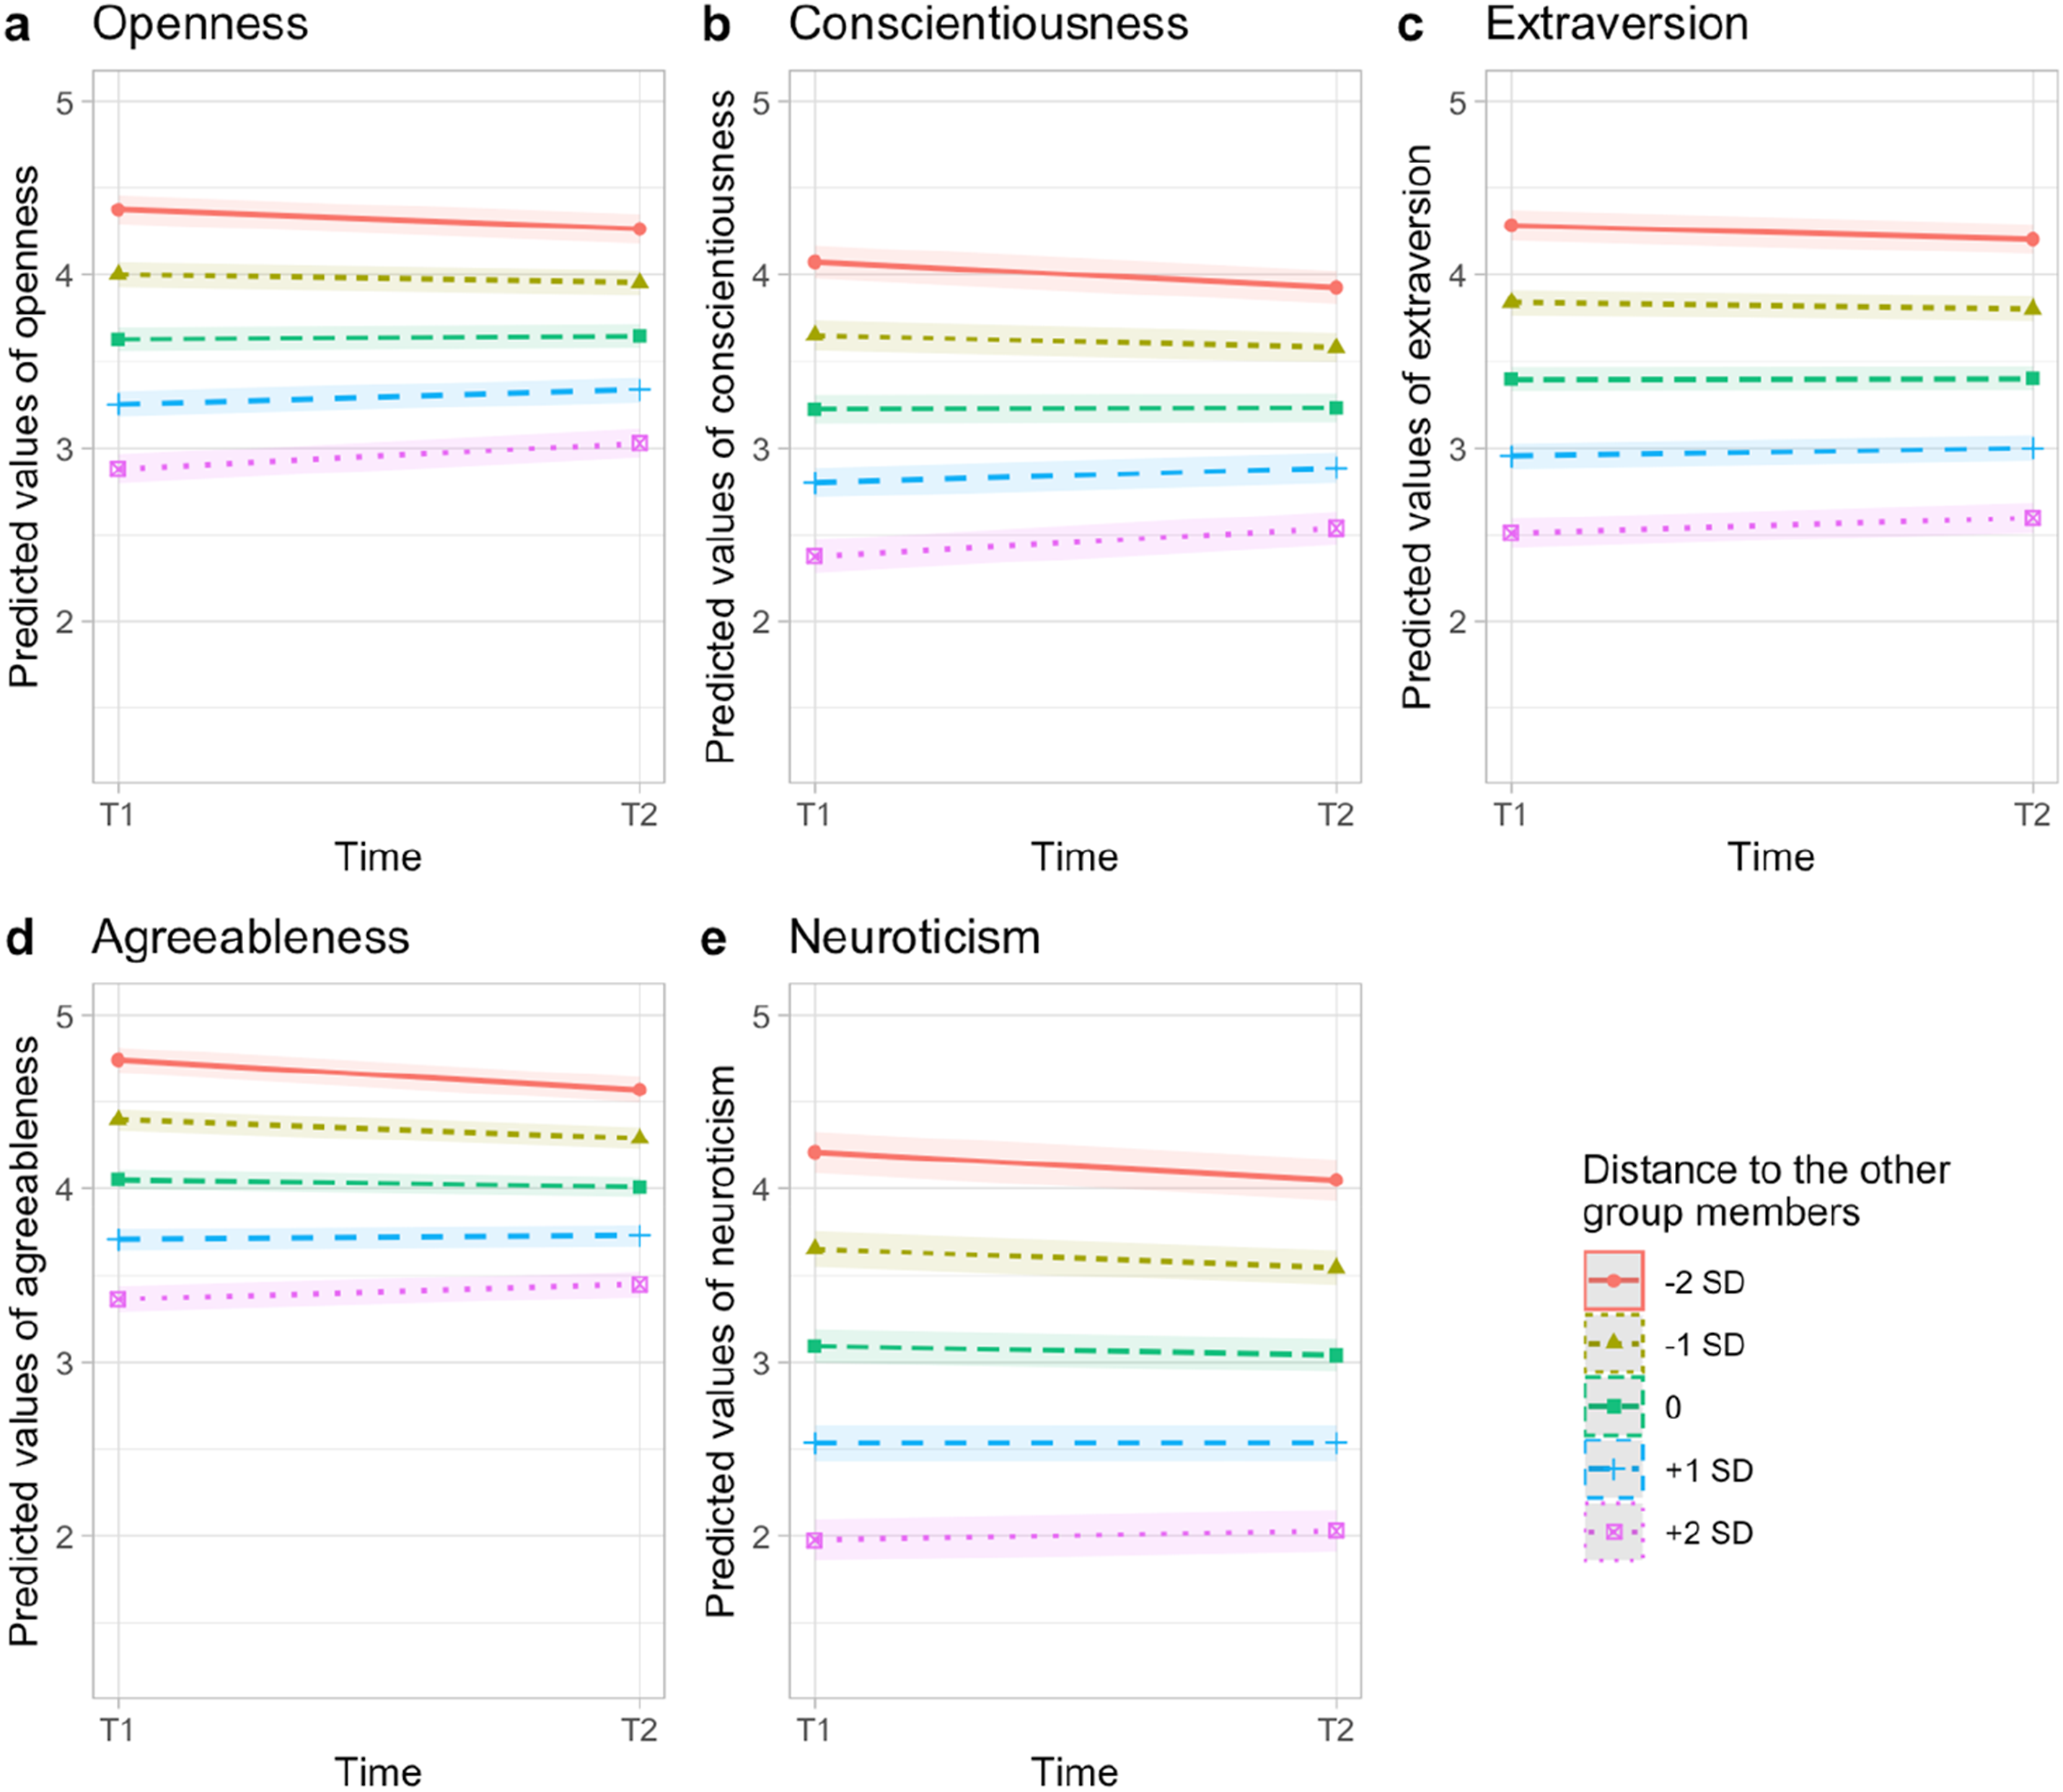
Robustness checks and exploratory analyses
We conducted a number of checks to gauge the robustness of these results and explore alternative explanations for these patterns. We also examined different measures of how the individual related to their study group in exploratory analyses.
Control variables and additional moderation analyses
Results were robust to adding gender, age, the remaining four Big Five traits as well as study group averages of these indicators and the frequency of group meetings as control variables to the models (see html-document section 6.3.1 on https://osf.io/atzg6/).
The frequency of meetings among study group members did not moderate effects of personality change through peers (see html-document section 8.7 on https://osf.io/atzg6/). This absence of moderation effects was found for meetings in the university context and in private contexts. In addition, we tested whether the degree to which participants liked the peers in their study group (assessed with a single 5-point Likert item “On the whole, I like the fellow students in my study group”) moderated personality change through peers but found no evidence of such moderation effects (see html-document section 8.8 on https://osf.io/atzg6/). 4
Alternative model specifications
We ran alternative specifications of multilevel models using group-mean centering of individual personality at T1 and adding the grand-mean-centered group means to the model, which is the more traditional approach in the multilevel literature (Hoffman, 2015; Hoffman & Walters, 2022). Similar to using the distance measure, we found that individuals changed slightly differently depending on the relation of their own personality to that of the group (openness: b = −0.15, 99% CI [−0.22; −0.08], p < .001; conscientiousness: b = −0.17, 99% CI [−0.23; −0.10], p < .001; extraversion: b = −0.13, 99% CI [−0.20; −0.06], p < .001; agreeableness: b = −0.18, 99% CI [−0.26; −0.10], p < .001; neuroticism: b = −0.10, 99% CI [−0.17; −0.03], p < .001). In this case, a negative interaction coefficient indicated that being above the group mean at T1 was associated with trait decreases over time (see Figure S3). In addition, students’ trait changes were more negative with a higher mean of the remaining group members (in relation to the grand mean; see html-document section 6.3.2 on https://osf.io/atzg6/). However, this was not significant at p < .01 for openness (p = .034) and neuroticism (p = .041).
In addition, we collapsed the three-level nested structure of the data into a more parsimonious two-level structure with individuals’ change scores (T2-T1) nested in study groups. Results were highly similar to the three-level models (see html-document section 6.3.3 on https://osf.io/atzg6/), both when using the distance measure and using the group-mean centering approach.
To gauge whether measurement error biased the multilevel models based on manifest personality scale scores, we ran latent change score models. First, we estimated main effects of change in personality over time and, second, extending these models to include moderation effects, estimated to what extent the distance of one’s own personality to that of the remaining group members (see html-document section 8.6 on https://osf.io/atzg6/). Model fit of the moderated latent change score models was good (CFI > .993, RMSEA < .059, and SRMR <.032). Both main effects of change and moderation effects by the distance scores were highly similar for all five trait dimensions—indicating that the influence of measurement error on the results is negligible.
Checks for regression to the mean
However, even though these previous robustness checks supported conclusions from the preregistered, confirmatory model, they did not rule out the possibility of regression to the mean as an alternative explanation for these patterns of results. Therefore, we conducted several checks to determine to what extent the effects we found could be attributed to the substantive effect of the experimentally manipulated study group composition or to the statistical artifact of regression to the mean.
First, we ran multilevel models with grand-mean centered predictors instead of the distance measure or group-mean centered predictors described above (see Table 1, row 5). Estimates of the interaction effect of time and the grand-mean centered individual personality at T1 were similar to the confirmatory results (only with a different sign because of the way these indicators were coded) and to those of the previous robustness check (openness: b = −0.15, 99% CI [−0.22; −0.08], p < .001; conscientiousness: b = −0.16, 99% CI [−0.23; −0.10], p < .001; extraversion: b = −0.13, 99% CI [−0.20; −0.06], p < .001; agreeableness: b = −0.18, 99% CI [−0.26; −0.10], p < .001; neuroticism: b = −0.10, 99% CI [−0.17; −0.03], p < .001; see Figure S4 and html-document section 7.1 on https://osf.io/atzg6/). While not a definitive check yet, this high similarity represents a first indication that regression to the mean explained these patterns.
Second, we examined regression to the mean more specifically in relation to study group composition. We randomly shuffled the study group allocation of students while keeping the number of study groups and study group sizes as they were and reran both the confirmatory and the group-mean centered models based on these fictional groupings (see html-document section 7.2 on https://osf.io/atzg6/). Results were remarkably similar to the original models for all Big Five traits (confirmatory models, openness: b = 0.10, 99% CI [0.04; 0.20], p < .001; conscientiousness: b = 0.12, 99% CI [0.07; 0.18], p < .001; extraversion: b = 0.11, 99% CI [0.05; 0.17], p = .003; agreeableness: b = 0.14, 99% CI [0.07; 0.21], p < .001; neuroticism: b = 0.08, 99% CI [0.03; 0.14], p < .001; see Figure 4). Personality trait change depending on distance of individual and group personality at T1 with randomly shuffled group allocation. Note. As a check for regression to the mean, the allocation to study groups was randomly shuffled. Distance represents the difference between an individual i’s personality score and the scores of the remaining randomly shuffled group members (excluding individual i) at T1. A higher value indicates being lower in a trait at T1 than the randomly shuffled group, on average. Shown are the model-based predictions. Effects reflect changes in personality outcomes on the Big Five Aspects Scales ranging from 1 to 5. Confidence bands (99%) reflect the precision of the estimated effects.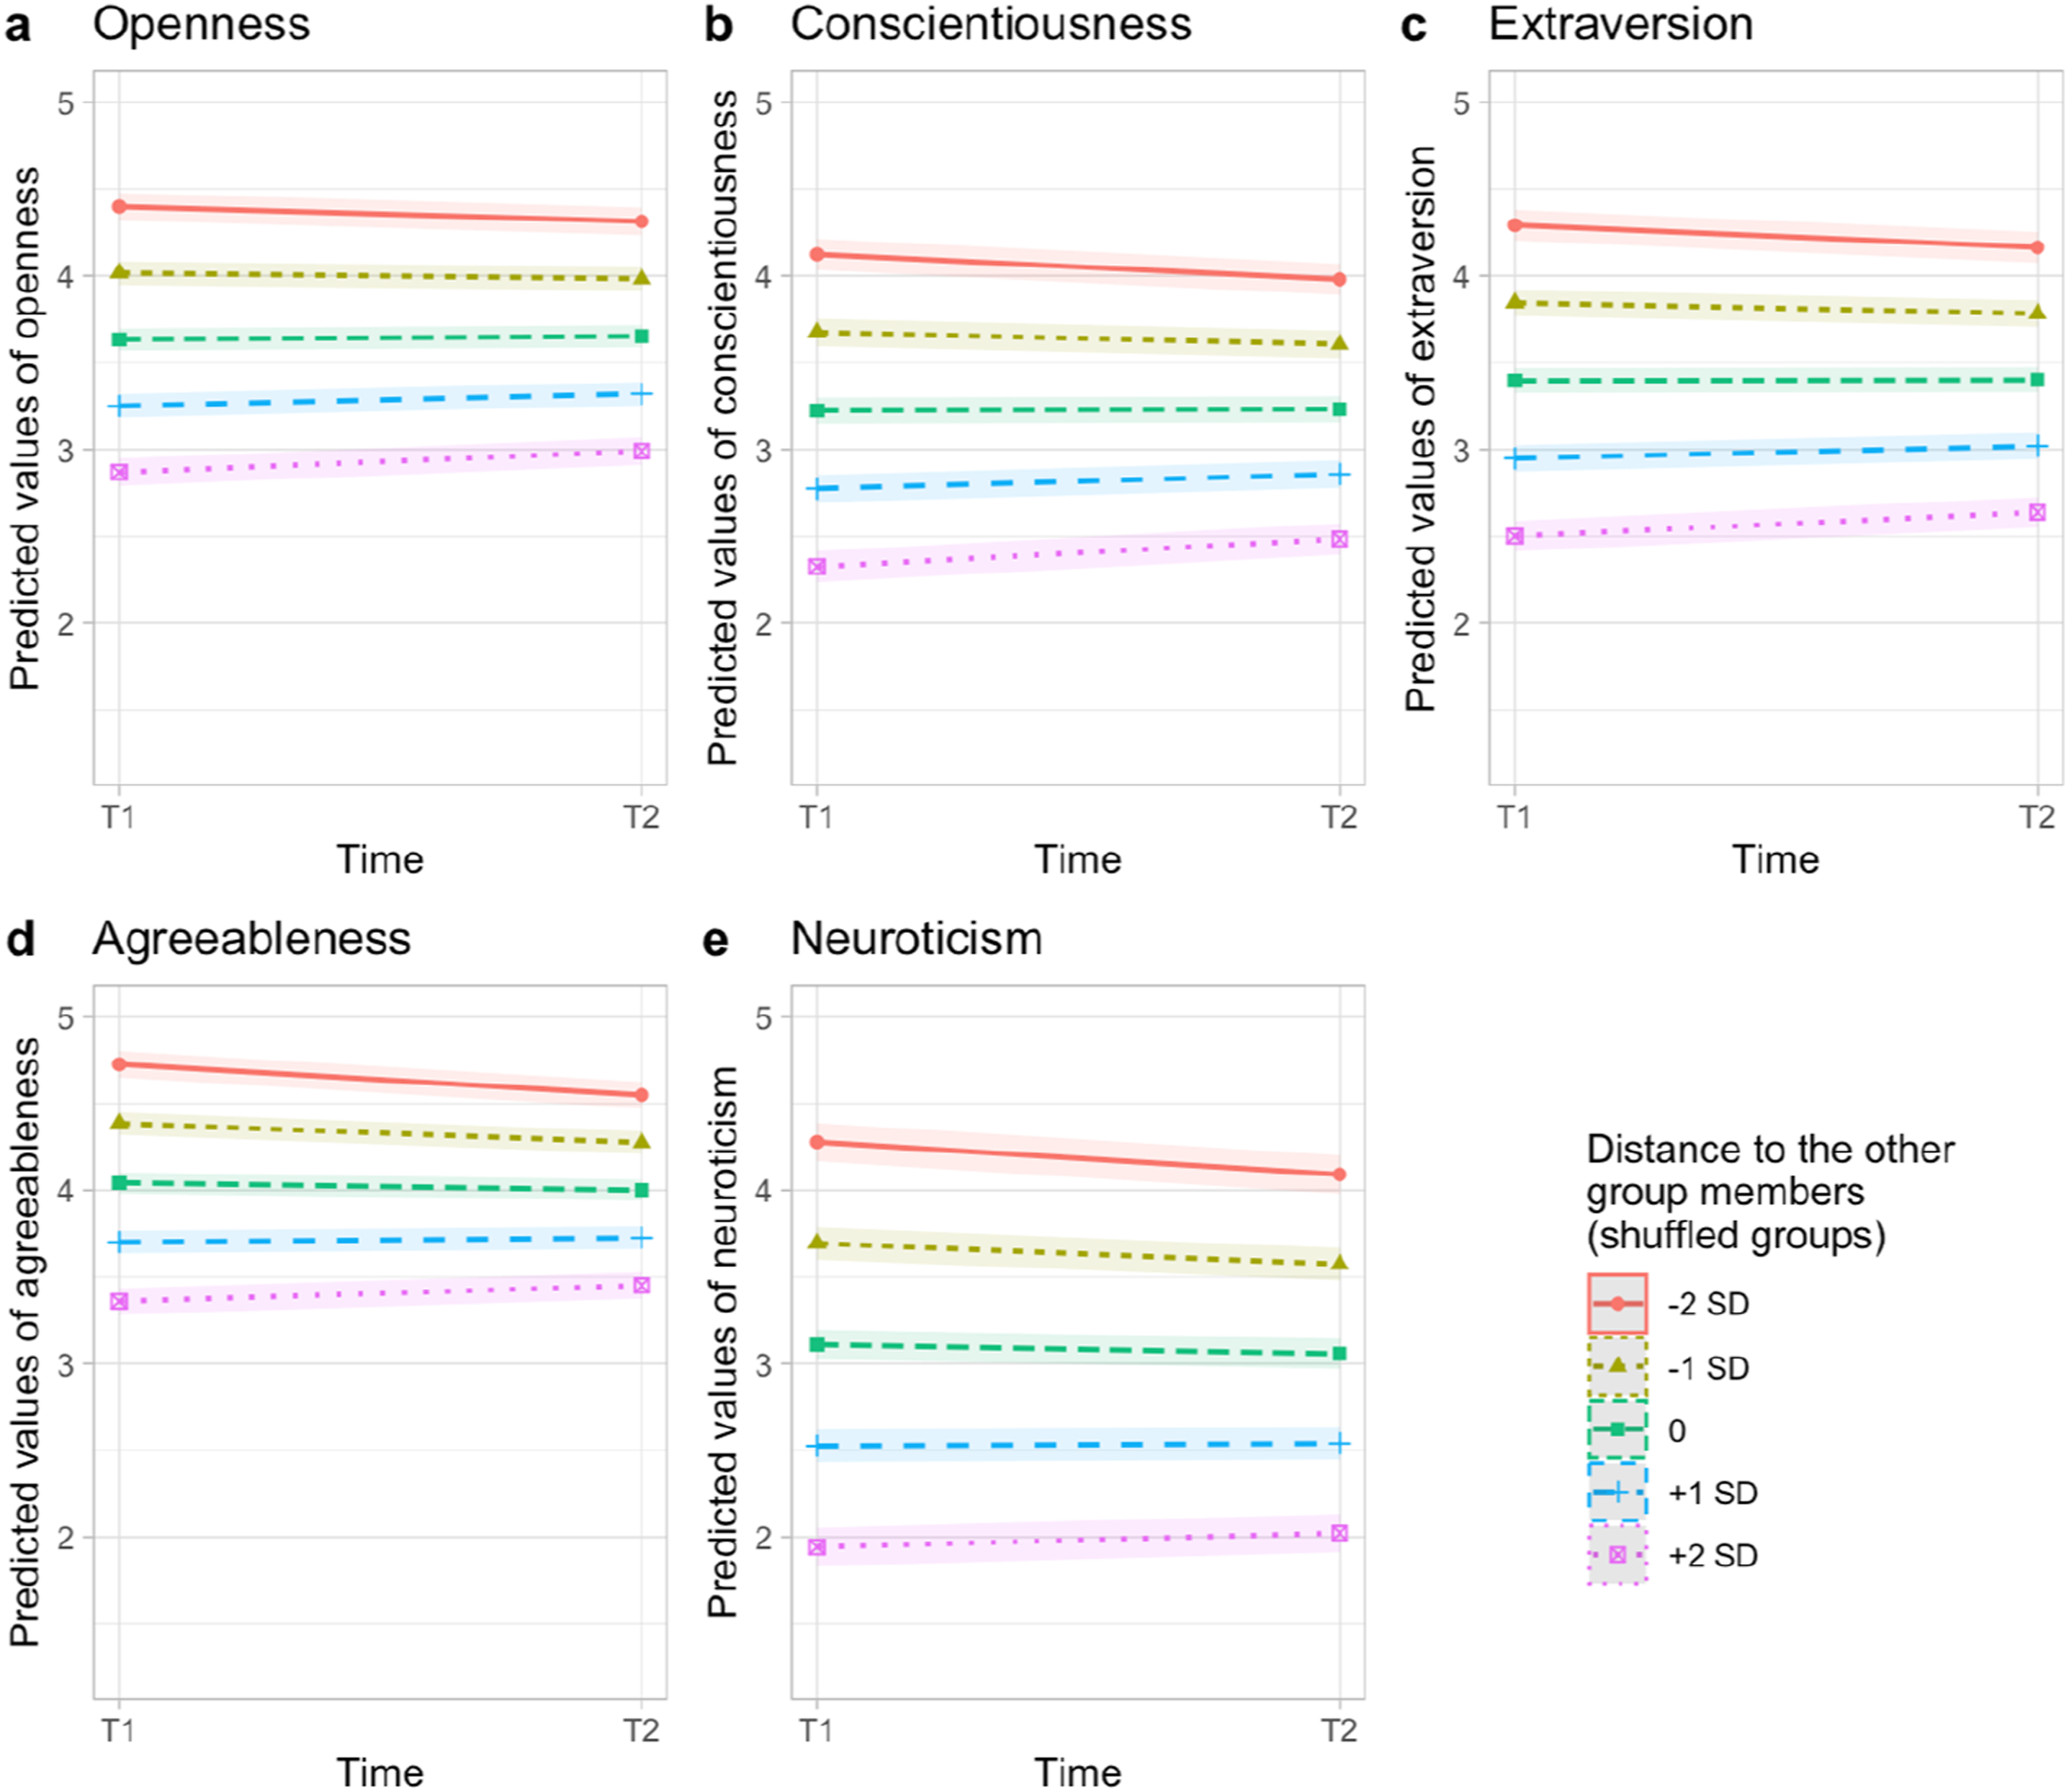
Third, as another strong test of regression to the mean, we reversed the time sequence (time = = 0 referring to T2 and time = = 1 to T1) and constructed measures of group personality at T2, accordingly (see html-document section 7.3 on https://osf.io/atzg6/). Again, we found very similar patterns of change across all Big Five traits, where students who scored higher in a trait in relation to their group decreased over (reversed) time and those who scored lower in a trait in relation to their group increased (confirmatory models, openness: b = 0.09, 99% CI [0.03; 0.16], p < .001; conscientiousness: b = 0.09, 99% CI [0.02; 0.15], p < .001; extraversion: b = 0.11, 99% CI [0.05; 0.17], p = .003; agreeableness: b = 0.13, 99% CI [0.06; 0.20], p < .001; neuroticism: b = 0.14, 99% CI [0.08; 0.20], p < .001; see Figure 5). Personality trait change depending on individual and group personality at T2 using the reversed time sequence. Note. As a check for regression to the mean, the time variable was reversed for these robustness analyses so that time = = 0 represented T2 and time = = 1 represented T1. Distance represents the difference between an individual i’s personality score and the scores of the remaining group members (excluding individual i) at T2. A higher value indicates being lower in a trait at T2 than the group, on average. Shown are the model-based predictions. Effects reflect changes in personality outcomes on the Big Five Aspects Scales ranging from 1 to 5. Confidence bands (99%) reflect the precision of the estimated effects.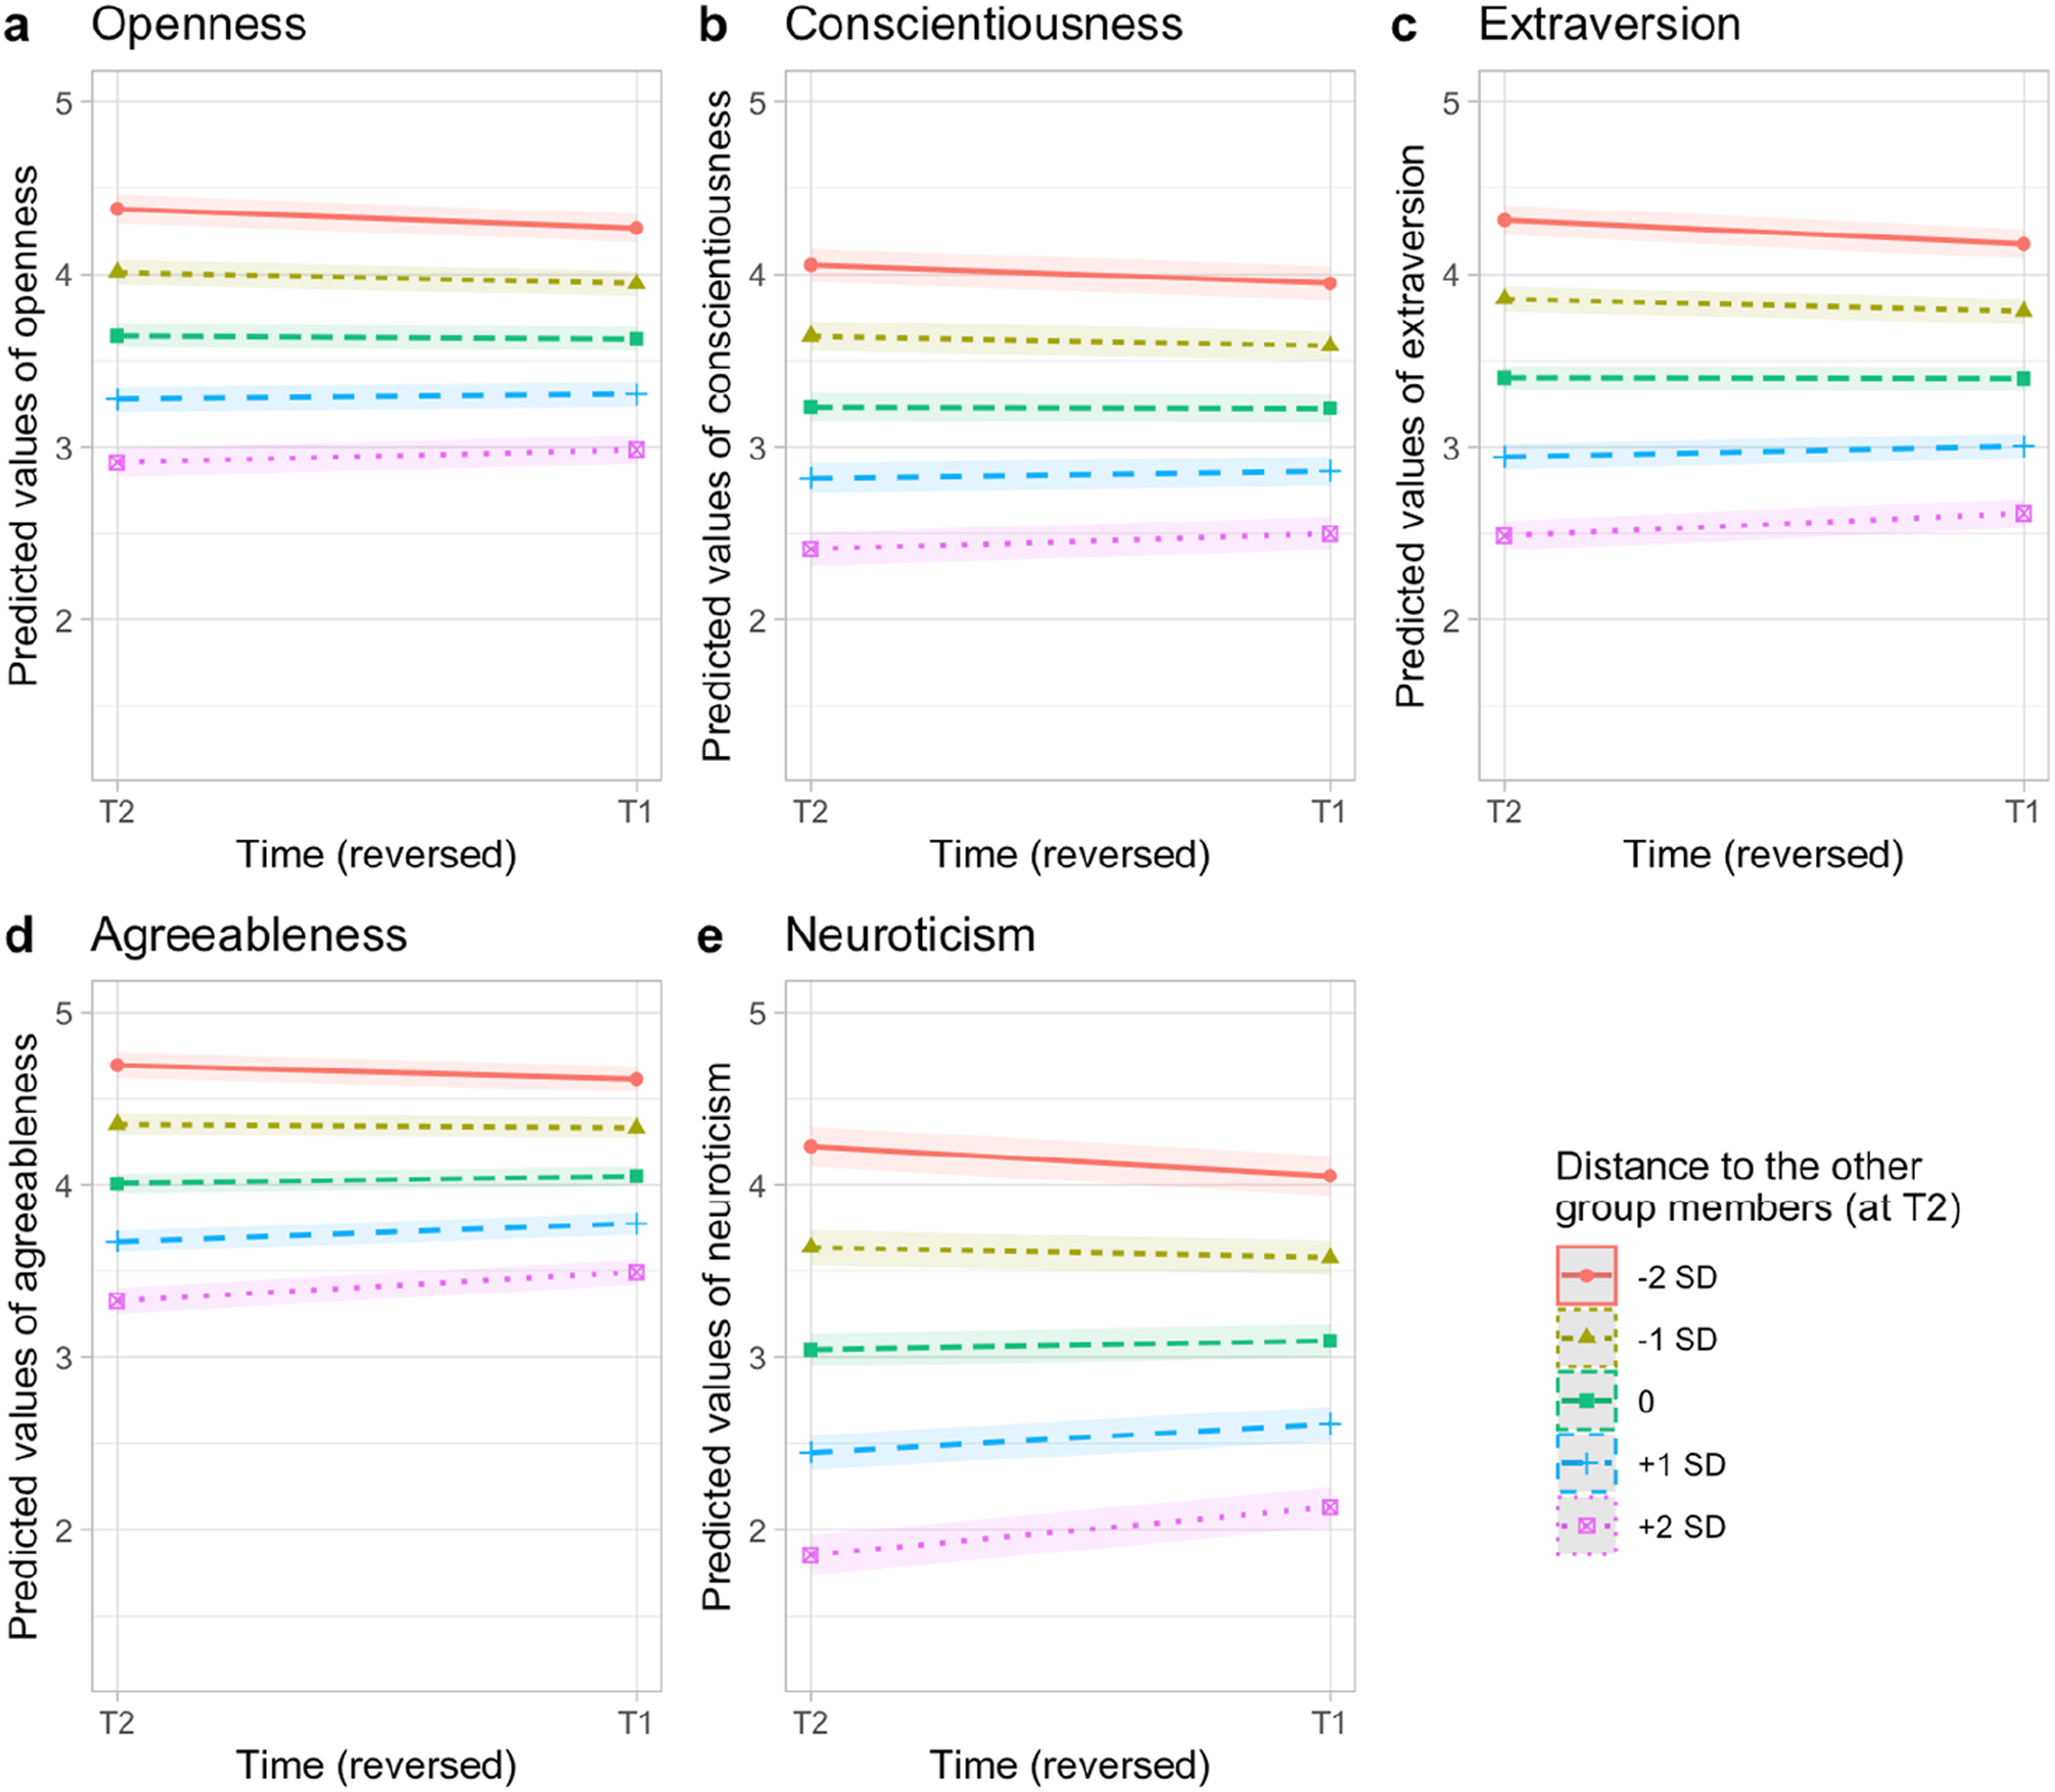
Additionally, we performed a graphical check (see Figure S5) of whether initial individual trait levels related to the magnitude and direction of change which can indicate regression to the mean (Barnett et al., 2005) and looked at other scales assessed in the sample as benchmarks where we had no strong reasons based on theory or prior literature to expect effects of the study group composition (see Figure S6 and html-document section 7.4 on https://osf.io/atzg6/). Both of these checks also pointed in the direction of regression to the mean influencing the current results.
Exploratory results
As preregistered exploratory analyses, we investigated whether the distance between a student and the lowest or highest scoring member of their study group acted as a moderator of changes in personality. With the distance to the lowest group member, this was the case for openness, b = −0.11, 99% CI [−0.18; −0.04], p < .001, conscientiousness, b = −0.12, 99% CI [−0.19; −0.05], p < .001, and agreeableness, b = −0.09, 99% CI [−0.17; −0.01], p = .003 (see Figure S7 and html-document section 8.3 on https://osf.io/atzg6/).
Similarly, we found moderation effects for the distance to the highest group member for openness, b = 0.11, 99% CI [0.04; 0.19], p < .001, conscientiousness, b = −0.13, 99% CI [0.06; 0.20], p < .001, and agreeableness, b = 0.18, 99% CI [0.10; 0.26], p < .001 (see Figure S7 and html-document section 8.2 on https://osf.io/atzg6/). However, similar concerns regarding regression to the mean as described above apply here. Indeed, robustness checks based on the reversed time sequence found evidence for such bias in the analyses of distances to the lowest and highest group member (see html-document sections 8.2 and 8.3).
Last, as preregistered, we explored whether initial within-group personality variability of the randomly assigned study groups would influence to what extent students changed in personality over the course of the semester. Generally, this was not the case, with only suggestive evidence that students in groups with higher initial heterogeneity in agreeableness increased more strongly in that trait, b = 0.19, 99% CI [−0.01; 0.39], p = .013 (html-document section 8.1.2 on https://osf.io/atzg6/). There was also no evidence that groups changed in their within-group personality variability over time or that increased group similarity moderated changes in individual well-being (see Appendix A in the Supplemental Material).
Discussion
The goal of the current study was to examine whether personality change in young adults would be influenced by the people they were randomly assigned to interact with over the course of their first semester at university. Descriptive evidence and theories of personality trait change and empirical accounts emphasized that young adulthood is especially conducive to personality development (Bleidorn et al., 2018, 2022; Lüdtke et al., 2011; Ringwald et al., 2023) and that peer groups might account for substantial portions of the variance in change (J. R. Harris, 1995; Reitz et al., 2014; van Zalk et al., 2020).
Patterns of results from the confirmatory models seemed to support the hypothesis that the personality composition of the assigned study group members influenced individual personality change over time on a pattern of assimilation. However, a more extensive examination suggested that these effects can be attributed to regression to the mean (Barnett et al., 2005). These findings both provide important information about the sensitivity of personality change to socialization in young adulthood and point to important methodological considerations for this kind of research.
Peer group influence on personality trait change or regression to the mean?
Our rationale for expecting an influence of the peer group on individual personality change was based on theoretical frameworks emphasizing the importance of social relationships with peers for personality trait change (e.g., Back et al., 2011; Reitz et al., 2014; Wrzus & Neyer, 2016) as well as previous empirical literature suggesting such peer effects in the context of friendships (e.g., van Zalk et al., 2020) and other young adult peer groups that likely have considerably less frequent social interactions (e.g., Shan & Zölitz, 2022).
In our main confirmatory analyses, we examined how the distance between individual and peer group personality was associated with differential change in each trait. Overall, the preregistered models as well as several, alternative model specifications seemingly provided evidence to support the significance of such peer group effects. These models described a pattern of assimilation for all Big Five dimensions, 5 that is, an individual becoming slightly more similar to the group mean over time. Supporting these findings, individuals, on average, became more similar over time to the lowest-scoring and the highest-scoring member in their group. However, as described in detail in the results section, several robustness checks of these association lead us to believe that they should not be interpreted as face-value evidence for peer group influences on personality trait change but are instead indicative of the statistical artifact of regression to the mean. To summarize three of these checks, we found that effects were highly similar when (a) centering individual personality on the grand mean instead of the group mean, (b) randomly shuffling study group allocation, and (c) reversing the coding of time (T2 as the first measurement occasion and T1 as the second).
Thus, the current study contrasts earlier findings (Shan & Zölitz, 2022) which relied on a slightly larger sample but only a short-form personality inventory. These authors also used a different analytical strategy based on econometric fixed-effects models (McNeish & Kelley, 2019) predicting personality scores at T2 by individual and group scores at T1 (applying grand-mean centering of predictors) and reported significant peer group influences on individual changes in conscientiousness and openness. However, in light of the current findings, there remains some doubt whether these effects were truly due to peer group influences independent of regression to the mean and, consequently, we urge caution in interpreting them as substantive evidence in support of the hypothesis of socialization effects through young adult peer groups. Future research investigating peer group socialization effects should rule out regression to the mean as an alternative explanation by running robustness checks like the ones used here, or through study design, for example, randomly allocating students to control groups who are similar in size but do not receive the treatment (i.e., never meet with a study group; Barnett et al., 2005).
Intensity of social contact with the peer group
Going back to the theoretical models of personality change through social relationships (Back et al., 2011; J. R. Harris, 1995; Wrzus, 2021), it is possible that students did not meet often enough with their assigned peer groups to experience diverging personality states sufficiently frequently so that they might form new habits over time. This mechanism of habit formation based on gradual shifts in the state-level distribution of personality (Fleeson, 2001) is typically considered a critical precondition to persistent personality trait change (Jackson & Wright, 2024). One important difference to many previous studies on peer group influences in young adulthood (Borghuis et al., 2017; Reitz et al., 2014; van Zalk et al., 2020) was that we randomly assigned young adults to peer groups in the new environment of first-semester university life. This was, on the one hand, advantageous because it improved causal inference of the design (i.e., accounting for bias through selection effects) but, on the other hand, might have led to the group members meeting infrequently and mostly only for the incentivized meetings that were structured by specific group tasks. Informal exchanges that might build future friendships were not consistently pursued by most participants.
Thus, meetings with the randomly assigned group of peers were likely too infrequent or not intensive enough to trigger individual personality change. Many groups only reported to have met when incentivized by the café vouchers to perform the group tasks and conducted no further meetings for private purposes, although they also met in larger groups for class each week. Instead, other newly formed peer groups that students were proactively socializing with might have influenced their development. Thus, the current results also demonstrate that study designs that encourage students to meet with their randomly chosen peers are probably not suited to induce substantive personality change robustly. Following this logic, future research might attempt to implement more intensive “treatments” of potential social contact with the assigned peer group members and assess actual contact frequency and duration in daily life through experience sampling and mobile sensing (Ebner-Priemer & Santangelo, 2024; Harari et al., 2020; Roos et al., 2023). This might enable a closer look at the role of the intensity of social contact with peers as a mechanism of individual trait change.
Personality mean-level changes during the first semester at university
Independent of peer group influences, we found evidence that students decreased in their agreeableness and neuroticism on average, although these changes were relatively small. Notably, these decreases did not go hand in hand with an overall constrained variance which would have been indicative of a more general regression to the mean on the sample level. Previous studies demonstrated more pronounced mean-level changes across all Big Five traits emphasizing high malleability of personality during this phase of emerging adulthood (Bleidorn et al., 2018, 2022; Bleidorn & Schwaba, 2017; Lüdtke et al., 2011; Seifert et al., 2023). However, most studies examined trait change over longer time periods with time intervals of one year or longer between assessments. Beyond mean-level change (average effect of change across the whole sample), we found that many students increased or decreased substantially in the Big Five traits (Schwaba & Bleidorn, 2018), as evidenced by the presence of individual differences in change in basic random slope models of time predicting personality change.
Limitations
This study comes with some limitations. First, we did not examine other-perceptions of personality within the study groups or how an individual student perceived similarity to the other group members (Connelly & Ones, 2010; Vazire, 2010). From a lens model perspective (Brunswik, 1952), this additional perspective might explain further variance in effects of the peer group composition on individual trait change, especially if the accuracy of perceptions of other group members is low (Selfhout et al., 2009). For example, if a student does not perceive their group members to be more conscientious, even though they see themselves in that way in self-reports, we might not be able to capture the whole picture of peer group effects.
Second, although the random assignment of groups constituted an advantage of the study design for causal inference, it is possible that peer group influences on personality change only surface consistently with peers who someone naturally gravitates towards and likes such as friendship groups and not with groups that are formed by random assignment. Thus, our focus on predominantly weak social ties (Sandstrom & Dunn, 2014) in the form of study colleagues might also explain differences to previous work based on friendship groups (e.g., van Zalk et al., 2020). However, as explained above, with naturally formed and evolving friendship groups it is more challenging to separate selection from group socialization effects. Overall, differences in mechanisms of personality change through various types of social relationships such as romantic partners or friends have so far mostly been studied in isolation (e.g., Mund et al., 2016; Wrzus & Neyer, 2016), whereas interdependencies between social relationship types have only recently received attention (Buijs et al., 2022; Wrzus et al., 2024). Consequently, recent measurement advancements to capture the social life of a person more comprehensively might also advance future research on peer group influences on personality (Langener et al., 2023; Stadel et al., 2024).
Third, the examined time span of the current study may have been too short for peer group influences on personality development to sufficiently unfold (Hopwood et al., 2021). On average, 70–80 days transpired between T1 and T2. In contrast to the study by Shan and Zölitz (2022), we were not able to collect data at a second follow-up measurement. However, given the low frequency of meetings with the study group (especially in private settings), it remains doubtful whether much change depending on peers’ initial personality would have occurred until a later time point.
Fourth, given the relatively low intensity of engagement of students with their assigned study groups, there remains some doubt whether the experimental manipulation was sufficient to induce peer group effects. Future studies should attempt to broaden the range of peer group engagement by incentivizing more meetings. In addition, more elaborate assessments of student social networks and behavioral measures of social contact (e.g., social sensors using RFID badges; Elmer et al., 2019) could provide a more fine-grained measurement perspective on social engagement among students (Boda et al., 2020; Vörös et al., 2021).
Fifth, the unique context of the first year of studying at university provides a suitable context to study peer group influences on personality, both because of the typical age range of young adult students and their more fluid social groups (e.g., Lüdtke et al., 2011). For the current study, it also facilitated the random assignment to groups of peers who met over the course of a semester. At the same time, it remains unclear how well results generalize to other, more diverse populations, and future research might attempt conceptual replications in groups of young adults pursuing a vocational track instead of tertiary education to investigate peer group influences in other contexts.
Conclusion
In this examination and replication attempt of personality trait change through peer group influences (Shan & Zölitz, 2022), we tested whether university students randomly assigned to study groups changed differentially in their personality traits over the first semester depending on the personality composition of their study group’s peers. Although the preregistered models indicated that the individual assimilated towards the central group tendency in all Big Five traits, we subsequently found convincing evidence that these effects were due to the statistical artifact of regression to the mean (Barnett et al., 2005). Future research assessing social relationships with peers more comprehensively and encouraging more frequent peer meetups might reveal to what extent personality changes systematically as a function of the peers one interacts with, beyond the bias introduced by regression to the mean.
Supplemental Material
Supplemental Material - A replication attempt of personality change through randomized peer groups
Supplemental Material for A replication attempt of personality change through randomized peer groups by Michael D. Kramer, André Kretzschmar, Christopher J. Hopwood, and Wiebke Bleidorn in European Journal of Personality
Footnotes
Acknowledgments
We thank Philippe Sloksnath for his help with data preparation and documentation. We thank Sabrina Beck, Marco Bleiker, and Moritz M. Daum for enabling and supporting data collection.
Author Contributions
Michael D. Kramer: Conceptualization, Data Curation, Formal Analysis, Investigation, Methodology, Software, Visualization, Writing—Original Draft, and Writing—Review and Editing; André Kretzschmar: Methodology, Software, Investigation, Data Curation, Writing—Review and Editing, Supervision, and Project administration; Christopher J. Hopwood: Conceptualization, Methodology, Supervision, and Writing—Review and Editing; Wiebke Bleidorn: Conceptualization, Methodology, Supervision, Funding Acquisition, and Writing—Review and Editing.
Declaration of conflicting interests
The author(s) declared no potential conflicts of interest with respect to the research, authorship, and/or publication of this article.
Funding
The author(s) received no financial support for the research, authorship, and/or publication of this article.
Open science statement
The hypotheses, methods, and analysis plan were preregistered (https://osf.io/2xypa) on 2024-05-23 prior to any analyses. Data were already collected but not cleaned at this time. There was one minor deviation from the preregistration (see deviations_prereg.pdf). Materials: All study materials are publicly available (see Codebook_PAP.pdf). All data cleaning and analysis scripts as well as html-documents of output are publicly available (in folder “HTML: Cleaning,” documents “01_PAP_preparation.html” and “02_PAP_indices.html”; and folder “HTML: Results,” document “03_analyses_personality.html” on OSF). All relevant study data, materials, and scripts are uploaded to a third-party repository (![]() ).
).
Ethical statement
Supplemental Material
Supplemental material for this article is available online.
Notes
References
Supplementary Material
Please find the following supplemental material available below.
For Open Access articles published under a Creative Commons License, all supplemental material carries the same license as the article it is associated with.
For non-Open Access articles published, all supplemental material carries a non-exclusive license, and permission requests for re-use of supplemental material or any part of supplemental material shall be sent directly to the copyright owner as specified in the copyright notice associated with the article.