
Abstract
Personality traits are assumed to change slowly and incrementally. Recent intervention studies apparently challenge this assumption, showing that personality traits can also change quickly and substantially. However, how frequently do such quick changes manifest in the general population? This study sought to determine (1) a base rate of year-to-year changes in the general population and (2) the extent to which these shifts are related to longer-term change patterns. We examined year-to-year change in Big Five traits with nationally representative data from 7005 German participants, annually tracked for up to six years. Year-to-year patterns exhibited stability and change (e.g., ≥ 1 SD year-to-year change in ≈ 20%). Across participants, year-to-year trait score increases and decreases occurred in equal proportions, suggesting that in a given sample, year-to-year changes in different directions average out. Within participants, however, in all domains but agreeableness, year-to-year changes reliably propagated to longer-term trajectories. While much of the year-to-year change faded away in subsequent years, lasting shifts in individuals’ trait levels remained, particularly upon pronounced year-to-year decreases. Overall, (pronounced) year-to-year changes were relatively common, largely reversible, and yet predictive of individuals’ longer-term trajectories. We discuss how the results bridge set-point assumptions with assumptions of incremental trait change.
Plain language summary
Over adulthood, personality traits are assumed to change slowly and incrementally. Recent personality intervention studies apparently challenge this assumption. These studies have shown that personality traits can also change over few months or single years, a relatively short time span compared to the entire stretch of adulthood. However, it remains unclear how common short-term changes in personality traits—such as those occurring over a single year—are in the general population, and whether these short-term changes remain over multiple years. In the current study, we investigated the base rate and longer-term relevance of year-to-year change in personality traits. We used a large-scale population-representative sample in Germany, in which 7000 participants were tracked for up to six years, with annual reports on their personality traits using a short questionnaire. Results showed that year-to-year changes in personality trait scores were relatively common, and often relatively large by standards known to psychology. That is, change of 1 SD—the magnitude of change that is typical over the entire adulthood—happened in one out of five cases over a single year. As a limiting factor, this rate of change was, at least in part, inflated due to random fluctuations of an imprecise measurement instrument. The short-term changes largely reverted over time. Hence, instead of translating into persisting personality trait change, year-to-year shifts rather reflected temporary episodes. However, year-to-year changes did not revert completely. In four out of five personality domains, (pronounced) changes from one year to the next were related with the longer-term change observed over the six-year study period. Overall, quick shifts in personality traits were more common than typically assumed. While largely reversible, short-term changes offer important insights to psychologists' understanding of personality trait continuity and change.
Introduction
In Dickens’s classic holiday tale, A Christmas Carol, the character of Scrooge begins the story as a miserly, bitter, and unsympathetic man. Through a series of dramatic encounters with three ghosts, his personality is transformed in a remarkably short period of time. Scrooge emerges from his ordeal kinder, gentler, and more compassionate. Beyond the hopeful and sentimental nature of the turn Scrooge takes, the most compelling feature of the tale is the speed with which his personality changes. In little more than three nights, his character is completely rehabilitated.
As a rhetorical vehicle, the transformative narrative of A Christmas Carol is quite moving. But, does it have any parallel in the real world? Do people change their personalities quickly? And most importantly, do the changes stick? After all, if Scrooge simply went back to his miserly ways during the next holiday seasons, his single-year outlier would not be much of a redemptive story (McAdams, 2001). Such counterweight position to the Scrooge myth is the idea that personality is essentially fixed and anchored by set points (Costa et al., 2019). From a set-point perspective, Scrooge could change dramatically one year and then gravitate back to his set point of his original, curmudgeonly demeanor soon thereafter.
The research questions inspired by the Scrooge example remain little examined for the study of personality trait change. The long-term, modest developmental trends found in personality traits are commonly taken as evidence against the assumptions of quick, transformative personality trait change or of a strong set-point model (Bleidorn et al., 2022). Empirically, however, (1) it remains largely unexplored how prevalent short-term change in personality traits, such as from one year to the next, is in the general population. Also, (2) the extent to which short-term change relates to longer-term trajectories spanning several years has rarely been explicated. In the current study, we examine these questions with data from a large, probability-based, representative sample in Germany. Capitalizing on a multi-wave longitudinal study that annually tracks the respondents’ personality over a period of up to seven waves, we investigate whether year-to-year change in personality traits is indeed as rare (e.g., McCrae et al., 2000), reversible (e.g., Ormel et al., 2017), or unsystematic (e.g., Steyer et al., 2015) as dominant theories suggest; or whether it instead occurs more frequently and may entail longer-lasting trait change. Toward this end, we (1) determine the base rate of year-to-year change of varying magnitudes in personality traits in adults. Moreover, we examine (2) whether year-to-year change relates to individuals’ longer-term developmental trends over multiple years.
Perspectives on personality trait continuity and change drawn from long-term longitudinal research
Over the last few decades, a critical mass of longitudinal research has led to the conclusion that personality traits are relatively consistent, but not so consistent as to rule out the possibility of change (Fraley & Roberts, 2005; Roberts & Mroczek, 2008). On average, mean-level trait change does appear to occur, albeit at a modest rate of approximately .25 of a standard deviation per decade that accumulates with time (Bleidorn et al., 2022; Roberts et al., 2006). Large-scale studies (Schwaba et al., 2021) and studies that tracked personality traits for longer time spans (Damian et al., 2019) confirmed these meta-analytic estimates. The resulting picture is eminently reasonable: Personality traits are more consistent than changeable, but the changes that do occur, slowly and incrementally, can result in large changes over long time spans. And while individuals differ in their personality trait change (e.g., Schwaba & Bleidorn, 2018; Wagner et al., 2019), the average person becomes more conscientious, agreeable, and less neurotic over adulthood (Bleidorn et al., 2022; Roberts et al., 2006).
Slow and incremental change
Building on the evidence of slow and modest mean-level change in the population, it seemed reasonable to theorize that the process of change at the individual level was also incremental and nearly imperceptible (e.g., Dweck, 2017; Hennecke et al., 2014; Roberts & Jackson, 2008; Wrzus, 2021; Wrzus & Roberts, 2017). For instance, the sociogenomic model of personality (Roberts & Jackson, 2008) posits that trait changes occur via environmental and biological effects, which are mediated through repeated states. Small behavioral, attitudinal, and emotional changes recurring over time are assumed to slowly accrete, become internalized, and solidify into stable individual differences (Roberts, 2018).
Other frameworks also conceive trait change as a slow, incremental process (e.g., Dweck, 2017; Hennecke et al., 2014; Wrzus, 2021; Wrzus & Roberts, 2017). While these models differently emphasize underlying motivations (e.g., Dweck, 2017; Hennecke et al., 2014) or reflective processes (e.g., Wrzus & Roberts, 2017), they agree that trait changes evolve slowly through repeated momentary experiences. Even life events—which could be assumed to lead to relatively quick changes—have been associated with only small trait changes, and the changes that do occur appear to unfold slowly and incrementally (see Bleidorn et al., 2018 for a review). Hence, the occurrence of fast, transformative change was considered unlikely (Bleidorn et al., 2022; Roberts et al., 2006). Moreover, the long-term patterns of personality trait change generally increasing in magnitude were taken to indicate that people do not return to a fixed set point after the possible change. Hence, set-point models assuming that personality traits are anchored by fixed set points (Costa et al., 2019; Ormel et al., 2017) were also set aside.
Short- versus longer-term change
The conceptualization of individual trait change as a slow and incremental process enables a differentiation between short-term versus longer-term change in personality traits. It was assumed that it takes multiple years for repeated series of states to accrete into genuine personality trait change (Roberts et al., 2006; Roberts & Jackson, 2008). Therefore, any change that occurs over periods shorter than the time required for accretion—such as one year or less—could be considered short-term change. In turn, change that extends over several years can be considered longer-term change. Consistent with this reasoning, a single year indicates a relatively short time span in the scope of adulthood; and event-based research often treats the one-year interval after a life event as a special period to account for short-term personality trait changes (e.g., Denissen et al., 2019). In the following, we therefore consider change observed between single years (or even shorter periods) as short-term change that expands over several years as longer-term change. 1
Challenging the assumption of slow and incremental change
The conclusion from the studies reviewed thus far, most of them focusing on mean-level change in the general population, is that personality trait change happens slowly and incrementally (Roberts & Jackson, 2008). However, recent evidence from two strands of research challenges the conclusion that personality change necessarily occurs slowly and incrementally.
The first strand of evidence comes from research on personality change interventions. Routine interactions with therapists were discovered to result in marked changes in personality traits, most notably neuroticism (e.g., Bagby et al., 1995; De Fruyt et al., 2006; Roberts et al., 2017; Santor et al., 1997; Sauer-Zavala et al., 2021; Stieger et al., 2022; Tang et al., 2009). Further evidence that personality traits can be volitionally changed through intervention came from studies in non-clinical populations (e.g., Hudson et al., 2019; Hudson & Fraley, 2015; Stieger et al., 2020, 2021; see Jackson et al., 2021; Grosz et al., 2022 for reviews). For example, a 15-week intervention study found that volitional and active implementation of change behaviors was associated with changes in Big Five traits (Hudson et al., 2019). A recent randomized controlled trial of a three-month digital-coaching intervention also showed that participants who sought to change their personality traits often succeeded (Stieger et al., 2021), with several observed changes remaining for up to a year later (Stieger et al., 2023). Of course, the intervention studies often focus on selective samples. The prevalence of such changes in the general population, particularly in the absence of targeted interventions, is a question these studies leave unanswered.
The second strand of evidence comes from studies tracing personality around life events or transitions (e.g., Denissen et al., 2019; Schwaba & Bleidorn, 2018; Reitz et al., 2022; for a focus on adolescence, see Borghuis et al., 2017; Israel et al., 2023; Luyckx et al., 2014). Typically focusing on sensitive periods such as the transition to work (e.g., Bleidorn, 2012), these studies showed that personality traits can change relatively quickly, such as from one year to the next. Also, individuals did not change alike in those periods but differed in their change patterns (e.g., Reitz et al., 2022).
Both strands of research share two conspicuous features. First, the reported changes—manifesting over a few months—occurred relatively quickly. Second, the magnitude of the short-term changes was not small by standards known to psychology. For the interventions, effect sizes ranged from one-third to more than one half of a standard deviation (e.g., Jackson et al., 2021), which is about half the average amount of change found in studies tracking change for >40 years across adulthood (Damian et al., 2019). Thus, not only do these studies show that personality traits can change in the short term, but they also show that short-term changes can be relatively large by lifespan standards.
Reconciling slow and incremental change with short-term and marked change
If personality traits can and do change quickly and markedly as has been shown in these studies, then how do we reconcile this with the slow, incremental picture that emerges from long-term observational studies? In Figure 1, we depict that such modest incremental mean-level changes are compatible with different patterns of changes in the short term. The assumption of slow and incremental change at the individual level (e.g., Roberts & Jackson, 2008) is but one possibility (Scenario A: slow and incremental change) to result in incremental and modest mean-level changes in the population. Schematic scenarios for how different patterns of short-term change result in modest incremental change at sample level. Different scenarios of how the modest, incremental change at the sample level (bold line) can result from different prototypical patterns of short-term change at the individual level (thin lines).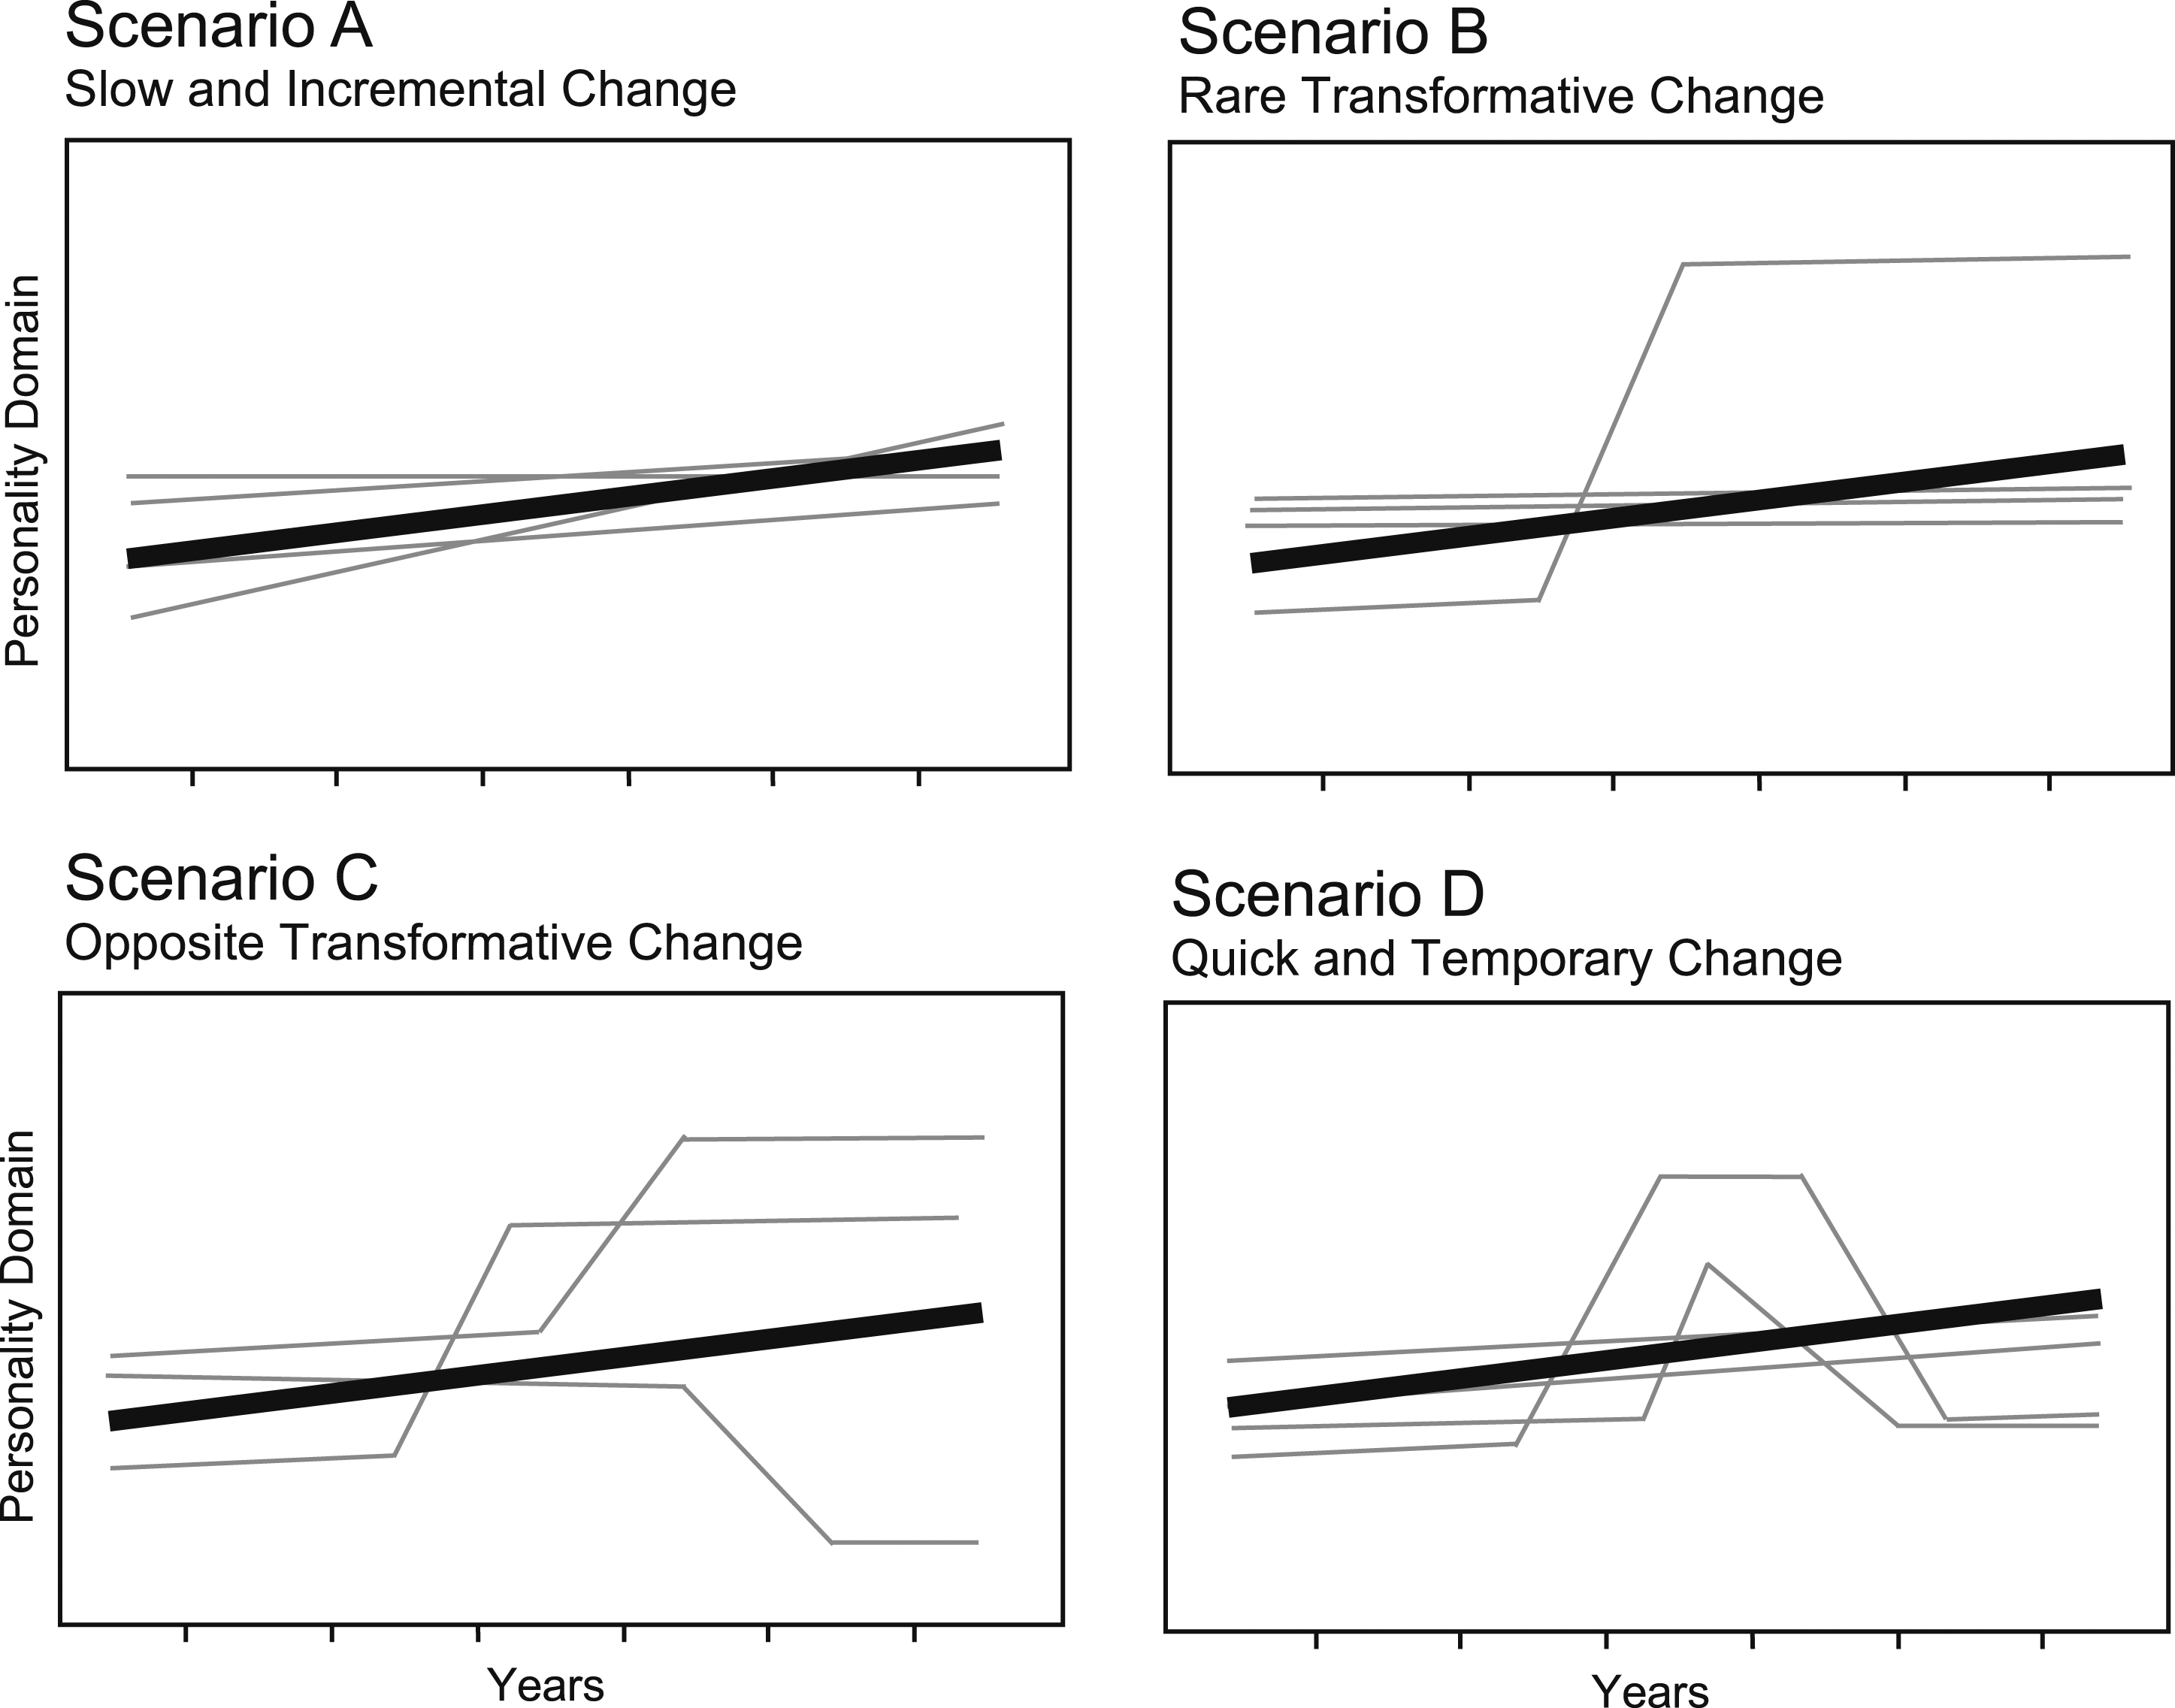
A different possibility is that the population means with modest changes over long periods of time occur as a result of a minority of individuals who change dramatically over relatively short periods. Combining a small group of quick changers with a group of predominantly stable individuals can result in a small average effect size (Scenario B: rare transformative change). If that scenario were true, neither small, incremental changes nor a set-point model would adequately describe the longitudinal pattern of most individuals but rather processes of stability and sudden, transformative change.
A further possibility is that the direction of quick, transformative change differs between persons, such that at the population level, quick gains and losses cancel each other out (Denissen et al., 2019; Reitz et al., 2022). That is, short-term changes could lastingly alter individuals’ trait levels, even dramatically; however, if both gains and losses occur in roughly equal proportions, the population mean would show no or only modest changes over long periods of time (Scenario C: opposite transformative change). In this scenario, too, sudden, transformative, and lasting changes would best describe the longitudinal pattern of most individuals, even though these patterns would not be evident at the aggregate level.
Lastly, and akin to set-point models (e.g., Ormel et al., 2017), changes could occur over short periods of time but may not be lasting (Fraley et al., 2021). After a quick and potentially dramatic change, individuals might bounce back to their baseline. Similar to conceptualizing change as temporary state-like deviations (Steyer et al., 2015), quick changes in personality trait levels might reflect short-lived episodes without consequences in the longer term (Scenario D: quick and temporary change). To the extent that the population mean changes modestly over time, this scenario would reflect both a set-point and a developmental perspective on personality traits.
Of course, a combination of these possibilities is also conceivable. Short-term changes could bounce back in some individuals but stick in others (Fraley et al., 2021). Alternatively, while a minority of individuals could show fast, transformative change, a majority could experience more modest and incremental change. In any case, the different scenarios highlight that distinct patterns of (pronounced) short-term changes may lie behind the slow and incremental change observed at the sample level; and that short-term changes can have very different relations to longer-term trajectories at the individual level.
Therefore, the recent evidence suggesting that personality traits can also change in the short term raises at least two questions: First, what is the base rate of personality trait change over short periods of time in the general population for different magnitudes of change (e.g., 1 SD, 2 SD)? And second, can such short-term change translate into longer-term patterns of change, and if so, how?
Examinations of year-to-year and longer-term change in personality traits
To date, the reality of how personality traits change in the short term—such as from one year to the next—has not been closely studied, and even less so for the general population. Many longitudinal surveys assess personality only once every few years (e.g., 4 or 10 years; Brim et al., 2004; Goebel et al., 2019; see also Rammstedt et al., 2023). And although studies on personality trait change using data from multiple one-year intervals, or shorter, do indeed exist (e.g., Denissen et al., 2019; Israel et al., 2023; Reitz et al., 2022; Schwaba & Bleidorn, 2018), the base rate of year-to-year changes in the general population and the short-term patterns underlying longer-term change as displayed in Figure 1 remain open questions. That is, these studies typically conduct year-to-year analyses within complex, multilevel statistical models (e.g., Luo et al., 2022), such that the correlates of change are tested, but estimates of the prevalence and magnitude of short-term change are not reported. Also, year-to-year measures are primarily used to estimate longer-term trajectories (e.g., > 5 years). This means that year-to-year changes feed into estimating an overarching growth trajectory, but the degree to which year-to-year deviations remain in the longer term is not explicitly considered.
Nonetheless, several existing studies inform our questions on year-to-year change in personality trait scores. Using data from the Longitudinal Internet Studies for the Social Sciences (LISS, Scherpenzeel, 2011), Schwaba and Bleidorn (2018) showed reliable individual differences in change in personality traits across all age groups in the general population. This raises the possibility of the occurrence of short-term change: If people reliably differ in the amount of change, they may also differ in the (temporal) rate of change.
The question of longer-term consequences upon short-term changes has been explored for attachment styles (Fraley et al., 2021; for life satisfaction see, e.g., Anusic et al., 2014; Fujita & Diener, 2005). Focusing on event-related change, this study found a mix of temporary and lasting change. While, on average, most people reverted to their pre-event levels (e.g., similar to Scenario D, quick and temporary change), for about a quarter of the events, the changes lasted longer (e.g., similar to Scenario B, rare transformative change). Likewise, studying event-related change in Big Five personality traits, Denissen et al. (2019) found that, on average, temporary and lasting post-event change in trait levels occurred only rarely, but people differed in their event-related trajectories (see also Reitz et al., 2022). While these results allow us to zoom in on the associations of life events and personality change patterns, the overall prevalence of year-to-year change in personality traits and associations with longer-term trajectories remain open questions.
The present study
In the current study, we explored the extent to which people changed on personality trait scores on a year-to-year basis and how those changes translated into longer-term patterns of change over a period of up to six years. We used longitudinal data from the GESIS panel (GESIS, 2021). The GESIS panel is based on a large probability sample representative of the German adult population and includes annual assessments of the Big Five (Bosnjak et al., 2018). We pursued two research goals.
First, we sought to provide a comprehensive and much-needed base rate for the prevalence of personality trait score change over relatively short periods of time (e.g., Hopwood et al., 2022). Because short-term change in personality traits remains largely unexplored, our primary objective was to describe year-to-year personality trait score changes as exhaustively and close to the data-generating process as possible. That is, in the first step, we did not distinguish between lasting change and systematic or unsystematic deviations but instead analyzed how individuals’ observed personality trait scores changed within one year. To further delve into factors contributing to this base rate, we subsequently scrutinized the impact of measurement error on the observed change scores and examined individual differences in the rates of year-to-year change.
Second, we aimed to investigate whether year-to-year change in personality trait scores is transient, dissipating within persons over time (e.g., as in Scenario D, temporary change); or instead is lasting, translating into longer-term patterns of change (e.g., Scenarios B and C with transformative changes). We pursued this aim by means of three complementary steps. In the first step, we generally tested the presence of reliable year-to-year changes that propagate to later points of individuals’ longitudinal trajectories. Subsequently, we zoomed in on different change patterns and examined whether year-to-year change must be of a specific magnitude or direction to bear consequences in the longer run. The second step involved testing whether year-to-year change patterns accounted for between-person differences in longer-term trajectories, and the third step investigated whether the different patterns resulted in lasting shifts in individuals’ personality trait levels.
Together, these steps comprehensively document the changes occurring in personality trait scores on a yearly basis and shed light on whether these changes reflect short-lived deviations or translate into lasting patterns of personality trait change.
Method
Design and participants
We used data from the GESIS panel (GESIS, 2021), a probability-based, large-scale panel that tracks a representative sample of the German adult population. Each wave of the panel is conducted in a mixed-mode design that allows participants to choose between an online or paper-based survey, reducing sample composition bias (Bosnjak et al., 2018). Upon the recruitment of the initial cohort of the GESIS panel in 2013, the sample has been refreshed in 2016 and 2018. Personality traits were assessed annually, in early autumn every year. For the current study, we used the waves with annual personality assessments released up until August 2022. We included a total of seven waves, completed between 2014 and 2020. We considered all participants who provided data on personality traits at least once (N = 7005; 52% female). Across the seven waves, participation ranged between n = 3606 (wave 2, in 2015) and n = 4862 (wave 6, in 2019). Table S1 breaks down the participation by wave and cohort. On average, participants completed 4.4 personality assessments (SD = 2.2). In the year of the first wave, in 2014, participants were M = 47.55 (SD = 15.02) years old (range = 15–80).
Measures
Personality traits were assessed with a short version of the Big Five Inventory, the BFI-10 (Rammstedt & John, 2007). The BFI-10 is widely used in large-scale studies with time and space constraints. It measures each domain by two items, a positively and negatively coded one, allowing to control for acquiescence at the scale score level. Items are answered on a 5-point rating scale ranging from 1 (strongly disagree) to 5 (strongly agree). The two items per domain were selected to represent bandwidth rather than homogeneity. Accordingly, internal consistency is not an appropriate estimate for the scale scores’ reliability. One-year test–retest reliability estimates ranged between .68 and .73 for extraversion, .53 and .60 for agreeableness, .62 and .67 for conscientiousness, .60 and .66 for neuroticism, and .65 and .71 for openness. Means, standard deviations, reliability estimates, and correlations for the Big Five scale scores are shown in Table S2.
Data-analytical approach
Overview of the research questions, analytic approaches, and consideration of measurement error.
aPatterned indicates that year-to-year changes were separately examined for different magnitudes and directions of change.
Base rate of year-to-year change
For the base rate of year-to-year change in personality trait scores, we strove to document change as close to the data-generating process as possible. Therefore, in Step 1.1, rather than modeling (restrictive and possibly unwarranted) assumptions about whether the year-to-year change reflects enduring trait change, systematic fluctuation, or unsystematic noise (e.g., Steyer et al., 2015), we described the year-to-year change as observed in the raw data. To this end, we computed manifest change scores between sequential years. We computed the prevalence of change of varying magnitudes in the five trait domains, providing a detailed base rate of year-to-year change in personality trait scores.
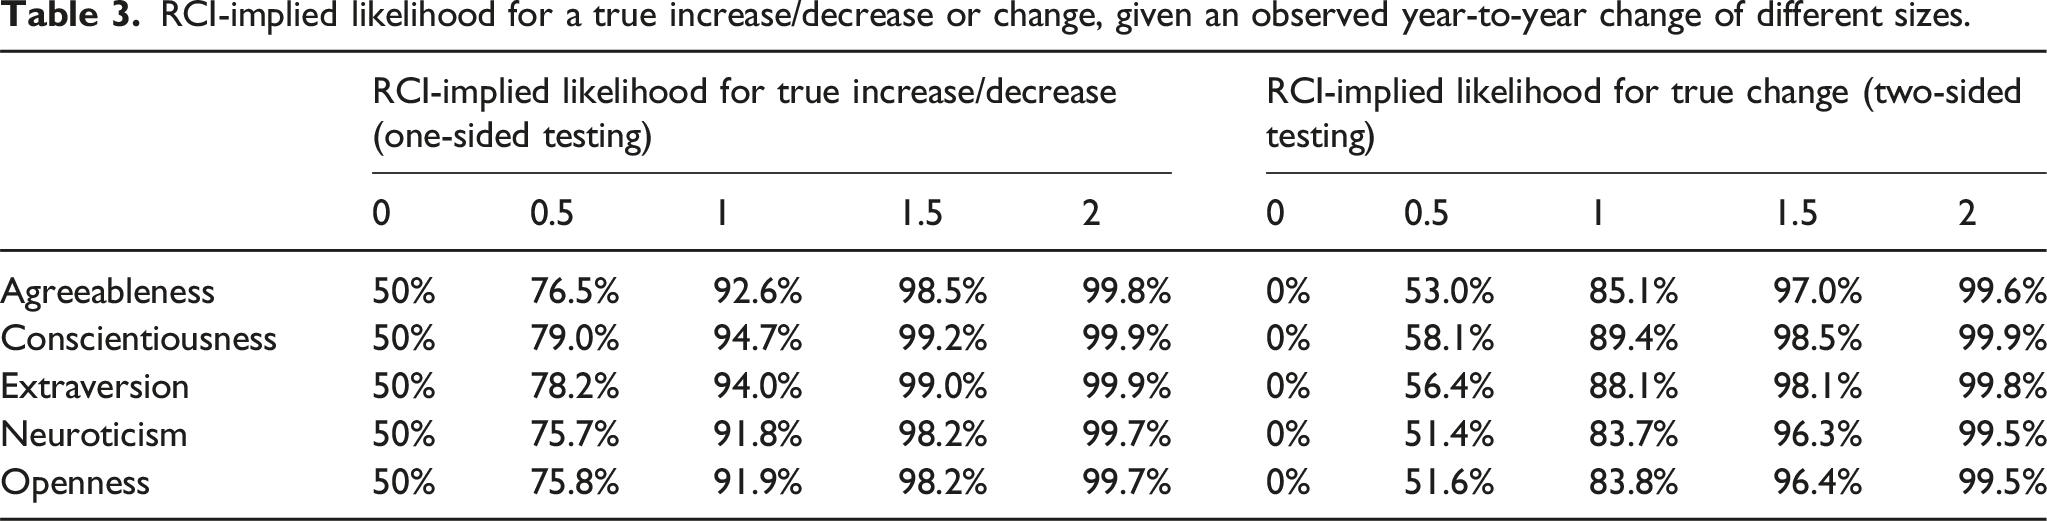
In Step 1.2, we sought to validate this base rate further. To gauge how much of the observed change reflected reliable change, we used the logic of the Reliable Change Index (RCI; e.g., Jacobson & Truax, 1991). The RCI determines if an observed change exceeds the largest plausible error in a difference score (McAleavey, 2021), typically identifying changes exceeding two standard errors as “reliable.” The RCI fails to control for Type-II error and has been criticized for underestimating true change (Ferrer & Pardo, 2019). Therefore, we also report the RCI-implied likelihood that, given an observed change score, true growth (or decline) has happened (i.e., one-sided testing), or that any true change has occurred (i.e., two-sided testing; see McAleavey, 2021). 2 These indices serve as proxies for the extent to which fluctuations of an imprecise measure have influenced our year-to-year change base rate. In addition, to further characterize our base rate, we examined individual differences in the rate of change and the role of the time lag (Fraley & Roberts, 2005).
Longer-term relevance
To assess the longer-term relevance of year-to-year changes, we conducted three complementary analysis steps. In Step 2.1, we asked whether there are in general—across participants and magnitudes of year-to-year change—any reliable year-to-year shifts with longer-term relevance. We addressed this question with stochastic latent change score models (LCSMs; Ji & Chow, 2018). These models tested for (a) reliable, time-specific (i.e., year-to-year) variance that (b) is not captured by individuals’ longer-term trajectories and yet (c) propagates to later points of their longitudinal process. Referring to Figure 1, Step 2.1 differentiates Scenario A without consequential sudden changes from Scenarios B and C (as well as D) with sudden changes that, at least to a certain extent, affect later segments of individuals’ trajectories.
In the next two steps (2.2–2.3), we explored the longer-term relations separately for different directions and magnitudes of year-to-year change. For these “patterned” analyses, we focused on pronounced changes—unlikely to reflect chance fluctuations—and examined whether a specific direction or magnitude of year-to-year change is required to bear longer-term consequences. These patterned analyses inform not only whether there are transformative changes (Scenarios B and C) versus not (Scenarios A and D) but also whether transformative changes went in the same (B) versus different (C) directions. Toward this aim, we constructed year-to-year change indicators in the form of dummy-coded variables, capturing whether a participant showed a certain size of year-to-year change (e.g., a decrease of at least 1.5 scale points) at least once in a given trait domain.
In Step 2.2, we examined whether the occurrence of these different patterns of (pronounced) year-to-year changes explained between-person variance in the longer-term trajectories: If a given year-to-year change is more than a temporary deviation or noise, it should systematically relate to the longer-term trajectories. We tested this possibility by modeling interactions between the year-to-year change indicators and individuals’ estimated longer-term linear trajectories.
Finally, in Step 2.3, we tested how much of the year-to-year change stuck or whether individuals’ trait levels reverted to a pre-change baseline. Separately for the different patterns of (pronounced) year-to-year change, we examined the difference between individuals’ trait levels before versus after the focal change using partially overlapping t-tests (Derrick et al., 2017). Along with differentiating the scenarios in Figure 1, this step quantifies the difference that remains upon year-to-year changes over the course of (up to) six years.
Note that analyses in Steps 2.2 and 2.3 condition on the direction of change. Thereby, these “patterned” analyses for the longer-term relevance introduce an inherent statistical confound. This is because if there are random fluctuations, individuals with a true longer-term trajectory in a specific direction are also more likely to show a pronounced year-to-year change in that very same direction. For example, even in a scenario where individuals’ longer-term trajectories are purely incremental and linear but affected by measurement error (i.e., similar to Scenario A), a relation between a sudden increase and longer-term increase (or decrease, respectively) would result; but this relation would primarily be driven by random fluctuations around the linear trajectory (Thomas & Persons, 2013). To address this statistical confound, we compared our effect sizes to a benchmark generated from simulating such a latter scenario. In the simulation, we assumed a data-generating process with individuals’ longer-term trajectories being purely linear but affected by measurement error. To ensure alignment with the actual data, we used sample-based estimates for linear trajectories and error for the data generation. Details on the simulation are provided in Supplement B. We used the simulated data to analyze the same patterned models described in Steps 2.2 and 2.3. From the distribution of simulated results, we determined the quantile at which our empirical results fell. Hence, these comparisons test our results against a scenario that defines any (pronounced) year-to-year changes as random fluctuations, thereby addressing the statistical confounding of the analyses in Steps 2.2 and 2.3. Since this provides a conservative test, we sought to accommodate Type-II error and interpreted results at the 90% quantile as reflecting substantial evidence.
We analyzed the data with R 4.2.1 (R Core Team, 2023), mainly using the tidyverse packages (Wickham et al., 2019), lme4 (Bates et al., 2015), and lavaan (Rosseel, 2012). To address multiple testing in the examination of change patterns per trait domain, we interpreted Bonferroni–Holm-corrected p-values (Holm, 1979).
Results
Base rate of year-to-year change
Step 1.1: Year-to-year changes in personality trait scores
Percentage of year-to-year patterns with different minimum sizes of absolute change.
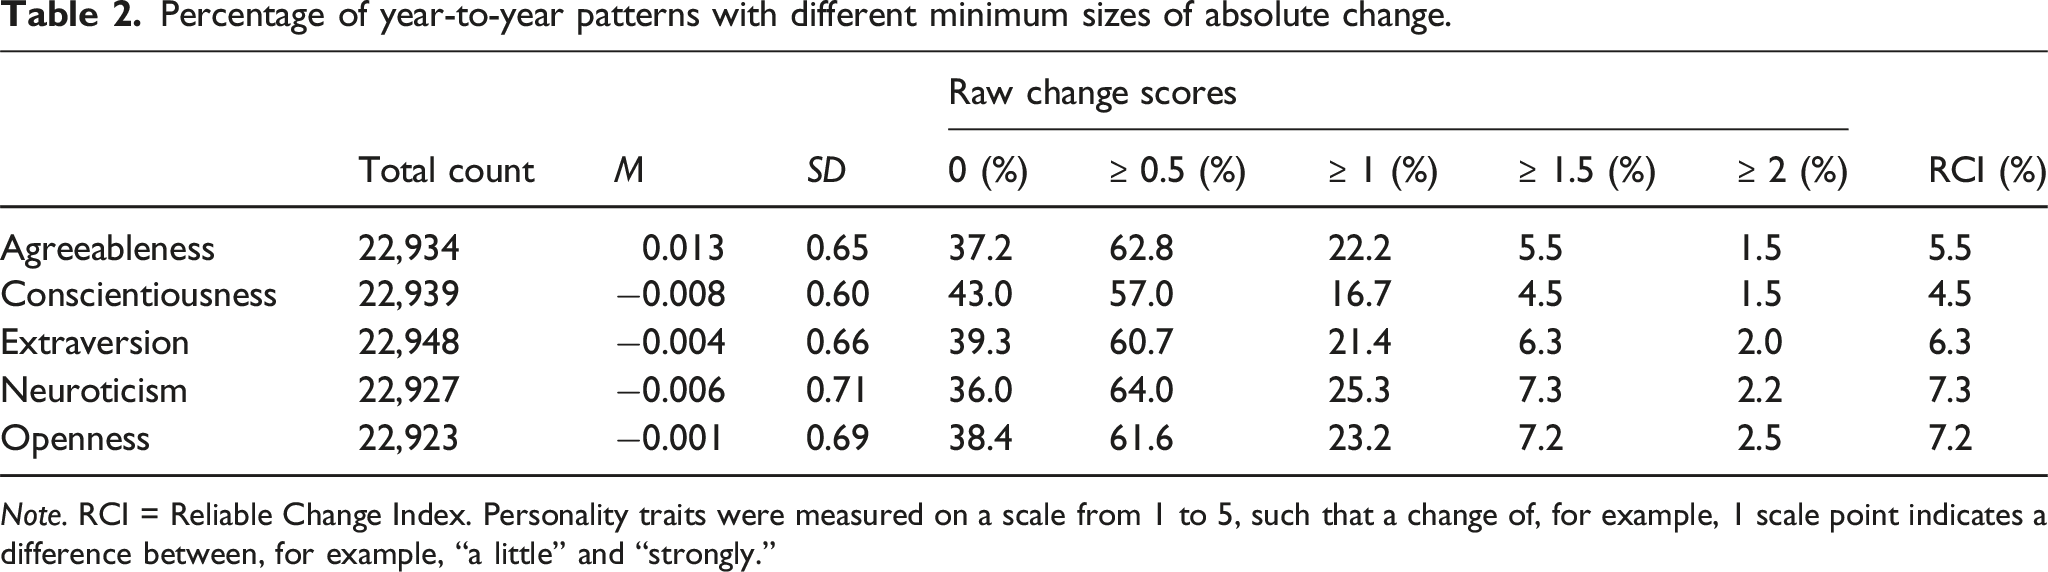
Note. RCI = Reliable Change Index. Personality traits were measured on a scale from 1 to 5, such that a change of, for example, 1 scale point indicates a difference between, for example, “a little” and “strongly.”
Across the five domains, the rates of year-to-year change slightly differed. For example, neuroticism showed the most year-to-year change (e.g., 25% change of ≥ 1 scale point), and conscientiousness showed the least change (43% change scores of zero). These differences between the five domains were statistically significant, as indicated by pairwise Kolmogorov–Smirnov tests; Bonferroni–Holm (k = 10) adjusted p ≤ .025; 0.01 ≤ D ≤ 0.04. Only extraversion and openness had equivalent distributions of change scores, D = 0.01, Bonferroni–Holm adjusted p = .30. 4
In all domains, mean change scores were close to 0, suggesting that across participants, year-to-year increases and decreases canceled out. Indeed, as shown in Figure 2, the changes in all trait domains were symmetrically distributed, with similar amounts of year-to-year increases and decreases. Distribution of year-to-year change scores. A: Agreeableness; C: Conscientiousness; E: Extraversion; N: Neuroticism; O: Openness.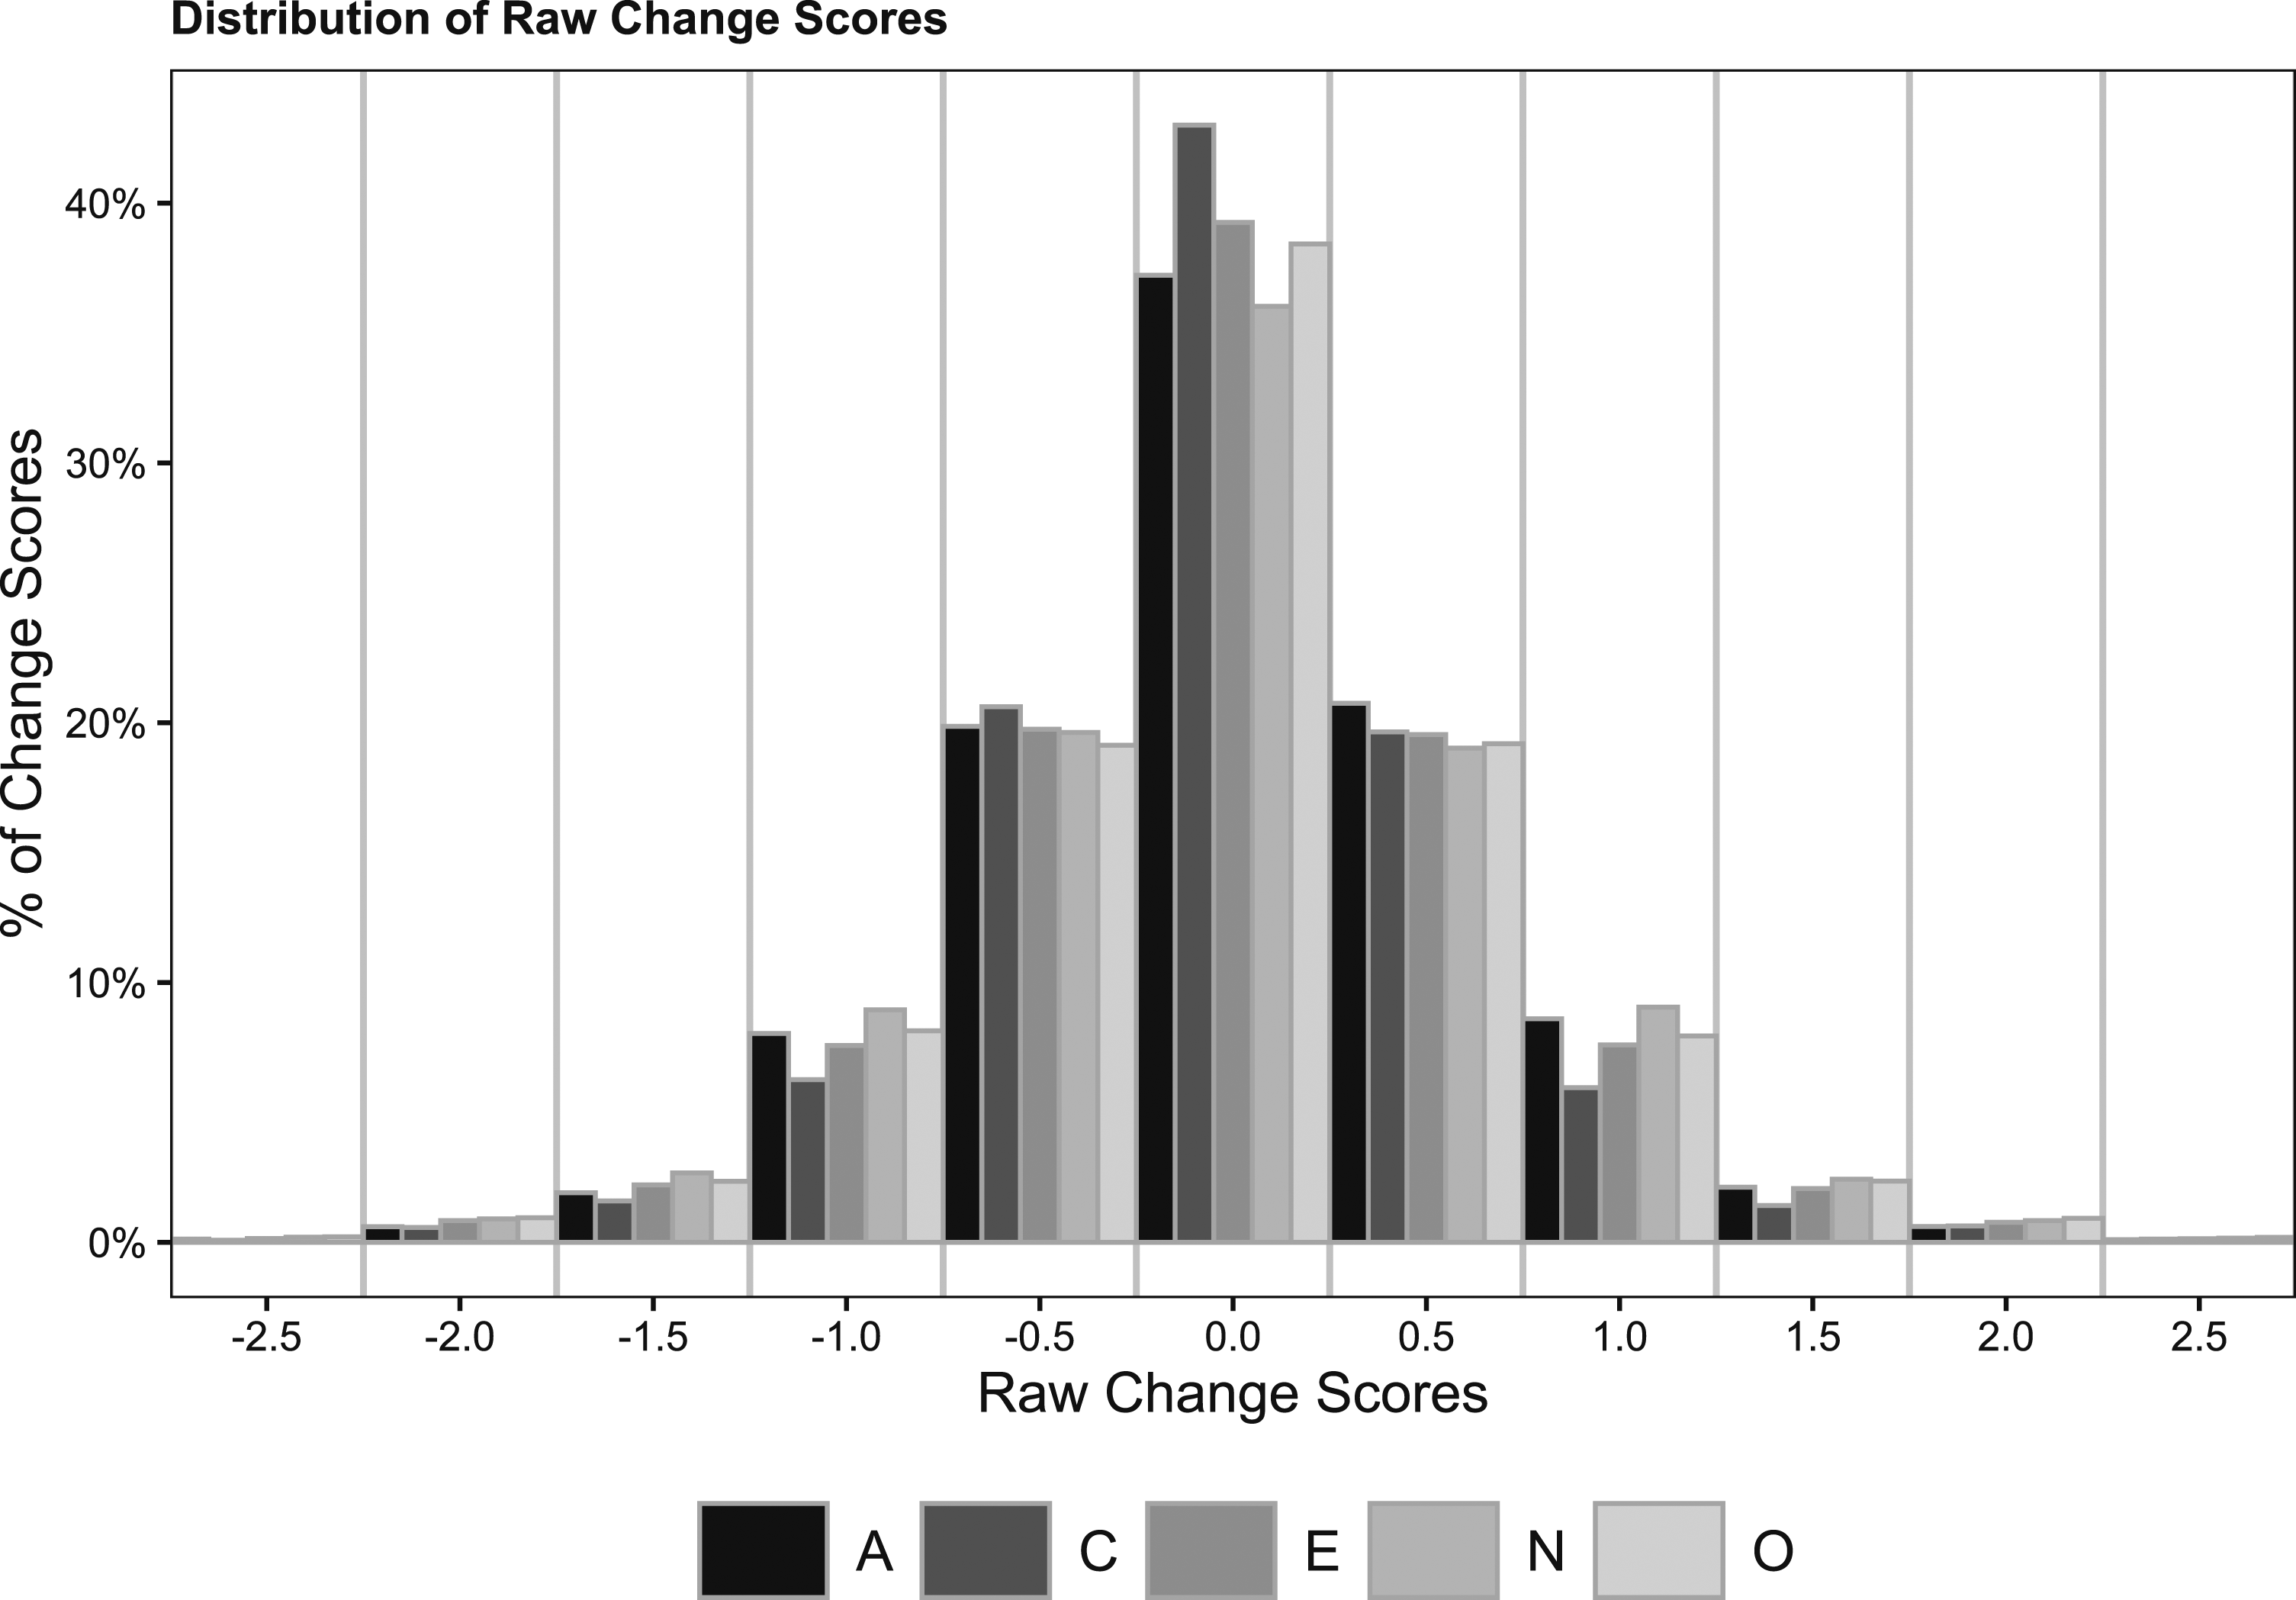
Step 1.2: Further validation of the year-to-year change base rate
RCI-implied likelihood for a true increase/decrease or change, given an observed year-to-year change of different sizes.
Individual differences in year-to-year changes
To further specify our base rate, we explored how year-to-year changes were distributed across individuals. The left of Figure 3 shows the proportion of participants with at least one year-to-year change of different magnitudes (see also Table S5). For example, in agreeableness, 50% of participants showed at least one year-to-year change of ≥ 1 scale point, and 16% showed at least one change of ≥ 1.5 points. Generally, in any trait, about half of the participants showed at least one year-to-year change of ≥ 1 scale point. On the right of Figure 3, we conditioned on showing a year-to-year change of the focal size and analyzed whether individuals changed multiple times. The figure shows that changes were not evenly distributed across participants. For instance, for agreeableness, 46% of people with a year-to-year change of ≥ 1 scale point showed this change at least twice. That is, while about half of the participants never changed by ≥ 1 scale point in agreeableness, half of those who did, changed even multiple times. A similar pattern of individual differences in year-to-year change emerged in the other four domains.
As an indicator of how year-to-year changes were distributed across participants, we computed intraclass correlations (ICCs) for absolute year-to-year change scores. These values ranged between .16 (Neuroticism) to .20 (Openness), suggesting that up to 20% of the variance in year-to-year changes was due to between-person differences. Hence, there were indeed participants that showed generally higher rates of change. Individual differences in year-to-year change. A = Agreeableness; C = Conscientiousness; E = Extraversion; N = Neuroticism; O = Openness. Personality traits were measured on a scale from 1 to 5. A change of 1 scale point indicates the difference that could go from, for example, “a little” to “strongly.”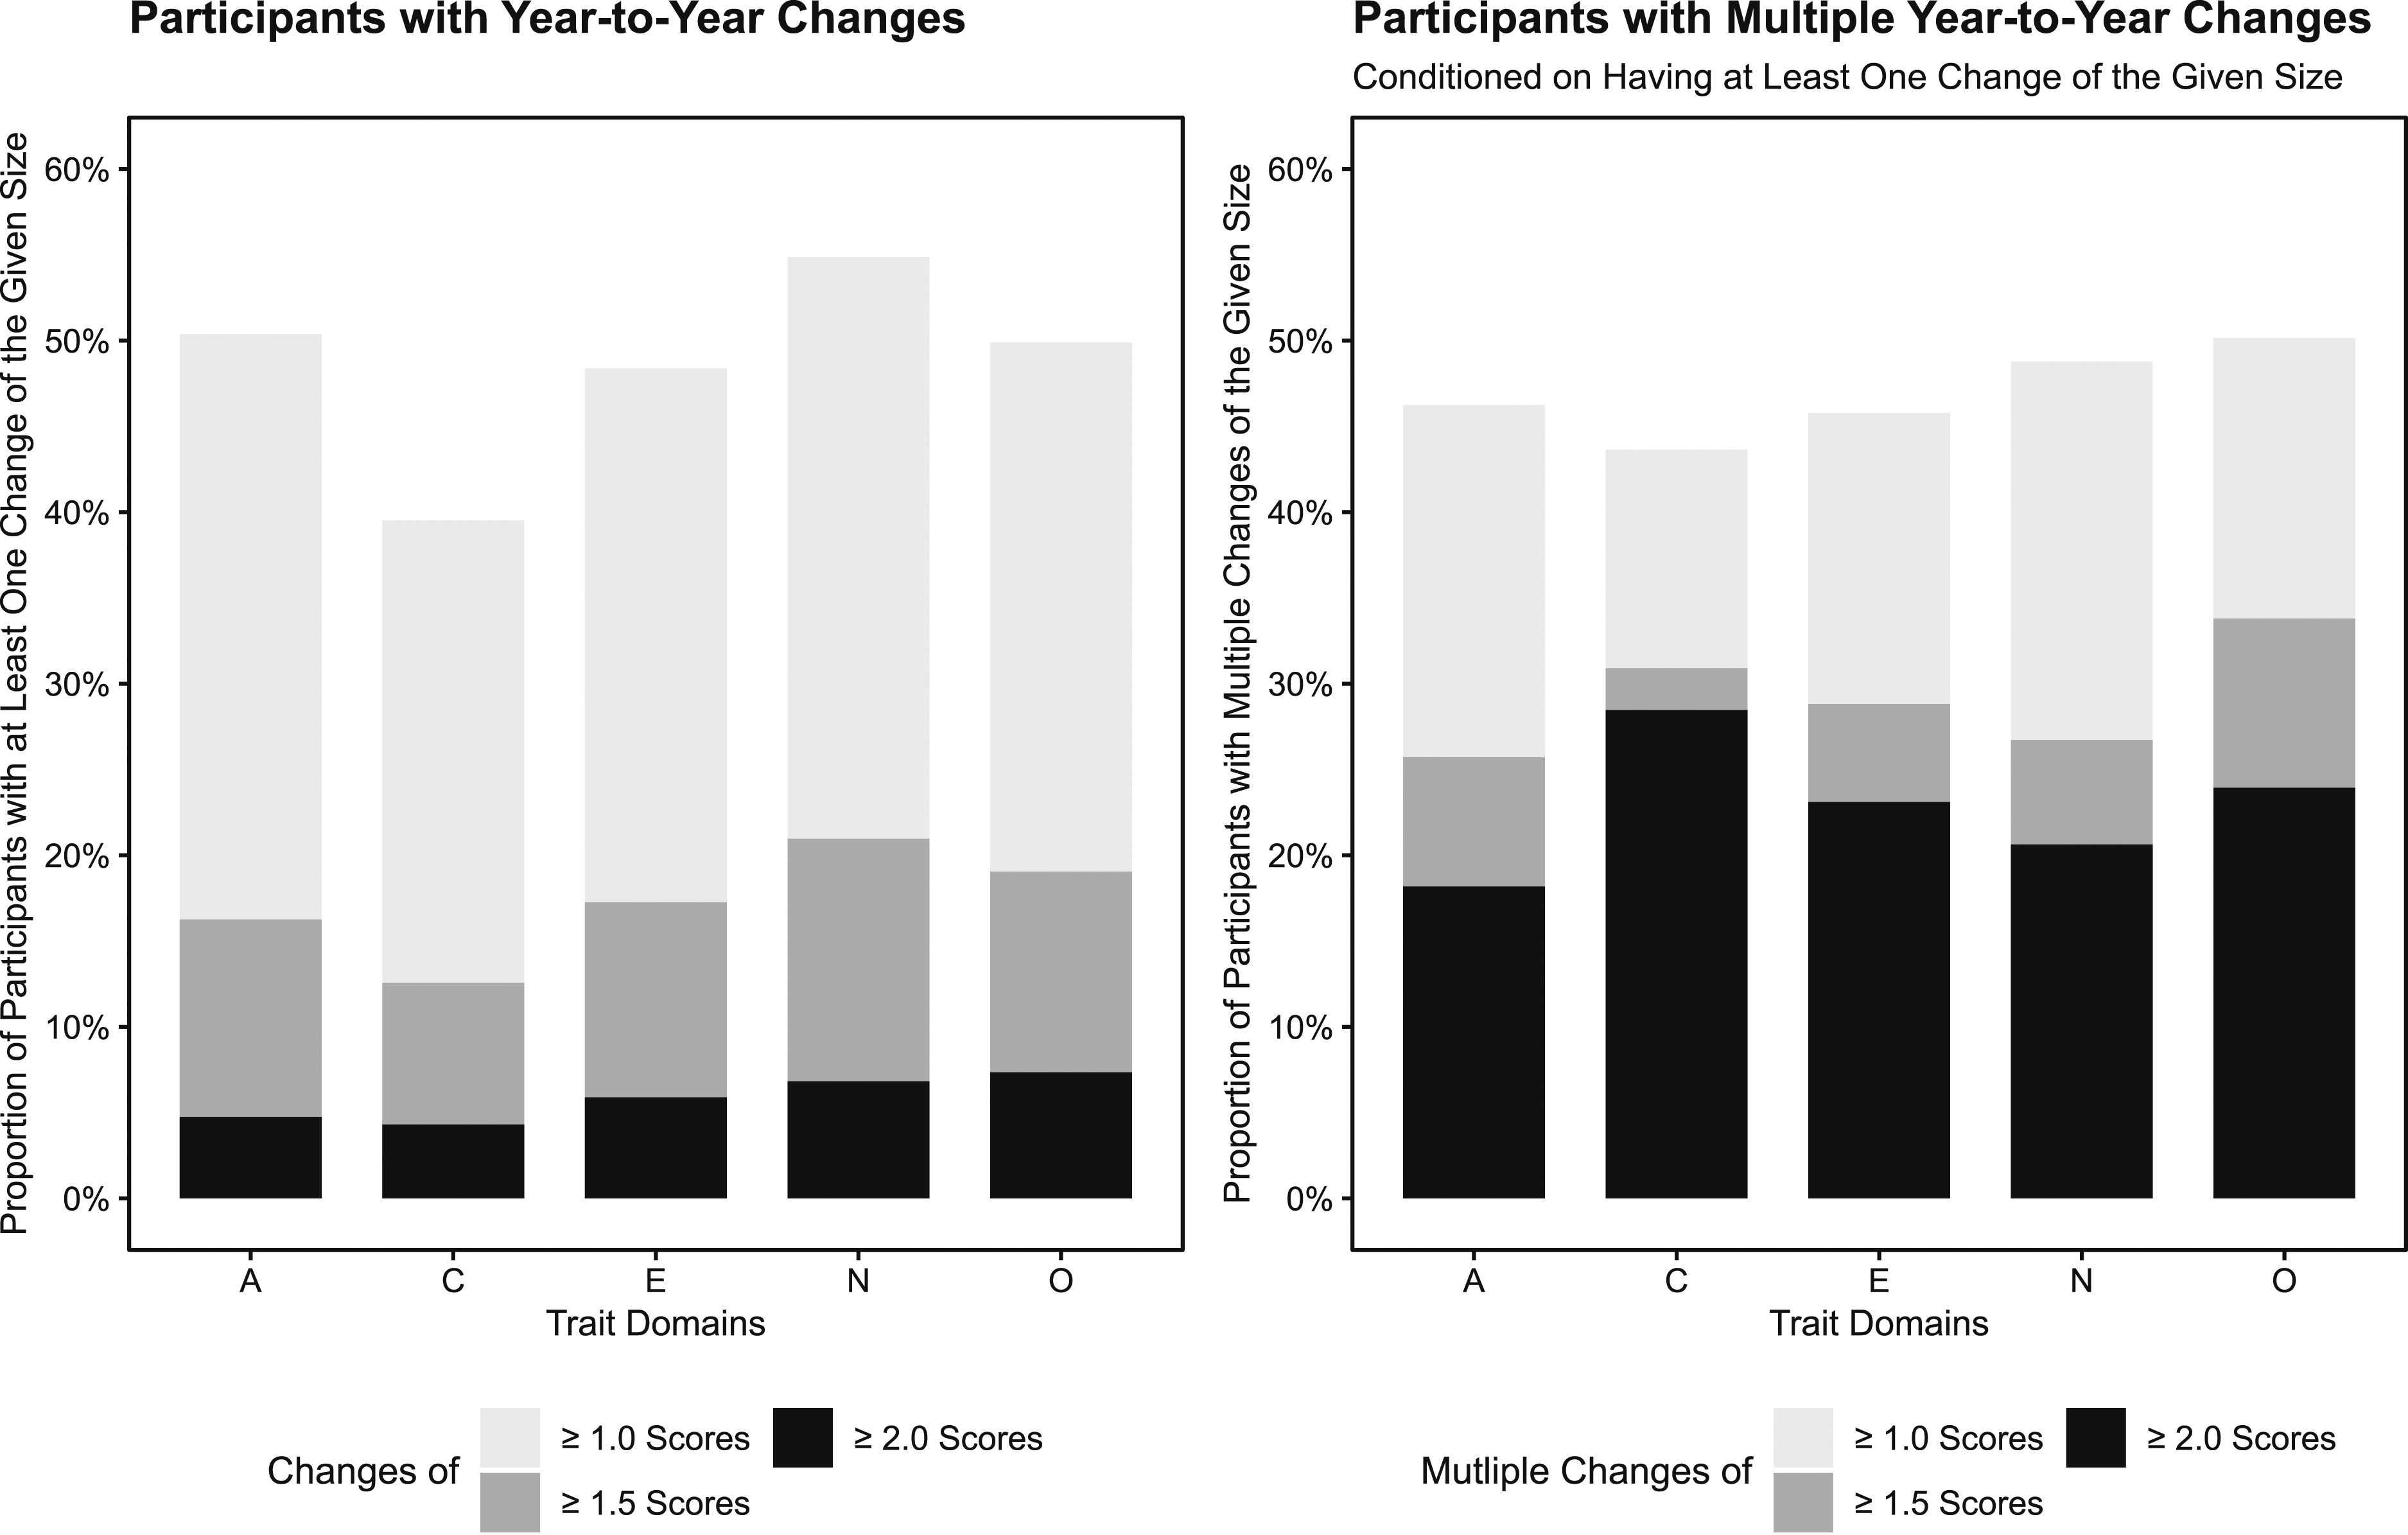
Comparing year-to-year and six-year time lags
Proportion of people with different sizes of year-to-year and six-year changes.
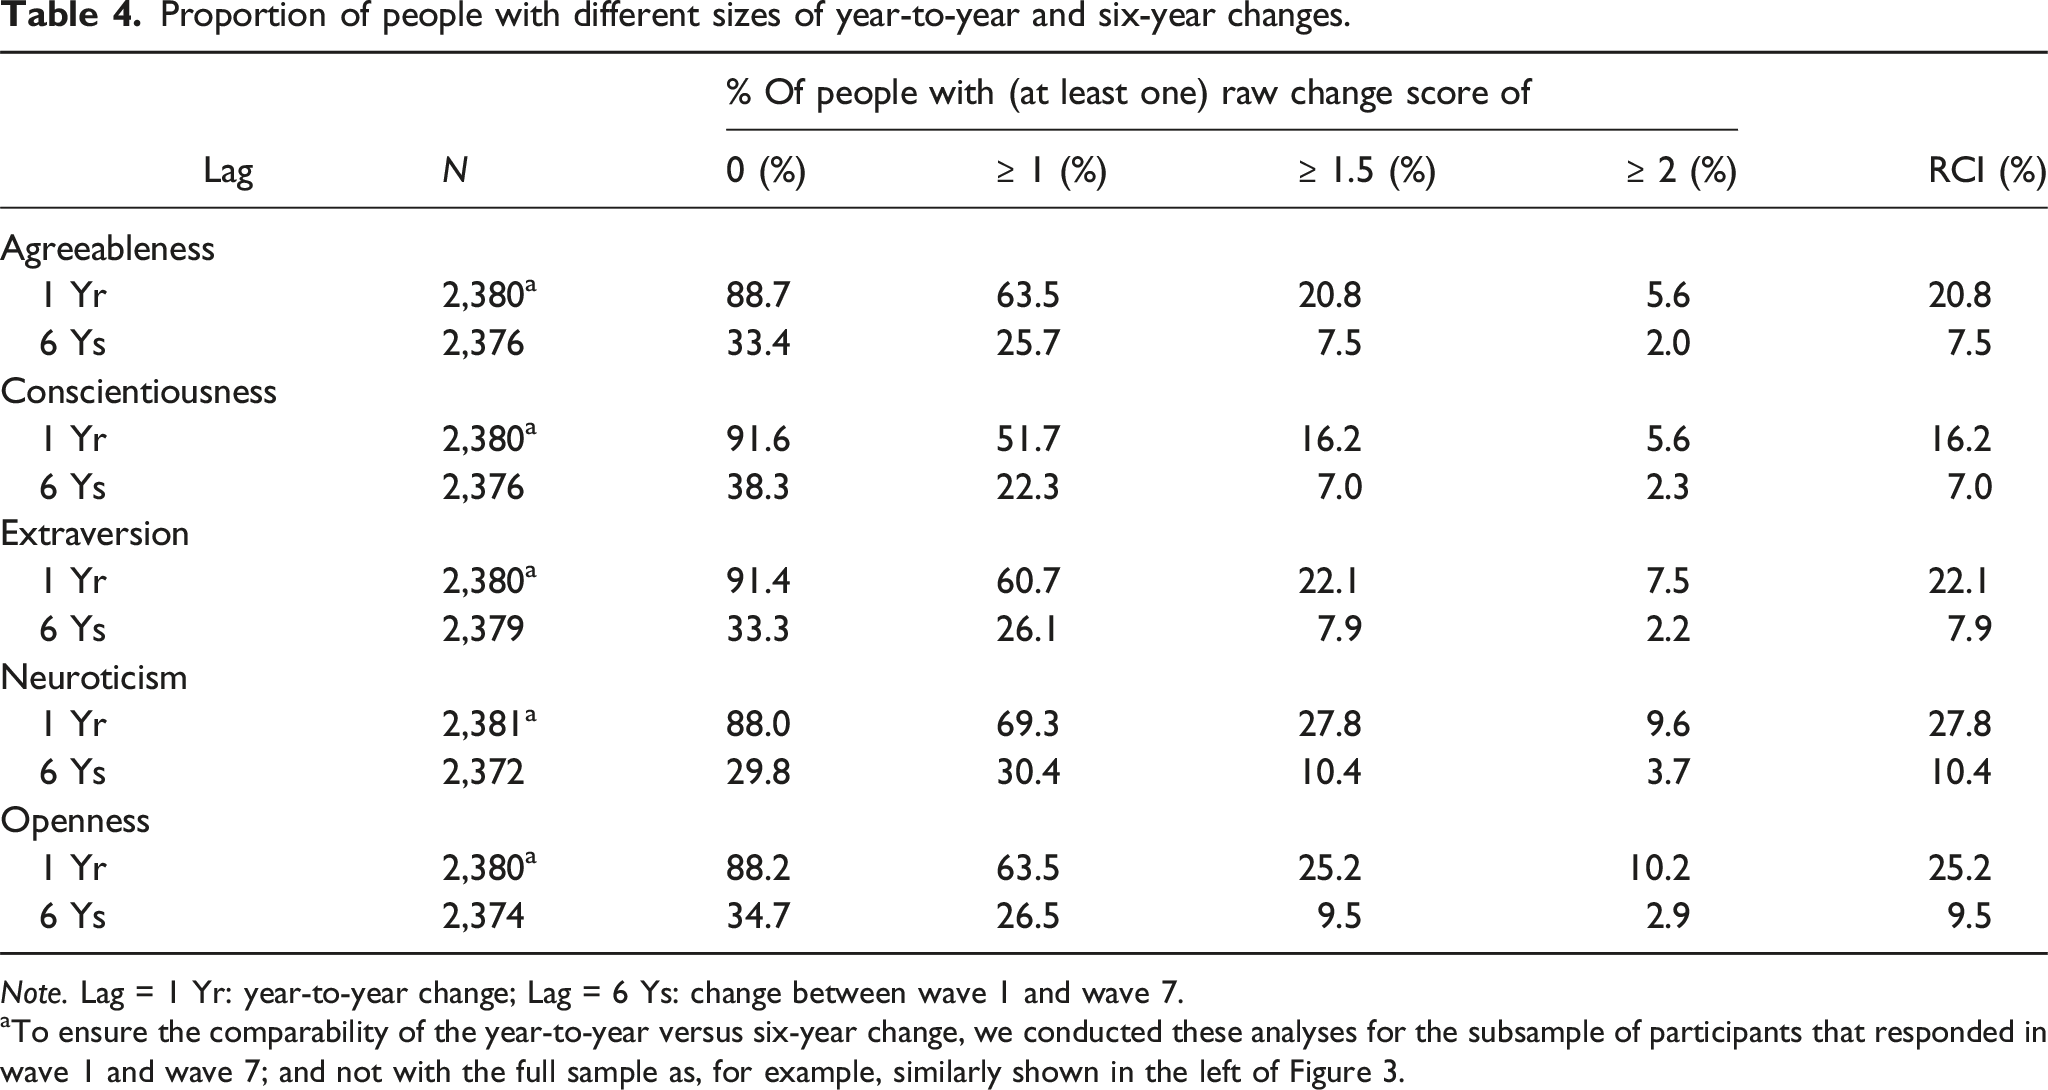
Note. Lag = 1 Yr: year-to-year change; Lag = 6 Ys: change between wave 1 and wave 7.
aTo ensure the comparability of the year-to-year versus six-year change, we conducted these analyses for the subsample of participants that responded in wave 1 and wave 7; and not with the full sample as, for example, similarly shown in the left of Figure 3.
Longer-term relevance of year-to-year change
Step 2.1: Reliable year-to-year shifts with longer-term relevance
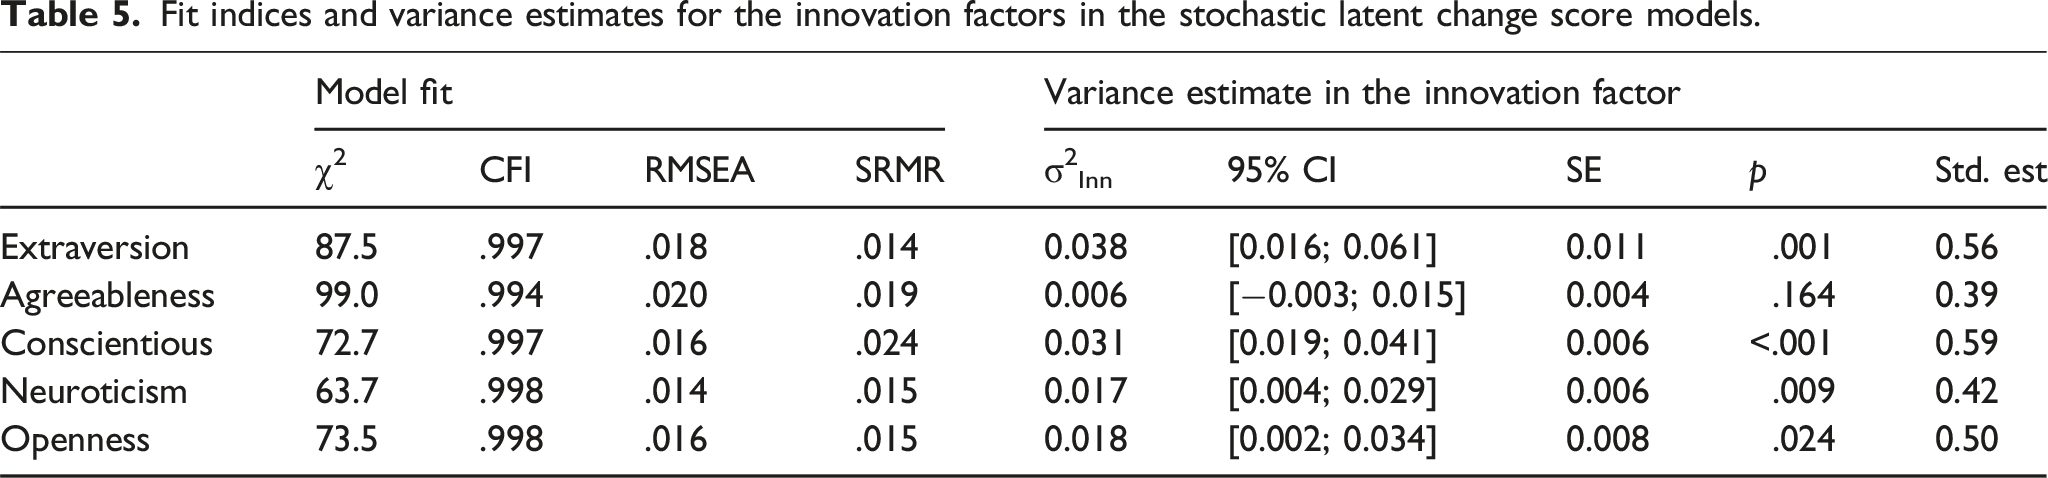
To test whether reliable year-to-year trait changes can generally propagate to later segments of individuals’ trajectories, we analyzed stochastic latent change score models (LCSMs; Ji & Chow, 2018). In these models, within-person changes between t and t–1 are the focus and are modeled as latent, error-free variables. LCSMs include two dynamic processes, such that changes over time are characterized by a constant amount of linear change and a dependency on previous time points through autocorrelations (McArdle, 2009). In the stochastic LCSM, the so-called innovations are added as time-specific residuals to the latent change score variables. These innovations differ from measurement error in that they are carried over to subsequent time points via autocorrelations, impacting the latent process also later (Cáncer & Estrada, 2023). Hence, the innovation factors reflect (a) reliable, time-specific (i.e., year-to-year) effects that (b) are not captured by the estimated longer-term trajectories including linear and lagged effects, and yet (c) propagate to later instances in the latent process via autocorrelation. A generic version of the stochastic LCSM is shown in Figure S1. We estimated a stochastic LCSM per trait domain and examined the variance in the innovation factor. Because participants differed in the timing of study onset, time (i.e., wave) was centered at individuals’ midpoint of the study period. We accounted for missing data with full-information maximum likelihood estimation.
Fit indices and variance estimates for the innovation factors in the stochastic latent change score models.
Patterned examination for different magnitudes and direction of year-to-year change
In the following steps, we concentrated on the four domains in which reliable short-term changes propagated to later segments of the longer-term trajectories 6 and examined the associations between year-to-year changes and longer-term trajectories in a patterned way, separately for year-to-year change of varying magnitudes and directions. We therefore constructed year-to-year change indicators. These indicators were dummy-coded variables at the person level, capturing whether a participant showed a certain size of year-to-year change at least once. For each domain, we constructed six year-to-year change indicators: for increases of at least 1.0, 1.5, and 2.0 scale points and decreases of at least −1.0, −1.5, and −2.0 scale points. For example, a participant with one (or more) year-to-year decrease of at least 1.5 scale points in extraversion received a 1 on the indicator “min. 1.5 decrease in extraversion,” and somebody with no decrease of 1.5 scale points received a 0. Note that these indicators captured patterns of pronounced changes, unlikely to have occurred by error alone (see Table 3). Table S7 gives an overview of the frequency of persons with pronounced changes as denoted by these indicators.
Step 2.2: Explaining variance in longer-term trajectories
In Step 2.2, we explored whether the different year-to-year change patterns explained individual differences in longer-term trajectories. As a baseline model for the longer-term trajectories, we estimated linear growth curve models (Raudenbush & Bryk, 2002) over the six-year study period. We regressed personality scores on a linear time variable and allowed individuals to vary in their level (random intercepts) and change rate (random slopes). Time was represented by study waves, centered at individuals’ midpoint of the study period. The estimated slopes were used as estimates for individuals’ longer-term personality trajectories.
As reported in Table S8, average longer-term changes in personality scores (fixed effects) were generally small and only differed significantly from zero for neuroticism and conscientiousness (and agreeableness). Hence, on average, there was little linear longer-term change. However, χ2 tests indicated that in all trait domains, individuals differed substantially in the size and direction of estimated longer-term trajectories (random effects; see Table S9).
Hereafter, we tested how much of this between-person variability in longer-term trajectories could be explained by the year-to-year change indicators—that is, by whether or not a person exhibited a certain change pattern (e.g., a decrease of at least 1.5 scale points) at least once. In separate models, we extended the baseline models with interactions between the year-to-year change indicators and the linear slopes. These interactions indicate whether individuals who experienced the focal year-to-year change differed in their longer-term trajectories from those who did not. Results are shown in Tables S8–S9. Considered on their own, these interaction effects are not very informative, as similar effects can arise in a scenario where all pronounced year-to-year changes are attributable to random error (Thomas & Persons, 2013). Therefore, we analyzed how much random slope variance from the baseline models was reduced upon including the interaction (Hox et al., 2018; Raudenbush & Bryk, 2002) and judged this explained variance against the simulation-generated benchmark, where we assumed a scenario of gradual change combined with error (see also Supplement B).
Variance in random slopes explained by the interaction with short-term change indicators; along with the quantiles from the simulation-generated benchmark.
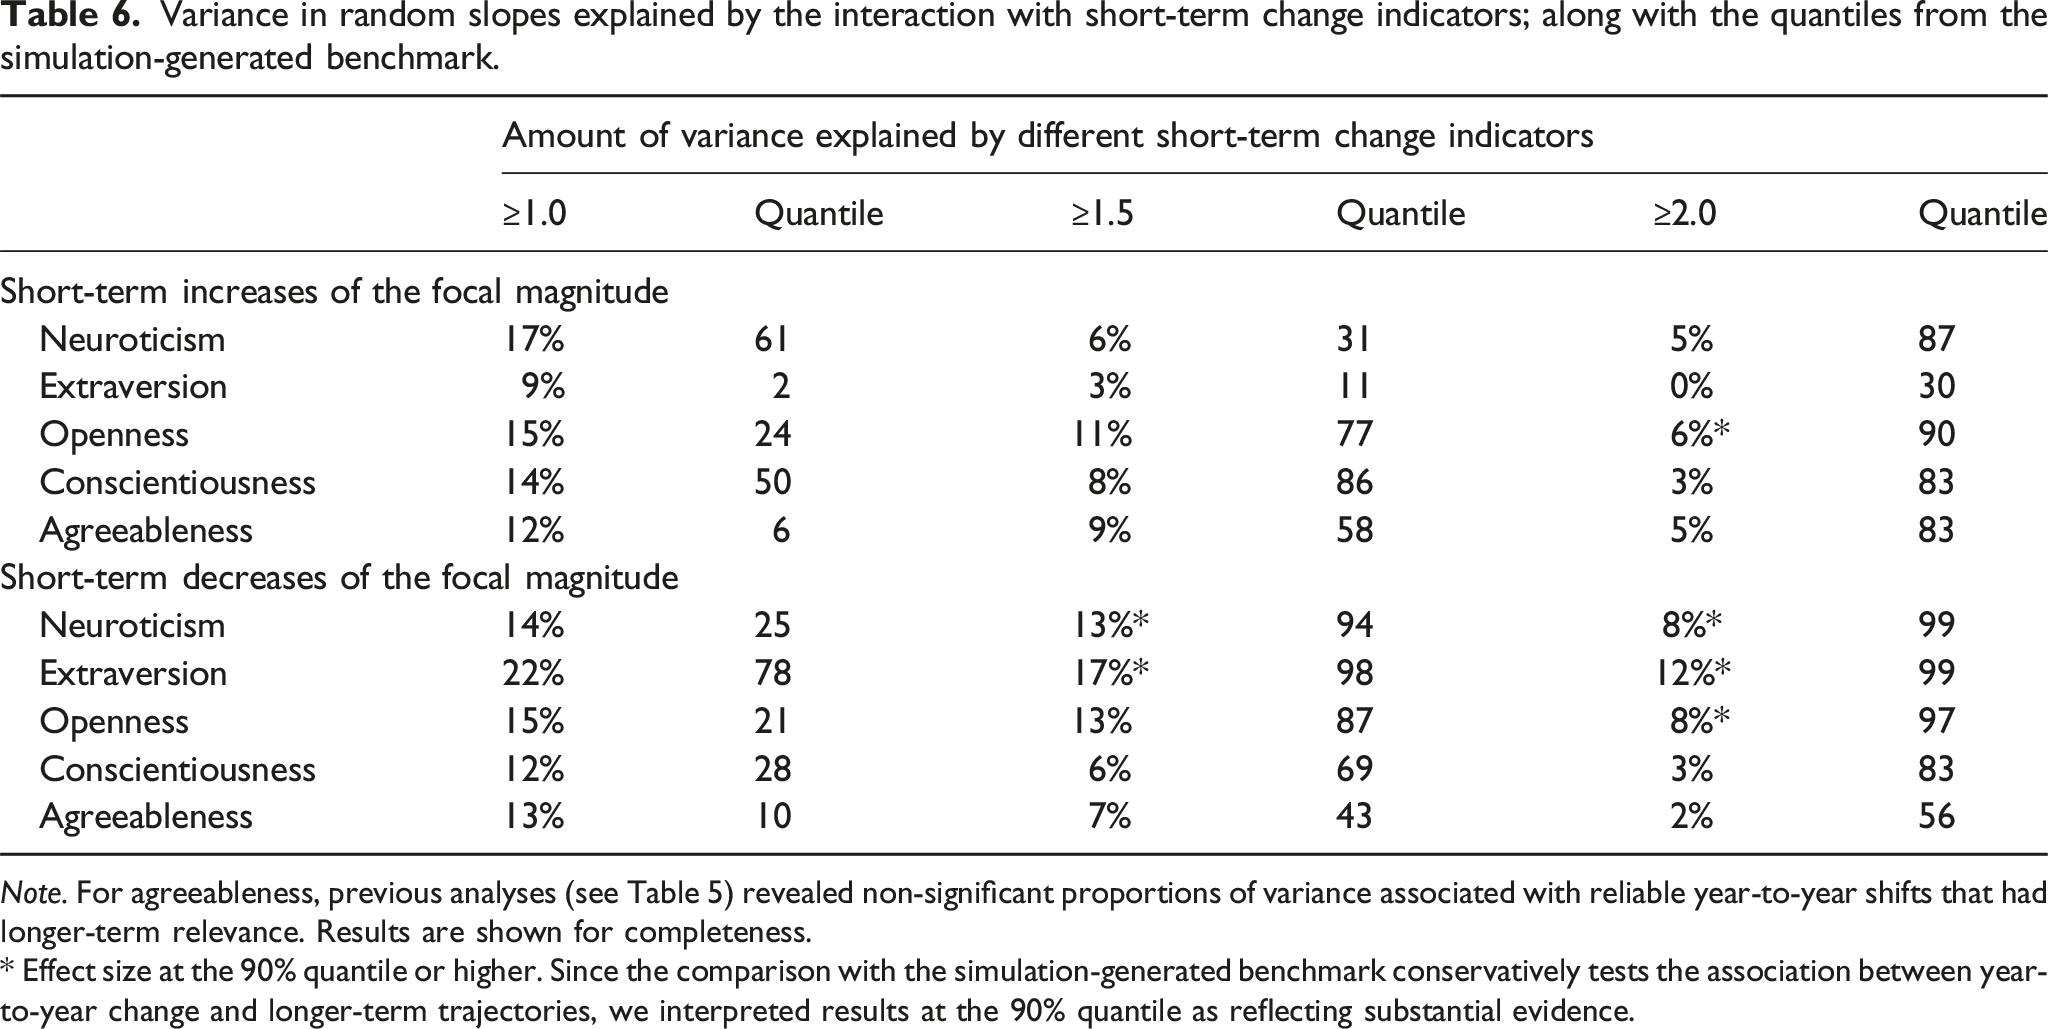
Note. For agreeableness, previous analyses (see Table 5) revealed non-significant proportions of variance associated with reliable year-to-year shifts that had longer-term relevance. Results are shown for completeness.
* Effect size at the 90% quantile or higher. Since the comparison with the simulation-generated benchmark conservatively tests the association between year-to-year change and longer-term trajectories, we interpreted results at the 90% quantile as reflecting substantial evidence.
Step 2.3: Lasting effects on personality levels
Pre- and post-change mean-level differences in within-person centered personality scores.
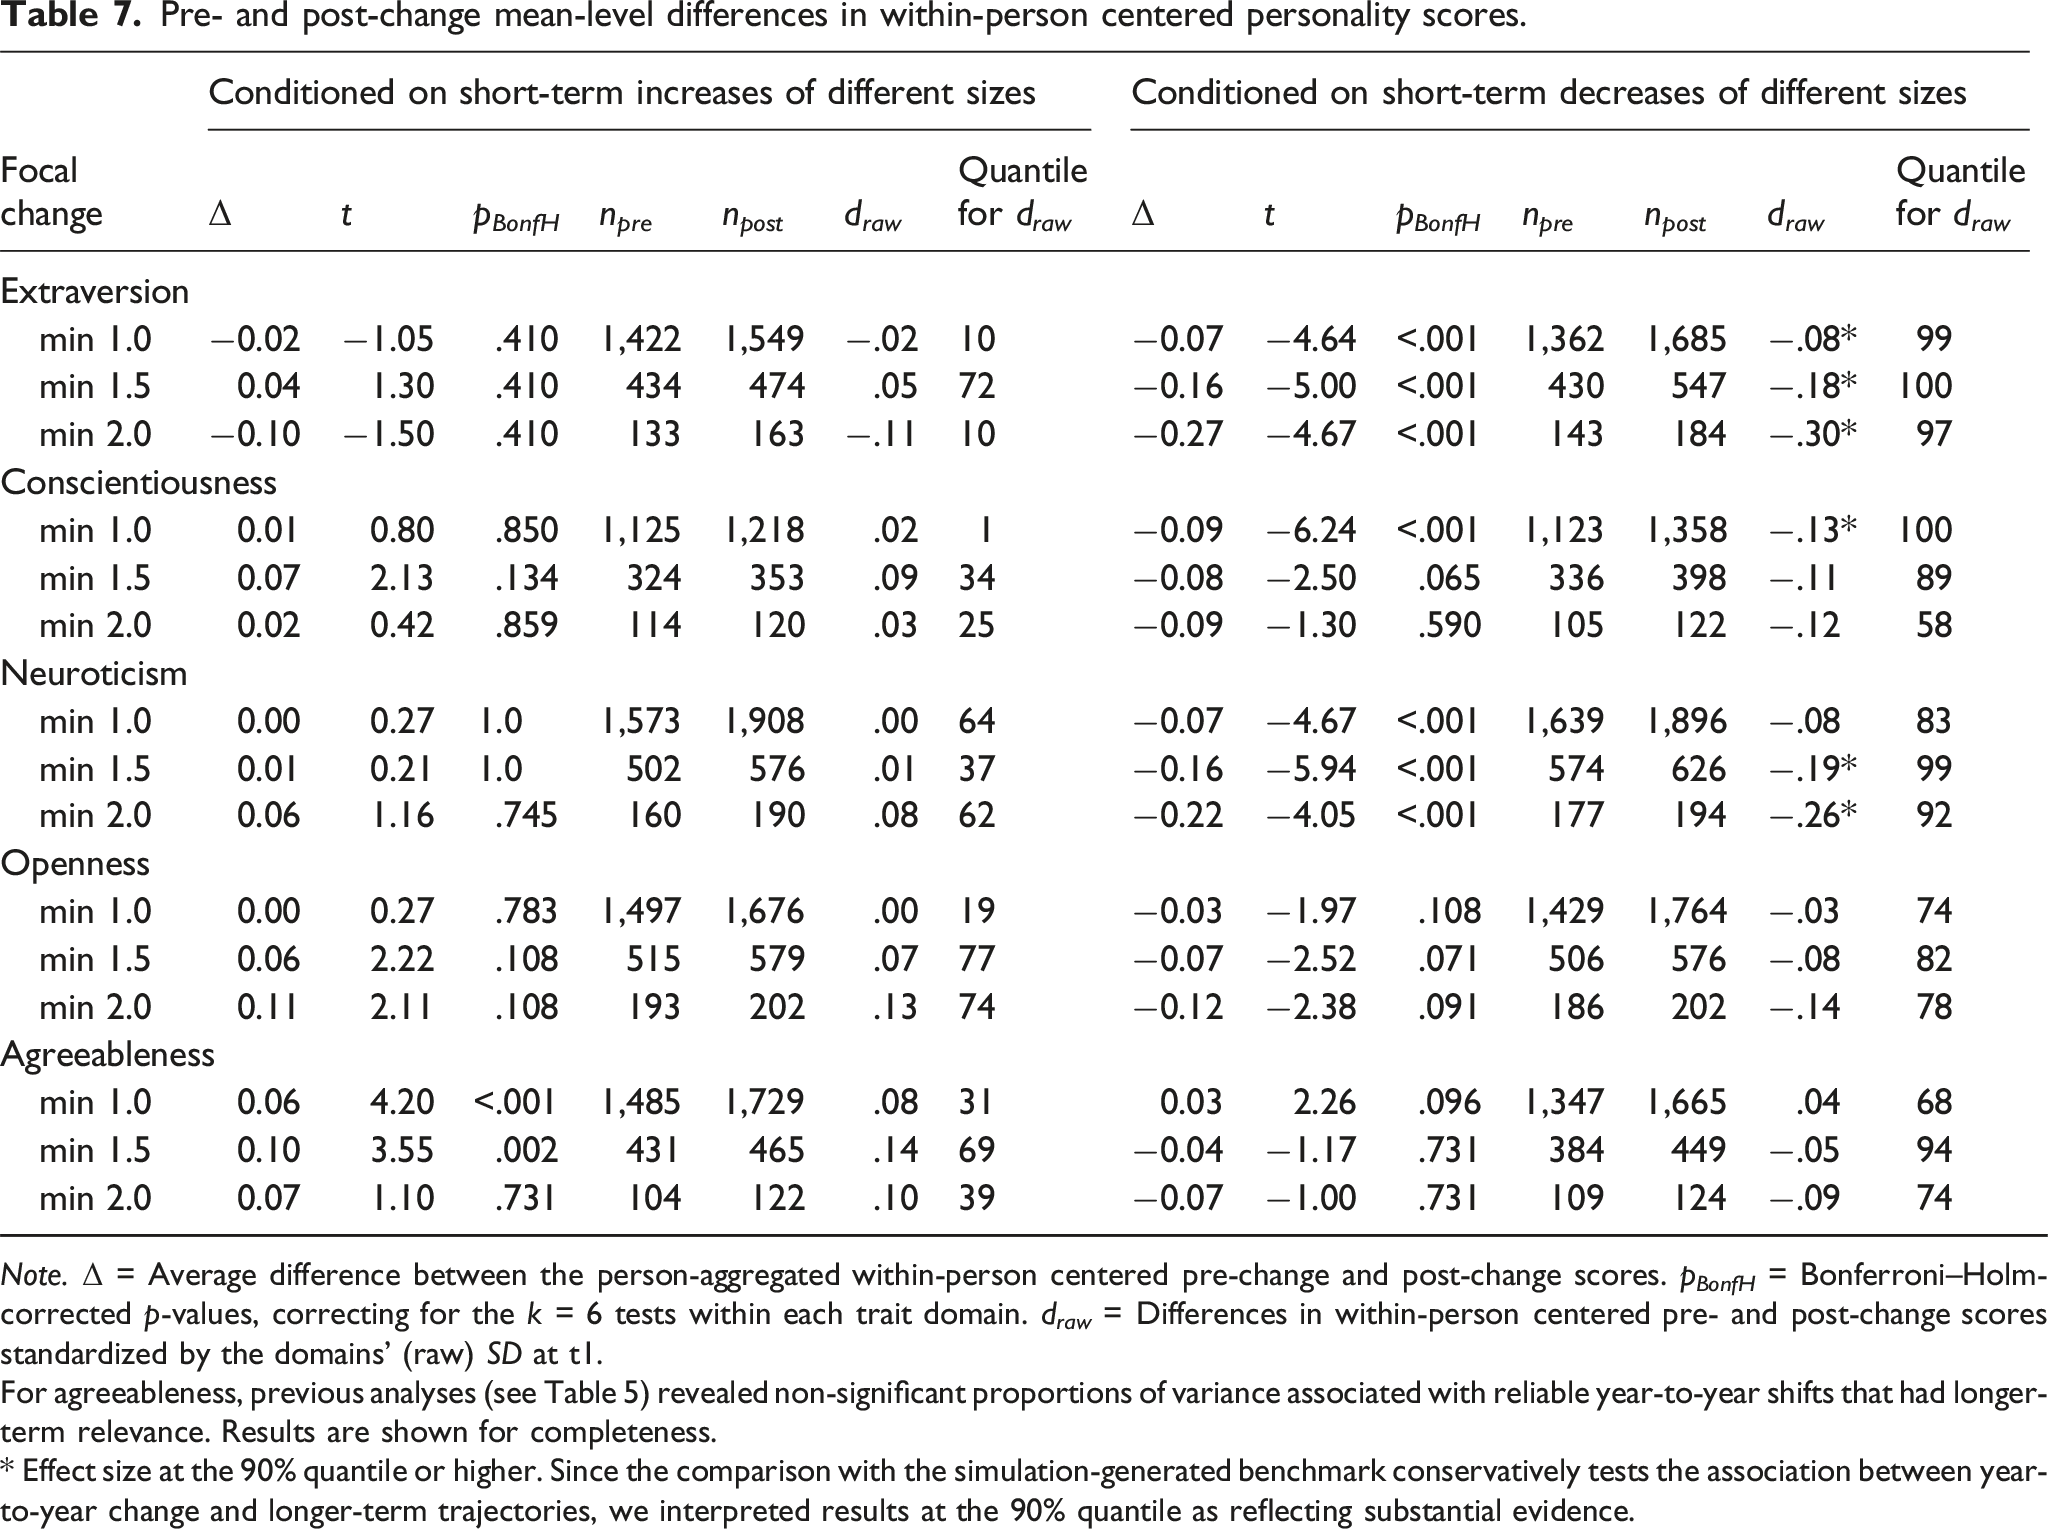
Note. Δ = Average difference between the person-aggregated within-person centered pre-change and post-change scores. p BonfH = Bonferroni–Holm-corrected p-values, correcting for the k = 6 tests within each trait domain. d raw = Differences in within-person centered pre- and post-change scores standardized by the domains’ (raw) SD at t1.
For agreeableness, previous analyses (see Table 5) revealed non-significant proportions of variance associated with reliable year-to-year shifts that had longer-term relevance. Results are shown for completeness.
* Effect size at the 90% quantile or higher. Since the comparison with the simulation-generated benchmark conservatively tests the association between year-to-year change and longer-term trajectories, we interpreted results at the 90% quantile as reflecting substantial evidence.
Three general findings emerged. First, year-to-year changes were descriptively associated with lasting within-person differences, but effect sizes exceeded the simulation-generated benchmark only for selected change patterns. Hence, year-to-year change largely reverted, and for many change patterns, longer-term differences were indistinguishable from effects of random error. Second, all year-to-year changes with lasting, robust differences in personality levels were decreases. Effect sizes ranged between −.08 ≥ d raw ≥ −.30, indicating that year-to-year decreases translated into lasting individual-level change of up to a third of a standard deviation. 8 Third, the effect sizes tended to increase with the magnitude of the focal change. For instance, after year-to-year decreases of at least 1, 1.5, or 2 scale points, within-person centered scores in extraversion showed standardized mean level differences of d raw = −.08, −.18, and −.30, respectively (all exceeding the simulation-generated benchmark). This suggests that the greater the year-to-year decrease, the greater the change that lasted over the study period of up to six years.
Overall, the three complementary analyses on the longer-term relevance converge on the findings that (1) extraversion, conscientiousness, neuroticism, and openness showed reliable year-to-year changes that propagated to later instances; (2) much of the year-to-year change reverted; (3) change patterns needed to be of a minimum magnitude to be related to longer-term change; and (4) year-to-year decreases appeared more strongly associated with longer-term change than year-to-year increases.
Robustness analyses
We tested the results’ robustness in five ways. First, to explore whether the 2-item nature of the scales artificially inflated our base rate, we contrasted the results with a rate of change in higher-order Schwartz values (Lechner et al., 2022; Schwartz et al., 2012), assessed in the same sample, at the same occasions, but with a longer measure (see Table S10). Results aligned with the RCI-implied likelihood and indicated that for changes of ≥1 scale point, our base rate did not appear inflated. Second, we examined whether the base rate might differ by age group and found that year-to-year changes occurred in all age groups and, in most cases, to a very similar extent (see Table S11, Figure S2). Third, we checked whether repeated test administration had influenced the base rate of year-to-year change (see Tables S12–S15) or the relation with longer-term change, and this was not the case. Fourth, we were able to show that the pattern of individual differences in year-to-year change was consistent for those who participated more frequently (see Figure S3). Fifth, we found that the relations between year-to-year change and longer-term trajectories also emerged when modeling the longer-term trajectories with a quadratic slope. Complete descriptions of the robustness checks are provided in Supplement B.
Discussion
Prior research concluded that personality trait change occurs slowly, with relatively small changes accumulating over time (Roberts et al., 2006; Roberts & Jackson, 2008; Wrzus, 2021). Transformative changes or a set-point model of personality traits were thought not to fit the patterns of continuity and change shown in long-term longitudinal studies. This portrait was recently challenged by results showing that personality traits can change dramatically over relatively short periods of time through intervention (Grosz et al., 2022; Roberts et al., 2017; Stieger et al., 2021). To determine the base rate of such dramatic changes in the general population, we examined the prevalence of (pronounced) year-to-year changes in personality trait levels in a large sample representative of the adult population in Germany and explored the extent to which year-to-year changes were related to changes over periods of up to six years. Results indicated that personality trait scores did change over one year, often even dramatically (e.g., 1 SD or more change in ≈ 20%). Consistent with a set-point model, and also because of measurement error in the change scores, most of that change faded with time. However, in all domains but agreeableness, shifts from one year to the next were reliably associated with participants’ longer-term trajectories. Hence, at least some of the short-term change reliably remained in place over up to six years. Overall, the results suggest that patterns of continuity and change in personality traits share qualities consistent with both the set-point model and the cumulative change model. The findings can update our understanding of personality trait continuity and change.
Stability and change in the year-to-year changes
How much short-term change can be (maximally) expected?
Over adulthood, personality traits change to moderate degrees (Bleidorn et al., 2022; Damian et al., 2019; Hill et al., 2012; Roberts et al., 2006; Small et al., 2003). In the scope of adulthood, a single year reflects a relatively short time span. Can personality trait change occur over such a short period? Our data suggest that the answer to this question is yes. About 22% and 6% of all year-to-year patterns deviated by at least 1 and 1.5 scale points, respectively (on a scale from 1 to 5), corresponding to standardized changes of at least 1 and 1.5 SD. Relative to standards from intervention-related or lifetime change, this base rate of year-to-year change seems strikingly high. It seems quite common for personality traits to change as much from one year to the next as they do following therapy or digital coaching (Allemand & Flückiger, 2022; Roberts et al., 2017; Stieger et al., 2021). When compared to the change that occurs over the entire stretch of adulthood—change of 1 SD (e.g., Bleidorn et al., 2022; Roberts et al., 2006)—one in two participants showed that magnitude of change in any given trait domain at least once over the study period of (up to) six years.
This high base rate of year-to-year change needs to be contextualized in four ways. First, most crucially, the documented change may be partly attributable to measurement error. Because the trait scores were means across two items on a 1-to-5 scale, the smallest possible change was 0.5 scale points. This smallest change could likely occur due to measurement error alone; the RCI-implied likelihood for true growth/decline was only 76–79%. Hence, the rate of 0.5-scale points change was inflated and should not be taken as true trait change. Importantly, however, more pronounced year-to-year changes of 1 or more scale points were rather unlikely to reflect mere measurement error (see Table 3, Table S10) and should not be dismissed as random fluctuations. Yet, despite psychometric support for these more pronounced changes, our base rate does not formally distinguish between true trait change, temporary, or unsystematic deviations (Roberts, 2018; Steyer et al., 2015; see also Stieger et al., 2022). Therefore, the base rate reflects the maximum rate of change in personality trait scores expected over one year.
Second, relatedly, because of the two-item scales, the base rate has a limited granularity of the year-to-year changes. We documented change in increments of 0.5 scale points, corresponding to standardized increments of SD = .56–.70. By standards of personality development, these increments are relatively large (e.g., Bleidorn et al., 2022). Future studies using longer measures should report the prevalence of more finely graded changes. It is conceivable that such data yield lower rates, particularly for year-to-year changes < 1 SD.
Third, the base rate comprises change in both directions, and across participants, increases and decreases occurred in equal proportions. For example, while 13% of the year-to-year changes in neuroticism roughly corresponded to the size of lifetime change (i.e., decreases of 1 SD), there were another 13% changing into the opposite direction. Consequentially, the average normative year-to-year change was close to zero. Although this normative short-term change well described about 40% of all year-to-year patterns, it conceals the high frequency of year-to-year change in the population.
And fourth, the base rate resulted from a sample of the general population. Robustness analyses showed age differences in the rates to be small (see Figure S2). This supports the plasticity principle (e.g., Baltes, 1997; Roberts & Nickel, 2017; see also Schwaba & Bleidorn, 2018) and suggests that year-to-year personality change can occur over the entire life span. Yet, the rate of change in specific subpopulations, such as young adults or clinical populations, cannot be directly inferred from our base rate.
As discussed in greater detail below, the year-to-year changes in our base rate were not all long-lasting. Nonetheless, even without information about longer-term consequences, the base rate of year-to-year change helps to contextualize the evidence from intervention studies (e.g., Roberts et al., 2017; Stieger et al., 2020, 2021). That is, a comparison to our results allows for testing whether change observed in intervention samples differs against the change observed in the general population. Also, by documenting the absence of normative trends in year-to-year change, our base rate suggests that average intervention effects on personality trait levels are not biased by the year-to-year shifts typically occurring in the general population. Here, future studies on the rate of change in populations typically targeted in intervention studies should expand the current findings.
Year-to-year changes are associated with longer-term trajectories
Exploring the longer-term relevance of year-to-year changes yielded three major results. Foremost, changes occurring from one year to the next can remain consequential in the longer term. If year-to-year changes were merely time-specific deviations or random noise, they would not be systematically associated with longer-term trajectories. Strikingly, however, this was the case in four of the five domains. For extraversion, conscientiousness, neuroticism, and openness, individuals exhibited year-specific shifts that were not captured by their longer-term trajectories over six years and yet were carried over to later moments of their trajectories. Enduring change translated to up to a third of a standard deviation, thereby reaching effect sizes of (digital) interventions (Jackson et al., 2021). That said, the occurrence of year-to-year change did not fully explain the longer-term trajectories. For some change patterns, the consequences faded over the study period, not exceeding those of random fluctuations. And for agreeableness, year-to-year changes were not reliably related to longer-term trajectories at all. Hence, while quick and potentially substantial changes in personality traits were indeed evident, they seem complementary to other processes of longer-term change.
Second, despite overall reliable longer-term relevance, much of the year-to-year change dissipated with time. This pattern is similar to set-point assumptions, suggesting that individuals largely revert to a pre-change baseline (e.g., Fujita & Diener, 2005; Luhmann et al., 2014; Ormel et al., 2017). The reversal of change may partly be due to measurement error in the change scores. Also, the predominant reversal may differentiate the naturalistic, base-rate change reported here from intervention-related change, which may stick longer (e.g., Stieger et al., 2022).
And third, the longer-term outcomes differed depending on the magnitude and direction of year-to-year change. More pronounced year-to-year changes were more likely to be relevant in the longer term. Hence, a minimum size of year-to-year change was necessary to reliably explain differences and subsequent level change in longer-term trajectories. Moreover, the direction of change played a crucial role, with substantial consequences over the study period being predominantly associated with year-to-year decreases. Decreases in socially desirable traits run counter to the maturity principle (Caspi et al., 2005; Roberts et al., 2006; Soto et al., 2011). Non-normative disruptions may have longer-lasting effects on individuals’ patterns of thoughts, feelings, and behaviors than maturations, which might better be integrated into a normative life narrative (e.g., McAdams & Pals, 2006). In contrast to this reasoning, year-to-year decreases in neuroticism (reflecting short-term maturations) were also more relevant over the study period of up to six years. Potentially, year-to-year decreases in neuroticism reflect the merits of therapy or interventions intended to lastingly affect individuals’ neuroticism (Bagby et al., 1995; De Fruyt et al., 2006; Roberts et al., 2017; Stieger et al., 2022).
Implications for the understanding of personality trait change
The central findings of our study are that year-to-year personality trait changes were relatively common, often substantial in size, and, while most likely to dissipate over time, were still linked to longer-term change over the six-year study period. These results challenge previous theorizing about personality trait change at the individual level: Neither do quick trait changes revert entirely to individuals’ anchored set points (Costa et al., 2019; Fujita & Diener, 2005; Ormel et al., 2017; see also Scenario D) nor does trait change appear as a purely slow and incremental process, accumulating over extended periods of time (Roberts et al., 2006, 2017; Roberts & Jackson, 2008, see also Scenario A). Upon closer inspection, however, the results may contribute to integrating these positions. Consistent with set-point assumptions, much of the year-to-year change reverted and people were soon back near their pre-change levels. Yet, instead of reverting to the very same set point, some of the change remained (see also Ormel et al., 2017). In that sense, and consistent with the assumption of slow and incremental change (Roberts & Jackson, 2008), small amounts of change remained to potentially accumulate over longer periods. Our finding that only little change remained after rapid, substantial changes marries assumptions of set-point models with assumptions of slow and gradual change.
The results also update the empirical base for future theory development on personality trait continuity and change. That is, our results highlight that the average sample trajectory of slow and gradual change does not accurately describe the trajectories of most individuals (see also, e.g., Beck & Jackson, 2020; Denissen et al., 2019; Graham et al., 2020; Reitz et al., 2022). Theories should account for the occurrence of trait changes in the short term and individual differences therein.
Also, our data encourage theories to be more explicit about the temporal criteria defining personality trait change (Hopwood et al., 2022). The predominant reversal of year-to-year changes suggests that change over a single year may be too fast-paced to reflect genuine personality trait change and instead indicates temporary deviations, described as elastic change (Roberts, 2018). The finding that large changes can happen temporarily brings context to the propensity to examine short-term effects of factors like life events. It is possible that life events indeed have a dramatic impact on short-term change in personality but do not necessarily translate into longer-term change (e.g., Bühler et al., 2023). Our results can inform conceptual discussions about the extent to which persistence is a necessary condition for personality trait change and the required duration for such persistence (Hopwood et al., 2022; Luhmann et al., 2014; Roberts, 2018).
Relatedly, the results shed light on the role of pronounced changes in personality development (Roberts et al., 2017). In our data, only dramatic year-to-year change patterns of ≥ 1 SD were substantially related to longer-term trajectories, and the enduring contributions were small and gradual in nature. This suggests that pronounced changes in the short term can be more than short-lived, state-like shocks and may indeed be linked to persisting trait change. It would indicate that one route to long-term change is to overshoot one’s current status by a large margin to gain a small increment in the longer run. Theories of personality development could expand on pronounced changes in the short term as catalysts for individuals’ future trajectories.
Limitations and future directions
Although our study features notable strengths such as large and nationally representative data, annually repeated assessments of personality, a description of year-to-year change close to the actual data, and triangulated analyses and robustness checks to explore the longer-term relevance, several limitations should be considered. First, our base rate provides an initial description of normatively occurring short-term change, and future work should set out to extend this base rate. For example, our base rate did not include change at the facet level. Since personality facets differ in long-term change (e.g., Brandt et al., 2023), they may also differ in short-term change. Relatedly, as discussed earlier, with two items per trait domain, a deviation in a single item yielded relatively large (standardized) change scores. Our base rate, therefore, covers the upper bound of expected short-term change. Particularly for the rate of change of 0.5 SD, comprehensive personality questionnaires can provide more accurate estimates.
Second, we studied year-to-year change as an example of short-term change and change over up to six years as longer-term change. While these time frames reasonably align with the literature on personality trait change (e.g., Denissen et al., 2019; Roberts & Jackson, 2008), we admit we were bound to the wave schedule in the secondary data we used. Alternative time frames are conceivable as well. For example, intervention research suggests that personality trait changes might occur even more quickly (e.g., Jackson et al., 2021; Stieger et al., 2021, 2022). Future research should cumulate evidence on changes across further time scales—from months or even weeks to multiple years or even decades—to eventually attain a fuller understanding of change and stability in personality traits (Hopwood et al., 2022; Luhmann et al., 2014).
Third, when explaining longer-term trajectories with year-to-year change in Step 2.2, we modeled linear growth. Linear growth might not accurately reflect the underlying process, potentially biasing the estimated association between year-to-year and longer-term change. However, trait change within an adult decade is commonly conceptualized as a linear process (e.g., Bleidorn et al., 2021; Chopik & Kitayama, 2018). Consistency with this literature informs about whether commonly reported growth processes might have been impacted by year-to-year changes. Moreover, results held for robustness checks with quadratic slopes and converged with results from Steps 2.1 and 2.3 modeling different functional forms. Hence, year-to-year change robustly predicted multiple operationalizations of longer-term trajectories.
Fourth, except for the longer-term trajectories, we did not examine the criterion-related validity of the year-to-year changes. Future research should examine the possibility that year-to-year changes reflect meaningful, temporary adaptations to (external) events and test relations to (short-term) changes in criteria such as life satisfaction, well-being, or behavioral indicators of the respective trait domains.
Fifth, the GESIS panel is a probability sample representative of the German adult population. The generalizability of the findings across different cultures, countries, and age groups remains an open question. Particularly populations in emerging adulthood—the most sensitive period for personality trait change (Bleidorn et al., 2022; Lüdtke et al., 2011)—might yield valuable information here.
Sixth, we studied change separately per personality domain. Exciting questions could be asked on co-development across domains (Allemand & Martin, 2016). For instance, sustainable longer-term changes in a certain domain could be characterized by being preceded by the co-occurrence of short-term changes across several domains. Future studies should explore this possibility in detail.
Conclusion
This study is the first to provide a base rate of year-to-year change in personality traits in a nationally representative sample, showing that year-to-year changes can systematically predict individuals’ longer-term trajectories. Overall, year-to-year changes in personality trait scores were (1) relatively common, (2) evenly distributed between increases and decreases at the sample level, and (3) often substantial in size, making them unlikely to reflect measurement error alone. Over the study period of up to six years, the year-to-year changes (4) largely reverted and (5) yet showed several systematic relations with individuals’ longer-term trajectories. The results imply that personality traits have a capacity for change over short timescales in ways that can gradually impact individuals’ longer-term trajectories. Thereby, the results bridge the gap between theories of cumulative change and set-point models. The causes, consequences, and individual differences in short-term changes are promising to enhance our understanding of personality trait development.
Supplemental Material
Supplemental Material A: Supplementary Tables and Figures
Supplemental Material A for The base-rate and longer-term relevance of year-to-year change in personality traits by Lena Roemer, Clemens M. Lechner, Beatrice Rammstedt, and Brent W. Roberts in European Journal of Personality.
Supplemental Material
Supplemental Material B: Information on the Simulation-Generated Benchmark and Robustness Checks
Supplemental Material B for The base-rate and longer-term relevance of year-to-year change in personality traits by Lena Roemer, Clemens M. Lechner, Beatrice Rammstedt, and Brent W. Roberts in European Journal of Personality.
Footnotes
Author’s note
Declaration of conflicting interests
The author(s) declared no potential conflicts of interest with respect to the research, authorship, and/or publication of this article.
Funding
The author(s) received no financial support for the research, authorship, and/or publication of this article.
Open science statement
Access to the GESIS panel data used in the current study can be requested online (https://www.gesis.org/en/gesis-panel/data). The code, output, and supplemental results are uploaded to the OSF: ![]() . The study design and analyses were not pre-registered.
. The study design and analyses were not pre-registered.
Supplemental Material
Supplemental material for this article is available online.
Notes
References
Supplementary Material
Please find the following supplemental material available below.
For Open Access articles published under a Creative Commons License, all supplemental material carries the same license as the article it is associated with.
For non-Open Access articles published, all supplemental material carries a non-exclusive license, and permission requests for re-use of supplemental material or any part of supplemental material shall be sent directly to the copyright owner as specified in the copyright notice associated with the article.