
Abstract
We describe three studies that together provide a first approximation to a comprehensive taxonomy of unique personality facets. In Study 1, we semantically sorted, removed synonyms, and factor analysed 1772 personality items taken from seven major omnibus personality inventories and four narrow inventories. Study 1 identified 61 base facets. In Study 2, we conducted a systematic review of the literature to identify facets missing from the 61 base facets. We identified 16 novel facets. We then created standardised, open access items for the 77 facets. In Study 3, we administered the items to a novel sample (N = 1096) and assessed the psychometric properties of the facets. The ultimate result was 70 personality facet scales that are open access, psychometrically robust, unidimensional, and discriminant. We call this inventory the Facet-level Multidimensional Assessment of Personality or Facet MAP, version 1. The Facet MAP contains scales equivalent to almost all scales present in major personality inventories, and in most cases, many more as well. As the Facet MAP develops, we hope it will eventually provide a comprehensive taxonomy of personality facets, which will prove useful in reducing construct proliferation and facilitating numerous avenues of important personality research. The Facet MAP items and user manual can be found at: facetmap.org.
Introduction
Taxonomies of human personality traits describe phenotypic patterns of thinking, feeling, and behaving. Most personality trait taxonomies and inventories are hierarchically structured, building from individual items (nuances), through narrow traits (facets), to broader traits (dimensions/domains/factors). Figure 1 contains an illustrative example of a hierarchical model of personality based on the Big Five/Five-Factor Model traditions. Most taxonomic research has focused on broad trait domains with comparatively little having examined the taxonomic structure of narrower traits (Schwaba, et al., 2020; Soto & John, 2017; Ziegler & Backstrom, 2016). Where taxonomic research has examined narrow traits, it has mostly been piecemeal in nature, with ‘little systematic research yet to delineate an empirically based and comprehensive model of personality facets’ (Mõttus et al., 2020, p. 1177). In order to address this limitation, we conducted three studies. In Study 1, we semantically sorted and factor analysed 1772 personality items to identify a broad set of base facets. In Study 2, we conducted a systematic literature search to identify any potentially missing facets before writing items for all unique facets identified. In Study 3, we analysed and refined the resultant scales using confirmatory factor analysis, invariance analysis, and five assessments of ‘discriminant validity evidence’. The ultimate result of these studies is a list of facets, and open access scales to assess them, that provide a first approximation to a comprehensive taxonomy of personality facets. Illustrative example of a hierarchical model of personality based on the Big Five/Five-Factor Model tradition.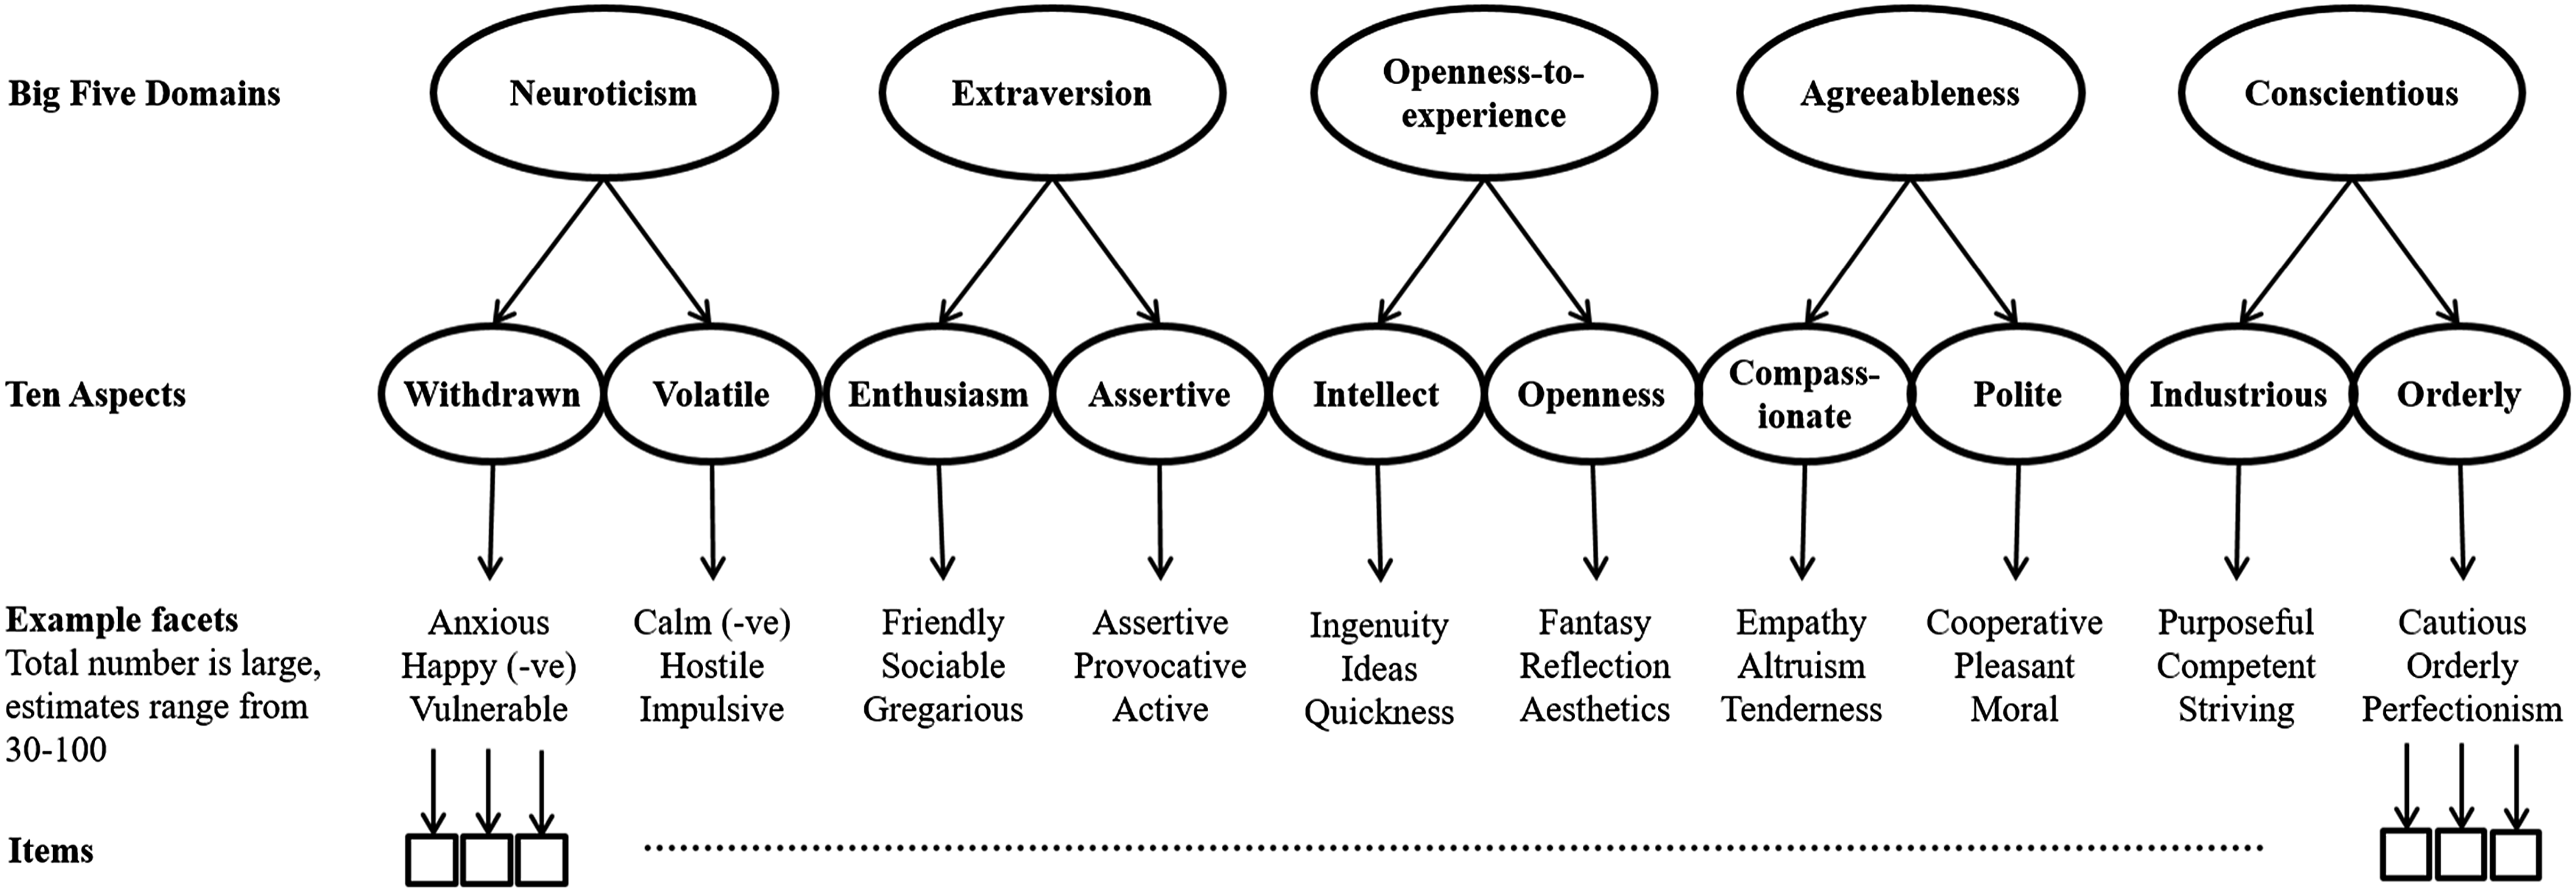
The importance of facets
Although each level of the personality hierarchy is interesting and useful (Mõttus et al., 2020), there are at least three compelling reasons to focus on facet-level traits. First, in existing models, facets represent the first factors identified above the item-level and thus provide rich descriptions of stable and generalisable patterns of thought, feeling, and behaviour at a narrow-trait level. In contrast, intermediate, broad, and superordinate factors offer multidimensional descriptions of human behaviour. In practice, however, the term facet is subject to different uses. Some scales described as facets are multidimensional, some are bloated specifics (i.e. little more than several slightly re-worded items; Cattell & Tsujioka, 1964), and often facets are assumed to be sub-components of a pre-specified set of broad factors (e.g. the Big Five). To clarify our use of the term, we see a facet as defined within the Cambridge dictionary, namely, ‘one part of a subject that has many parts’, with the subject being human personality. We consider facets to be narrow, psychologically unidimensional (i.e. assessing only a single phenotype), yet generalisable (i.e. cross-situational) personality traits that are statistically identified as first-order factors, located directly above items.
Second, compared with traits at higher levels of the hierarchy, facets provide improved prediction of most important societal outcomes. Historically, the opposite has been argued, namely, that broad factors should be the most predictive because they contain the most important facet covariation, can be more reliable, and in most cases we wish to explain broad/complex outcomes so we should also use broad/complex personality predictors (e.g. Ones & Viswesvaran, 1996; Salgado et al., 2015). However, the explanatory supremacy of facets, relative to broader factors, is now well established in most domains, including: work (Judge, al., 2013), education (Lounsbury, et al., 2003), online behaviour (Hughes et al., 2012), well-being (Anglim & Grant, 2014), attitudes (Soutter & Mõttus, 2021), and more (e.g. Ashton, et al., 1995; Paunonen & Ashton, 2001). In reviewing facet versus factor-level prediction within the organisational domain, Hughes and Batey (2017) stated, ‘to maximise predictive validity, narrow facets rather than broad factors – which lead to underestimates and/or distorted estimates of relationships – are evidently of greater value’ (p. 164) but went on to note that ‘there is likely one large hurdle to overcome before targeted facet-level programmes are widely adopted in research and practice, namely, identifying a satisfactory list of facets … Thus, one major goal has to be to develop such a list’ (p. 166).
Third, empirical estimates of intermediate, broad, and superordinate factors are typically calculated by combining facets. If important facets are missing then estimates of the number and nature of intermediate, broad or superordinate factors identified through techniques such as exploratory factor analysis are likely to be incorrect or incomplete (Booth & Murray, 2018; Condon et al., 2020; de Winter & Dodou, 2012; Mõttus et al., 2020; Saucier et al., 2020).
Current facet taxonomies
The most widely researched personality trait taxonomies, the lexical Big Five, and the psychometric Five-Factor Model (FFM), posit five broad personality traits (Neuroticism, Extraversion, Openness-to-Experience/Intellect, Agreeableness, Conscientiousness) that subsume various narrower, facet-level traits, typically in the range of 15–30. In many cases, facets are chosen, at least in part, for pragmatic reasons (e.g. scale length). The same is true of other broad taxonomic models such as the six-factor HEXACO model (Ashton & Lee, 2007, 2020; Lee & Ashton, 2004), AB5C (Hofstee, et al., 1992), and the 16PF (Conn & Riecke, 1994). Numerous studies have identified personality traits omitted by these taxonomies (e.g. Ashton, et al., 2000; DeRaad & Barelds, 2008; Jackson, et al., 1996a; Lee & Ashton, 2004; Lee, et al., 2000; Saucier & Iurino, 2020). For example, Paunonen and colleagues (Paunonen, 2002; Paunonen, et al., 2003; Paunonen & Jackson, 2000) identified at least ten facets (e.g. Thriftiness, Humorousness, Integrity, Religiosity, Risk Taking) that were empirically distinct from the FFM and provided incremental explanation of important life outcomes (Paunonen et al., 2003).
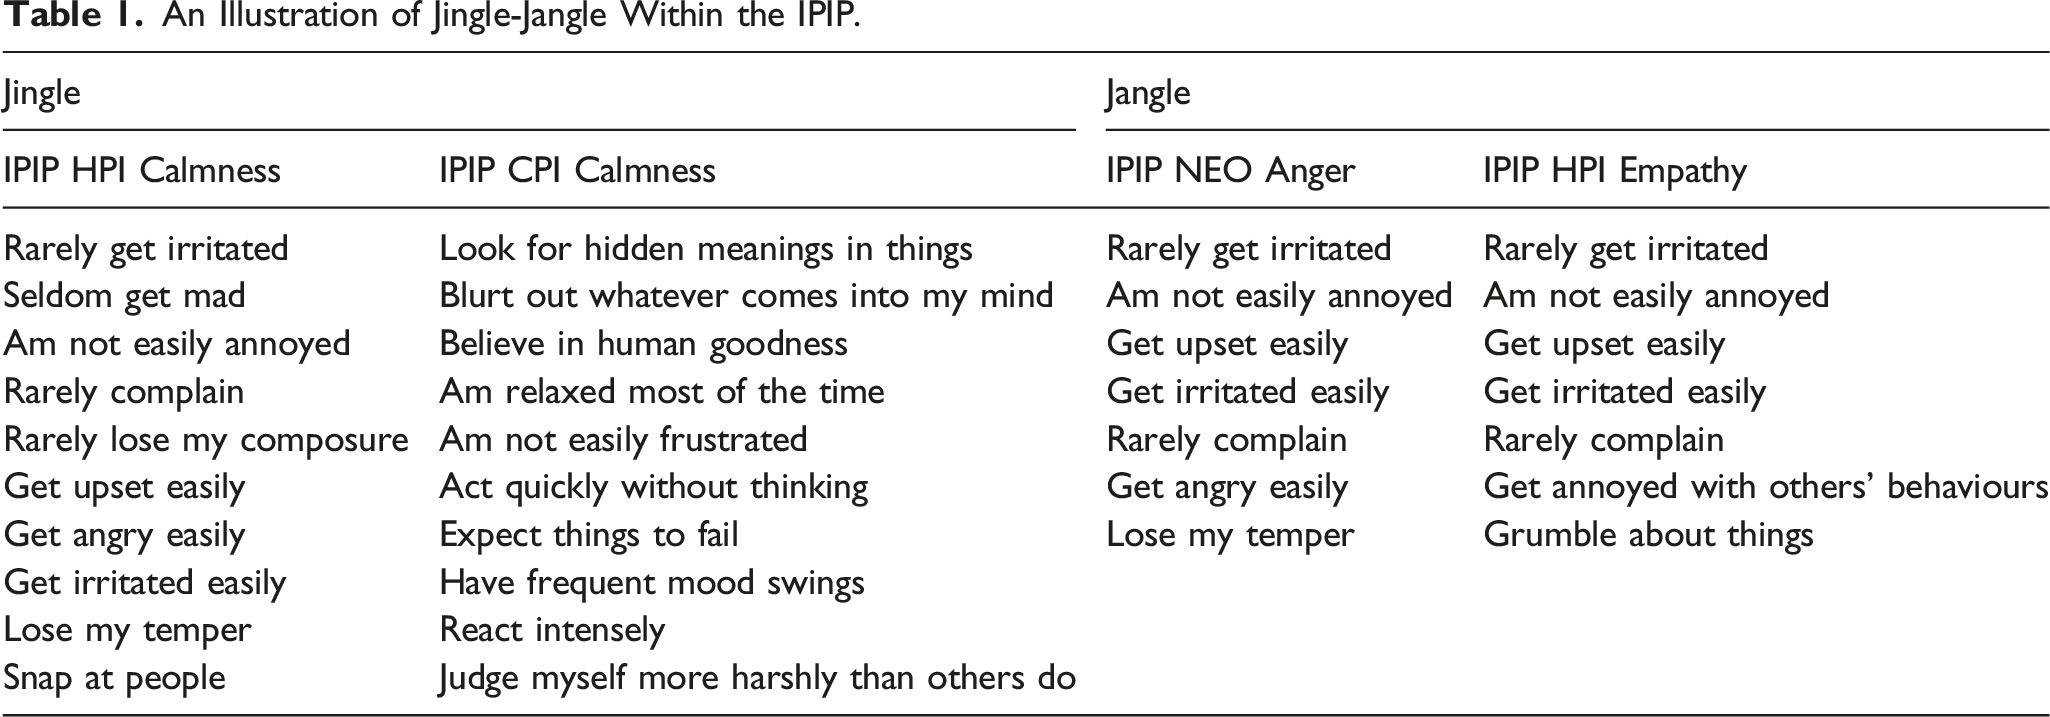
Given that each taxonomy contains, to some extent, unique facets, we can conclude that no single list contains all facets of known importance. This is not necessarily problematic if we can combine facet lists. Indeed, modern studies that seek to map narrow personality traits tend to use facets from multiple lists (e.g. Saucier et al., 2020). For example, DeYoung et al. (2007) examined ‘aspect’ level traits, located between broad factors and narrow facets (see Figure 1) using the facets from the NEO-PI-R (Costa & McCrae, 1992) and the IPIP AB5C (Goldberg, 1999). However, combining facet lists in this way can be problematic for three main reasons: (i) many existing ‘facet-level’ scales are multidimensional (McCrae, 2015), (ii) facets from different scales with the same labels often have different definitions and item content (Jingle); and (iii) facets with different labels sometimes share definitions and item content (Jangle). One example of this Jingle-Jangle Fallacy (Ziegler et al., 2013) within DeYoung et al.’s (2007) analysis concerns the AB5C Calmness facet and the NEO Angry hostility facet, which have different names but very similar item content. Thus, in this case, and a number of others, the same items and/or facets are included twice, or more, distorting the final taxonomies.
An Illustration of Jingle-Jangle Within the IPIP.
To avoid the limitations of construct proliferation and Jingle-Jangle, it is necessary to treat scale labels with scepticism and ensure that item banks remove duplicates but retain all important phenotypes. Two relatively recent studies have embraced such an approach.
First, the SAPA Personality Inventory (SPI, Condon, 2017; Condon et al., 2017) used 696 unique IPIP items and has currently collected data on over 200,000 participants. The SAPA methodology presents participants with random samples of items taken from a larger pool. To date, analyses have been reported for exploratory (N = 23,679, 13.9% mean response rate per item pair), replication (N = 54,855, 13.7% mean response rate per item pair), and confirmatory (N = 48,350, 13.6%, mean response rate) samples. Condon (2017) identified 27 facets which he suspects is an underestimate. Simulation evidence supports this conclusion given that unrestricted exploratory factor analyses with large and diverse item banks tend to fail to recover important factors (de Winter et al., 2009; MacCallum et al., 1999, 2001). Condon (2017, p. 74) speculates that there may be as many as 100+ facets, but currently has a preferred estimate of 40–50.
Second, Rouco et al. (2022) administered 528 IPIP items selected based on ratings of protypicality for each of the Big Five to 722 U.S.A. undergraduates. The sample was divided in two. The first sub-sample was used to conduct exploratory factor analysis (EFA), using maximum likelihood estimation and geomin rotation, on items sorted into each of the Big Five domains. Minimum average partial tests and parallel analysis were used to estimate the number of facets in each domain. The second sub-sample was used to apply Confirmatory Factor Analysis to the scales derived from the first sub-sample. Finally, 387 German speakers completed the 38 emergent facets, comprised of 202 items. The facets were subjected to individual CFAs, invariance analysis, and a full inventory Bi-factor Exploratory Structural Equation Model. The study identified the second largest number of personality facets to date. By grouping facets prior to EFA, Rouco et al. (2022) avoided many of the issues associated with analysing large and varied item sets. However, using only items that were prototypical of the Big Five restricted the number and nature of identifiable facets (e.g. Condon, 2017; DeRaad & Barelds, 2008; Saucier et al., 2020; Saucier & Iurino, 2020).
Current study
In the current paper, we describe three studies designed to produce a preliminary but substantial step towards a comprehensive taxonomy of personality facets and develop a set of open-source items to measure them. We adopt an iterative, multi-stage, multi-method approach. At the earlier stages of development, our goal was to be overly inclusive, such that we captured as much personality item content as possible. At the later stages, our goal was to refine, such that we eliminated redundancy and instances of jingle-jangle.
In Study 1, we build upon the strengths of Condon (2017) and Rouco et al. (2022). We compiled a database of 1772 personality items from major inventories, sorted the items into semantically homogenous groups, retaining all items regardless of their protoypicality of any Big Few model, and factor analysed each group. Each facet identified using EFA was subsequently subjected to CFA and a panel review for theoretical coherence.
Despite the large number of items analysed in Study 1, it was possible that important personality traits were missed. Thus, in Study 2, we conducted a systematic qualitative review of the personality assessment literature to identify facets missing from the Study 1 list. In total, we examined 706 personality facets at the item-level and added those that were unique. We then created open access items for each ostensibly unique facet identified.
In Study 3, the items were administered to a new sample and the psychometric properties of the facets were evaluated. We also conducted extensive tests of discriminant validity evidence to avoid redundancy.
Study 1
The goal of Study 1 was to identify as many potentially unique facets as possible from across the multiple inventories contained within the Eugene Springfield Community Sample (ESCS). Study 1 had five major steps. First, we sorted the facet scales and their 1772 items into semantically homogenous groups. Simulation studies demonstrate that factor analysis with large and varied item banks is sub-optimal (de Winter et al., 2009; MacCallum et al., 1999, 2001). Grouping optimised the data to enhance accurate factor recovery by ensuring each item set had fewer factors, higher factor loadings, and more items per factor (de Winter et al., 2009; MacCallum et al., 1999, 2001). Semantic groups were created based on item content, rather than facet labels, in order to avoid problems of jingle-jangle and no item was removed due to a lack of prototypicality with the Big Five or any other Big Few model (Mottus et al., 2020). Second, we removed duplicate items to avoid bloated specifics that would undermine accurate factor identification. Third, we conducted exploratory factor analysis on each semantic group. Fourth, we examined each identified factor using confirmatory factor analysis. Fifth, we conducted additional analyses and conceptual reviews of the factors in order to assess their theoretical coherence and independence from other factors.
Method
Participants
Data for Study 1 was taken from the Eugene-Springfield Community Sample (ESCS: n = 972). See Goldberg’s (2008) technical report for detailed information on data collection and demographics. The first wave of data was gathered in 1993 from homeowners who agreed to complete questionnaires by post for at least five to ten years with 88% (n = 757) of the original sample completing two of the last four questionnaires, demonstrating high levels of retention (Goldberg, 2008). All questionnaires were completed anonymously with identification numbers used to match responses. Participants received between $10 and $25 for each completed questionnaire (Grucza & Goldberg, 2007). In 1993, participants in the original sample ranged in age from 18 to 85 (M = 51).
Missing Data
We removed participants who had missing data for a complete personality questionnaire. Remaining missing responses were imputed using the Multivariate Imputation by Chained Equations (MICE) R package (van Buuren & Oudshoorn, 2021), generating 10 imputed data sets and randomly selecting a single dataset for analysis. Fewer than 5% of responses were imputed meaning that risk of bias was minimal (Little & Rubin, 2002; Schafer & Graham, 2002).
Measures
Seven omnibus personality inventories and four narrow scales were selected for analysis: The NEO-PI-R (Costa & McCrae, 1992; 240 items, assessing 30 facets, five-point Likert scale), California Psychological Inventory (CPI: Gough & Bradley, 2002; 462 items, assessing 13 scales, True/False response scale), 16 Personality Factor Questionnaire Fifth Edition (16PF5: Conn & Rieke, 1994; 185 items, assessing 15 scales, three-point response scale), Multidimensional Personality Questionnaire (MPQ: Tellegen & Waller, 2008, 276 items, assessing 30 facets, True/False response scale), Jackson Personality Inventory (JPI-R: Jackson, 1994; 300 items, assessing 15 scales, True/False response scale), HEXACO Personality Inventory (Lee & Ashton, 2004, 192 items, assessing 24 facets, 5-point Likert scale), Six Personality Factor Questionnaire (Jackson, Paunonen, et al., 1996b, 108 items, assessing 18 facets, five-point Likert scale), IPIP equivalent of the Need for Cognition Scale (Cacioppo & Petty, 1982; 10 items, five-point Likert scale), Right-Wing Authoritarianism Scale (RWA, Altemeyer, 1981; 14 items, nine-point Likert scale), Social Dominance Orientation Scale (SDO: Pratto, et al., 1994; 6 items, seven-point Likert scale), and IPIP Machiavellianism Scale (Social Astuteness, JPI: Jackson, 1994; 6 items, five-point Likert Scale). Further details, including year of administration, factor and facet names, and response formats are detailed in supplementary materials, S1.
Results and discussion
Stage 1.1: Semantic grouping of items
Three of the authors (TB, DH, PI) created semantic item groupings with the goal of producing homogenous item sets. Authors read the items and facet definitions and iteratively developed groups in an inductive manner. Following the initial sort, the panel reviewed the groups, discussing any discrepancies until reaching a consensus. Review panels, with informed participants, provide an effective method for conceptual reviews such as this (Presser & Blair, 1994; Willis et al., 2000). In total, 1772 items from 137 facets were sorted into 23 semantically homogenous groups. Table S1.1 within the supplemental material provides the scale labels and a general description of the item content within each semantic group.
Stage 1.2: Removal of redundant items
To identify identical or near identical items from within each semantic group, we first calculated tetrachoric, polychoric, or Pearson correlations, dependent on item response format, for all items within each group, using `polycor` (Fox & Dusa, 2022) in R 2.13.0. We then ranked the correlations and examined any item pair with a correlation > +/− .40. The cut-off was arbitrary but deemed small enough to identify all highly similar item pairs. If two items had identical wording or were semantically synonymous, we removed one, retaining items that better corresponded to item writing guidelines (e.g. Irwing & Hughes, 2018) and those with a greater number of response options. We also removed one item if two items semantically varied but represented situation-general versus situation-specific instantiations of the same underlying trait. For example, the items ‘I get lonely when I am left by myself’ and ‘I dislike eating alone’ correlated at .615. These items clearly have different content but both assess a preference for not being alone. The first item refers to a general or characteristic pattern that is applicable to many people and circumstances. In contrast, the second item is so specific that it would not apply to everyone (e.g. those with disabilities, dependents, large families) or every situation (e.g. schools, workplaces). Such items should be avoided when assessing personality (Stewart et al., 2022).
In total, we removed 355 items (20.03%) retaining 1417 items, one of the largest item sets ever analysed to identify personality facets. Table S1.2, within the supplemental material, details all item pairs analysed, their correlation, and the removed items. Table S1.3 contains the summary statistics for the items removed from each inventory.
Stage 1.3: Exploratory factor analyses
Items from each of the 23 semantic groupings were subject to exploratory factor analyses in Mplus 6.0 using weighted least squares means and variances estimation (WLSMV, Muthen, et al., 1997) and Geomin oblique rotations. We used multiple criteria to identify a plausible range of factors for each semantic group: parallel analysis (Horn, 1965), Velicer’s (1976) Minimum Average Partial test, and the Very Simple Structure criterion (Revelle & Rocklin, 1979). The application of these tests provided an indication of the number of factors but not precise estimates. Thus, we also explored factors +/− one at either end of the suggested range. For example, if the three tests suggested 4–8 factors, we examined solutions ranging from 3 to 9 factors. In identifying the optimal solution, we also considered the following criteria (Costello & Osborne, 2005): 1. Each factor should be identified by at least three primary loadings greater than .30. 2. The solution should contain no Heywood cases. 3. The magnitude of the overall variance explained by the solution. 4. The number of items which failed to load on any factor, along with the number of items with substantial (>.30) cross loadings. 5. The coherence of the item content within each solution.
Once we had established the optimal number of factors, solutions were refined by applying the following criteria; 1. Items with no loadings ≥.30 were removed, under the assumption that the latent variable should explain more than 9% of the common variance in the item. 2. Items with cross-factor loadings of approximately equal magnitude to the primary loading were removed. Such items were deemed to poorly differentiate between factors. 3. A final check for substantive factor coherence was conducted.
Summary Results of the Exploratory Factor Analyses for the 23 Semantic Groupings.
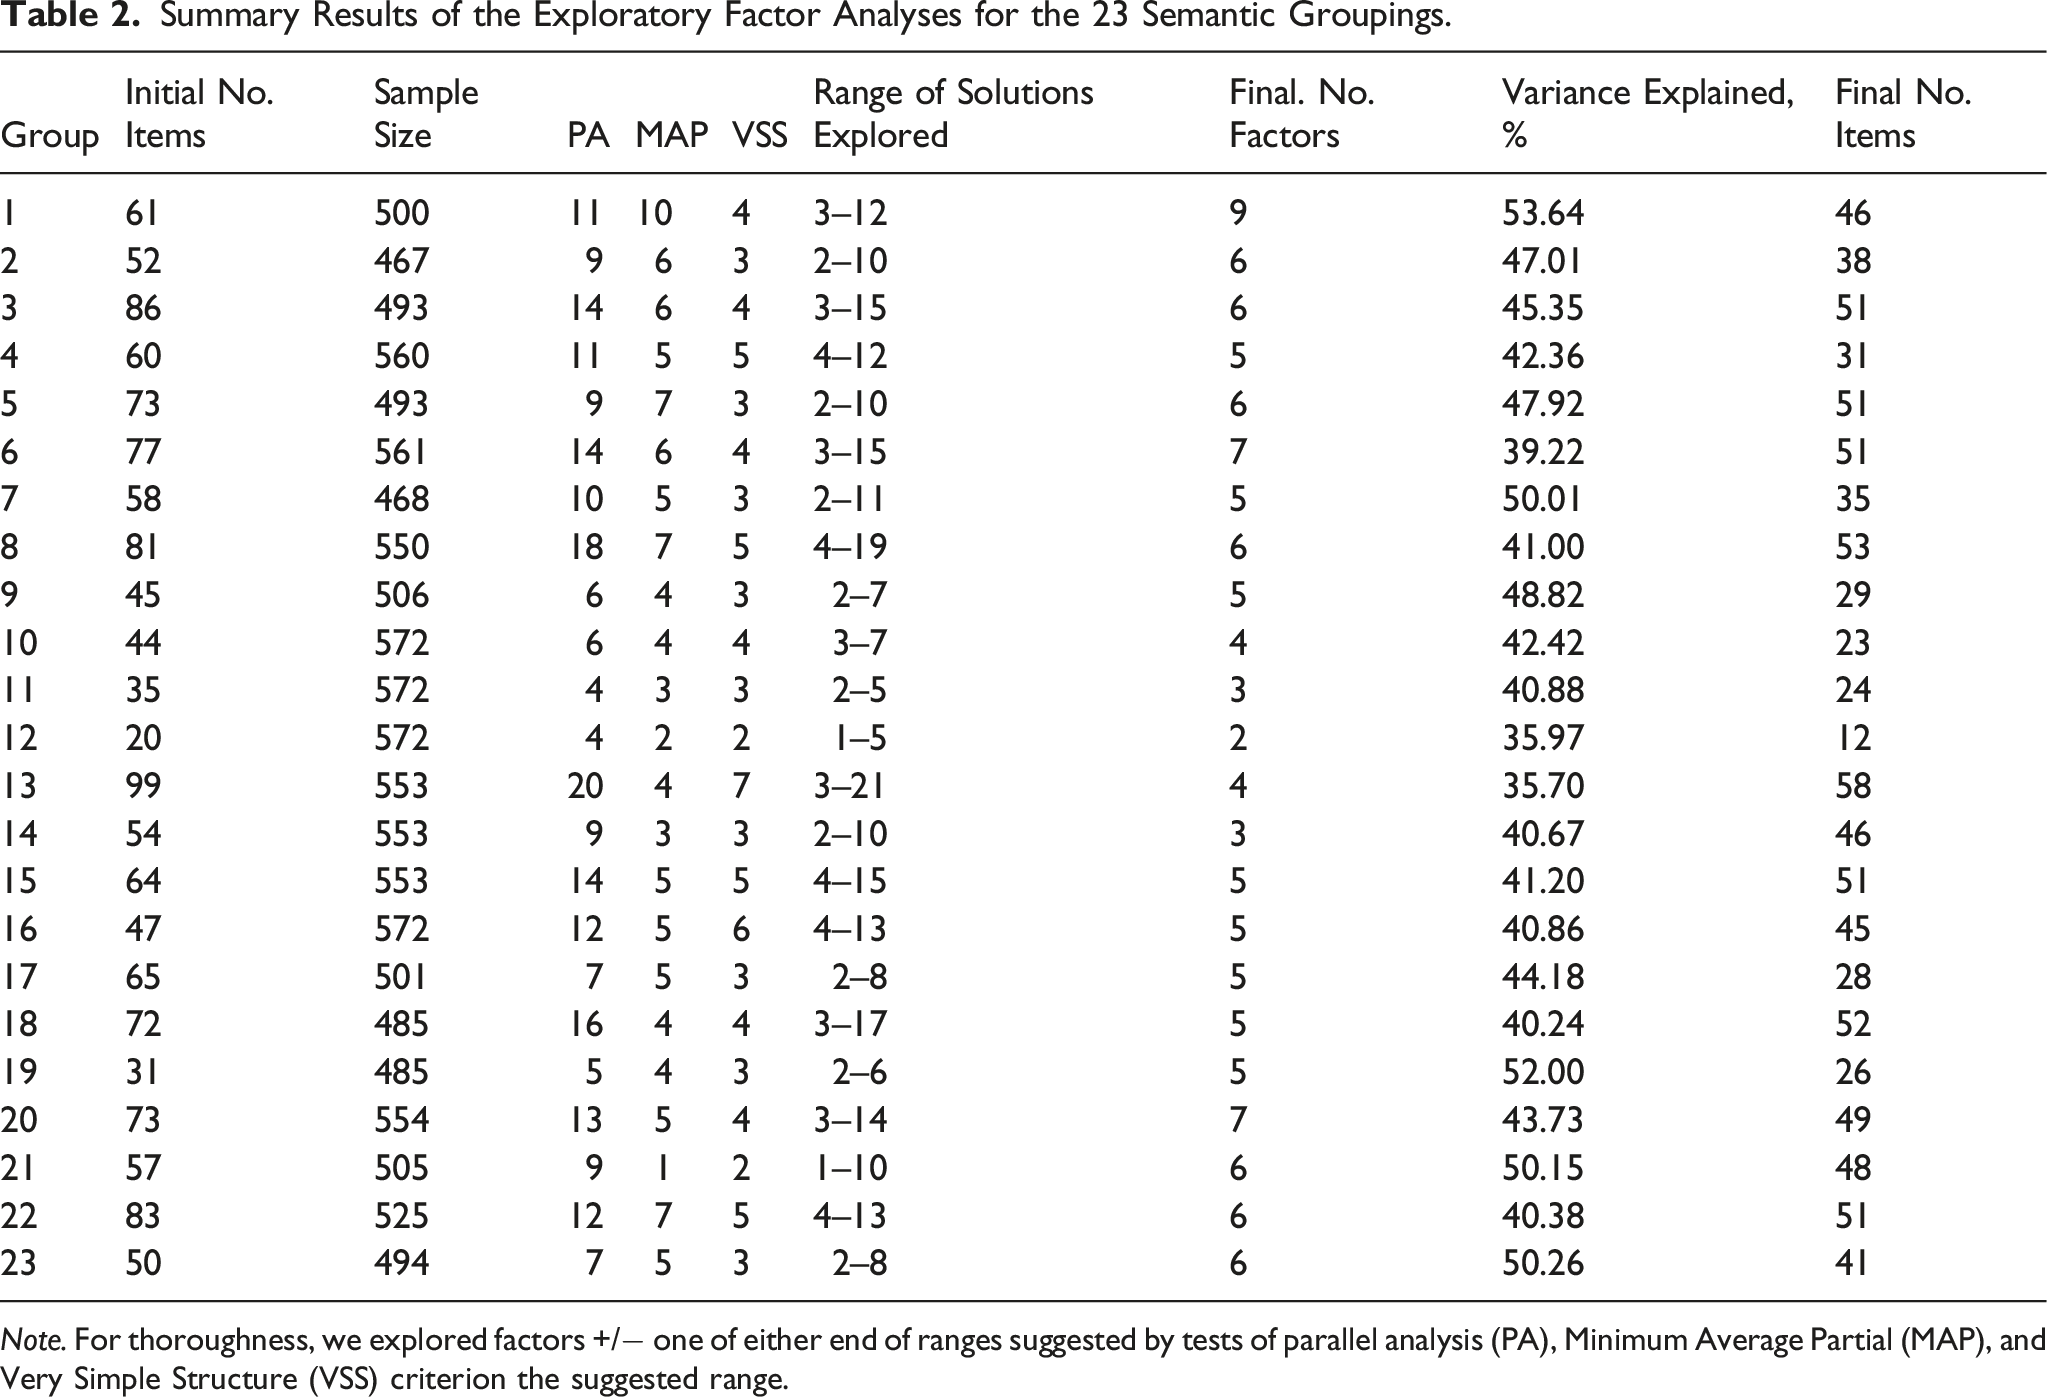
Note. For thoroughness, we explored factors +/− one of either end of ranges suggested by tests of parallel analysis (PA), Minimum Average Partial (MAP), and Very Simple Structure (VSS) criterion the suggested range.
Stage 1.4: Confirmatory Factor Analyses (CFA)
Next, each of the 121 factors was subjected to CFA to facilitate the identification of essentially unidimensional scales. Unidimensionality describes ‘whether the inferred manifest test distribution can be represented as a unidimensional, locally independent, monotone latent trait’ (Stout, 2002, p. 487). Essentially unidimensional scales are not exactly unidimensional. Items always capture multiple sources of variance (e.g. substantive and measurement error, Ziegler & Hagemann, 2015). However, a well-fitting single-factor CFA model with strong loadings and no substantial correlated errors provides initial support for unidimensionality because the factor accounts for a substantial proportion of variance in the items, and once the variance due to the latent trait is removed, the items are unrelated (Hattie, 1984, 1985; Lord & Novick, 1968). To determine fit, we used standard criteria derived from the simulation work of Hu and Bentler (1998, 1998): Root Mean Square Error of Approximation (RMSEA) ≤ .06, Standardized Root Mean Square Residual (SRMSR) ≤ .08, Tucker–Lewis Index (TLI) ≥ .95, and Comparative Fit Index (CFI) ≥ .95.
Factors that met the criteria for essential unidimensionality were retained without amendment. Factors that did not fit the criteria for essential unidimensionality were subjected to further analysis. In some cases, we made minor modifications, using modification indices to identify and remove problematic items before re-estimating the CFA models. In other cases, notably where scale items appeared multidimensional, we subjected the items to EFA, using the same process as described above, before testing the subsequent factors using CFA. In order to evaluate the improvement in fit between a single and multi-factor solution, we used the Satorra–Bentler chi-square difference test. We retained factors from models that showed improved fit and met the criteria for satisfactory solutions (e.g. 3+ items per factor etc.). For example, the initial factor 10 solution did not fit (CFI = .88; TLI = .86; RMSEA = .07), so was subjected to EFA which identified two related but distinct sub-factors concerning tendencies to be critical (e.g. If people are doing something wrong, I usually tell them what I think) and assertive (I am dominant, forceful and assertive). The subsequent two-factor model fit the data well (CFI = .98; TLI = .97; RMSEA = .04). Similarly, initial factor 75 did not fit (CFI = .89; TLI = .88; RMSEA = .04) and was subsequently split into two factors (CFI = .96; TLI = .95; RMSEA = .03) reflecting tendencies toward bad temper/frustration (e.g. Sometimes I feel like smashing things) and laziness (e.g. I must admit that I often do as little work as I can get by with). Table S1.5, in the supplemental material, contains details of all revised factors.
In total, evaluating the factors using CFA produced 136 factors with a mean of 6.9 items (supplemental material, Table S1.5). Close fit was indicated in 133 cases by the CFI, in 110 cases by the TLI, and in 125 cases by the RMSEA. At least two fit indices supported close fit for all 136 factors.
Stage 1.5: Panel review of factors
At this stage, we had identified 136 factors that were potential candidates for inclusion within the personality facet taxonomy, using purely statistical methods. Factor analyses identify patterns of covariance that might represent meaningful underlying variables but also commonly identify spurious factors. Thus, some of the 136 factors might be statistically but not conceptually satisfactory. There are also two reasons to suspect that the 136 factors contained some duplication and redundancy. First, items that were highly similar, but which had varied response formats (e.g. binary vs. 5-point likert-type scales), sometimes formed separate factors, seemingly because the different response scales inflated within scale correlations. Second, semantic item groups were necessary to circumvent limitations of EFA with large and varied item banks (de Winter et al., 2009; MacCallum et al., 1999, 2001). However, it is possible that duplicate factors were derived within different semantic groups. Thus, we next conducted an iterative series of statistical-theoretical reviews to identify and remove redundant and conceptually weak scales.
In the first review, we calculated and ranked disattenuated factor inter-correlations in R 2.13.0, using Cronbach alpha as the estimate of reliability. Next, each panel member (TB, DH, and PI) individually considered each pair of facets for redundancy in the rank order of their disattenuated correlations. This process continued until 10 facet pairs in a row were considered unique. In the case of a facet pair adjudged to be a duplicate, the panel members retained their preferred factor based on item quality as well as conceptual and psychometric robustness. For example, factors 17 (e.g. It is easy for me to strike up a conversation with someone) and 41 (e.g. Starting conversations with strangers: a. never gives me any trouble, b.?, c. is hard for me) correlated at .94 and contained highly similar content. Thus, we retained 17 and removed 41. During this process, panel members also identified scales that were evidently incoherent. Factor 83, for example, contained a variety of weak loading items with little obvious commonality (e.g. People should adapt their ideas and behaviour to the group that happens to be with them at the time; I can tell as soon as I meet someone whether I will like that person or not; The person who provides temptation by leaving valuable property unprotected is about as much to blame for its theft as the one who steals it). This first panel review led to the removal of 56 factors and the combining of two pairs (16 and 42, 45 and 130) using CFA producing factors 137 and 138, respectively. Supplementary Table S1.6 contains a brief rationale for all judgements. In total, 78 facets were retained (see Table S1.7, supplemental material).
Working Definitions and Labels for the 61 Base Facets Identified in Study 1 and 16 Unique Facets (*) Identified in Study 2.
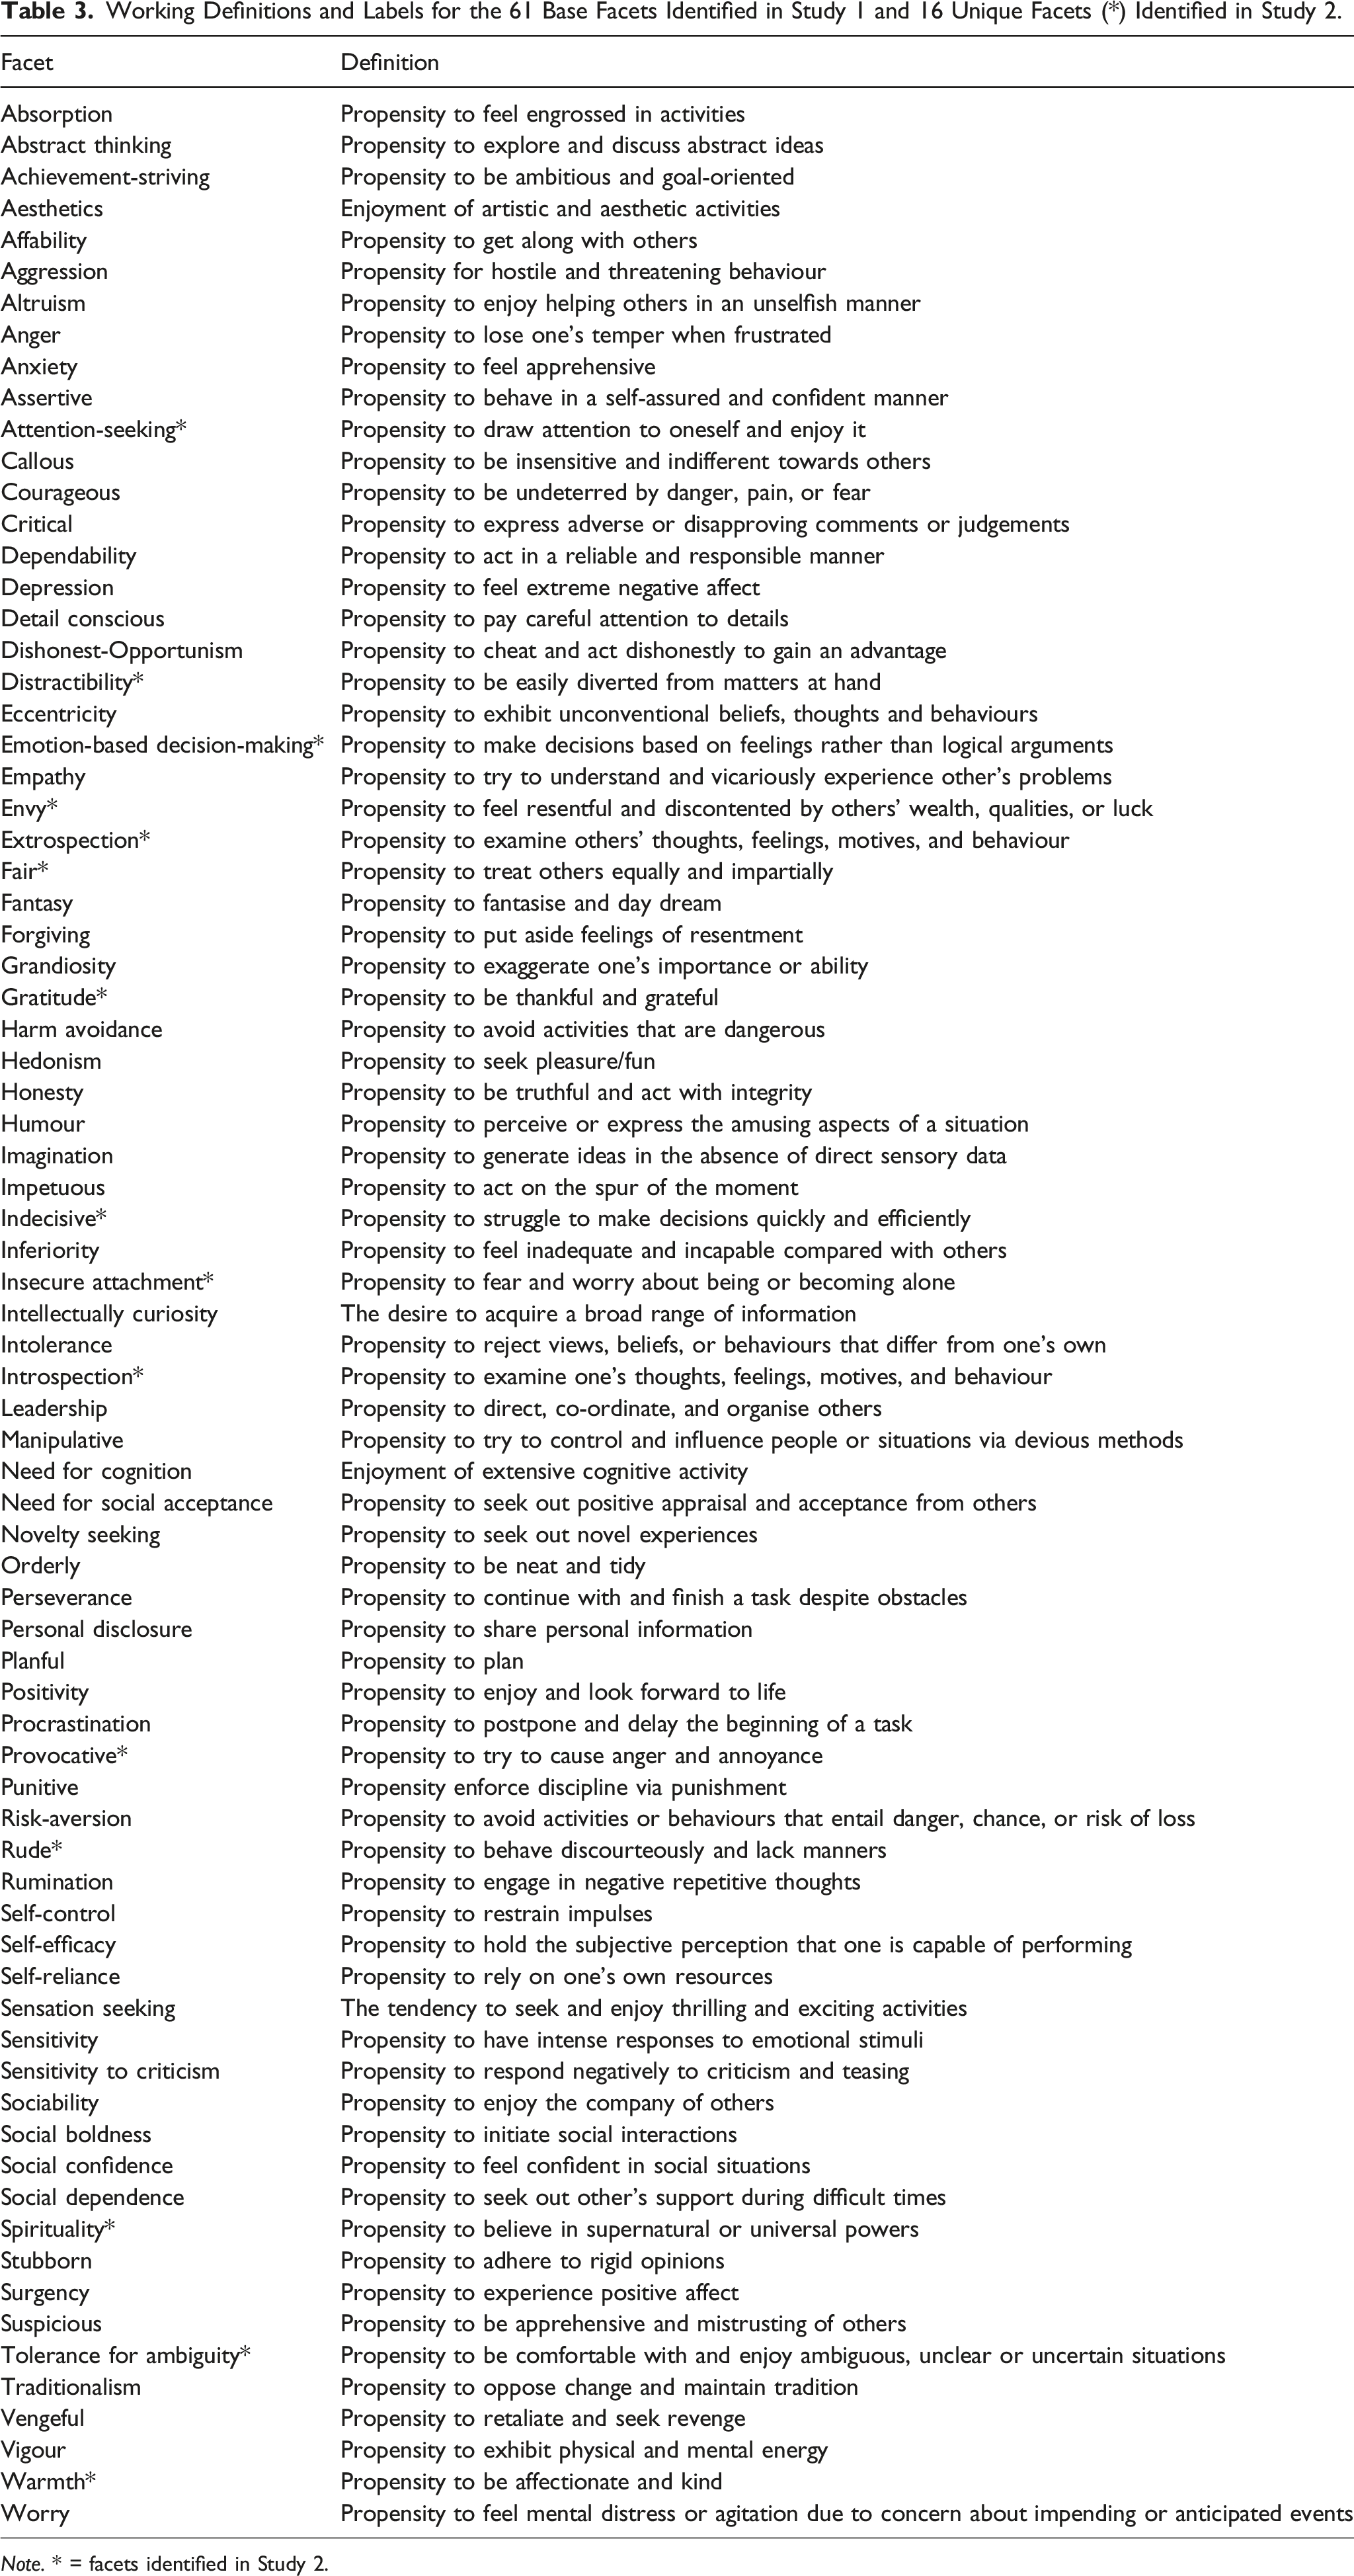
Note. * = facets identified in Study 2.
Study 1 summary
Study 1 contributed to the overarching goal of this research by identifying a base-set of candidate facets to serve as a solid starting point for additional development. Sorting facets and items according to conceptual and semantic content, rather than any particular scale’s adopted hierarchical structure, enabled facet identification to be based purely on empirical relations between personality items, in a manner that was unconstrained by the idiosyncrasies of existing measures (e.g. jingle-jangle, pragmatic facet selection, multidimensional facets, etc.). Further, because we assessed a large and varied set of personality items, from multiple major omnibus personality inventories, we are confident that the 61 facets cover much of the most important content in our field.
Confidence that the 61 base facets provide a sensible starting point for additional development is enhanced when they are compared to other facet lists. For example, we identified many more facet scales than previous studies that have adopted similar methods (e.g. Condon, 2017; Rouco et al., 2022; Watson et al., 2019) and studies that have used cluster analysis to assess large numbers of person-descriptive adjectives (e.g. Wood et al., 2010, identified around 50 personality-like clusters and around 10 non-personality clusters, e.g., well-handicapped, slim-chubby). Similarly, Saucier and colleagues (2020) applied cluster analysis to scale scores of 257 approximately facet-level scales and identified 62 clusters (plus 4 single item markers), many of which bear resemblance to the facets identified here.
Despite the large number of items analysed and the identification of a large number of psychometrically sound candidate facet scales, the biggest risk at this stage was that we had omitted important personality traits, either because insufficient items were included, semantic sorting separated items that might have coalesced, or the review panels made incorrect decisions. Thus, we considered the 61 base facets as exactly that, a base from which to build in subsequent studies.
Study 2
The major goal of Study 2 was to search the literature for personality facets beyond the 61 base facets. In addition, because many items comprising the base and additional facets were copyrighted and/or used varied response scales, we also wrote new items to ensure the final facet list comprised standardised and open access scales for unrestricted use by the research community.
Method
We searched for personality models via Google Scholar, Scopus, and Web of Science for the period 1960 to 2017 using the keywords: ‘personality scale’, ‘personality facet’, ‘personality model’, ‘personality taxonomy’, ‘personality classification’, ‘personality repository’, ‘personality factor structure’, and ‘hierarchical model of personality’. We applied four inclusion criteria to each personality model or scale. First, the facet had to conform to the consensus definition of personality: patterns of thought, feeling, and behaviour (e.g. Costa & McCrae, 2008; DeYoung, 2015; Fleeson, 2001; Tellegen, 1991). Personality was distinguished from some closely related constructs such as characteristic adaptations (DeYoung, 2015; McAdams & Pals, 2006), interests, and attitudes. Clinical facets of personality were included. However, we omitted non-personality clinical scales that assessed states or extreme symptomatology (e.g. the Dimensional Assessment of Personality Pathology – Basic Questionnaire Self-Harm scale). Second, facet scales were only included if they showed adequate psychometric properties. Third, we preferred personality scales that demonstrated theoretically coherent factor structures, even if developed post hoc. Fourth, we only included scales with open access item content, since otherwise it would have been impossible to evaluate the uniqueness of their content with respect to the 61 base facets.
Results and Discussion
Facets beyond the 61 base facets
The literature search located 706 facets, of which, 544 satisfied the four inclusion criteria. The supplementary materials lists all scales, separated into 398 scales from the IPIP (Table S2.1) and 146 from elsewhere (Table S2.2), as well as the 162 scales that did not meet our inclusion criteria (Table S2.3). The final facet list was produced by comparing the 544 scales to the 61 base facets (DH, PI, AT).
In total, 306 scales shared most or all of their item content with one of the baseline facets (Table S2.4, supplemental material). The fact that we identified approximately five instantiations of each of the 61 base facets suggests that they represent common, recurrent, and thus important personality traits in models developed from many different traditions. In short, the process lent notable credibility to the 61 base facets.
A further 217 scales were identified as multidimensional (Table S2.5 supplemental material), and thus shared item content with multiple base facets. Of these, 196 had sub-sets of items that were highly similar to those within the 61 base facets. Of the remaining 21 scales, eight were synonymous with each other (e.g. IPIP 16PF Warmth, IPIP AB5C Warmth, ZKA-PQ Social Warmth) leaving 16 scales deemed to provide content that was distinct from the 61 base facets (Table S2.6, supplemental material). Thus, the final list contained 77 facets (see Table 3).
Developing open access items for the 77 facets
We adapted Irwing and Hughes’ (2018) recommendations on scale development to the current context, following a four-stage procedure of item development: i) construction of facet definitions; ii) item generation; iii) item review; and iv) item piloting.
We developed six items for each of the 77 facets because based on domain-sampling theory (e.g. DeVellis, 2016; Hinkin, 1998; Nunnally & Bernstein, 1994), it was considered that six items would: (i) allow adequate sampling of the range of phenotypes which represent a unidimensional facet, and (ii) should be sufficient to provide conceptual differentiation between facets (Lawson & Robins, 2021). Six-item scales also have statistical advantages, including: overidentifying CFA models (Brown, 2006a, 2006b) and adequate information to estimate internal consistency.
We generated construct definitions (Table 3) before identifying or writing items. For all scales, we replaced copyrighted items with IPIP items if they were clearly equivalent, otherwise, we generated new items or modified the wording. New items were generated following the item writing guidelines recommended by Irwing and Hughes (2018, p. 17), and all items were subjected to panel review, which is generally found to be an effective procedure (Demario & Landreth, 2004; Presser & Blair, 1994). The result of Study 2 was 462 items developed to assess 77 facets. Of those, 210 items were written by the authors, 208 originated from the IPIP, and 44 were derived from freely available research scales (Table S3.1, supplemental material, contains all items).
Study 3
The goal of Study 3 was to assess the psychometric properties of the 77 newly developed facet scales regarding three major concerns that are crucial in scale development. First, we examined whether the newly developed scales evidenced strong psychometric properties. We examined CFA fit, factor loadings, average variance extracted (AVE: Fornell & Larcker, 1981), and MacDonald’s Omega (Revelle & Condon, 2019; Revelle & Zinbarg, 2009).
Second, we examined whether the new scales were essentially unidimensional (Hattie, 1985; Stout, 1987). Unidimensionality is crucial for theory development and empirical conclusions because although items capture multiple sources of variance, essentially unidimensional scales provide strong assessment of a single construct, which enables unambiguous interpretation (Hattie, 1985; Stout, 1987). Confirmatory factor analysis is a useful tool for initial assessment of unidimensionality because it enables precise modelling of a latent variable, errors of measurement, correlated errors between items, and tests of the fit of this model (Bollen, 1989; Hattie, 1985).
Third, we examined whether each facet was unique (i.e. ‘discriminant validity’; Campbell & Fiske, 1959). We adopted a multi-faceted approach to assessing discriminant validity evidence, influenced by a range of recent theoretical contributions (e.g. Hughes, 2018; Lawson & Robins, 2021) and simulation studies (e.g. Rõnkko & Cho, 2020; Shaffer, et al., 2016). All of these guiding frameworks argue against strict adherence to any particular statistical framework and recommend multi-stage evaluations to assess whether two scales are related but distinct or redundant. Accordingly, we considered evidence from four quantitative procedures (Rõnkko & Cho, 2020Rönkkö & Cho, 2020; Shaffer, et al., 2016): dissatenuated correlation coefficients using corrections based on (1) internal consistency estimates and (2) SEM; the absolute and relative fit of one- and two-factor models (3); and the relative magnitude of the dissatenuated correlation and the square root of the AVE (4). In addition, we also used conceptual criteria to aid our judgements (Hughes, 2018; Lawson & Robins, 2021). It is possible that scale pairs might appear distinct based on quantitative evidence but share items with equivalent meaning or appear redundant based on quantitative evidence whilst having clearly distinct conceptual definitions and item content (Hughes, 2018; Lawson & Robins, 2021; Rosenbusch et al., 2020). Thus, a judgement of conceptual similarity, based on construct definitions and item overlap provided important evidence that informed our examination of uniqueness and redundancy.
Method
Participants
A priori power analysis using the MBESS package in R version 4.3.0, testing for a population RMSEA = .08, with a 90% confidence interval width of .04, suggested a minimum sample size of 819 (Kelley & Lai, 2018). Given that, in total, 1096 participants completed the 77 personality facets online; we had adequate power to test for the fit of each of the 6-item latent variables. The sample aggregated data from three sources, collected in parallel, to enhance size and demographic diversity. A European sample (N = 341) was collected via the German data collection company Lime Survey. The company used a simple random sampling technique to select respondents older than 18 from their sampling frame of European nationals. Participants were payed €11.20 for completing the survey. A U.S.A sample (N = 523) was collected via convenience sampling on Mechanical Turk (i.e. Mturk), a web portal developed by Amazon to facilitate effective data collection by linking researchers to a large pool of primarily US-based respondents (Goodman, et al., 2017). Participants were paid $7.56 (20% higher than the standard fee for a survey of this size). A broader international sample (N = 232) was collected directly by the research team employing convenience and snowball sampling to target an international (i.e. non-E.U. or U.S.A) network of contacts, including colleagues, friends, and acquaintances. Prospective participants were contacted via social media messages or e-mail and each was asked to further advertise the survey among their own contacts. Participants were incentivised by the offer of a personalised personality report comparing their responses to those of the full sample.
The combined sample (N = 1096) comprised 50.8% males, 49.1% females, and .1% transgender, with ages ranging from 18 to 75 years (M = 38.4; SD = 12.8). The age distribution was slightly skewed towards younger ages (Skew = .739; Kurtosis = −.322), with the 18–29 and 30–39 years age groups collectively representing 61.7 per cent of the sample. Respondents in the sample represented 53 different countries, with the highest proportion of respondents residing in the United States (43.3 per cent), the United Kingdom (13.9 per cent), Germany (6.5 per cent), and India (4.5 per cent) (see Table S3.1 for exact details). White respondents were over-represented (73.7 per cent) compared to other ethnicities (e.g. South Asians, 5.4 per cent; North African, .2 per cent). The sample was skewed towards higher levels of education, with 64.5% of respondents possessing undergraduate and postgraduate degrees. Respondents worked in a wide variety of occupations, the most prevalent including office and administrative positions (11.8%), education and training (10.7%), computers and mathematics (10.7%), sales (9.1%), business and financial operations (8.8%), management (6.3%), and arts, design, entertainment, sports, and media (5.5%).
Missing data
Missing data was present across only nine cases (.82 per cent of the total sample). In all nine cases, the participants completed just a few items, with missingness ranging from 78 per cent to 91 per cent. Little’s (1988) Missing Completely At Random test (χ2(547) = 508.15, p = .89) indicated that the missingness was truly random. Thus, the nine cases were removed listwise, since this method is unbiased with <1% missing data, and when missingness is completely at random (Arbuckle, 1996, Wothke, 2000). The final sample numbered 1087 respondents.
Measures
First, respondents read an introduction to familiarise themselves with the purpose of the study, including an information sheet and consent form. Next, participants completed demographic questions (age, gender, current country of residence, country of birth, ethnic origin, highest level of education, and occupation) before the 77 personality facets. Facets were randomised to minimise order effects (Couper, 2008) and counteract potential fatigue effects for scales presented towards the end of the questionnaire (Ackerman & Kanfer, 2009). All items had a seven-point Likert-type response scale ranging from ‘Strongly Disagree’ (1) to ‘Strongly Agree’ (7). The seven-point response scale was chosen because it provides greater variance and reliability than fewer response options (Cook, et al., 2001), with gains typically plateauing around six or seven response options (Finstad, 2010; Simms et al., 2019). Further, it provides a midpoint, neutral response option suitable for those who feel truly neutral (Cox, 1980; Weems & Onwuegbuzie, 2001). One caution here is that when items are ambiguous, the neutral response option tends to reflect ‘it depends’ response processes (Kulas, & Stachowski, 2009, 2013). Of course, the same problems arise when midpoint options are omitted but the error variance is spread throughout the scale. Thus, for this reason and many others (Hughes, 2018), it was important to ensure that items did not require clarification or contextualisation (Kulas, & Stachowski, 2009, 2013).
Ethics
The study received ethical approval from the University of Manchester in accordance with the ethical guidelines of the British Psychological Society (BPS, 2018).
Results and discussion
Confirmatory factor analyses
The 77 facets were subject to individual CFAs using the weighted least squares means and variances (WLSMV) adjusted estimator in Mplus 7.4 (Muthén & Muthén, 1998-2015). WLSMV is suitable for ordinal-level data and is robust to violations of multivariate normality (Booth & Hughes, 2014; Flora & Curran, 2004). CFI and TLI values of ≥ .90 were taken as indicative of acceptable model fit (Hu & Bentler, 1998, 1999; Schermelleh-Engel, et al., 2003). Typically, RMSEA values of ≤ .08 are also taken as indicative of acceptable model fit. However, recent simulation studies suggest that the .08 criterion is inappropriate for scales with relatively few items and strong loadings (Kenny, et al., 2015; McNeish, et al., 2018). This so called ‘reliability paradox’ leads to inflated RMSEA values that ‘punish’ unidimensional and highly reliable scales (McNeish et al., 2018). In such cases, the RMSEA is a less useful indicator of fit, with values around .2 typically considered acceptable.
Psychometric Robustness and Essential Unidimensionality
Of the 77 scales, 67 met the criteria for moderate or close fit according to the CFI, 45 according to the TLI, and 33 according to the RMSEA (Table S3.2). Following modest modifications (e.g. removal of 1 or 2 items, 40 items in total, just 8.66%), all 77 facets fit according to the CFI and TLI, and 55 according to the RMSEA. Items were removed based on the magnitude of factor loadings, the sum of their modification indices, and item clarity. Psychometric guidelines typically recommend testing at least twice as many items as required, so the relatively small number of items omitted from the final scales supports the current process of item and scale development (Kline, 1993).
Summary of the Psychometric Properties of the 77 Original and Modified Scales.
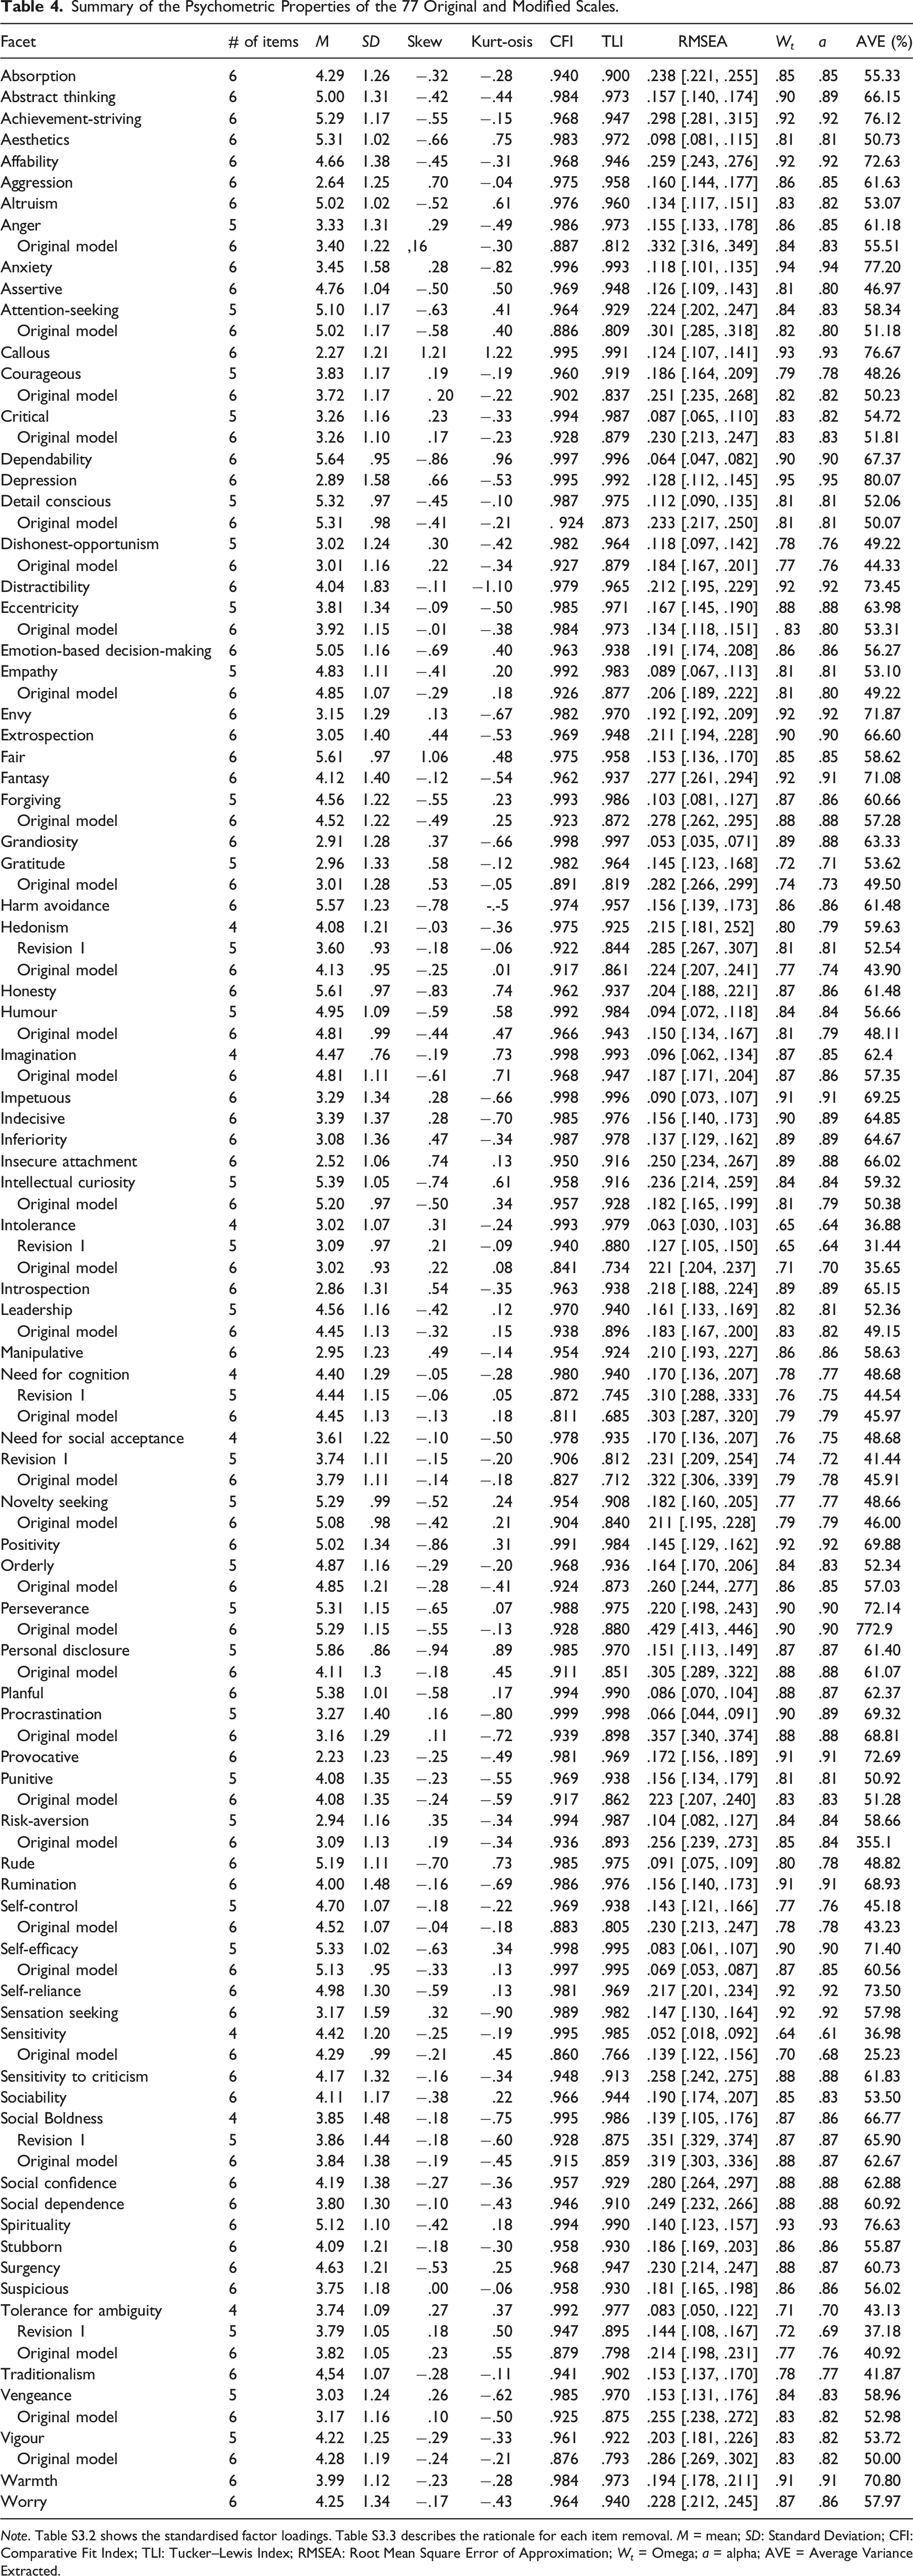
Note. Table S3.2 shows the standardised factor loadings. Table S3.3 describes the rationale for each item removal. M = mean; SD: Standard Deviation; CFI: Comparative Fit Index; TLI: Tucker–Lewis Index; RMSEA: Root Mean Square Error of Approximation; W t = Omega; a = alpha; AVE = Average Variance Extracted.
Investigating potential redundancy
Reliability corrected correlations of .85 (Clark & Watson, 1995; Kline, 2011) are typically argued to indicate potential redundancy. However, we adopted a more conservative approach that reduced the risk of missing redundant facets. Specifically, we examined scale pairs with disattenuated correlations ≥ .70, correcting them for unreliability using McDonald’s Omega (Revelle, 2016, 2022). In total, we identified 32 pairs of highly correlated scales for more thorough examination using four statistical criteria (Rõnkko & Cho, 2020; Shaffer et al. 2016) and a conceptual and semantic review of the items (Hughes, 2018; Lawson & Robins, 2021).
First, we compared two reliability corrected correlations (Omega corrected scale scores and CFA-based latent correlations) against a cut-off of ≤|.85| (Clark & Watson, 1995; Kline, 2011). Second, we compared the upper 95% confidence interval of the CFA estimated correlation between scale pairs against a cut-off of <|.80|, which was recently suggested as a preferred strategy by Rõnkko and Cho (2020). Third, we compared the fit of one-factor and two-factor CFA models (Rõnkko & Cho, 2020; Shaffer et al., 2016). Fourth, we compared the square root of the AVE for both latent variables against the factor correlation. Fornell and Larcker (1981) suggested that if the factor correlation was higher than the square root of both AVEs, this suggests redundancy. Fifth, we conducted a conceptual review of the scale definitions and item content.
Single and Two-Factor Model Fit, Latent Correlations, and Square Root of AVE for Pairs of Latent Variables With Rank-Ordered Corrected Correlations Greater Than .70.
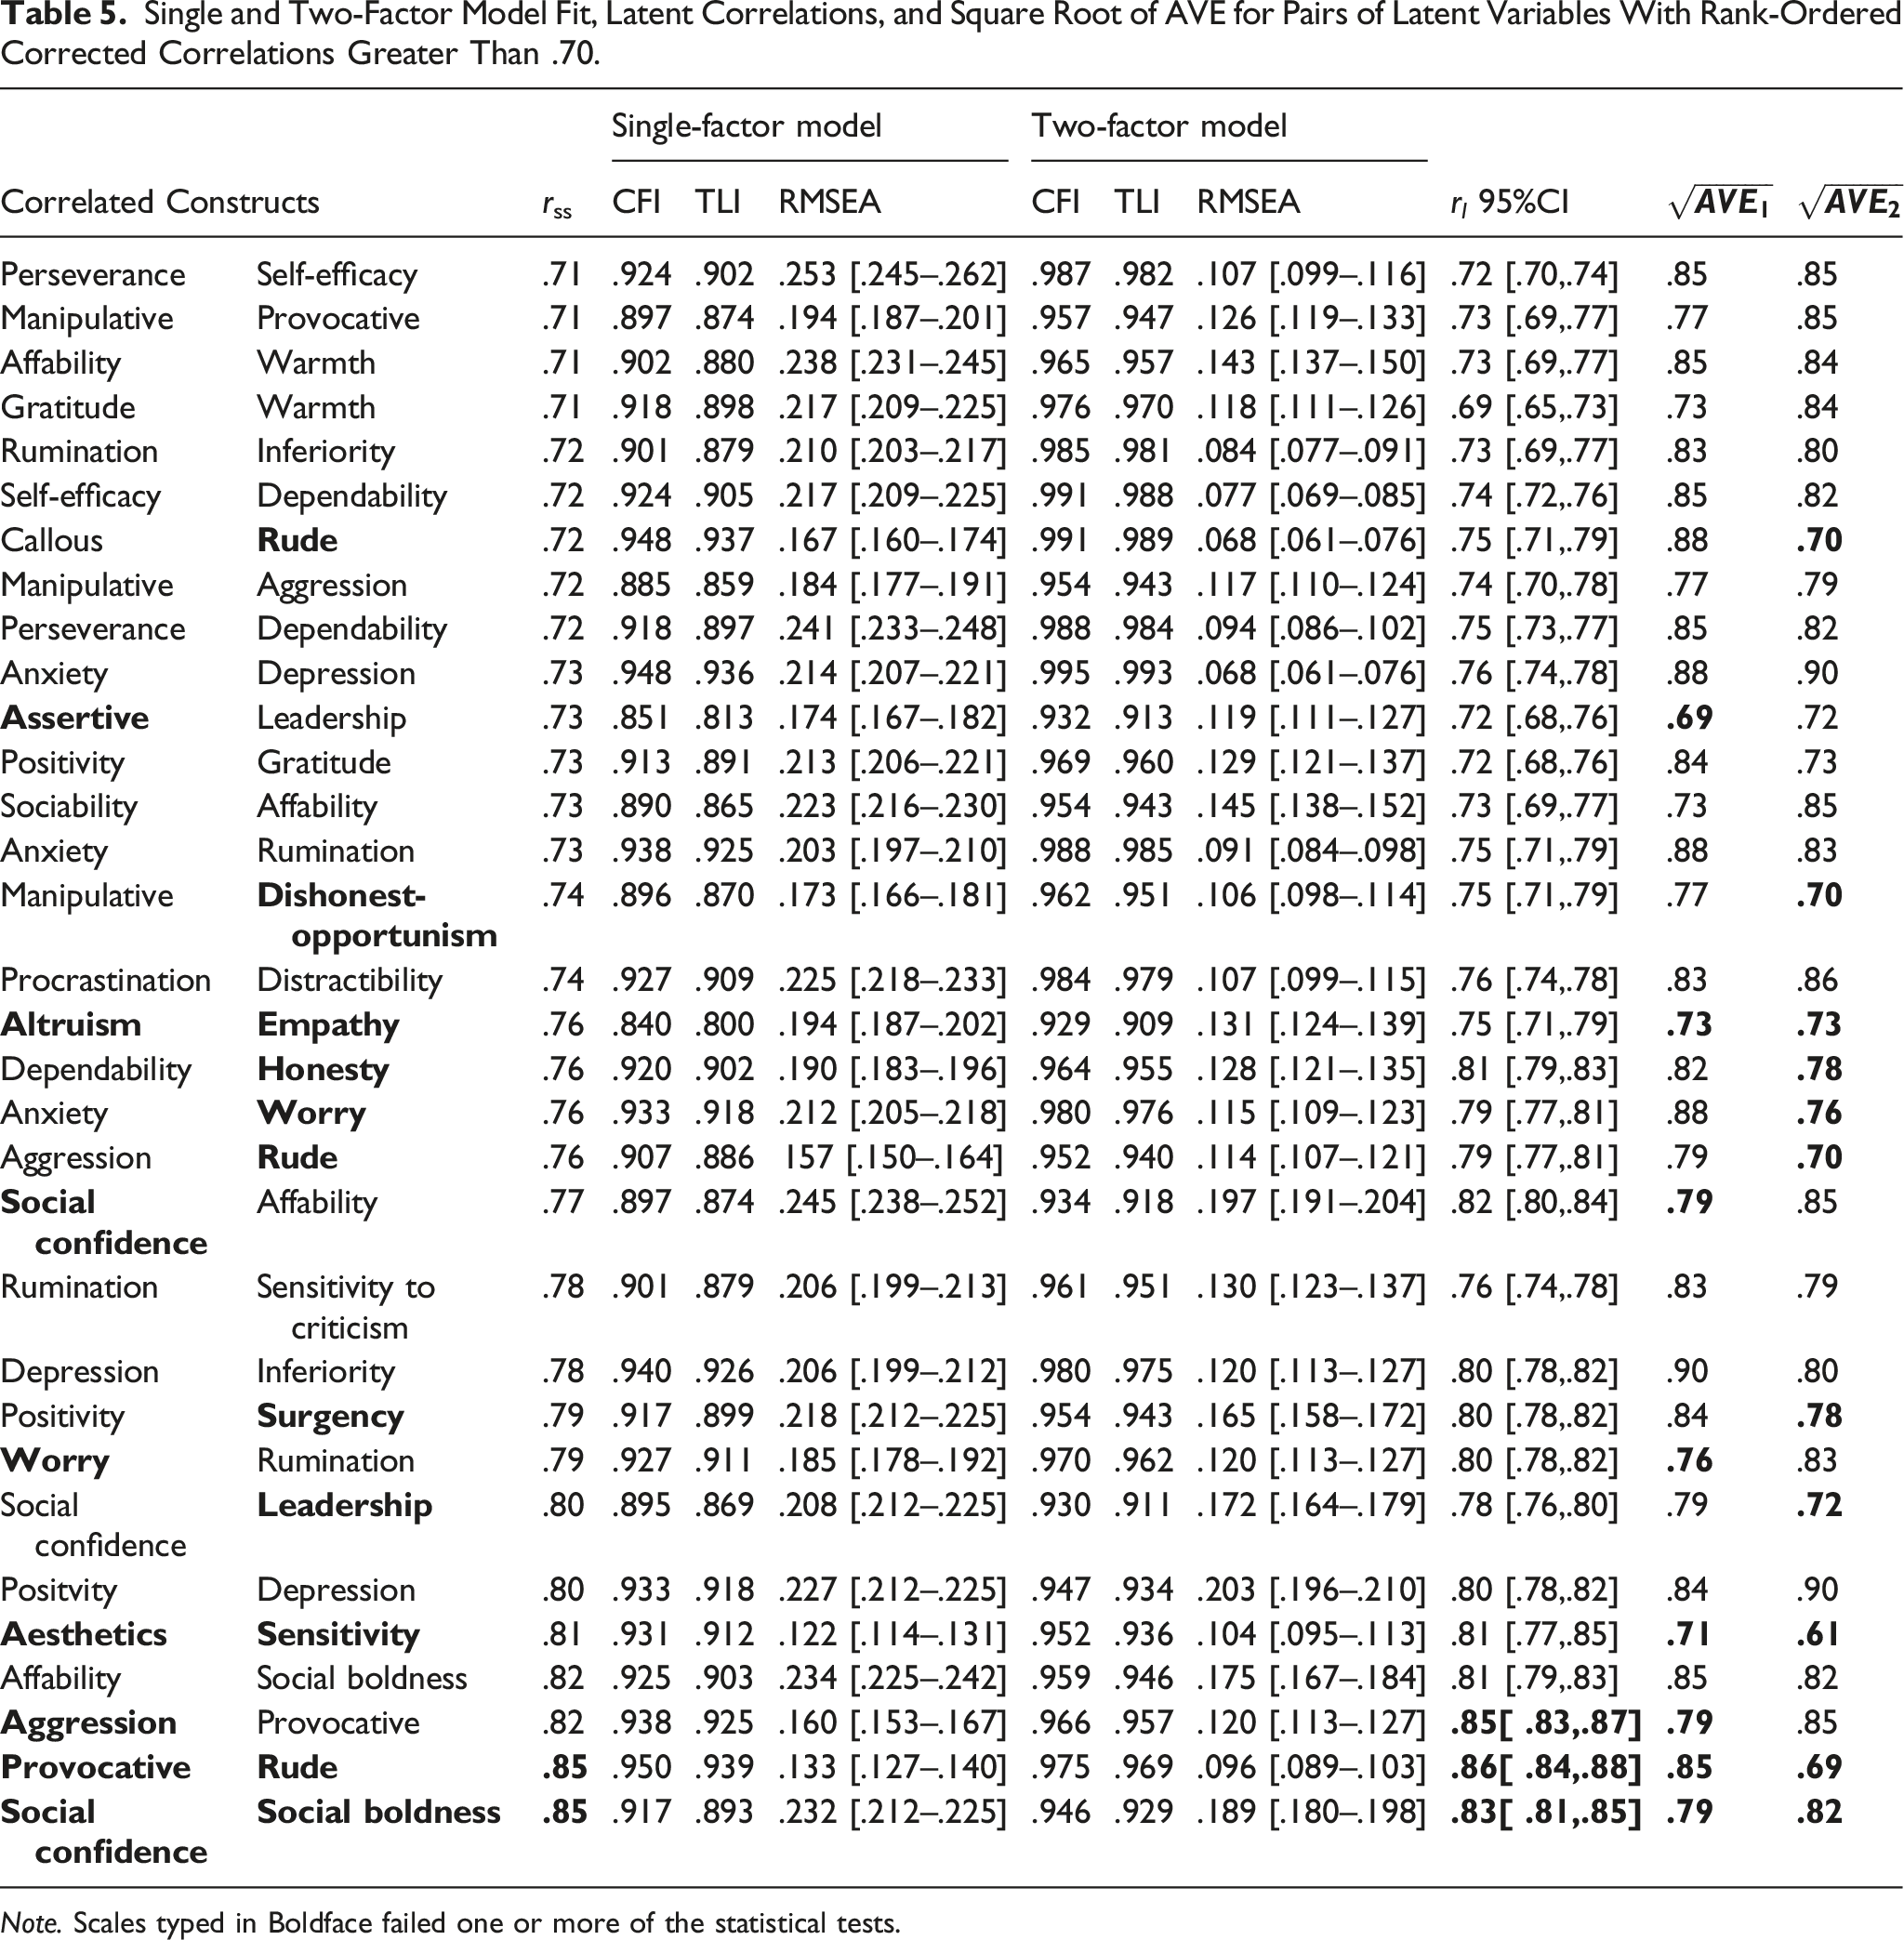
Note. Scales typed in Boldface failed one or more of the statistical tests.
Social boldness and social confidence exhibited the highest dissattenuated correlation of .85, and failed statistical criteria 1, 3, 4, and 5 (Tables 5 and S3.4). There was a clear overlap in item content, which referred to feeling comfortable in social situations. In consequence, we merged these facets into a single scale retaining the label social confidence.
The positivity and surgency items assessed a propensity toward positive affect and cognition; in consequence, these items were collapsed into a single scale labelled positivity. Statistical criteria 2 and 4 and the semantic assessment supported this decision (Tables 5 and S3.4).
The aesthetics and sensitivity items assessed a propensity to appreciate art and nature, so these items were combined into a scale labelled aesthetics. Again, this decision was supported by statistical criteria 2 and 4 (Tables 5 and S3.4).
The case of leadership and assertiveness was more complex. Criterion 4 suggested a problem, yet according to the semantic assessment, the leadership items assessed the ability to give directions and make decisions, whereas the assertiveness items assessed a propensity to express ones point of view in a forceful manner. Although there is a clear distinction between the two, the question arose as to whether leadership was a fundamental personality trait or not. The panel decided that the leadership items assessed an outcome of personality rather than personality per se, with leadership most likely a multidimensional outcome of more fundamental traits. We therefore merged these scales into a single scale of assertiveness, retaining those items regarding forceful expression and removing those regarding the outcome/quality of leadership.
The panel considered the facets of rudeness, aggression, and provocativeness in parallel. All failed statistical criteria 2 and 4 and were highly correlated (Tables 5 and S3.4). Provocativeness and aggression contained item content describing different forms of aggression. The rudeness items were arguably highly culture-specific indicators of passive aggression. Thus, we discarded the rudeness scale and entered provocativeness and aggression into a single-factor CFA, which fit, supporting the idea that the items assessed a single unidimensional facet of aggression. We then produced a final 6-item scale of aggression, which fit a CFA, by choosing the most diverse and high-quality items.
At this point, we conducted a final qualitative review of all scales. This review identified that harm avoidance and risk-aversion were definitionally indistinguishable and shared highly similar item content. However, the two correlated at −.69, just below our .7 threshold, because they were negatively and positively worded measures of the same construct. An amalgamated 6-item scale showed close fit: (CFI = .986, TLI = .977, RMSEA = .121[.105, .139).
Following tests for redundancy, 70 psychometrically robust and discriminant facets remained. Supplementary Table S3.5 includes the item content, factor loadings, and CFA fit of the final 70 facet scales.
Having identified the final set of facets, we tested for scalar invariance across our three data sets (i.e. European, U.S.A, and International samples) using the Millsap and Tein (2004) approach for categorical/ordinal items. Scalar invariance assesses cross-group and cross-source invariance and is a minimum standard for reliable cross-group scale score comparisons (Meredith, 1993; Millsap & Kim, 2018). According to standard model fit cut-offs (i.e. two or more of the CFI, TLI (≥ .95) and SRMR (≤ .08) suggest close fit), all 70 facet scales met the criteria for scalar invariance.
General discussion
The goal of the current research was to make meaningful strides towards the development of a comprehensive taxonomy of personality facets. We believe we have achieved this aim. Through an iterative, multi-stage, multi-method approach, we have developed psychometrically robust, open access, scales that assess 70 essentially unidimensional, non-redundant, personality facets (Table S3.5). This Facet-level Multidimensional Assessment of Personality or Facet MAP, version 1, was developed, by analysing 1772 personality items from many of the major omnibus personality inventories (e.g. NEO-PI-R; HEXACO, 16PF), by a conceptual review of 706 additional scales found within the literature, and a series of psychometric evaluations. The combination of multiple methods applied iteratively enabled us to balance the advantages and disadvantages of individual approaches. The Facet MAP builds upon and synthesises years of extant research concerning the assessment and structure of personality traits, addressing numerous calls for the systematic and empirical development of a more comprehensive list of personality facets (e.g. Condon, 2017; Condon et al., 2020; Goldberg, 1981; Hughes & Batey, 2017; Mõttus et al., 2020; Saucier et al., 2020).
Equivalent Facets From the Facet MAP, NEO-PI-R, and SPI Estimated at the Item-Level to Avoid Jingle-Jangle Issues With Scale Labels.
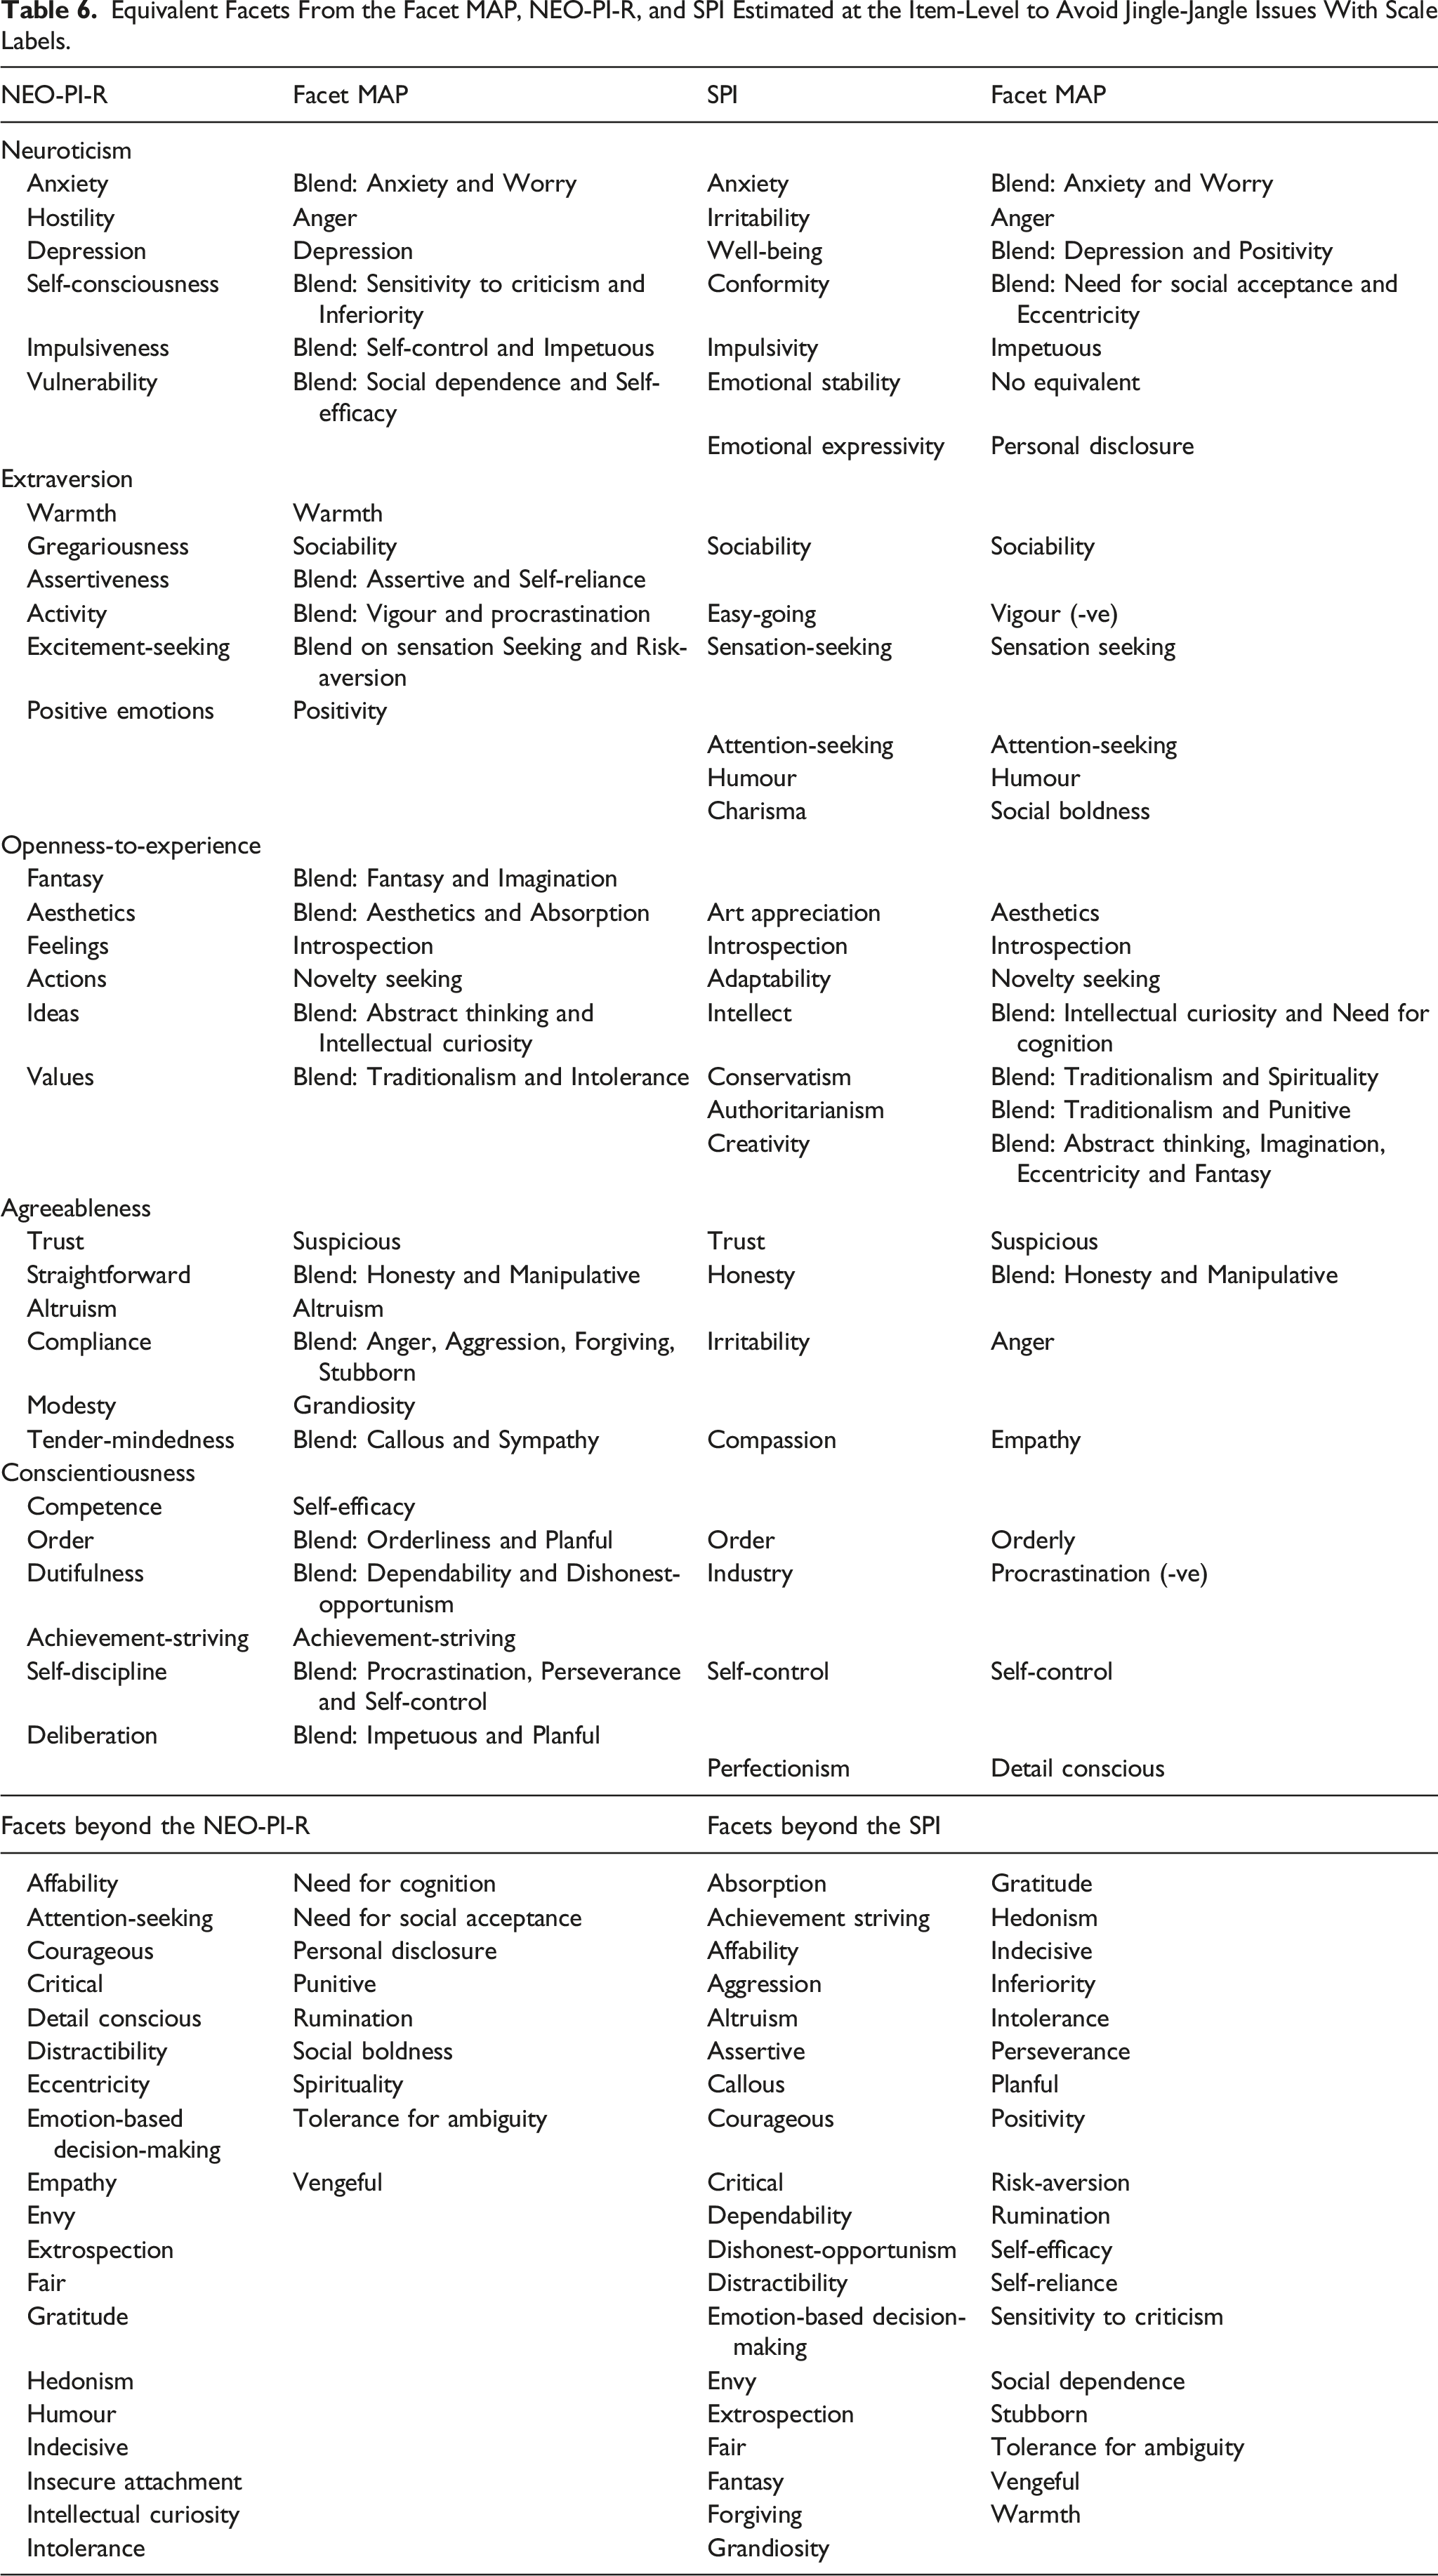
Because the Facet MAP provides the most comprehensive set of unique and unidimensional facets to-date, it should provide a useful reference for future work on personality assessment. For example, any ostensibly novel personality facet developed from this point could include explicit tests of its relationships with all of the conceptually relevant scales within the Facet MAP (see Hughes, 2018; Lawson & Robins, 2021). Anything truly novel can be added to the MAP and anything else can be discarded, reducing construct proliferation (Schwaba et al., 2020). Further, it might be the case that ostensibly novel personality scales/constructs are distinct from any single facet. However, a collection of facets might well explain the variance in such a scale. In such instances, we can begin to distinguish between ‘elemental facets’ and ‘compound constructs’. For example, the ‘dark triad’ variables are ‘compound constructs’ that combine numerous facets contained within the Facet MAP (e.g. Lynam et al., 2011). Decomposing compound constructs into their constituent facets would again prevent construct proliferation, jingle-jangle, and allow for a more coherent science of human personality.
We also see numerous other uses of the Facet MAP. In some regard, most existing personality research could be meaningfully re-estimated with a larger facet list. Notable avenues in this regard include investigations of structural models of personality, cross-cultural patterns, developmental trajectories, and explanatory or predictive equations. In all cases, the more comprehensive facet-level descriptions are likely to lead to novel insights and, based on trends in existing research, greater levels of explanation than we typically see with current models (e.g. Hughes & Batey, 2017; Judge et al., 2013). Over time, using the open access Facet MAP would enable the field to create redundancy-free databases of cumulative knowledge concerning facet-outcome correlations, functionally equivalent to the domain-level correlation databases, largely facilitated by the success of the ‘Big Few’ models (Condon et al., 2020). If the databases were large enough, the standard errors associated with such prediction equations could be very small and aid in the identification of the key facet predictors of outcomes. Conceivably such an approach could facilitate a more systematic accumulation of knowledge in psychological science.
Limitations and future research
All methodologies, statistical models, and conceptual decisions have inherent limitations. Studies relying predominantly on just one methodological approach are highly susceptible to such limitations. Thus, we adopted an iterative, multi-stage, multi-method approach to reduce the effects of any particular methodology. In many cases, this meant combining a range of statistical parameters (e.g. factor loadings, model fit etc.) with conceptual judgements (e.g. definitional review, semantic item review). We see the use of conceptual judgements in combination with rigorous statistical techniques as an overall strength of this work (Lawson & Robins, 2021). Taken together, evidence from one of the largest item-level analyses to-date, the systematic review of the personality assessment literature, and the rigorous empirical investigations of the newly developed scales, represent a meaningful step towards a comprehensive taxonomy of personality facets. Nevertheless, the Facet MAP remains preliminary and much further work is required, including cross-validation using samples that are even more diverse, the use of multiple methods (to counteract single-method biases), and repeated assessments to assess re-test reliability, amongst all of the other useful validation practices (e.g. predictive validity, incremental predictive validity etc., Hughes, 2018). Regarding the work included within this paper, there are also several specific limitations worth considering.
First, it is likely that the Facet MAP misses some important facets. For example, due to the semantic grouping in Study 1, which was necessary to aid optimal factor recovery, facets might not have been identified during EFA because items were unable to coalesce when placed into different groups. However, the systematic search conducted in Study 2 went a long way to addressing this limitation. Specifically, when reviewing 706 facets from the literature, we found surprisingly few additional facets beyond the base list developed in Study 1. Thus, although claims of comprehensiveness are premature, the Facet MAP clearly captures a significant proportion of the extant literature. Nevertheless, we have specific plans to develop the Facet MAP, in at least four ways. One, adopting a ‘crowdsourcing’ methodology. For example, circulating e-mails via psychological societies asking for missing scales. Two, conducting additional systematic searches for novel personality scales produced since Study 3 data collection was completed. Three, it would be useful to examine whether personality nuances (typically operationalised as single items or residualised item variance; Mõttus et al., 2017; 2020; Stewart et al., 2022) can indicate potentially omitted content. McCrae’s (2015) original conception of nuances was that Five-Factor Model facets might be partitioned into smaller units (e.g. ‘bitterness’ and ‘touchiness’ might be different nuances of the ‘angry hostility’ facet, Mõttus et al., 2017). We agree and interpret this argument as evidence for the multidimensionality of many facets within existing inventories. Thus, nuances and the unidimensional facets identified here might well assess similar phenomena, with the two approaches being complementary in mapping narrow personality traits. Four, the SAPA project is now investigating between 6000 and 13,000 personality items. Some of these items will likely be equivalent to those within the Facet MAP and some will form novel scales beyond. Thus, it should be possible to cross validate the Facet MAP and assess the remaining items to identify anything missing from version 1 of the Facet MAP.
Second, we might have duplicated facets within the Facet MAP. The extensive quantitative and qualitative checks for redundancy in Study 1 and Study 3 have gone some way to addressing this potential limitation. However, we have specific plans to assess this further, most notably in the form of criterion associations which help identify the degree to which each facet explains unique variance in important social outcomes.
Finally, although the quantitative portions of Study 1 and Study 3 used larger and more diverse participant samples than are typical in studies of personality structure and scale development (e.g. DeYoung et al., 2007; Rouco et al., 2022; Saucier et al., 2020), they remain modest for the analysis of such large item sets. Thus, it is imperative that larger and more representative samples are collected.
Summary
The three studies presented here describe a programme of research designed to make meaningful strides towards the development of a comprehensive taxonomy of personality facets. Combining large-scale quantitative models and conceptual evaluations, we were able to circumvent many of the issues concerning scale multidimensionality, construct proliferation, and jingle-jangle. The resultant Facet MAP provides definitions and open access, psychometrically robust scales to assess 70 narrow, unidimensional, and non-redundant personality facets. The Facet MAP contains scales equivalent to almost all scales present in major personality inventories, and in most cases, many more as well. We believe that version 1 of the Facet MAP will prove useful in reducing construct proliferation and confusion across the field, as well as facilitating important research regarding personality trait structure, developmental and cross-cultural trends, and explanatory models of life outcomes. Developing taxonomies of personality traits at any level of the hierarchy represents a huge undertaking; the Facet MAP was no different and would not have been possible without decades of previous high-quality research. As the Facet MAP continues to develop, we hope it will eventually represent a comprehensive taxonomy of personality facets.
Supplemental material
Supplemental material - Towards a taxonomy of personality facets
Supplemental material for Towards a taxonomy of personality facets by Paul Irwing, David J Hughes, Alexander Tokarev, and Tom Booth in European Journal of Personality.
Footnotes
Author’s note
Declaration of conflicting interests
The author(s) declared no potential conflicts of interest with respect to the research, authorship, and/or publication of this article.
Funding
The author(s) disclosed receipt of the following financial support for the research, authorship, and/or publication of this article: This work was supported by the An Economic and Social Research Council, Doctoral Training Grant grant (circa, £60,000) supported the completion of Study 1. An Alliance Manchester Business School Research Support Fund grant of £5000 facilitated data collection for Study 3. No other funding from agencies in the public, commercial, or not-for-profit sectors was received.
Supplemental material
Supplemental material for this article is available online.
References
Supplementary Material
Please find the following supplemental material available below.
For Open Access articles published under a Creative Commons License, all supplemental material carries the same license as the article it is associated with.
For non-Open Access articles published, all supplemental material carries a non-exclusive license, and permission requests for re-use of supplemental material or any part of supplemental material shall be sent directly to the copyright owner as specified in the copyright notice associated with the article.