
Abstract
This meta-analysis of cross-sectional data aimed to shed light on the often assumed peak in mean-level of borderline personality features during middle to late adolescence (i.e. age 17–22). Borderline personality features were operationalized through the Structured Clinical Interview for DSM-IV Axis II Personality Disorders (SCID-II). Search terms were entered into PsycINFO and Scopus. A total of 168 samples were included in the analyses, comprising 25,053 participants. Mean age ranged from 14.35 to 51.47 years (M = 29.01, SD = 8.52) and mean number of borderline personality features from 0 to 8.10 (M = 4.59, SD = 2.34). The hypothesized peak between age 17 and 22 was not substantiated by the confirmatory ANOVA analysis. However, subsequent exploratory GAM analysis provided evidence for a peak at 29.4 years. Caution is needed in interpreting these findings given that different trends appeared when GAM models were constructed separately for community, patient and borderline personality disorder (BPD) samples. Age differences in community samples indicated a significant linear decline in mean-level of borderline personality features over time. A linear rising trend was found in BPD samples. As a between-person mean-level approach was used in the current study, future longitudinal studies are needed to substantiate if between-person age difference generalize to within-person changes.
Keywords
Borderline personality disorder is suggested to be at the heart of the personality pathology spectrum, loading high on a general severity factor that is common to all personality disorders (Sharp et al., 2015; Wright et al., 2016). Its features comprise fear of abandonment, unstable relationships, shifting self-image, impulsive behaviour, self-harm and/or suicidal behaviour, mood swings, chronic feelings of emptiness, explosive anger and feeling suspicious or out of touch with reality when under stress (American Psychiatric Association, 2013). The presence of borderline personality features is thought to vary across the lifespan, with age differences due to contextual and developmental factors (Videler et al., 2019; Winsper, 2020). Adolescence is considered to be the period wherein the features first manifest (Chanen & Thompson, 2019; Sharp et al., 2018; Solmi et al., 2021). The emergence of borderline personality features during this time puts an adolescent at high risk for long-term impairments in their social, educational and work life (Kongerslev et al., 2015; Winsper et al., 2015; Sharp et al., 2018). Middle to late adolescence is assumed to be the peak period of these features in the population, whereafter a decline is thought to set in, with rates eventually stabilizing in adulthood (Hutsebaut et al., 2019; Sharp et al., 2018). Such a peak may hint at a connection between borderline personality features and parallel developmental processes during that time. However, a thorough empirical substantiation of the presumed peak in borderline personality features is still lacking (Kongerslev et al., 2015; Winsper, 2020).
The current meta-analysis focused on mean-levels of borderline personality features at different ages to test whether a peak during middle to late adolescence indeed occurs. The demonstration of such a peak could substantiate and boost early detection and intervention in young people with borderline personality features, which in turn may prevent long-lasting adverse outcomes (Bozzatello et al., 2019; Gunderson et al. 2011).
Borderline personality features during adolescence
At first glance, borderline personality features might seem exaggerations of normative adolescent behaviour, like emotional instability, identity fluctuation, anger outbursts and interpersonal quarrel. Yet, research has shown these features to be distinguishable from normative adolescent behaviour (Miller et al., 2008). Self-harm, suicidal behaviour and impulsive behaviour (e.g. substance misuse) are the most frequently met borderline personality features among adolescents (Hutsebaut et al., 2019; Kaess et al., 2014; Nakar et al., 2016). The presence of these features correlates with heightened rates of suicide attempts and risk-taking behaviour during adolescence and even an elevated risk of premature death by, among other things, chronic substance use or cardiovascular disease (Kaess et al., 2017; Muehlenkamp et al., 2011; Temes et al., 2019). Additionally, they place adolescents at risk of adverse psychosocial and professional outcomes and lower life satisfaction (Wertz et al., 2020; Winograd et al., 2008; Winsper et al., 2015). These findings emphasize the necessity for a swift identification of and intervention for young people with borderline personality features.
The DSM-classification-system has thus far adopted a categorical approach to borderline personality disorder (American Psychiatric Association, 2013), even though more recent research has substantiated the need to abandon the arbitrary threshold for recognition of the disorder (i.e. five out of nine features; Hopwood et al., 2018). Studies have shown a subthreshold number of borderline personality features to be already associated with profound decreases in quality of life, psychopathological distress, and an increase in suicide attempts and comorbidity (Kaess et al., 2017; Zimmerman et al., 2011). Hence, the field has been advocating for a shift towards a dimensional approach, encompassing more elaborate and developmentally sensitive descriptions of psychopathology (Hopwood et al., 2018). This shift might also lessen clinicians’ hesitation to diagnose early borderline personality pathology (Sisti et al., 2016). Moving forward, the challenge will be to capitalize on insights from the decades of research based on the categorical system, which is focused on maladaptive features, and integrate these with more dimensional, normative models on personality traits, like the Big Five (Hopwood et al., 2018; Gunderson et al., 2018; Widiger & McCabe, 2018). A combination of findings from both traditions can enhance the understanding of the relation between adaptive and maladaptive traits, and identify early warning signs of pathological development. The current study takes a dimensional approach to the categorical model by omitting the borderline personality disorder threshold and instead focuses on the number of features present.
Over the past two decades, researchers have attempted to clarify the mean-level presence of borderline personality features among adolescents via longitudinal studies. For example, the Children in the Community study (Cohen et al., 2005) found the highest level of borderline personality features during early adolescence and saw a decline thereafter (Johnson et al., 2000). This downward trend seems to be in line with two other studies, one showing a decline in level of borderline personality features between the age of 14 and 24 (Bornovalova et al., 2009), and the other finding a decrease between 18 and 22 years (Lenzenweger & Castro, 2005). The empirical findings have since been interpreted as evidence for a peak in mean-level of borderline personality features in middle to late adolescence and a decline into adulthood (Sharp et al., 2018; Videler et al., 2019; Winsper, 2020). However, some limitations should be noted when interpreting these findings as empirical substantiations of a peak.
First of all, as adolescence is characterized by rapid and extensive changes in physiology, cognition, relationships and identity (Elder & Shanahan, 2007), mean-level of borderline personality features might fluctuate considerably during this period due to this developmental density. The number of longitudinal studies comprising the period of adolescence is currently too limited to capture such fluctuations (Kongerslev et al., 2015). Secondly, findings tend to vary between studies, which might be due to methodological differences, like the use of different measures and specific sample characteristics. Chanen and colleagues (2004), for example, showed moderate stability in borderline personality features over the course of 2 years in a patient sample of 15–18 year olds, which diverges from the linear decline found in community samples (Bornovalova et al., 2009; Johnson et al., 2000; Lenzenweger & Castro, 2005). Furthermore, most longitudinal studies on the presence of borderline personality features either stop around young adulthood or start from this period. Without a systematic comparison between the mean-level observed in adolescents and adults, there is no telling if there is indeed a peak in middle to late adolescence, or whether it might be followed by another spike later in adulthood. A final limitation is the variety in definitions of ‘adolescence’ (Sawyer et al., 2018). Age definitions of this period and its phases have been debated and are subject to culture, context and scientific advancements (Sawyer et al., 2018). Specification of the exact age of a sample should therefore be the basis for comparisons, instead of an arbitrary label.
Taken together, studies have suggested a peak in the mean-level of borderline personality features during middle to late adolescence. However, the number of longitudinal studies substantiating this peak is still relatively small and comparison has clear limitations. A possible way forward would be to examine available cross-sectional data of different age groups (i.e. between-person mean-levels). Solmi and colleagues (2021) recently conducted such a meta-analysis based on cross-sectional data to examine the peak age of onset of a range of mental disorders. For personality disorders, they found a peak at 20.5 years. However, Solmi and colleagues included only six studies that focused on all types of full-blown personality disorders (i.e. categorical approach). Hence, a nuanced dimensional picture of borderline personality features is still lacking.
In addition to an empirical approach, findings on normative personality development during adolescence, such as mean-level changes in the Big Five traits and developmental tasks at hand, might inform the hypothesis on the timing of a peak of borderline personality features. Hence, important insights into normative development during adolescence will now be reviewed.
Age differences in borderline personality features: indications from normative development
The Big Five personality model is the most widely known and studied taxonomy of normal-range personality traits (Novikova, 2013). The Big Five traits are extraversion, agreeableness, conscientiousness, neuroticism (inverse: emotional instability) and openness to experience. Studies have found a normative linear increase towards greater maturity on these traits across the lifespan, with individuals becoming more agreeable, conscientious and emotionally stable over time (Brandes et al., 2020; Caspi & Shiner, 2007; Roberts & Mroczek, 2008; Roberts et al., 2006; Van Dijk et al., 2020). However, during adolescence there seems to be a deviation from this linear trend towards maturity (Bleidorn et al., 2022; Borghuis et al., 2017; Luan et al., 2017). More specifically, the levels of conscientiousness, openness and emotional stability have been found to decrease during early adolescence and increase again from late adolescence onwards (Denissen et al., 2013; Soto et al., 2011). Further research is needed to examine facet-level nuances herein (Soto et al., 2011), investigate observed differences between ratings by parents and adolescents (Luan et al., 2017), and explore sex differences (Borghuis et al., 2017).
Borderline personality features are likely to be at least partly connected to the normative development of Big Five traits (Hopwood et al., 2021; Shiner, 2009; Widiger & McCabe, 2018). In their meta-analysis, Samuel and Widiger (2008) found correlations between borderline personality features and levels of neuroticism (.54), agreeableness (-.24) and conscientiousness (-.29). However, the nature of the association between the Big Five traits and borderline personality features has been a subject of debate (Hopwood et al., 2010; Saulsman & Page, 2004). There are conceptualisations wherein the traits and features are viewed as being on a continuum, with borderline personality features representing extreme scores of Big Five traits (e.g. high neuroticism and low agreeableness and conscientiousness; Saulsman & Page, 2004; Widiger & McCabe, 2018). Whilst others conceptualize the two in a dynamic recursive model, with certain Big Five trait levels making an individual susceptible to develop borderline personality features in the context of stressors, and the manifestation of these features subsequently impacting Big Five trait levels (Hopwood et al., 2010). The verdict on the type of association is still out, but it seems clear that there is both overlap and distinctiveness between the two (Hopwood et al., 2021). The timing of the maturity dip in Big Five traits during adolescence might therefore inform the hypothesis of the peak of borderline personality features. This prediction is further bolstered by considering coinciding developmental processes during this age period, which will be reviewed next.
During adolescence, young people are faced with a multitude of developmental tasks, like the completion of education, transition to work settings, integration in new social networks and the management of peer influence (Andrews et al., 2021; Shiner, 2009). They also need to find a new balance between dependency and autonomy in the relationships with authority figures, as well as try to meet growing expectations whilst their regulatory abilities to do so are still developing (Denissen et al., 2013). Meanwhile, complex changes occurring in the adolescent brain influence their behaviour (Arain et al., 2013; Crone & Fuligni, 2020). Neurotransmitter changes, like decreasing levels of dopamine and serotonin, make an adolescent susceptible to emotion regulation difficulties and decreased impulse control, respectively (Arain et al., 2013). In addition, rewiring of the prefrontal cortex circuities leaves adolescents challenged in their ability to solve problems and process complex information. These neuronal processes make adolescents more likely to display impulsive behaviours, like reckless driving, unprotected sexual contacts and drug use (Arain et al., 2013). During middle adolescence, risk-provoking situations present themselves more frequently as adolescents explore their sexuality, rebel against their parents and experiment with alcohol and drugs. Adolescents are also faced with the task of forming their identity (Koepke & Denissen, 2012; McAdams & Olson, 2010), and while most succeed in achieving a stable self-concept during this period, some adolescents find themselves in an identity crisis (Andrews et al., 2021).
Borderline personality features represent disturbances in the processes at hand during adolescence, like the management of impulsive risk-taking behaviour, interpersonal relationships, identity formation and goal-directed emotion regulation (Elder & Shanahan, 2007; McAdams & Olson, 2010). Adolescents struggling with these features are known to fall behind on the attainment of developmental tasks, such as educational completion, which is related to enduring vocational dysfunction (Juurlink et al., 2022; Shiner, 2009; Winograd et al., 2008). As there is a positive feedback loop between the attainment of developmental tasks and the subsequent maturity of Big Five trait levels, adolescents struggling with borderline personality features might miss out on this loop (Hutteman et al., 2014; McAdams & Olson, 2010; Neyer & Lehnart, 2007). Instead, considering the compressed time wherein adolescents search for their identity, morals and future plans (Koepke & Denissen, 2012; McAdams & Olson, 2010), a negative feedback loop may unfold and accelerate when they fail to achieve the tasks at hand. The consequences hereof might be hard to reverse later on, as individuals may stop striving for a better outcome, and instead lower their ambitions to fit a better pay off between their efforts and experienced struggles (McAdams & Olson, 2010). Adolescents with borderline personality features might thus eventually disengage from unfulfilled developmental tasks and goals, and settle for a psychosocial situation that is less fulfilling or below their potential, for example by limiting their social life or finding a job below their level of education (Videler et al., 2019). A less demanding psychosocial context, as well as the unfolding neurobiological maturation, might have a fading effect on borderline personality features as time progresses (Chanen & Thompson, 2019; Videler et al., 2019). However, negative occupational and social consequences might endure, as these adolescents are at high risk of long-term psychosocial problems (Winsper et al., 2015). In addition, life satisfaction has been shown to remain low for individuals that struggled with borderline personality features during their adolescent years (Wertz et al., 2020; Winograd et al., 2008; Winsper et al., 2015).
Taken together, middle to late adolescence is a time of accumulating psychological, social and biological changes, as well as developmental tasks and challenges (Andrews et al., 2021; Shiner, 2009). Borderline personality features reflect disruptions in the processes at hand during this time, and the mean-level of these features may therefore increase. Adolescents struggling with these features are known to fall behind on the attainment of developmental tasks (Shiner, 2009; Winograd et al., 2008), and they might eventually stop trying to achieve set goals. Disengagement from unfulfilled developmental tasks might as the time progresses lessen the confrontation with stressful situations, even though it does not improve actual functioning. Combined with the progressive normative neurobiological maturation (Arain et al., 2013), these individuals may then be able to regulate their circumstances better. Subsequently, a drop in borderline personality features is expected to occur in late adolescence, with levels stabilizing into adulthood.
Current study
Disruptions in the developmental processes at hand during middle to late adolescence might be reflected in borderline personality features, such as unstable relationships, a shifting self-image and impulsive behaviour. This period comprises various important psychological, social and neurobiological changes and follows right after the suggested maturity dip in the Big Five personality traits. Hence, we expected a rise in mean-level of borderline personality features during middle to late adolescence. After this, neurobiological maturation and adjustment of goals were hypothesized to take place. Subsequently, we expected a decrease followed by a stabilisation of the mean-level of borderline personality features during late adolescence and adulthood.
This meta-analysis tested the hypothesized age differences in borderline personality features by examining cross-sectional data on the mean number of border personality features at a given age (i.e. between-person mean-level approach). In order to test the specified phases of adolescence, the period was defined in line with Sawyer and colleagues (2018) as ranging from age 10 to 25, and three phases were specified: early adolescence (age 10–14), middle adolescence (age 15–19) and late adolescence (age 20–24). The peak in middle to late adolescence was operationalised as age 17 to 22, to allow time for a rise and decline in rates before and after the peak. To be included, studies needed to measure borderline personality features with the Structured Clinical Interview for DSM-IV Axis II Personality Disorders, Borderline Personality Disorder section (SCID-II BPD section; First et al., 1997). Statistical testing was conducted via a two-step approach, consisting of confirmative hypothesis testing followed by an explorative data-driven analysis. Subsequently, possible variance in age differences dependent on the context of participants (e.g. community or patients), geographical area and sex were examined.
Methods
Operationalization of borderline features
The Structured Clinical Interview for DSM-IV Axis II Personality Disorders, Borderline Personality Disorder section (SCID-II BPD section; First et al., 1997) was selected as measure of borderline personality features. Of the semi-structured interviews available to assess borderline personality features, the SCID-II is the most widely used and has the broadest foundation in research (Carcone et al., 2015). The validity of the SCID-II for use in both adults and adolescents has been found to be adequate (Carcone et al., 2015; Salbach-Andrae et al., 2008). A systematic review on the SCID-II BPD section (Carcone et al., 2015) reported high interrater reliability for the categorical scoring (mean Cohen’s Kappa = 0.84), as well as good internal consistency (Cronbach’s alpha = 0.74), moderate convergent validity (Spearman’s correlations ranging from 0.37 to 0.69) and satisfactory discriminant validity (Spearman’s correlations ≤0.23 with Cluster A and C personality disorders). Although the original SCID-II BPD section was based on the DSM-III-R, the instrument was changed in terms of wording and number of borderline personality features with the arrival of DSM-IV (American Psychiatric Association, 1994). As the operationalization of borderline personality disorder (BPD) remained stable in the DSM-IV, DSM-IV-R and DSM-5, SCID-II versions based on these editions were deemed comparable and therefore included.
Literature search strategy
PsycINFO and Scopus were searched on the 5th of October 2020 for empirical papers reporting on borderline personality features as measured by the SCID-II. The minimum year of publication was restricted to 1994 to match the year in which the DSM-IV was published. The following search string was entered into the databases: (borderline personality disorder/) OR (borderline personality* OR BPD OR borderline pathology OR borderline symptomatology) AND (SCID-II OR Structured-Clinical-Interview-for-DSM-IV-Axis-II-Personality-Disorders OR SCID-5-PD OR Structured-Clinical-Interview-for-DSM-5-Personality-Disorders OR Structured-Clinical-Interview-for-DSM-IV-Axis-II-Disorders). The search terms related to borderline personality features were set to occur in either the title, abstract, or as a keyword in the paper. The SCID-II search terms were set to ‘all fields’, as the reference to an instrument can occur in various sections of a paper. In PsycINFO, the search could be limited to empirical papers by adding ‘empirical study.md’. In Scopus, the non-empirical papers needed to be removed by hand. Besides the database search, reference lists of the following key meta-analyses and reviews were cross-checked in an effort to identify any missed papers: Álvarez-Tomas et al. (2019), Ellison et al., (2018), Guilé et al. (2018), Meaney et al. (2016), Paris (2010), Sharp & Romero (2007), Videler et al. (2019), Winsper et al. (2020), and Winsper et al. (2016).
Inclusion and exclusion criteria
We included peer-reviewed English papers reporting the minimum required data for our study: SCID-II BPD data (i.e. the mean number of features met within a sample, or an alternative score with information to convert this score into the mean number of features), mean age (or derivable from individual data reported) and sample size. No restrictions were placed on age of the sample or study type (i.e. randomized controlled, observational, cohort, longitudinal and case studies were all eligible for inclusion). Exclusion criteria entailed review papers (i.e. meta-analyses, reviews, study protocols, book chapters), SCID-II versions based on DSM-versions prior to the DSM-IV or no specification of the DSM-version, no usage or report of the SCID-II BPD section, or incomplete SCID-II BPD data (i.e. not including the mean number of features or convertible score information). For longitudinal studies and randomized controlled trials, SCID-II data from the first measurement point containing the current study’s variables were included. When the same sample was reported on in multiple papers (with the minimum required data provided), data from that sample were included only once, using in consecutive order, the paper with the largest sample size, most information on the covariates, or earliest publication date.
Data screening and extraction
Search results from PsycINFO and Scopus were entered into the reference management system EndNote. Duplicates were removed during screening. After exclusion based on the title and abstract screening, the remaining papers full texts were inspected. Papers deemed eligible for inclusion were coded via a detailed coding manual. The primary variables were the SCID-II BPD data and the mean age of a sample. Other coded variables were sample size, sample characteristics (e.g. sex distribution, community vs. patient) and study characteristics (e.g. SCID-II format, country of origin of the sample). All papers were coded by the first author. A research assistant double coded 20 papers. The percentage of agreement between coders was 94.9%. Disagreement between the coders was resolved by jointly examining and discussing the paper. An overview of included papers is available on the Open Science Framework project page.
Open science statements
The study protocol and hypotheses were preregistered on the Open Science Framework project page. The original preregistration was done via the As Predicted template. As the manuscript was subsequently submitted as a Registered Report and received in-principle-acceptance, the preregistration was later updated with the compatible template.
A pilot search was conducted to estimate the scope and feasibility of the study. This search yielded around 1500 papers from the databases, of which approximately 200 were estimated to meet the inclusion criteria. Concerning feasibility in light of the scope of the study and deadline of the journal's special issue, the database search, screening and coding had to be conducted parallel to (the review of) Stage 1 of the Registered Report process. Hence, countermeasures aimed at eliminating potential bias were taken, such as external revision of the coding manual before the completion of Stage 1 and double coding. The PRISMA Statement was consulted to ensure high quality of reporting (Page et al., 2021).
The data, detailed descriptions of procedures applied in this study and analysis scripts needed to reproduce the results are open and accessible on the Open Science Framework project page. In addtion, the peer reviewer's comments and responses by the authors are made publicly available.
Statistical analyses
Analyses were run in R 4.0.3 (R Core Team, 2020). Our main independent variable was the mean age of a sample. Our main dependent variable was the mean number of borderline personality features within a sample as measured by the SCID-II BPD section. A p-value for significance of p < .001 was chosen throughout all analyses to correct for multiple testing.
A cut-off value on age-variability (i.e. standard deviation) within a sample was considered. On the one hand, an extremely wide age-variability within a sample might reduce informativeness, as it less adequately represents the mean number of borderline personality features at the mean sample age (e.g. when the mean age is 40 but ranges between 20 and 60). On the other hand, an overly strict limit on age-variability can potentially exclude a large number of samples, which might significantly decrease the statistical power of the meta-analysis. Moreover, such exclusion could lead to a biased outcome, as samples with more age-variability might also differ on other study or sample characteristics. Hence, a compromise in the form of a stepped-approach was chosen to include enough samples and take sample homogeneity with regard to age into account. First, the main analyses were conducted based on all samples (i.e. no limit on age-variability). Subsequently, in line with previous meta-analyses (Orth et al., 2018), a cut-off value of SD < 5 years for age was applied, and the main analyses were repeated exclusively with samples falling below this cut-off (i.e. limited age-variability samples). Results from both analyses were then compared. In case the results differed, results based on the limited age-variability samples were considered most reliable as the mean age in these samples entails a more adequate representation. However, the number of samples falling below the age-variability cut-off value could be limited and thereby cause a power issue. When a power issue regarding the limited age-variability analyses was considered to be likely, significant results based on all samples were conceptualized as a trend in case they were not matched by findings from limited age-variability samples.
Descriptive analyses were conducted, including visualisation of the main variables using the ggplot2 package (v3.3.5; Wickham, 2016). Subsequently, the data were analysed via a two-step approach. First, confirmative testing was conducted to evaluate the hypothesis of a peak in borderline personality features between age 17 and 22. An ANOVA was applied, wherein pre-peak (11–16 years), peak (17–22 years) and post-peak (23–28 years) categories were specified. This analysis was conducted solely on samples with a mean age falling within one of these three age categories. Samples were assigned to one of the categories in case their mean age fell within the specified range. The ANOVA tested the differences between the categories in mean number of borderline personality features weighted by sample size (i.e. more weight was assigned to larger samples, which have smaller standard errors and are therefore more reliable).
Secondly, explorative Generalized Additive Modelling (GAM; McKeown & Sneddon, 2014) was used to detect nuanced patterns of age differences in mean number of borderline personality features. GAM allows for the exploration of linear and non-linear patterns in the data and can be conducted using the mgcv package (v1.8.35; Wood, 2017). All samples were included in the GAM and weighting based on sample size was incorporated. The Restricted Maximum Likelihood (REML) method was chosen to control for over- and underfitting. The mgcv package provides the best fitting GAM model based on the smoothing parameter and lambda value and tests for significance of the explanatory relation between the smoothed variable (i.e. mean number of borderline personality features) and the predictor (i.e. mean age). The output provides an effective degrees of freedom (edf), which reflects the degree of non-linearity of the curve. Edf equal to 1 is equivalent to a linear relationship, while values > 1 indicate a progressively stronger non-linear effect (Zuur et al., 2009). The GAM model was visualised using the ggplot2 package (v3.3.5; Wickham, 2016). Given the expected association between the context of participants and the model shape, separate GAM models were constructed for (1) community, (2) patient and (3) BPD samples. Patient samples were defined as participants with various mental disorders and meeting between 0 and 9 borderline personality features, while BPD samples were defined as patients meeting the clinical cut-off for borderline personality features or, in case not specified, being referred to a BPD treatment programme.
In case of a significant GAM model (i.e. p < .001), secondary contrast analyses were planned to test if the appearing model was similar for the specified contrasting variables. These analyses comprised integrating the contrasting variable into the GAM model as a dichotomous categorical variable. This way, the impact of both categories on the constructed GAM model could be tested (i.e. GAM does not allow the inclusion of interactions within the model). In case the variable had a significant impact, separate GAM models for the dichotomous categories were constructed to be able to make a qualitative visual comparison of model shapes. The following variables were a priori selected for contrast analyses in case coding yielded sufficient data: (1) US versus non-US samples, as we expected an overrepresentation of US samples, (2) SCID-II assessment format (i.e. self-report questionnaire vs. semi-structured interview) and (3) sex (i.e. male vs. female). To be able to conduct the contrast analysis of sex, a sample was coded male or female in case it comprised ≥ 66.67% of the respective sex, other distributions were coded as mixed sex.
Lastly, possible birth cohort effects were examined in case of a significant ANOVA result via the multiphase method described by Keyes and Li (2010). The birth cohort of a sample was calculated by subtracting the sample mean age from the year of data collection. In case the year of data collection was not specified it was assumed to be 2 years before publication, which is a common procedure in meta-analyses (Liu & Xin, 2015; Twenge & Nolen-Hoeksema, 2002).
Publication bias is a common problem in meta-analyses focussing on the effectiveness of interventions. As the current study’s focus was on descriptive data, publication biased was deemed unlikely. The mean number of borderline personality features is often merely reported as a ‘by-product’, which is rarely tested for statistical significance. Therefore, it seems implausible that the included papers would be systematically unrepresentative of the population of all conducted studies. Still, possible bias was checked by calculating the Fail-Safe N statistic formulated by Orwin (1983), which provides an indication of the robustness of significant findings in a study. Fail-Safe N estimates the minimum number of papers with negative results (i.e. finding of 0) that would need to be added to the analysis to change the significant result to non-significant. Although the validity of Fail-Safe N is questioned (Rothstein, 2008), it is regularly used in the field (e.g. Bschor et al., 2018; Byrne & Coetzer, 2016; McClain et al., 2021). It also provides a solution for the current study, wherein more traditional publication bias procedures were not possible due to the focus on descriptive data as opposed to effect sizes (e.g. correlation coefficients). As Orwin (1983) does not provide a cut-off for the appearing value, the outcome will be interpreted qualitatively by contrasting it with the number of papers that were included in the analyses.
Deviations from the planned statistical analyses
A proposed statistical plan was defined in Stage 1 of the Registered Report process. Some minor deviations occurred from this proposition. First of all, we mistakenly mentioned the use of a ‘multilevel regression analysis’ in some sections. Instead, an ANOVA was planned and conducted, which is correctly described in this final manuscript. Secondly, the influence of context of participants was originally planned to be tested in a secondary contrast analysis. However, we realized that, given the expected importance of this variable, separate GAM models for each context should be constructed to provide the necessary insight. Hence, instead of using a contrast analysis, context of participants was tested as such by comparing separate GAM models. Furthermore, the contrast analysis method described by Haans (2018) in Stage 1 turned out to be incompatible with GAM. Therefore, the alternative procedure as described in the statistical analyses was used. Also, after coding, the amount of data on the SCID-II assessment format appeared to be insufficient. This variable could therefore not be included in a contrast analysis. Lastly, the birth cohort data appeared incompatible with the planned birth cohort analysis, which could therefore not be conducted. Further details on the SCID-II assessment format and birth cohort data are described under secondary analyses in the Results section.
Results
Selection and inclusion
Figure 1 illustrates the search results, selection process and flow of in- and exclusion of papers. Our database search yielded 1996 unique papers. In addition, cross-checking of the reference lists of the specified key meta-analyses and reviews generated another 677 papers. After screening, 255 papers were deemed eligible for coding. During coding, 30 papers were excluded because of undetected exclusion criteria during screening. An additional 41 papers were excluded because of multiple reports on the same sample. Ultimately, 184 unique papers were coded. PRISMA flow-chart of paper inclusion (based on Page et al., 2021).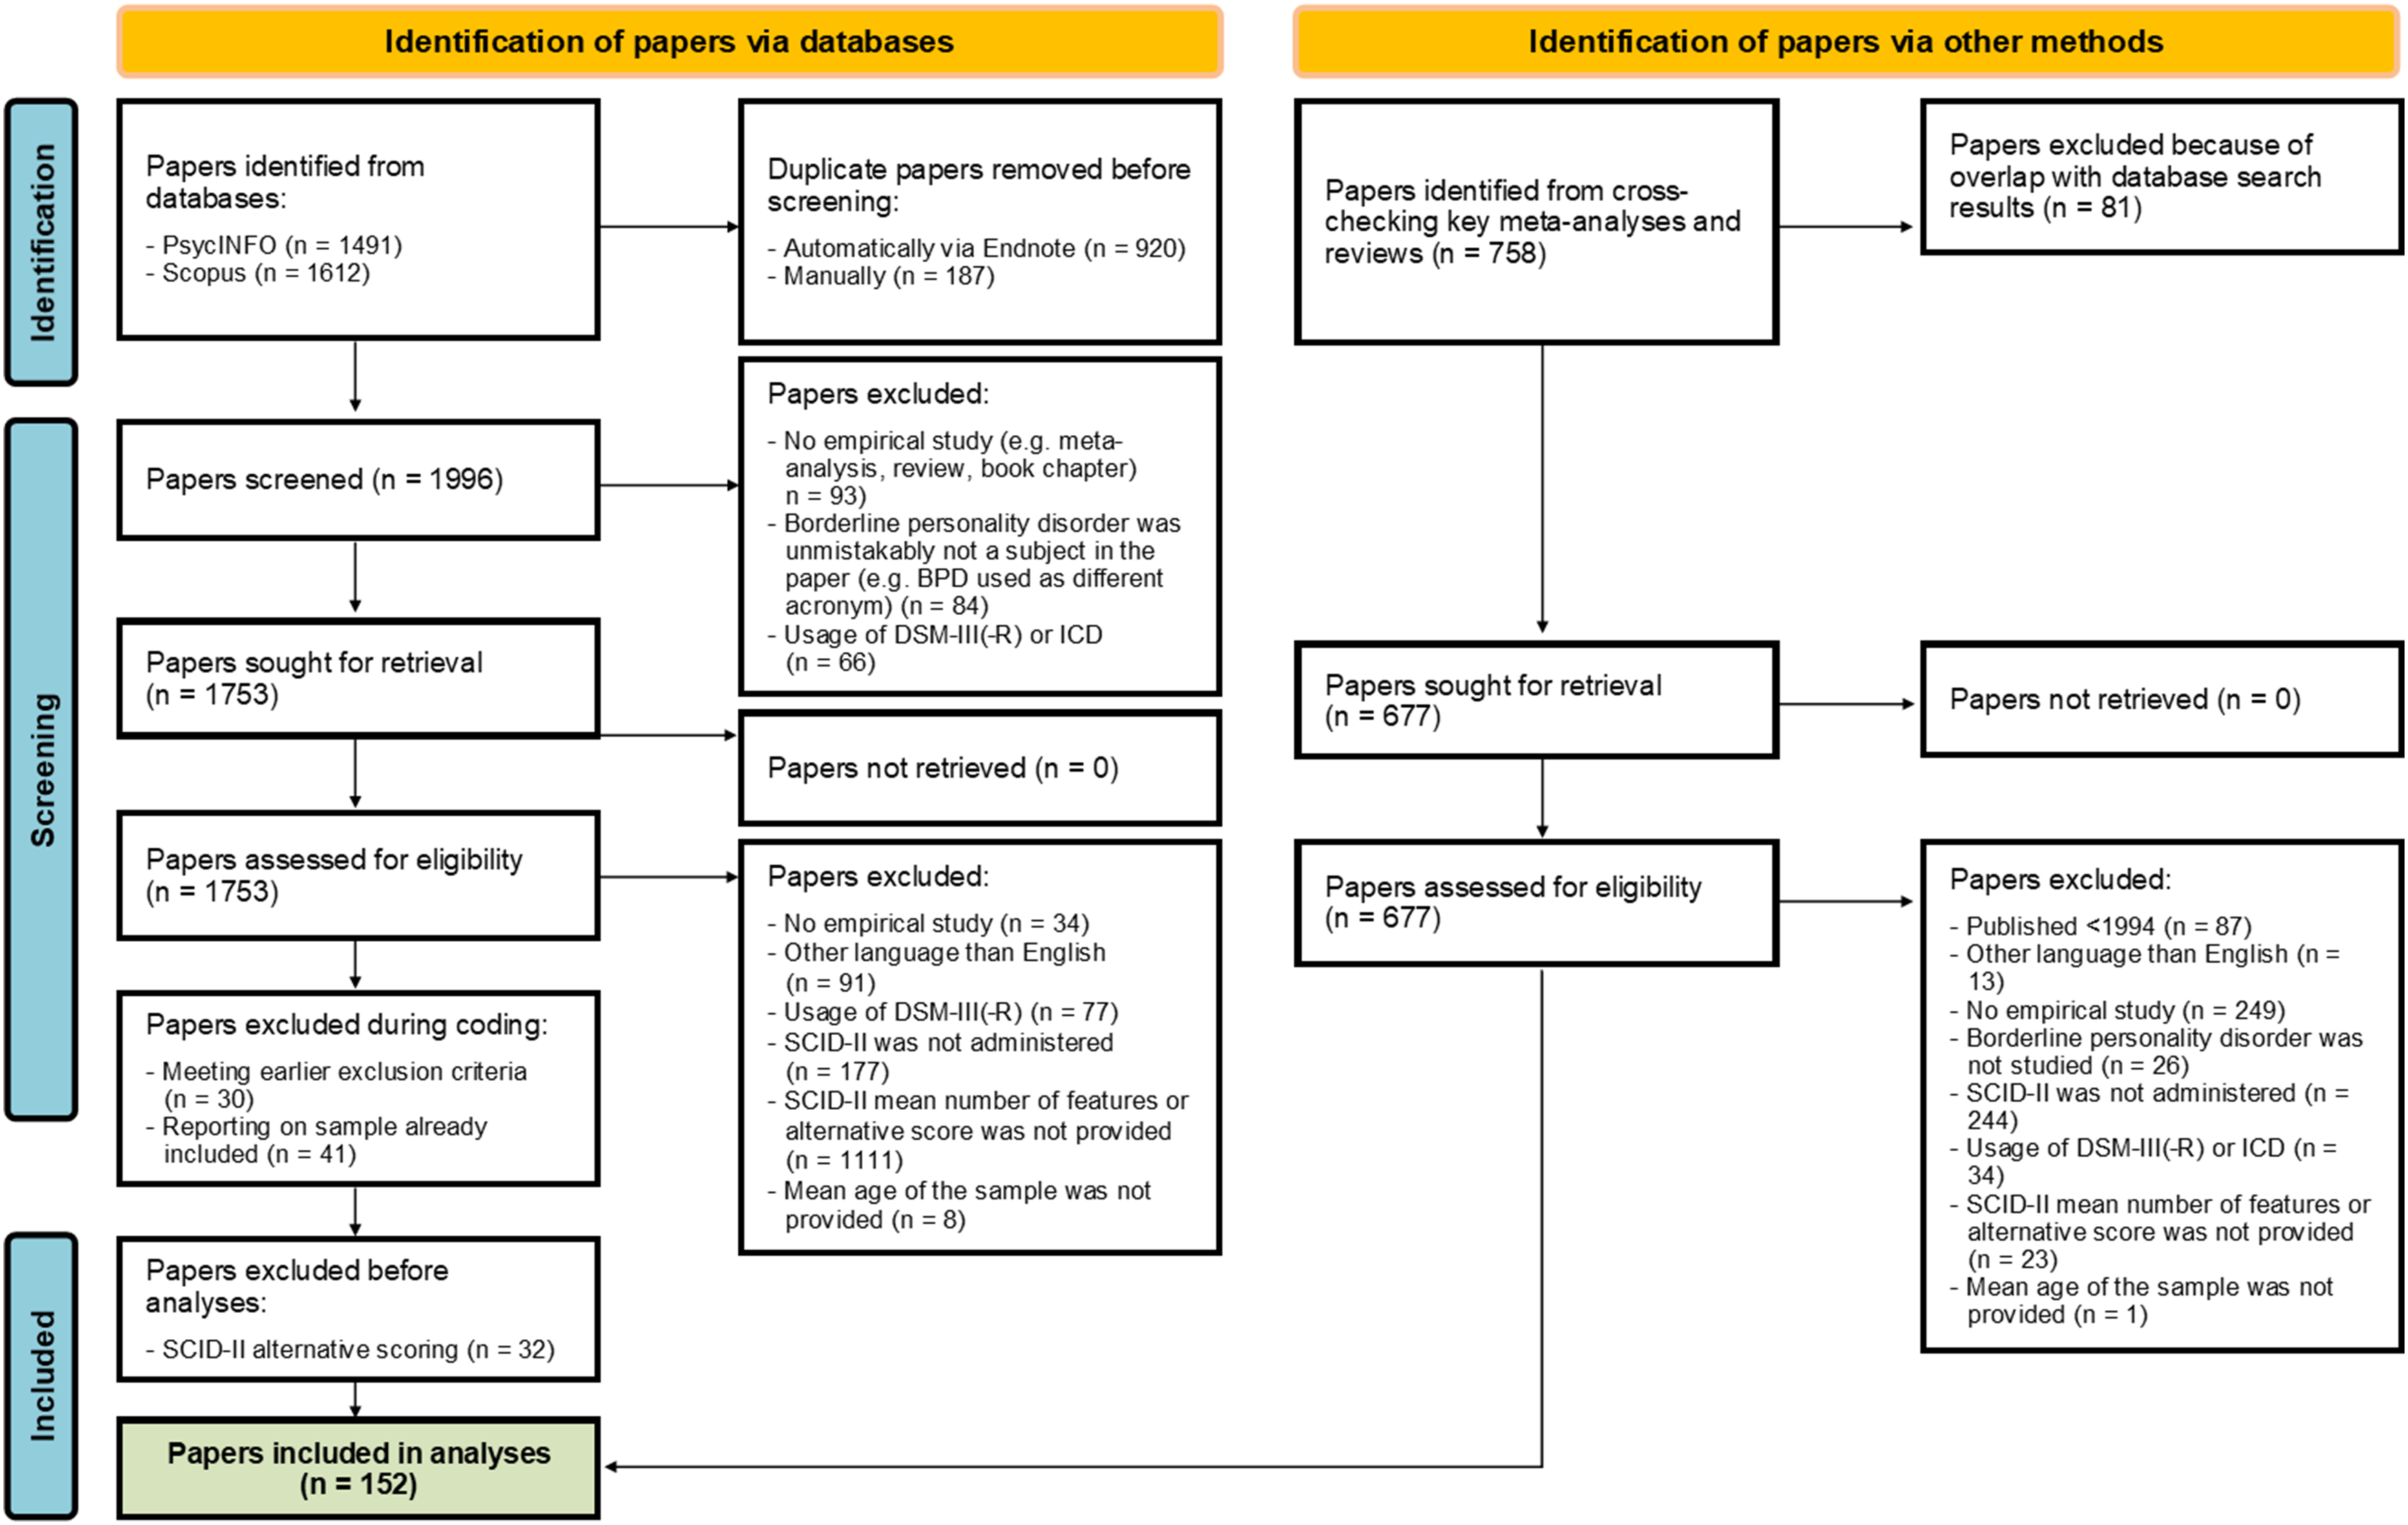
Data preparation
Data preparation steps were undertaken after coding to ensure that the planned statistical analyses could be conducted. A brief overview of these procedures is provided here, a detailed description of all steps is available on the Open Science Framework project page. First, data of subgroups belonging to a larger sample were merged into one group via the Cochrane formulas for combining means and standard deviations (Higgins et al., 2020). Exceptions from merging were subgroups based on variables directly related to the research questions (i.e. age groups, context of participants, and sex). Next, papers reporting on an alternative SCID-II BPD score (i.e. other than mean number of features) were examined. These papers seemed to be evenly distributed across adolescence and adulthood. Some scoring alternatives did not translate to the nine borderline personality features via a straightforward conversion algorithm (i.e. a certain score consistently translating into a corresponding number of features). This meant that the mean number of features met by a sample could not be reliably inferred from these papers. Therefore, papers providing solely alternative SCID-II BPD scores were excluded from the final dataset (n = 32).
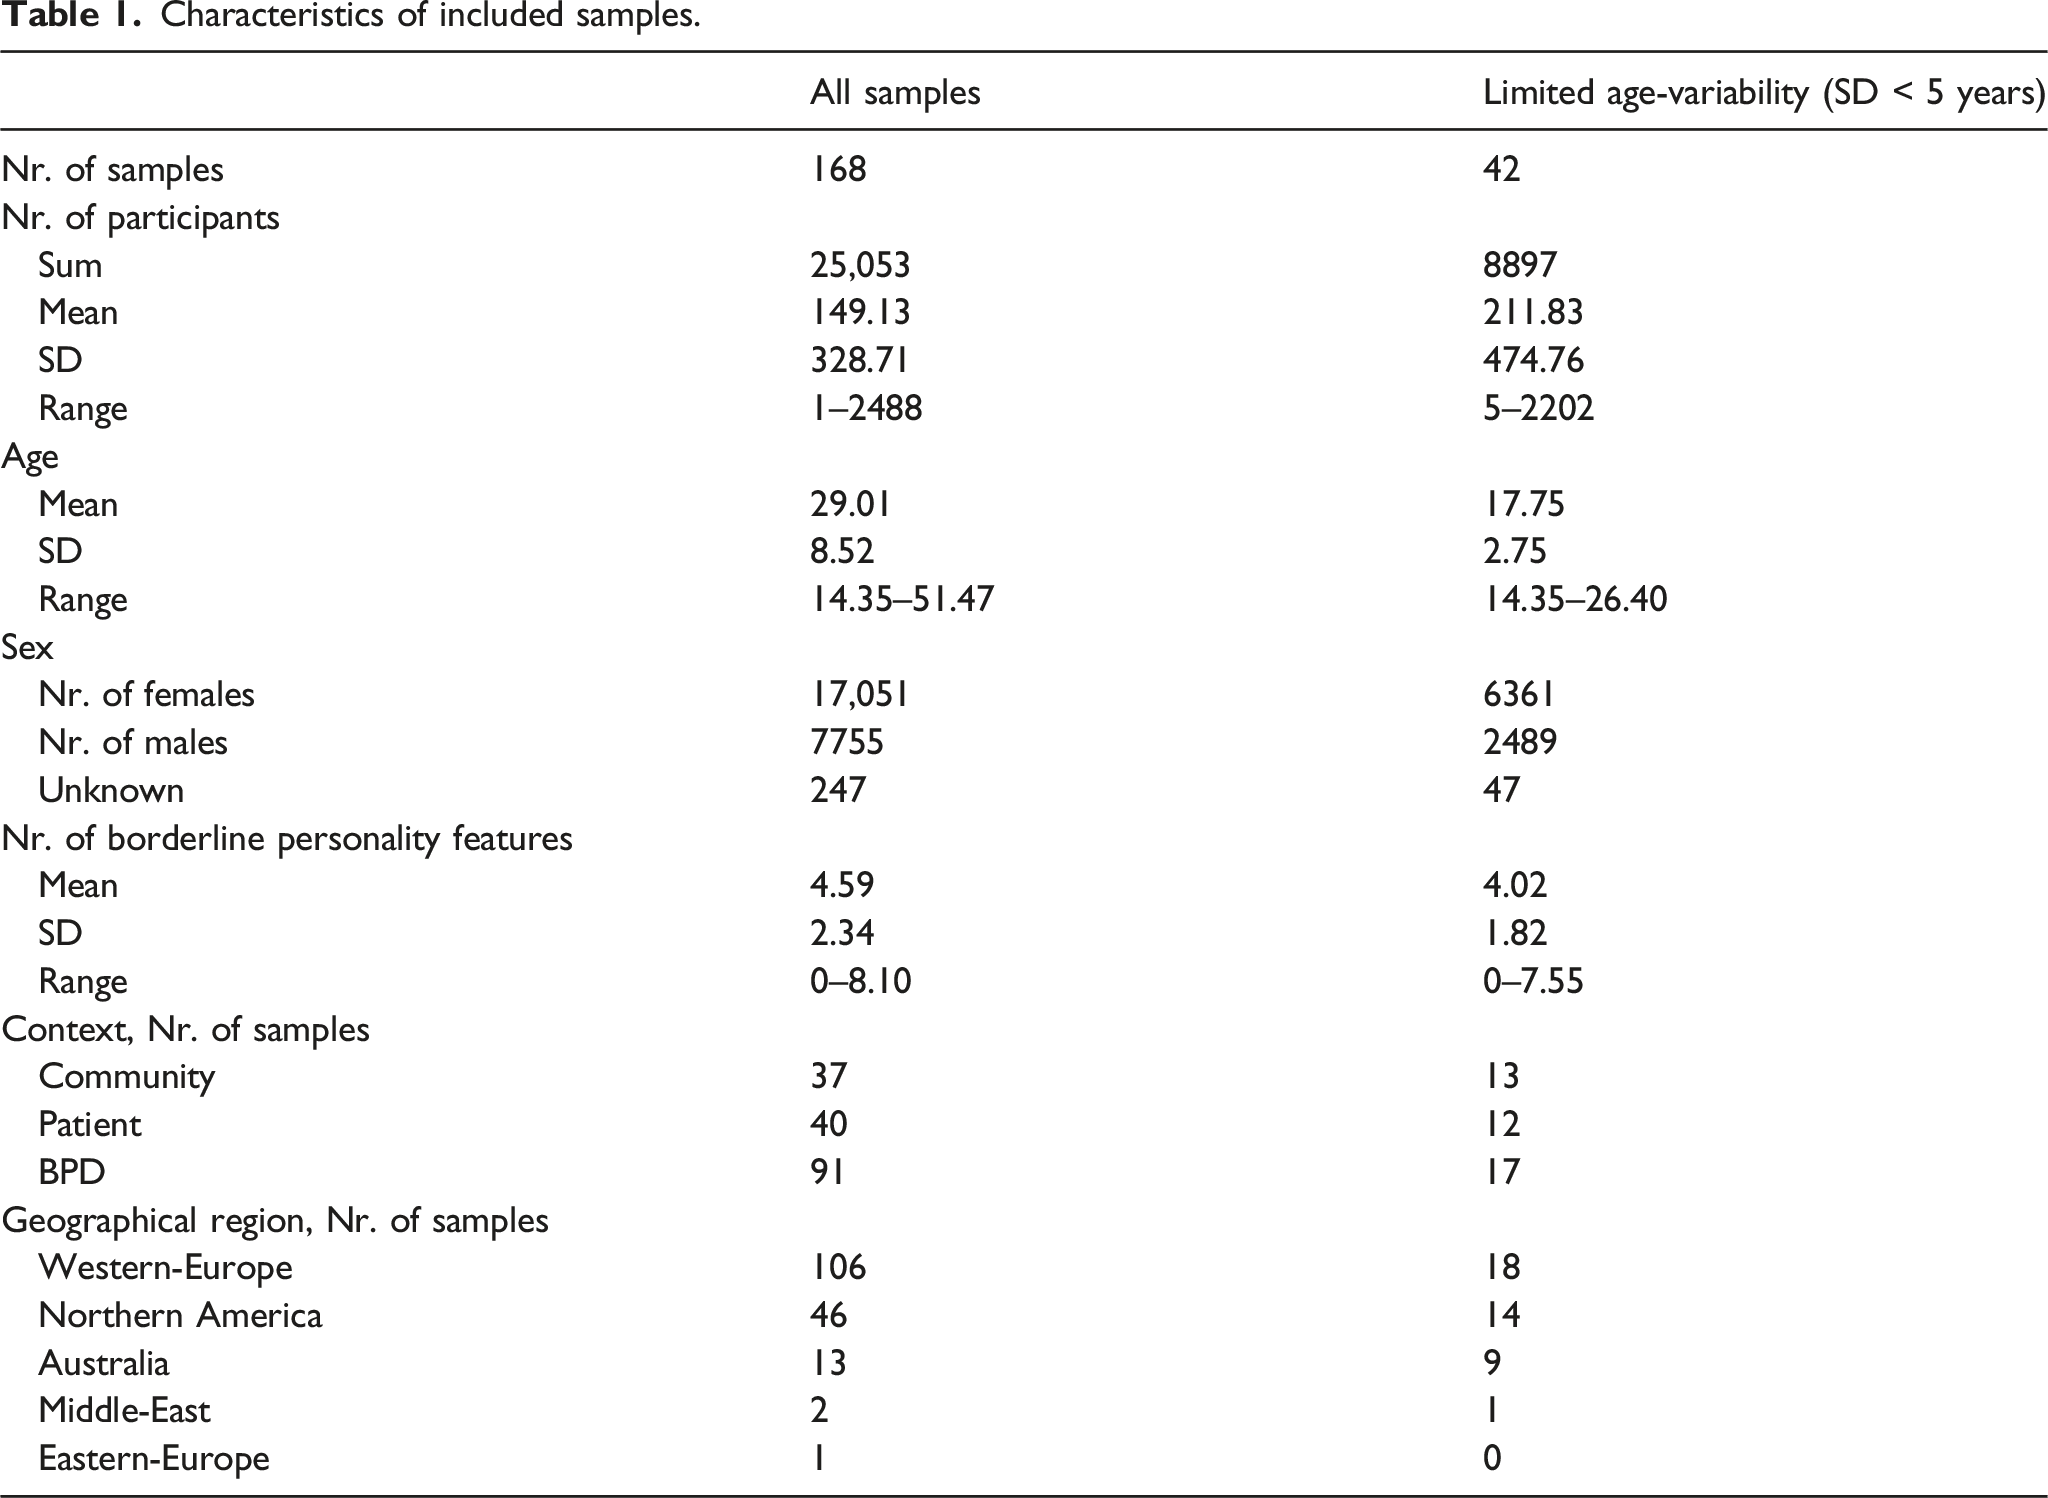
Characteristics of included samples
Characteristics of included samples.
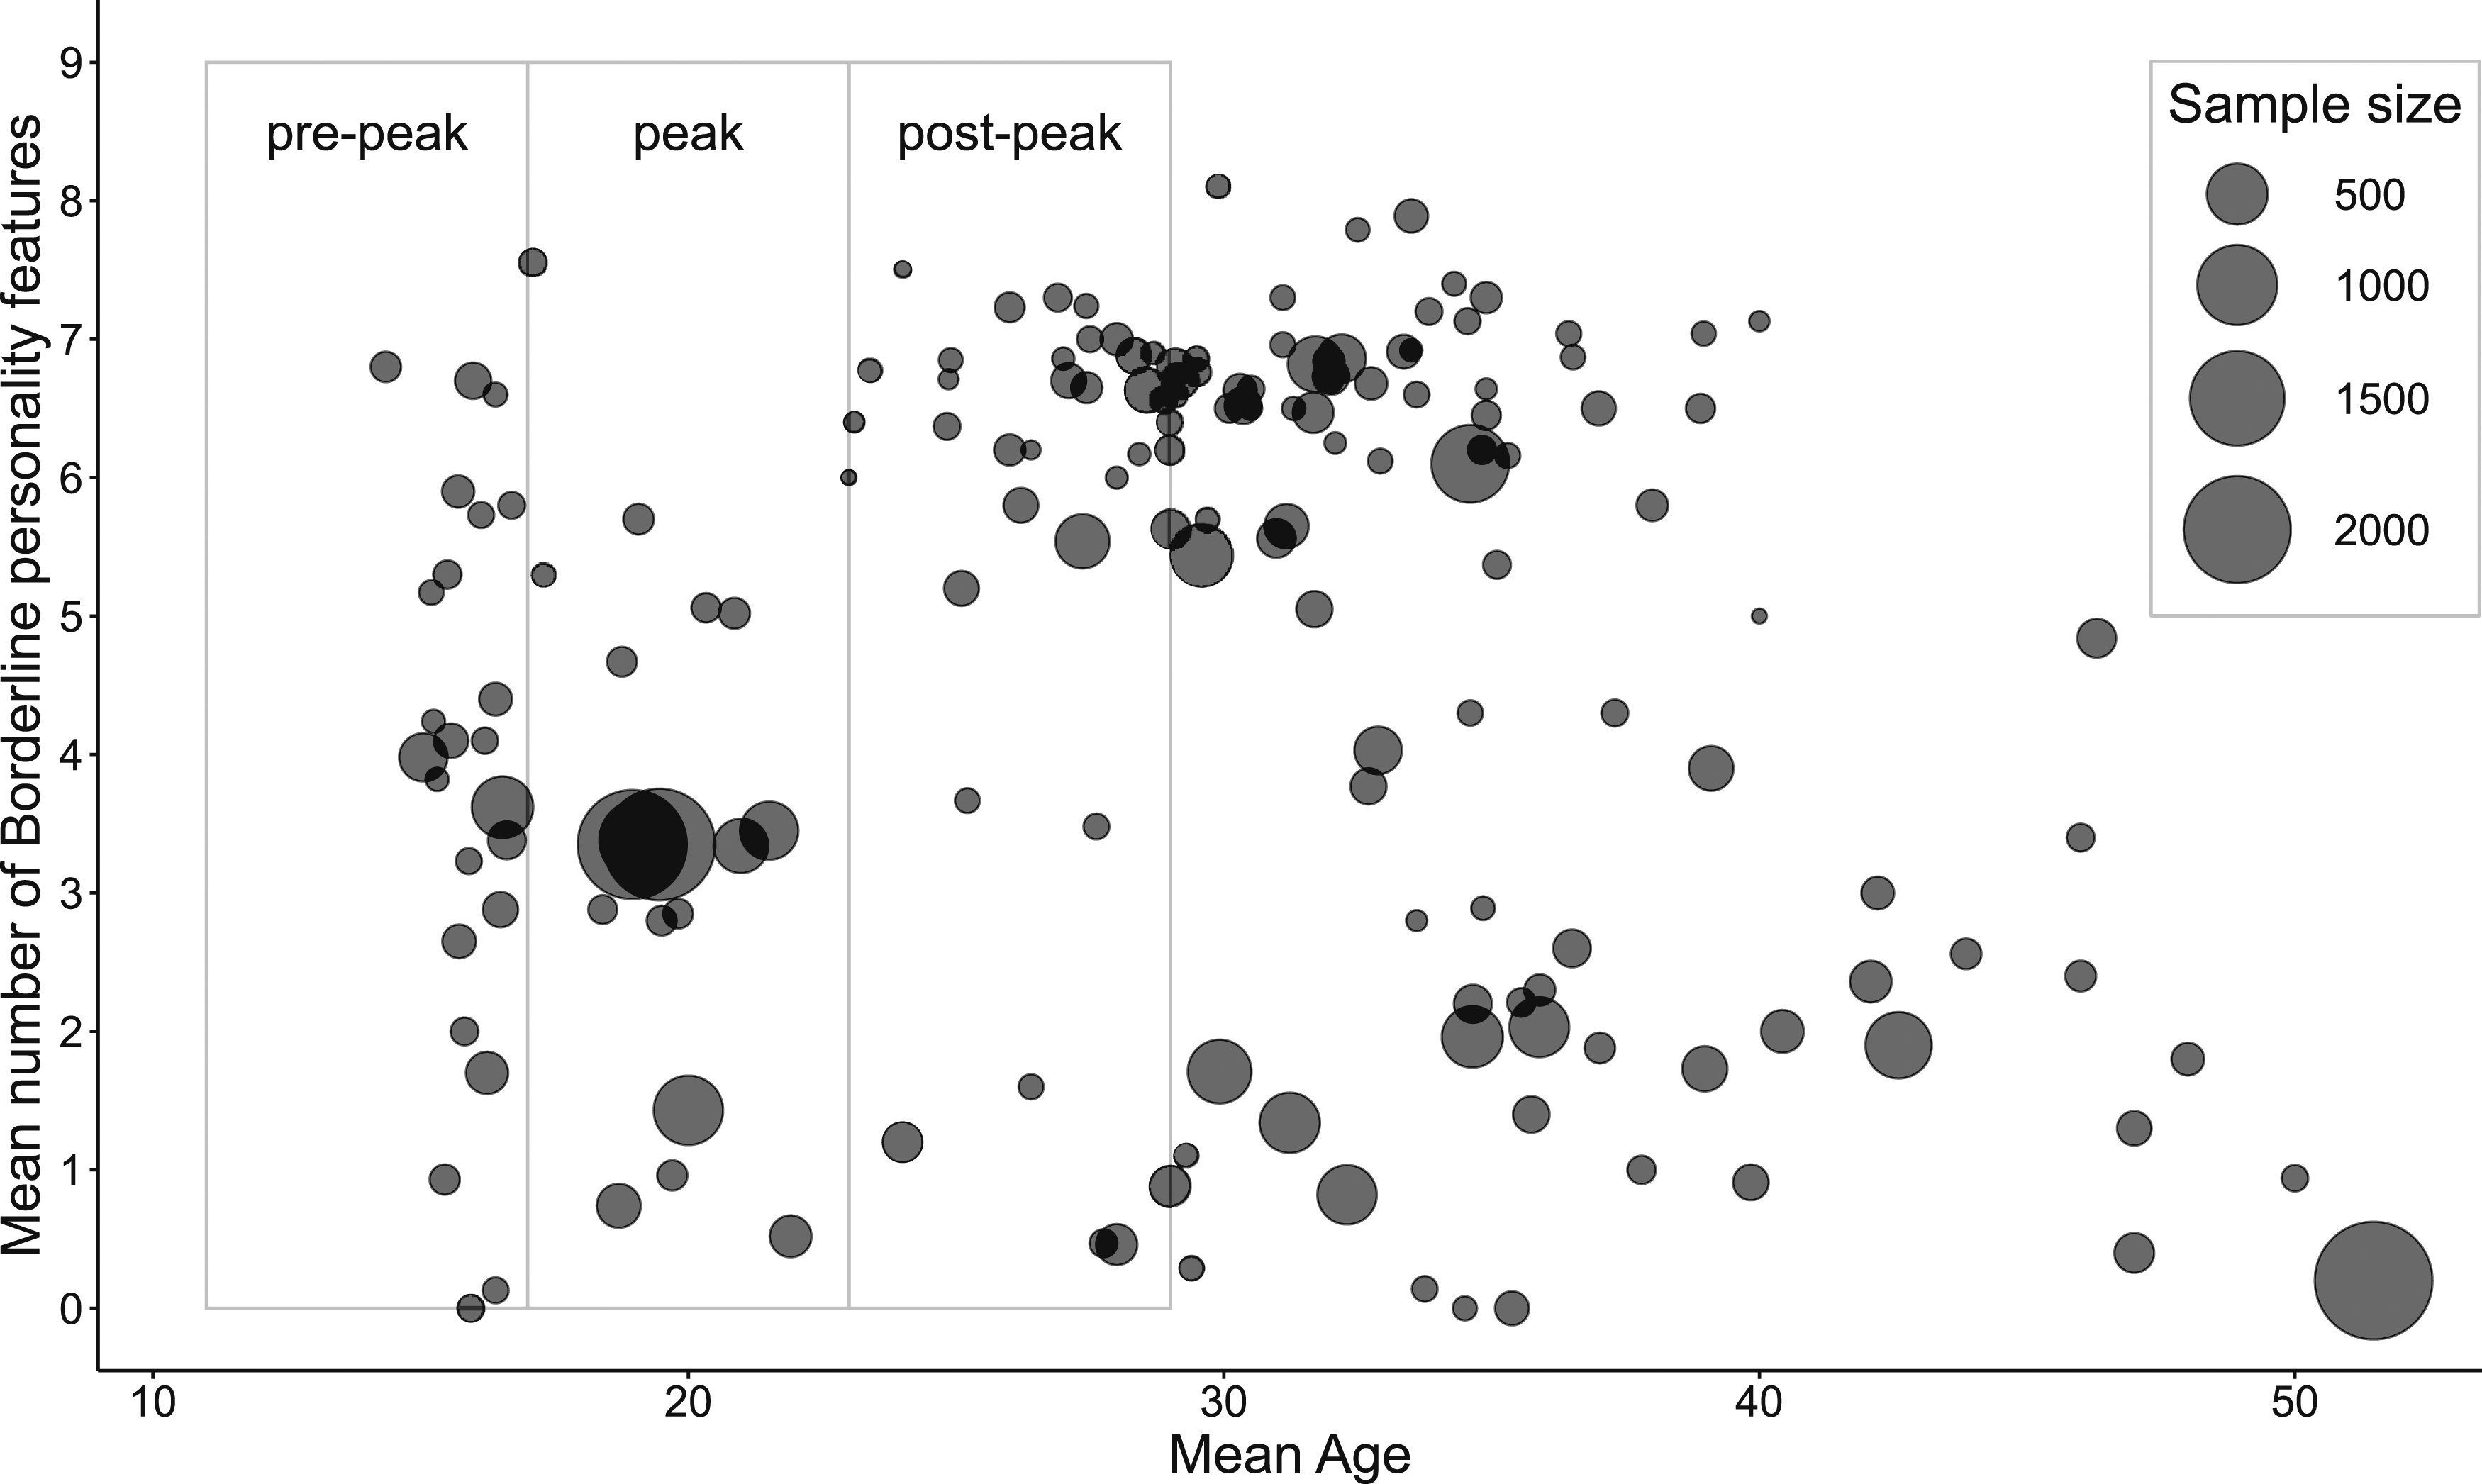
Visualisation of samples based on mean age and mean number of borderline personality features. Note. A priori defined peak-categories that were used in the ANOVA are depicted.
Main analyses
ANOVA
Characteristics of pre-peak, peak and post-peak age categories.
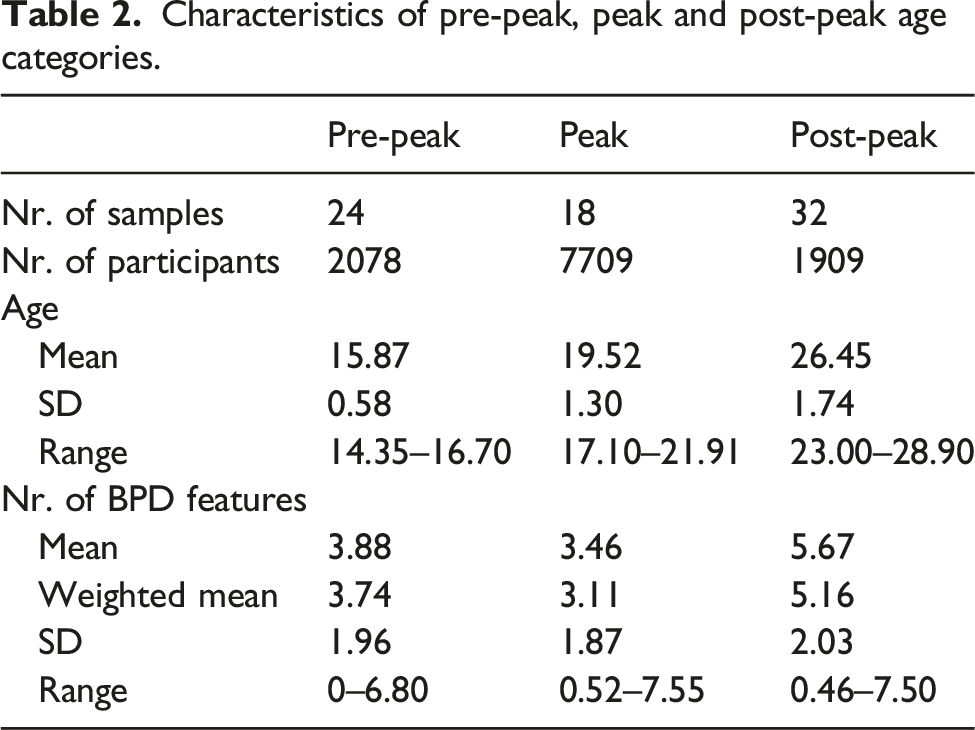
A one-way ANOVA, incorporating weights based on sample size, showed significant differences in the mean number of borderline personality features between the three categories, F(2, 71) = 10.84, p < .001 1 . However, when a post-hoc Tukey test was conducted the differences in mean number of borderline personality features between the categories did not reach significance for any of the comparisons. This was likely due to the Tukey test adjusting the p-values for multiple testing. However, the difference between the peak and post-peak category came close to significance (p = .003).
Repeating the ANOVA with limited age-variability samples resulted in a non-significant effect, F(2, 39) = 0.67, p = .519. This indicated there were no detectible differences between the mean number of borderline personality features between the pre-peak (n = 24, M wt = 3.74, SD = 1.96), peak (n = 15, M wt = 3.36, SD = 1.61) and post-peak categories (n = 3, M wt = 4.60, SD = 1.52). However, this might have been due to a power issue, considering the post-peak category only comprised three samples. Further descriptive information on the limited age-variability samples is available on the Open Science Framework project page.
Generalized additive modelling
The exploratory GAM analysis, with age as the continuous predictor of the mean number of borderline personality features, resulted in a significant non-linear model fitting the data, edf = 4.13, F = 18.01, p < .001. Figure 3 shows this model, with a peak (i.e. highest point) in mean number of borderline personality features occurring at age 29.4, with a predicted mean number of 4.64 features. This GAM model explained 36.1% of the variance in borderline personality features with age. Visualisation of GAM model including all samples. Note. Model depicts between-person age differences.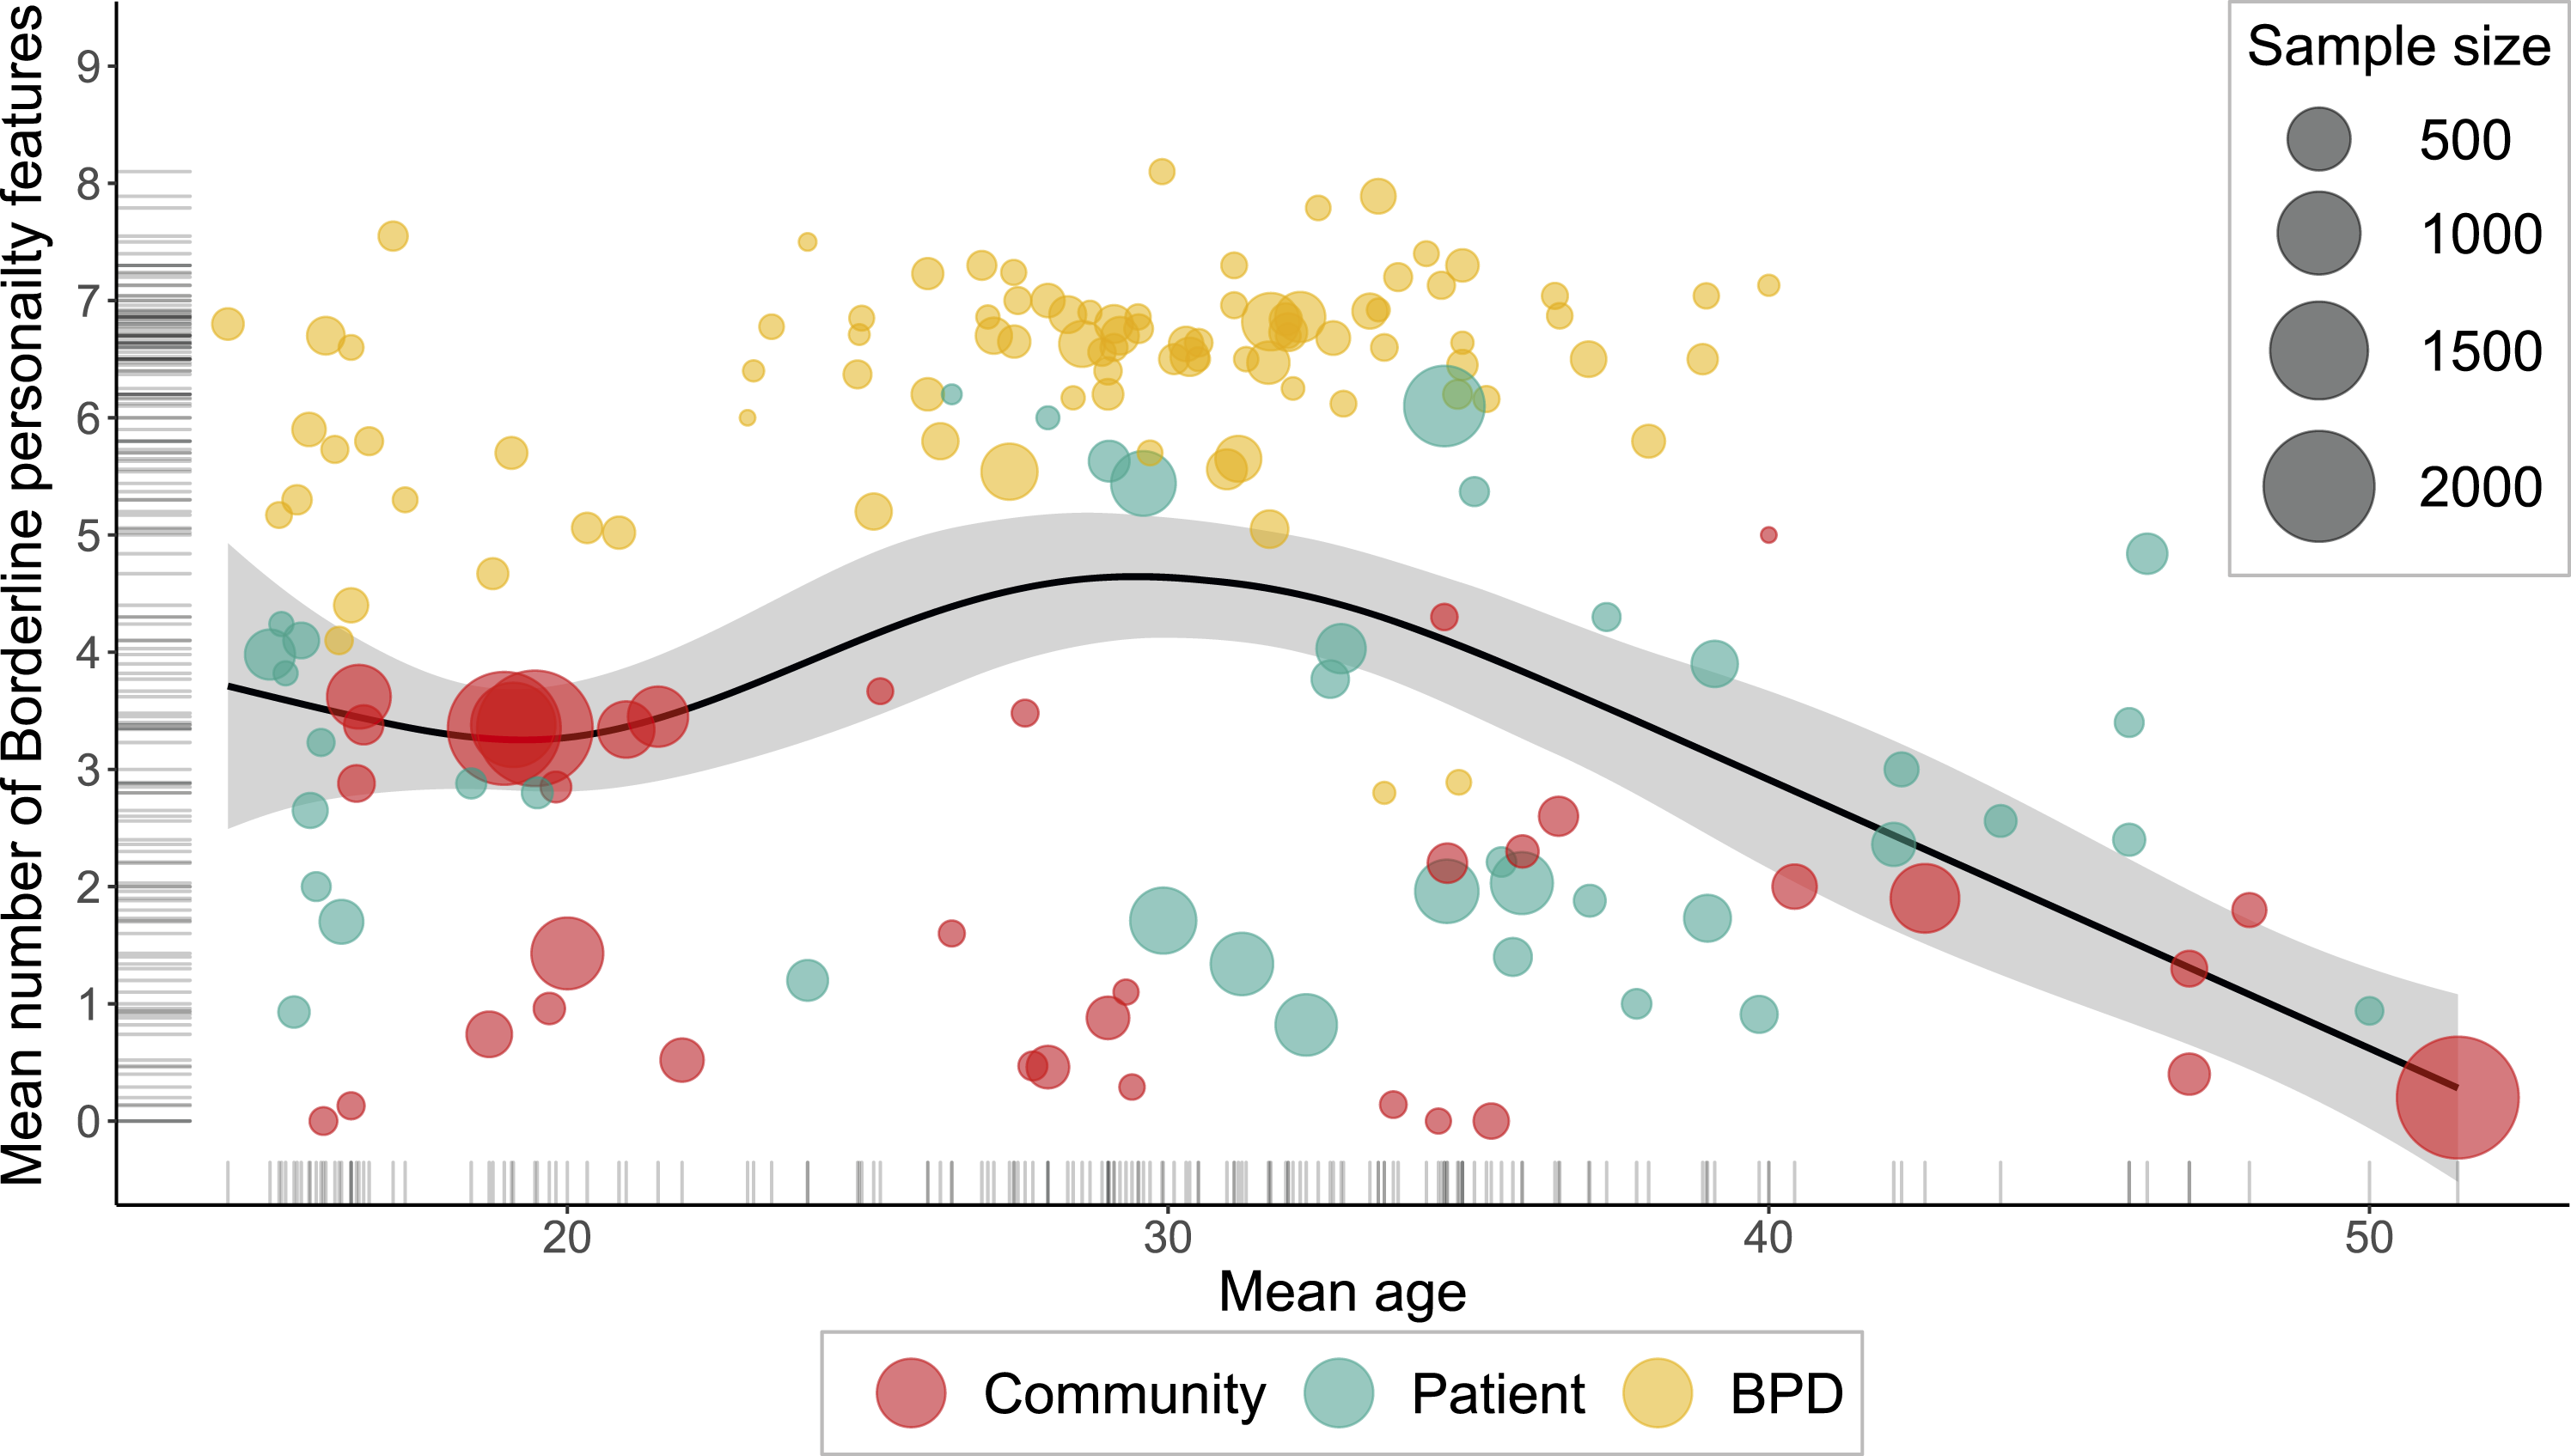
When the GAM was repeated with only limited age-variability samples, the result was non-significant, edf = 1.46, F = 0.973, p = .424. However, this might be due to only 42 samples meeting the age-variability cut-off value.
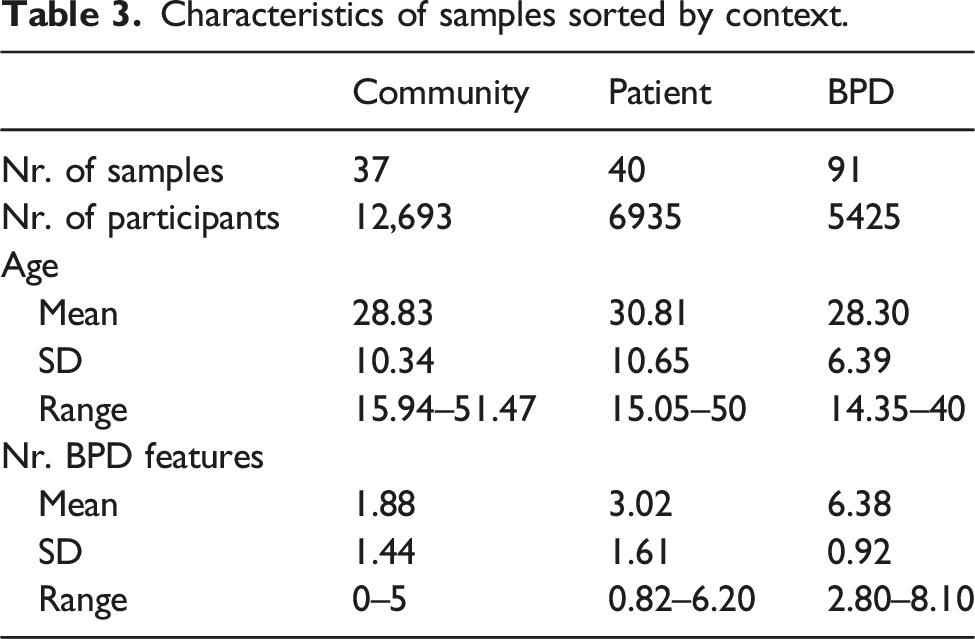
Characteristics of samples sorted by context.
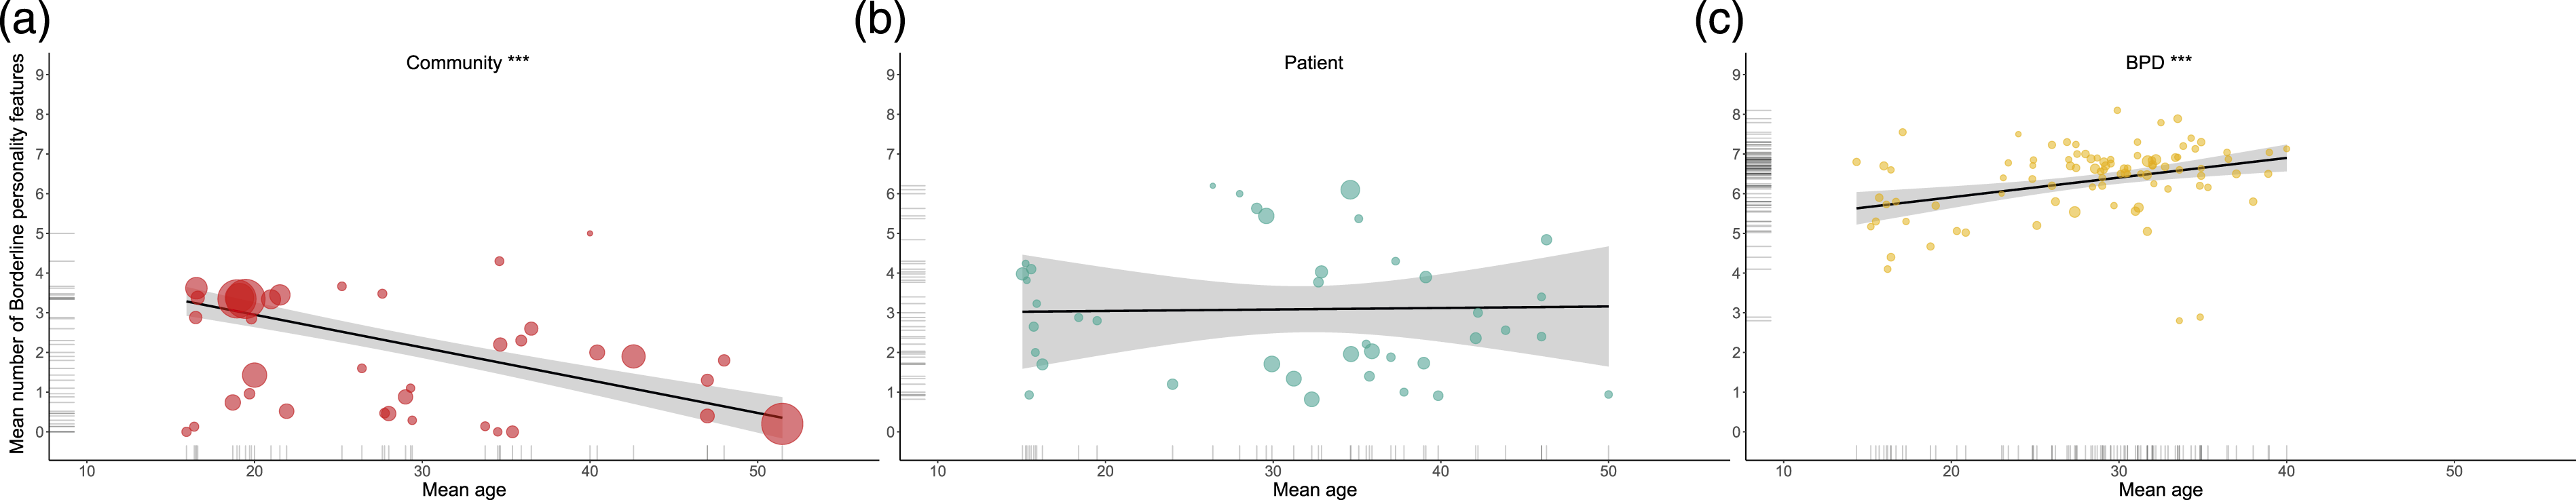
Visualisation of GAM models for community, patient and BPD samples.Note. *** represents significant model fit with p < .001. Model depicts between-person age differences.
Repeating the separate GAM analyses with only limited age-variability samples resulted in non-significant findings when based on community samples (edf = 1, F = 0.276, p = .61), patient samples (edf = 2.54, F = 2.118, p = .188) and BPD samples (edf = 1, F = 1.898, p = .189). However, the number of samples included for each context was limited, indicating that there might have been power issues. Descriptive data on the limited age-variability samples sorted by context, as well as associated visualisation of the GAM analyses, is available on the Open Science Framework project page.
Contrast analyses
Geographical representativeness of findings
The geographical generalization of the significant GAM model based on all samples was examined by contrasting samples from the US (n = 125) and those from other countries (n = 43). Adding this contrast as a categorical dummy variable to the GAM model meant comparing non-US to US-samples given a similar model shape. This analysis returned a non-significant difference between the two, t = -2.62, p = .00969. This indicated that the geographical origin of a sample (i.e. US or other) did not influence the GAM model shape.
Sex
A total of 9 male and 130 female samples were available to examine sex differences within the significant GAM model based on all samples via contrast analysis. Adding this categorical variable to the GAM returned a non-significant effect of sex, t = 0.576, p = .566, meaning there appeared to be no difference between male and female samples (in the context of the GAM model being able to produce only one model shape). However, as there were only 9 male samples, insufficient power to detect differences was considered to be likely. To explore whether this was indeed the case, the contrast analysis was repeated with female and mixed samples (n = 25). This analysis did provide a significant result, t = -9.026, p = < .001. Mixed sex samples scored on average 2.32 number of borderline personality features lower than female samples. Visual inspection of the GAM model shape based solely on female samples (edf = 4.57, F = 11.78, p < .001), indicated a resemblance to the GAM model shape based on all samples. The shape of the mixed sex sample model on the other hand showed more of a decreasing trend in mean number of borderline personality features over time (edf = 2.81, F = 13.2, p < .001). Figures are available on the Open Science Framework project page. The difference between the model shapes indicates that the inclusion of male participants might have had an influence on the model shape based on all samples.
SCID-II assessment format
The semi-structured interview format outweighed the self-report screening questionnaire by a large margin (n = 156 vs. n = 12). In 14 instances the interview was applied in a somewhat modified version (e.g. scoring was discussed at a staff conference and based on additional information such as referral letters and other evaluation interviews). Given the unequal distribution, a contrast analysis was considered unreliable and therefore not conducted.
Birth cohort effects
A possible birth cohort effect influencing the observed significant difference in mean number of borderline personality features between the pre-peak, peak and post-peak categories (i.e. ANOVA result) was examined. The contingency table of samples classified by age group (e.g. 15–19 and 20–24) and period (e.g. 1980–1984 and 1985–1990) showed that the data spread across periods were limited and sometimes consisted of only one participant. This uneven spread was also apparent in the subsequent graphical representation. Therefore, interferences about possible cohort effects were considered unreliable and further exploration was discontinued.
Publication bias
The Fail-Safe N analysis concerning the significant results of the ANOVA (i.e. an overall difference in mean number of borderline personality features between the specified age categories), returned that a number of 233 papers with a null-effect would be required to make the significant result non-significant. Given that this quantity is greater than the number of included papers in the current study, it was deemed unlikely that such a large body of papers would have been missed. Hence, publication bias was considered unlikely. As the post-hoc Tukey test returned no significant pairwise comparisons of the age categories, an additional Fail-Safe N analysis hereof was not necessary.
Discussion
This meta-analysis aimed to shed light on the empirical basis of the presumed peak in mean-level of borderline personality features during adolescence (Videler et al., 2019; Sharp et al., 2018). Middle to late adolescence (i.e. age 17–22) was hypothesized as the peak period given the expected coincidence with normative developmental processes setting in around that time. Borderline personality features were operationalized through the Structured Clinical Interview for DSM-IV Axis II Personality Disorders (SCID-II), and mean-level corresponded to the mean number of features present in a sample. This was the first study to thoroughly examine this relationship via a between-person (i.e. cross-sectional) mean-level comparison.
Confirmative testing of age differences (i.e. between-person) in mean-level of borderline personality features did not substantiate a peak during the hypothesized period. Subsequent exploratory GAM analysis including all samples returned a significant non-linear model with a peak in number of borderline personality features at age 29.4. This GAM model explained 36.1% of the variance in borderline personality features with age, and suggested a rise in mean number of borderline personality features until the peak and a decline thereafter. However, the model could not be replicated when only samples with limited age-variability were included (i.e. SD < 5 years) and should therefore be interpreted with caution. Taken together, the hypothesized peak between age 17 and 22 was not substantiated by either of the analyses.
Repeating the GAM separately for community, patient (i.e. various mental disorders with the full range of borderline personality features) and BPD (i.e. identified specifically as affected by borderline personality pathology) contexts resulted in different model shapes and a better fit. Community samples showed a significant declining linear trend in between-person mean-levels of borderline personality features over the lifespan, with 66% of the variance explained with age. BPD samples on the other hand showed a significant linear rising trend over time, with 13.1% of the variance explained. In patient samples, no relationship between age and mean number of borderline personality features was found, which might be due to the heterogeneity in this group and the differing relation between various comorbidities and borderline pathology over time (Shah & Zanarini, 2018).
Interpretation of the GAM model based on all samples is questionable, given that subsequent distinctive models appeared when context of a sample was taken into account. This suggests that it is highly important to differentiate between these populations when assuming a relationship between age and borderline personality features. Therefore, the interpretation of the identified peak at age 29.4 is uncertain. This peak might be a statistical artifact, due to the combination of different sample contexts and thereby insufficient sensitivity to the meaningful factor of context. More specifically, there seemed to be an overabundance of BPD samples around the mean age of 30, and these samples by definition had a higher mean-level of borderline personality features. However, the peak might also reflect a true effect, with an increase in mean-level of borderline personality features during young adulthood and decrease after the age of 29. In that case, there might be a relationship with the coinciding life transitions and their association to normative personality development. Like adolescence, young adulthood is characterized by important transitions, such as the first engagement in a romantic relationship, finishing education and starting work (Bleidorn & Denissen, 2021). The positive feedback loop between such life transitions and the maturation of the Big Five personality traits continues from adolescence into young adulthood (Bleidorn et al., 2018; Bleidorn & Denissen, 2021). The first romantic relationship, for example, is associated with increasing levels of agreeableness and extraversion, and the transition to secondary education or work with increasing agreeableness, conscientiousness and openness and decreasing neuroticism (Bleidorn et al., 2018). The gradual accumulation of developmental milestones in both adolescence and young adulthood, and the reciprocal association with normative maturity of Big Five traits, might reach a turning point around age 29, whereafter struggling individuals might give up on goals and ambitions to prevent further disappointment. This might eventually lead to a decrease in borderline personality pathology, as there is less exposure to triggering situations. There are also preliminary suggestions that disturbances in neurobiological processes during the critical period of adolescence, like dopamine system alterations, contribute to maladjusted adult behaviour (Lockhart et al., 2018). Whether there is indeed a relationship between accumulating development arrest, neurobiological processes and borderline personality features, or whether the increase and peak are the result of a statistical artifact, is yet to be discovered.
That age differences in mean-level of borderline personality features differed based on the context of the samples, is in line with the notion by Sharp and colleagues (2018) of a normative decline in these features over time in the community, whilst a rise is suggested to appear in those significantly affected by borderline personality pathology. One could speculate that these patterns might reflect a similar developmental taxonomy as the one formulated by Moffitt (1993) regarding antisocial behaviour during adolescence. Moffitt (1993) described a distinction between Adolescence-Limited (AL) and Life-Course-Persistent (LCP) antisocial behaviour. Individuals classifying as AL tend to conduct minor violations during adolescence, and cease delinquency when entering adulthood. LCP offenders on the other hand show antisocial behaviour from an early age onwards, tend to commit more serious offences and do not desist antisocial behaviour after adolescence (Moffitt & Caspi, 2001). Based on our findings in community versus BPD samples, a translation of this developmental taxonomy to borderline personality pathology might be the topic of future research. Although longitudinal within-person data starting from childhood onwards is needed to substantiate the analogy, the between-person age differences found in the current study do hint at an AL and LCP similarity. In this case, community samples might resemble the AL trend, with features being present during adolescence and ceasing thereafter (insight into the trajectory before adolescence was lacking in the current study but should indicate increases if the AL-analogy holds). Meanwhile, BPD samples might resemble an LCP-like pathway of stable pathology or even some increase across the lifespan.
Another link between the AL and LCP taxonomy and borderline personality pathology might be found in the overlap between antisocial and borderline personality pathology described by Beauchaine and colleagues (2009). They labelled them sex-moderated outcomes of a shared genetic and environmental aetiology, with antisocial pathology being more common in men and borderline pathology in women. A corollary from this description might be that the AL and LCP pathways applicable to antisocial behaviour, have an equivalent in borderline pathology. However, the suggestion of similar underlying psychopathology has been rejected by others (Paris et al., 2013).
More research is needed to examine whether adolescence is indeed the period wherein distinctive pathways emerge regarding BPD, as with the AL and LCP taxonomy. A substantiation hereof would be in line with the idea that there is a subset of adolescents who diverge from the normative path and go on to experience persistent personality problems (Sharp et al., 2018), with differentiation between those groups becoming more pronounced throughout adolescence (De Fruyt & De Clerq, 2014; Videler et al., 2019). In addition, the findings of the current study do not include the possible effects of treatment on BPD features across the lifespan, which can be at least moderately effective for individuals with BPD (Cristea et al., 2017).
The speculative trend of a growing mean number of borderline personality features in BPD samples from adolescence onwards might point towards a pervasive struggle for those individuals. Young people struggling with significant borderline personality pathology indeed show a worsening social, academic and mental health outcome throughout adolescence (Juurlink et al., 2022; Wright et al., 2016), and enduring psychosocial impairments into young adulthood, like a lower level of social support (Wertz et al., 2020; Winogard et al., 2008). Our findings suggest that for those significantly affected by borderline personality pathology during adolescence, a normative decline over time might be unlikely. Although longitudinal data is necessary to further substantiate this idea, it indicates that efforts should go to helping those adolescents diverge from a persistent path onto a more hopeful one. Hence, early intervention treatment programmes for young people with BPD features are an important development (Chanen & Thompson, 2018). Fortunately, the amelioration of borderline personality features during adolescence has shown to be associated with gains in functioning as well (Wright et al., 2016). Future longitudinal studies should test the suggested pervasive and normative pathways, and the associated risk and protective factors.
Strengths and limitations
The current study is the first to thoroughly examine age differences in mean number of borderline personality features via a between-person mean-level comparison. This resulted in more generalizability, i.e. representativeness across broader populations, than previous studies in the field. Yet, there are some limitations that are best summarized as constraints on generality.
First and foremost, only the SCID-II was included as a measure of borderline personality features. The SCID-II was selected based on the vast number of studies using this measure and its strong foundation in research (Carcone et al., 2015). However, different findings might have been obtained if other instruments had also been included, like the Childhood Interview for DSM-IV Borderline Personality Disorder (CI-BPD; Zanarini, 2003), which is an adaptation of an adult measure to match the developmental period of children and adolescents. In addition, the use of the SCID-II in the current study was a compromise between a categorical and dimensional model, as the arbitrary cut-off for recognition of BPD was abandoned (i.e. five out of nine features), but the SCID-II threshold for individual borderline personality features was maintained. Therefore, the SCID-II might be less sensitive to emerging borderline personality pathology that does not yet meet the feature threshold. Furthermore, semi-structured interviews like the SCID-II might show rater bias that could result in both over- and underdiagnosis of borderline personality features in younger age groups (Sharp et al., 2019). Hence, future research could also consider integrating other measurement formats, like self- and informant-report.
Secondly, the exploration of sex and geographical differences in mean-level of borderline personality features over the lifespan was limited to contrast analyses in the current study. These analyses did suggest some potentially interesting distinctions (e.g. male/female differences). However, the nature of these differences needs further exploration. For geographical contrasts, we only differentiated between US and non-US samples. Perhaps findings will be different at the level of Western versus non-Western countries, which was an unattainable contrast given the current study’s data.
Furthermore, as this study used cross-sectional (i.e. between-person) data, the development within individuals can only be inferred with caution. Additional analyses on longitudinal data were considered in the design of the current study, but the number of longitudinal studies examining borderline personality features with the SCID-II was too limited to be able to conduct meaningful testing. Comparison of the results from the current study with previous longitudinal findings during adolescence (based on different measures), does suggest that the appearing age differences might translate to within-person changes. Longitudinal studies in community samples found a similar downward trend in mean number of borderline personality features over adolescence (Bornovalova et al., 2009; Lenzenweger & Castro, 2005), with one study demonstrating this trend over the period of age 9 to 28 (Johnson et al., 2000). Regarding BPD samples, findings have been less consistent, with the stability in mean number of features over time ranging from 14 to 40% in adolescents and 25 to 67% in adults (Winsper et al., 2015). Future longitudinal studies should aim to validate the suggested pathways in community and BPD samples, and their risk and protective factors. Possible differences in the endorsement of specific features at different ages and their trajectories over time could be considered as well (Sansone & Wiederman, 2014; Videler et al., 2019).
Lastly, the age differences in mean-level of borderline personality features might have been clouded by the relatively wide age-variability of samples or a birth cohort effect. Both influences could not be thoroughly tested, as only 25% of all samples met the age-variability cut-off value (numbers were even smaller when analyses were run on separate groups), and the spread of data was insufficient for the planned birth cohort analyses.
The inclusion of a large number of samples, with a wide range in mean ages, and the thorough examination of contextual influence on findings argue in favour of the credibility of results of the current study. The a priori formulation and registration of both hypothesis-driven and exploratory statistical analyses ensured transparency and reliability of results. The current study was the first comprehensive empirical study on the assumption of age differences in borderline personality features, and it emphasizes the importance to differentiate between community and BPD individuals.
Conclusion
This meta-analysis provides a thorough overview of age difference in the mean number of borderline personality features. The between-person mean-level comparison allowed for the inclusion of a large number of samples and participants. The hypothesis of a peak in number of features during middle to late adolescence was not substantiated in this study. A non-linear model, with age as the continuous predictor of mean number of borderline personality features, was found with a peak in number of features at age 29.4. However, the interpretability of this model was deemed questionable given that different trends appeared when models were constructed separately for community, patient and BPD samples. Age differences in community samples indicated a significant linear decline in mean number of borderline personality features over time. In sharp contrast, a linear rising trend was found for BPD samples. It is important to keep in mind that these are between-person trends, and that longitudinal studies are needed to replicate results. A theoretical distinction of developmental pathways into Adolescence-Limited versus Life-Course-Persistent pathology was proposed as a framework for future research. In addition, factors that can redirect individuals to a normative path are an important avenue for future discovery.
Supplemental material
Supplemental Material - Adolescence as a peak period of borderline personality features? A meta-analytic approach
Supplemental material for Adolescence as a peak period of borderline personality features? A meta-analytic approach by Anouk Aleva, Odilia M Laceulle, Jaap JA Denissen, Christel J Hessels, and Marcel AG van Aken in European Journal of Personality
Supplemental material
Supplemental material - Adolescence as a peak period of borderline personality features? A meta-analytic approach
Supplemental material for Adolescence as a peak period of borderline personality features? A meta-analytic approach by Anouk Aleva, Odilia M Laceulle, Jaap JA Denissen, Christel J Hessels, and Marcel AG van Aken in European Journal of Personality
Footnotes
Declaration of conflicting interests
The author(s) declared no potential conflicts of interest with respect to the research, authorship, and/or publication of this article.
Funding
The author(s) disclosed receipt of the following financial support for the research, authorship, and/or publication of this article: This study is part of a PhD trajectory funded by ZonMw (project number 636310013). The project is called “Detection and Intervention for Self-harming Adolescents as Pre-treatment to Early Intervention for Borderline Personality Disorders”, more information is available on the ![]() .
.
Data availability
Note
References
Supplementary Material
Please find the following supplemental material available below.
For Open Access articles published under a Creative Commons License, all supplemental material carries the same license as the article it is associated with.
For non-Open Access articles published, all supplemental material carries a non-exclusive license, and permission requests for re-use of supplemental material or any part of supplemental material shall be sent directly to the copyright owner as specified in the copyright notice associated with the article.