
Abstract
Purpose:
Programs designed to sustainably improve employee well-being are urgently needed but insufficiently researched. This study evaluates the long-term effectiveness of a commercial well-being intervention in a worksite setting.
Design:
A pre/postintervention repeated analysis with follow-up at 6, 12, and 18 months.
Setting:
Office-based worksites (for-profit, nonprofit, and mixed work-type; n = 8).
Participants:
One hundred sixty-three employees with a mean age of 47 (11) years (57% female).
Intervention:
A 2.5-day group-based behavioral program emphasizing vitality and purpose in life (PiL).
Measures:
Rand Medical Outcomes Survey (MOS) 36-Item Short Form (SF-36) with a focus on vitality (primary outcome), Ryff PiL Scale, Center for Epidemiologic Studies Depression Scale, Profile of Mood States, Rand MOS Sleep Scale, physical activity, body weight, blood pressure, and blood measures for glucose and lipids at baseline, 6, 12, and 18 months.
Analysis:
General linear models with repeated measures for mean values at baseline and follow-up.
Results:
At 18-month follow-up, sustained improvements were observed for vitality, general health, and mental health domains of SF-36 and PiL (P < .001 for all measures). Sleep, mood, vigor, physical activity, and blood pressure were also improved at 18 months (P < .05 for all measures).
Conclusions:
An intensive 2.5-day intervention showed sustained improvement in employee quality of life, PiL, and other measures of well-being over 18 months.
Keywords
Purpose
Well-being can greatly influence one’s health status, use of health-care services, and productivity and performance at work. 1 Since employed adults spend 8 hours at work on an average day, 2 researchers have identified the workplace as an ideal setting for disseminating health promotion programs. 3 -5 Many employers also have recognized the potential benefits of these programs, adopting on-site wellness initiatives for their employees. Over half of firms interviewed for a 2018 survey reported offering employee health benefits, and among large firms offering benefits, 82% offered wellness programs. 6 Despite the increasing popularity of these programs, 6,7 more research is needed to identify interventions with scale-up potential that also have undergone rigorous impact evaluation. 8 -10 Such data are essential for employers seeking wellness programs in an effort to improve employee job performance, engagement, and satisfaction while reducing health- and productivity-related expenses.
The purpose of this research is to test the long-term effectiveness of a multicomponent 2.5-day intensive well-being intervention, which was developed by the Johnson & Johnson Human Performance Institute (J&J-HPI) and is focused on improving vitality, or energy, in employees. 11 Programs that address the “whole person,” such as the one evaluated here, 12 recognize the complex stressors of the modern work environment. These multifaceted programs target components of physical and psychological health, including quality of life (QoL), purpose in life (PiL), stress and emotional management, and overall growth and development. In this study, our primary objective was to evaluate the intervention’s effect on employee vitality, while our secondary objectives were to evaluate its effects on other QoL domains, including PiL, sleep, mood, and depression, as well as body mass index (BMI) and cardiometabolic risk factors. In a previous publication, we reported the intervention’s short-term effects on these metrics: Compared to wait-listed controls (n = 77), employees receiving the intervention (n = 163) showed significant improvements in vitality, PiL, and multiple QoL domains, including mood, sleep, and social functioning, over a 6-month period. 13 The current study describes 12- and 18-month follow-up data in participants receiving the 2.5-day J&J-HPI intervention.
Methods
Design
Twelve worksites in Greater Boston participated in this cluster randomized controlled trial. Worksites were randomized by a statistician independent of the study using a 2:1 allocation in favor of the intervention (n = 8 worksites) versus the wait-listed control condition (n = 4 worksites). Worksites were the unit of randomization with a stratification for employer type (for-profit, nonprofit, and mixed work-type). Intervention group participants received the 2.5-day J&J-HPI program. Self-reported and objective health measures were collected at baseline and 6 months for all participants and at 12 and 18 months for intervention participants only. Wait-listed controls were not followed after 6 months for several reasons, including recruitment challenges (eg, worksites unwilling to be randomized to a control condition for 18 months) and predicted attrition rates for extended participation; therefore, they are not included in this report. The study is registered at https://clinicaltrials.gov/ct2/show/NCT02593240. All enrollment and study assessments were independently conducted by investigators at the Jean Mayer US Department of Agriculture Human Nutrition Research Center on Aging at Tufts University without involvement of the trial sponsors. The research protocol was reviewed and approved by the Tufts Health Sciences institutional review board, and written informed consent was obtained from all participants prior to primary data collection.
Sample
A broad range of worksites within Greater Boston (50-mile radius) were contacted, and, using a multistage screening process, the first 12 interested and eligible worksites were enrolled into the study.
Recruitment and informed consent
Informational sessions detailing the study and randomization were provided at each participating worksite, after which on-site screening and enrollment were conducted. At screening, employees were deemed eligible if they were aged ≥21 years, had a BMI of ≥20 and <50 kg/m2, and were willing to sign an informed consent form, provide their e-mail to receive program materials, complete outcome assessments, and provide a physician release form. Exclusion criteria included remote or contract workers, non-English speakers, pregnancy, mobility limitations, concurrent participation in an intensive lifestyle program, and major diseases, such as active cancer or cardiovascular disease. At each participating worksite, approximately 20 employees were enrolled on a first-come, first-served basis; enrollees at each worksite completed baseline assessments before they were informed of their randomization.
Eligibility
To be eligible to participate, worksites had to have been in operation for at least 3 years; have ≥300 employees with a low turnover rate (≤15%); have a postal address; and have contact information for a company representative who was willing to sign a consent form on behalf of his or her institution, complete a questionnaire for assessment of worksite eligibility, and facilitate employee outreach as well as on-site evaluations conducted by Tufts investigators. Sites were excluded at screening if they had recent, current, or impending on-site, commercially run well-being programs.
As outlined in the Consolidated Standards of Reporting Trials (CONSORT) chart (Figure 1), between September 2015 and February 2016, 155 worksites were recruited, 12 of which passed the initial screening questionnaire and were enrolled into the study. Eight (4 universities, 3 for-profit companies, and 1 nonprofit organization) worksites were randomized to the intervention group (179 participants), while 4 (1 university, 2 for-profit companies, and 1 nonprofit organization) worksites were randomized to the wait-listed control (83 participants). The 2.5-day intervention was provided between February and May 2016. The 12-month follow-up was completed between February and May 2017, and the 18-month follow-up was completed between September 2017 and February 2018.
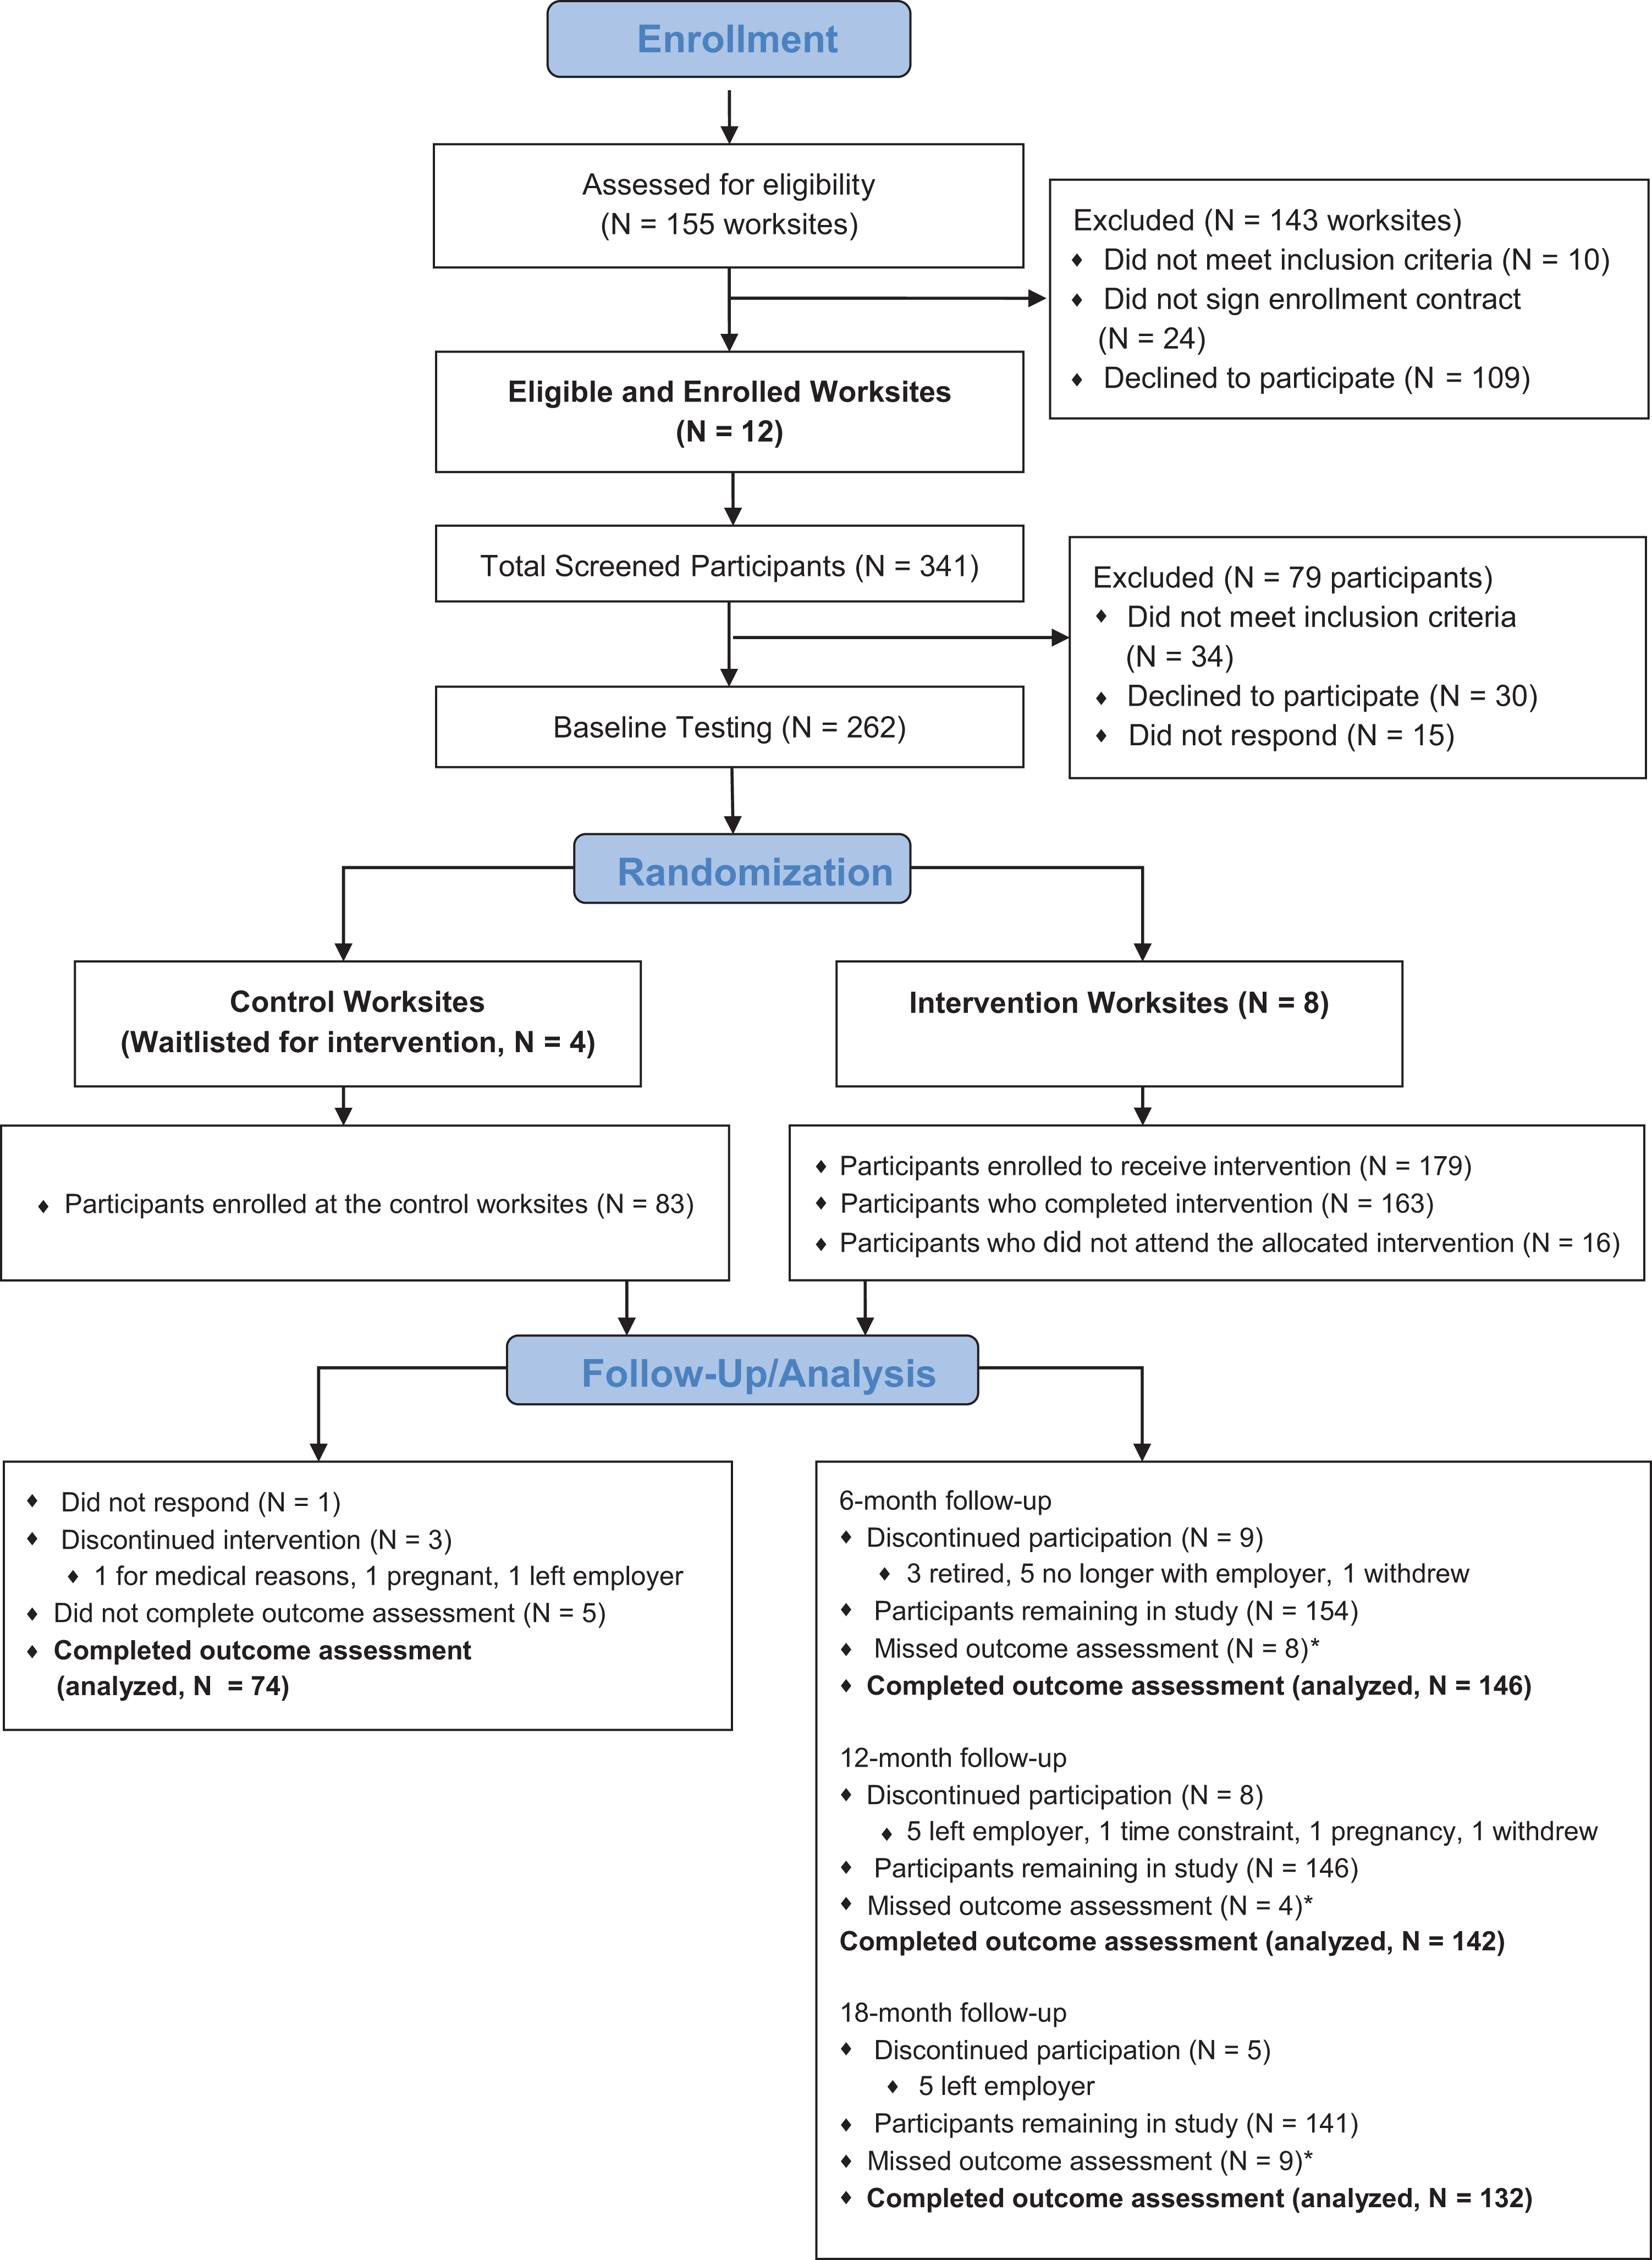
CONSORT Chart. *If a participant missed an outcome assessment but did not voluntarily discontinue participation, he or she remained in the study.
Intervention
The health and well-being intervention evaluated in this study was developed by the J&J-HPI and is commercially available for large-scale dissemination through Johnson & Johnson Health and Wellness Solutions, Inc. The program’s main component comprises 2.5 days of interactive sessions, which were delivered by trained coaches in a group-based, in-person format at locations separate from the workplace. Its supplementary component is comprehensive online support in the form of an e-course, which participants could access as needed. Our research focuses on the intervention’s main component, and our previous publication 13 describes in detail this 2.5-day program. Briefly, the J&J-HPI program uses a multidisciplinary approach rooted in performance psychology, exercise physiology, and nutrition to help maximize energy and promote lifelong behavior change. To accomplish its aim, the program blends cognitive behavioral therapy with acceptance and commitment therapy to directly target the participant’s thoughts, actions, emotional processing, and social interactions. 14 -16 The intervention uses 2 foundational models: the Energy Management Model and the Change Process Model. The former is designed to help employees develop attitudes, knowledge, skills, and behaviors that increase daily energy levels, align with their sense of PiL, and improve their overall functioning in and out of work; the latter guides participants to establish their own purpose or direction in life, candidly compare their current life with this desired direction, and create an “action plan” for making and sustaining change after program completion.
Measures
All outcomes in intervention participants were assessed at the worksites at baseline, 6, 12, and 18 months. Self-reported measures were collected by validated questionnaires using an electronic portal (ScienceTrax, Macon, Georgia) with an encrypted identification code unique to the employee. Questionnaires included (1) the Rand Medical Outcome Survey (MOS) 36-item Short Form (SF-36), 17,18 comprising 8 subscales (vitality [primary outcome], general health, bodily pain, physical functioning, mental health, role limitations due to physical problems, role limitations due to emotional problems, and social functioning); (2) the 14-item Ryff PiL Scale 19 -21 ; (3) the Center for Epidemiologic Studies Depression (CESD) Scale 22 ; (4) the Rand MOS Sleep Scale 23 ; (5) the Profile of Mood States (POMS) questionnaire 24 ; (6) the International Physical Activity Questionnaire (IPAQ) 25 ; and (7) the Three-Factor Eating Questionnaire, measuring restraint, disinhibition, and hunger. 26
Height was measured only at baseline to ±0.1 cm using a portable stadiometer (seca 213, seca GmbH & Co KG, Hamburg, Germany), and fasting weight (±0.1 kg) and body composition were measured using the Tanita TBF-300A total body composition analyzer (TANITA Corp, Tokyo, Japan). Waist and hip circumference was measured to ±0.3 cm using seca 201 measuring tape (seca GmbH & Co KG) and standard procedures. Blood pressure was measured to the nearest 1 mm Hg (3 measurements, 5 minutes apart after 5 minutes of quiet sitting) using the OMRON HEM-705CP Digital Blood Pressure Monitor (OMRON Healthcare Co, Ltd, Muko, Japan). Blood samples were collected by a finger stick. Fasting triglycerides, high-density lipoprotein, low-density lipoprotein (LDL), fasted glucose, and total cholesterol (TC) were measured using the Alere Cholestech LDX System (Alere San Diego, Inc, San Diego, California), and glycated hemoglobin (HbA1c) was measured using the Siemens DCA Vantage (Siemens Healthcare Point of Care Diagnostics, Norwood, Massachusetts).
Analysis
Data were examined for normality, and transformations were applied when needed with results back-transformed to their original scale for presentation and marked in table footnotes. Baseline characteristics of participants in the intervention and control sites were described, and differences between groups were evaluated using χ2 test for categorical variables and 2-sample t tests for continuous variables. No further analyses involved the control group participants.
The primary analyses were performed using general linear models with repeated measures. The main continuous outcomes were least square mean values of measures at baseline, 6, 12, and 18 months based on a repeated-measure analysis of covariance with an unstructured covariance matrix specified for the repeated measures. Binary outcomes were presented as prevalence or odds ratios (ORs) and 95% confidence intervals (CI) at baseline, 6, 12, and 18 months based on general estimating equations (GEE) models. Missing data were considered missing at random and addressed using maximum likelihood methods in the model specification for both continuous and binary outcomes. 27,28 Statistical comparisons were performed between the baseline value and each subsequent time point. To control for multiple comparisons, Dunnett adjusted P values were used for all mean comparisons. When results are reported for binary outcomes, the P values provided are for the equivalent GEE model but without adjustment for multiple comparisons, and a suggested P value cutoff based on a Bonferroni method (α/number of comparisons) was reported and used in determining significance. All models were adjusted for the following fixed effects: sex, age (years), ethnicity (white/nonwhite), and worksite. Analyses of cardiometabolic risk factors were additionally adjusted for corresponding medication use and smoking at baseline. For models that exhibited convergence issues, the 8 worksites were collapsed into 3 broad categories (nonprofit, for-profit, and mixed work-type).
Of the 8 measures scored from SF-36, those for general health and vitality were considered to have continuous but skewed distributions. For these measures, we performed a general linear model repeated-measures analysis with appropriate transformation. However, the remaining domains were not normally distributed and could not be sufficiently transformed for use as a continuous outcome. To examine the differences over time in these domains, we examined the scoring criteria and determined cut points that indicated participants were, on average, scoring in the highest 2 levels of that domain. We then calculated the percentage of participants falling in these high categories at each time point and compared these prevalence data at each follow-up interval using baseline as the referent time point. To provide a complete analysis, we determined cut points for all 8 domains and present the data for all SF-36 measures.
The POMS anger and depression scores had limited response values with the majority of the responses equaling 0. For these 2 measures, we categorized responses into greater than 0 or equal to 0 and report the mean prevalence of responses greater than 0. Depression was defined as a CESD score of 16 or higher. Since the prevalence data are based on binary outcomes, the P values provided for these measures were based on GEE models and are without adjustment for multiple comparisons. Total walking metabolic equivalent of task (MET) minutes and IPAQ summary scores were calculated using the IPAQ scoring criteria. Physical activity data were positively skewed (this is particularly true, given that the population is composed of healthy, working adults) and were analyzed on the natural log scale with geometric means presented.
Data analyses were performed using SAS version 9.4 (SAS Institute Inc, Cary, North Carolina). All testing was 2 sided, and results with P values <.05 were considered statistically significant for all continuous outcomes. P values for binary outcomes were considered statistically significant if less than the Bonferroni adjusted P value.
Secondary analyses using complete case and removing outliers >1.5 × interquartile range were performed with similar findings unless otherwise noted.
Results
As shown in the CONSORT chart (Figure 1), 179 participants were randomized to receive the intervention. This analysis pertains to these J&J-HPI participants only. (For context, there were no significant baseline differences between participants in the worksites randomized to receive the J&J-HPI intervention and those in the control worksites.) Of the 163 participants who completed the 2.5-day intervention, 57% were female and, on average, 47 (11) years old with a BMI of 26.6 kg/m2 (Table 1); 146 (89.6%) completed the 6-month follow-up, 142 (87.1%) completed the 12-month follow-up, and 132 (81%) completed the 18-month follow-up.
Baseline Characteristics of J&J-HPI Participants Versus Controls.
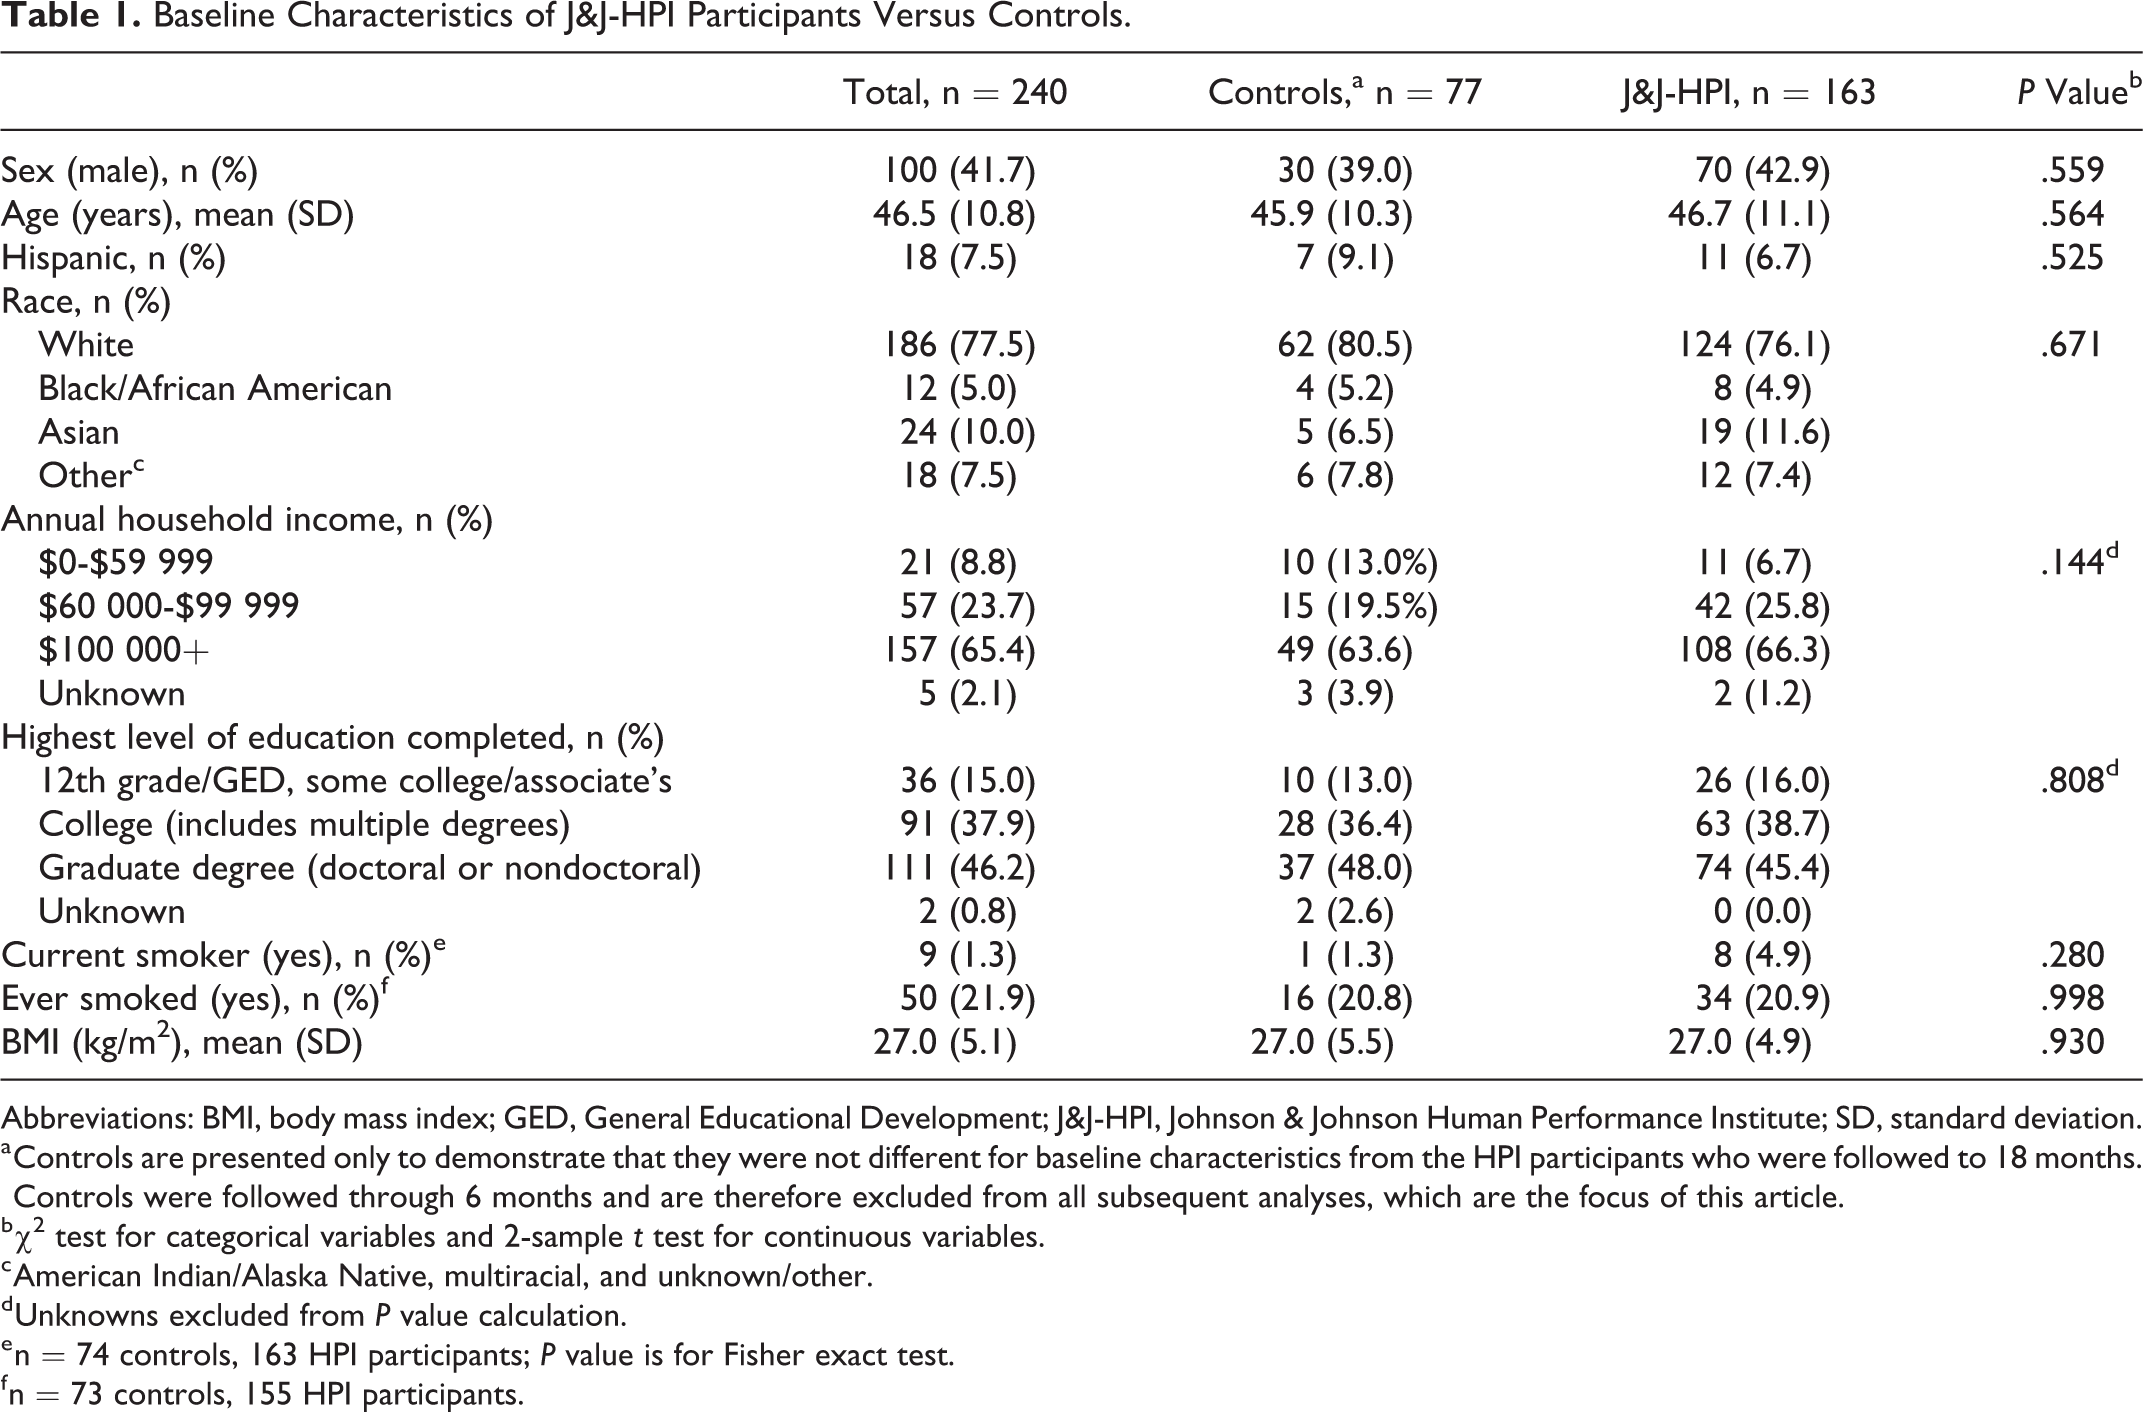
Abbreviations: BMI, body mass index; GED, General Educational Development; J&J-HPI, Johnson & Johnson Human Performance Institute; SD, standard deviation.
a Controls are presented only to demonstrate that they were not different for baseline characteristics from the HPI participants who were followed to 18 months. Controls were followed through 6 months and are therefore excluded from all subsequent analyses, which are the focus of this article.
b χ2 test for categorical variables and 2-sample t test for continuous variables.
c American Indian/Alaska Native, multiracial, and unknown/other.
d Unknowns excluded from P value calculation.
e n = 74 controls, 163 HPI participants; P value is for Fisher exact test.
f n = 73 controls, 155 HPI participants.
36-Item Short Form: Vitality and Other Domains
Participants reported, on average, greater mean general health scores (baseline: 70.1 vs 76.0, 75.8, and 76.0; P < .0001 for all time points) and greater vitality (baseline: 58.6 vs 69.7, 70.1, and 68.7; P < .0001 for all time points) at months 6, 12, and 18 compared to baseline.
The categorical analysis examining percentage of participants scoring in the highest categories of the SF-36 domains also supports these findings, with a higher percentage of participants scoring, on average, in the highest category for general health (P < .0001), mental health (P < .0001), and vitality (P < .0001) at each time point compared to baseline (Table 2). Participants had 2.8 to 3.3 greater odds of being in the top 2 categories for vitality at each follow-up time point than at baseline (month 6: OR: 2.84, 95% CI: 1.78-4.53; month 12: OR: 3.37, 95% CI: 2.15-5.28; month 18: OR: 3.01, 95% CI: 1.83-4.94; P < .001; Supplemental Table 1).
Adjusted Mean Percent and 95% Confidence Intervals of Participants Scoring in the Highest 2 Categories of the SF-36 Health Survey Domains and Ryff Purpose in Life Measure Over Time.a
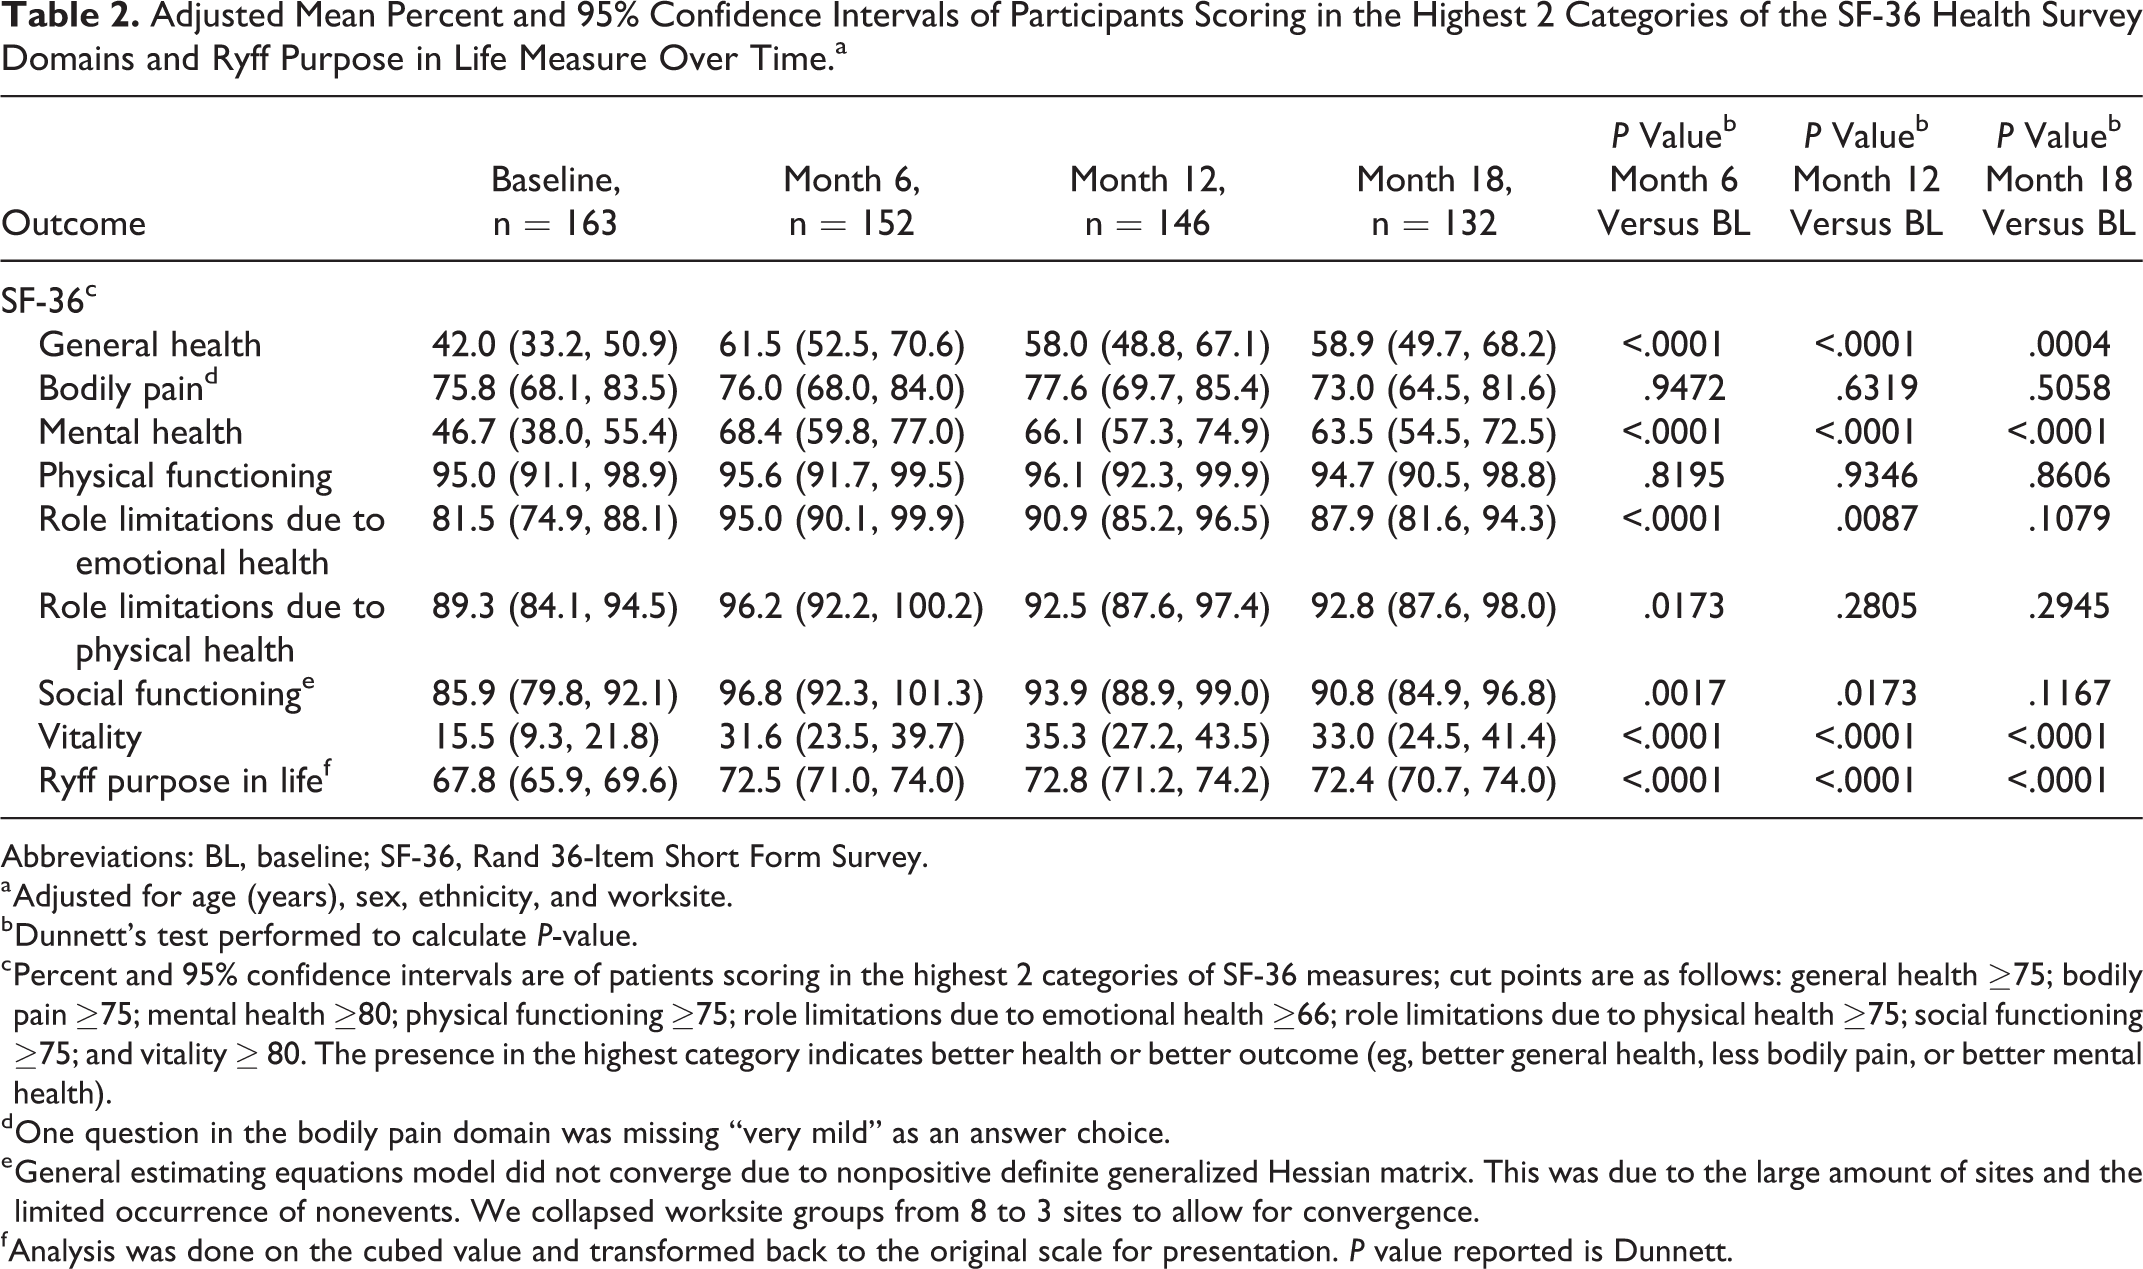
Abbreviations: BL, baseline; SF-36, Rand 36-Item Short Form Survey.
a Adjusted for age (years), sex, ethnicity, and worksite.
b Dunnett’s test performed to calculate P-value.
c Percent and 95% confidence intervals are of patients scoring in the highest 2 categories of SF-36 measures; cut points are as follows: general health ≥75; bodily pain ≥75; mental health ≥80; physical functioning ≥75; role limitations due to emotional health ≥66; role limitations due to physical health ≥75; social functioning ≥75; and vitality ≥ 80. The presence in the highest category indicates better health or better outcome (eg, better general health, less bodily pain, or better mental health).
d One question in the bodily pain domain was missing “very mild” as an answer choice.
e General estimating equations model did not converge due to nonpositive definite generalized Hessian matrix. This was due to the large amount of sites and the limited occurrence of nonevents. We collapsed worksite groups from 8 to 3 sites to allow for convergence.
f Analysis was done on the cubed value and transformed back to the original scale for presentation. P value reported is Dunnett.
A higher percentage of participants also reported fewer role limitations due to emotional health and better social functioning at months 6 and 12 compared to baseline; however, the association for better social functioning at month 12 was no longer significant after adjustment for multiple comparisons (Table 2; a statistically significant value after adjusting for multiple comparisons is P < .016 [0.05/3 comparisons]). Compared to baseline, participants at 6 months had 3.57 greater odds of being in the top 2 categories for fewer role limitations due to emotional health (OR: 3.57, 95% CI: 1.93-6.62, P < .001). The odds were 2.13 times greater at 12 months (95% CI: 1.21-3.76, P = .009) and 1.66 times greater at 18 months, though the latter was not statistically significant (OR: 1.66, 95% CI: 0.90-3.06, P = .108). In social functioning, participants had 3.84 greater odds of being in the top 2 categories at 6 months than at baseline (OR: 3.84, 95% CI: 1.66-8.90, P = .002), but the association was no longer significant at months 12 or 18 (month 12: OR: 2.48, 95% CI: 1.17-5.25, P = .017; month 18: OR: 1.64, 95% CI: 0.88-3.04, P = .12; Supplemental Table 1).
Ryff PiL Scale
Participants, on average, reported increased PiL at months 6, 12, and 18 compared to baseline (P < .0001; Table 2).
Sleep Measures
Compared to baseline, participants reported a statistically significant reduction in mean sleep problem indices (I and II) and somnolence at months 6 and 12 (P < .0001 for both indices at both time points) and at month 18 (P < .005 for both indices at both time points). Participants also reported, on average, less sleep disturbance and better sleep quality at months 6 and 12 (P < .05), as well as better sleep adequacy at months 6, 12, and 18 months (P < .05) compared to baseline (Table 3). Lastly, participants reported a higher mean prevalence of optimal sleep at month 6 compared to baseline (P = .003), but this difference was not sustained at month 12 or 18. No statistically significant difference was observed for shortness of breath at months 6, 12, or 18 compared to baseline. Results of a complete case analysis were similar with the exception of sleep quantity, which became nonsignificant at month 6 compared to baseline (data not shown).
Adjusted Means and 95% Confidence Intervals of Lifestyle and Behavioral Factors Over Time.
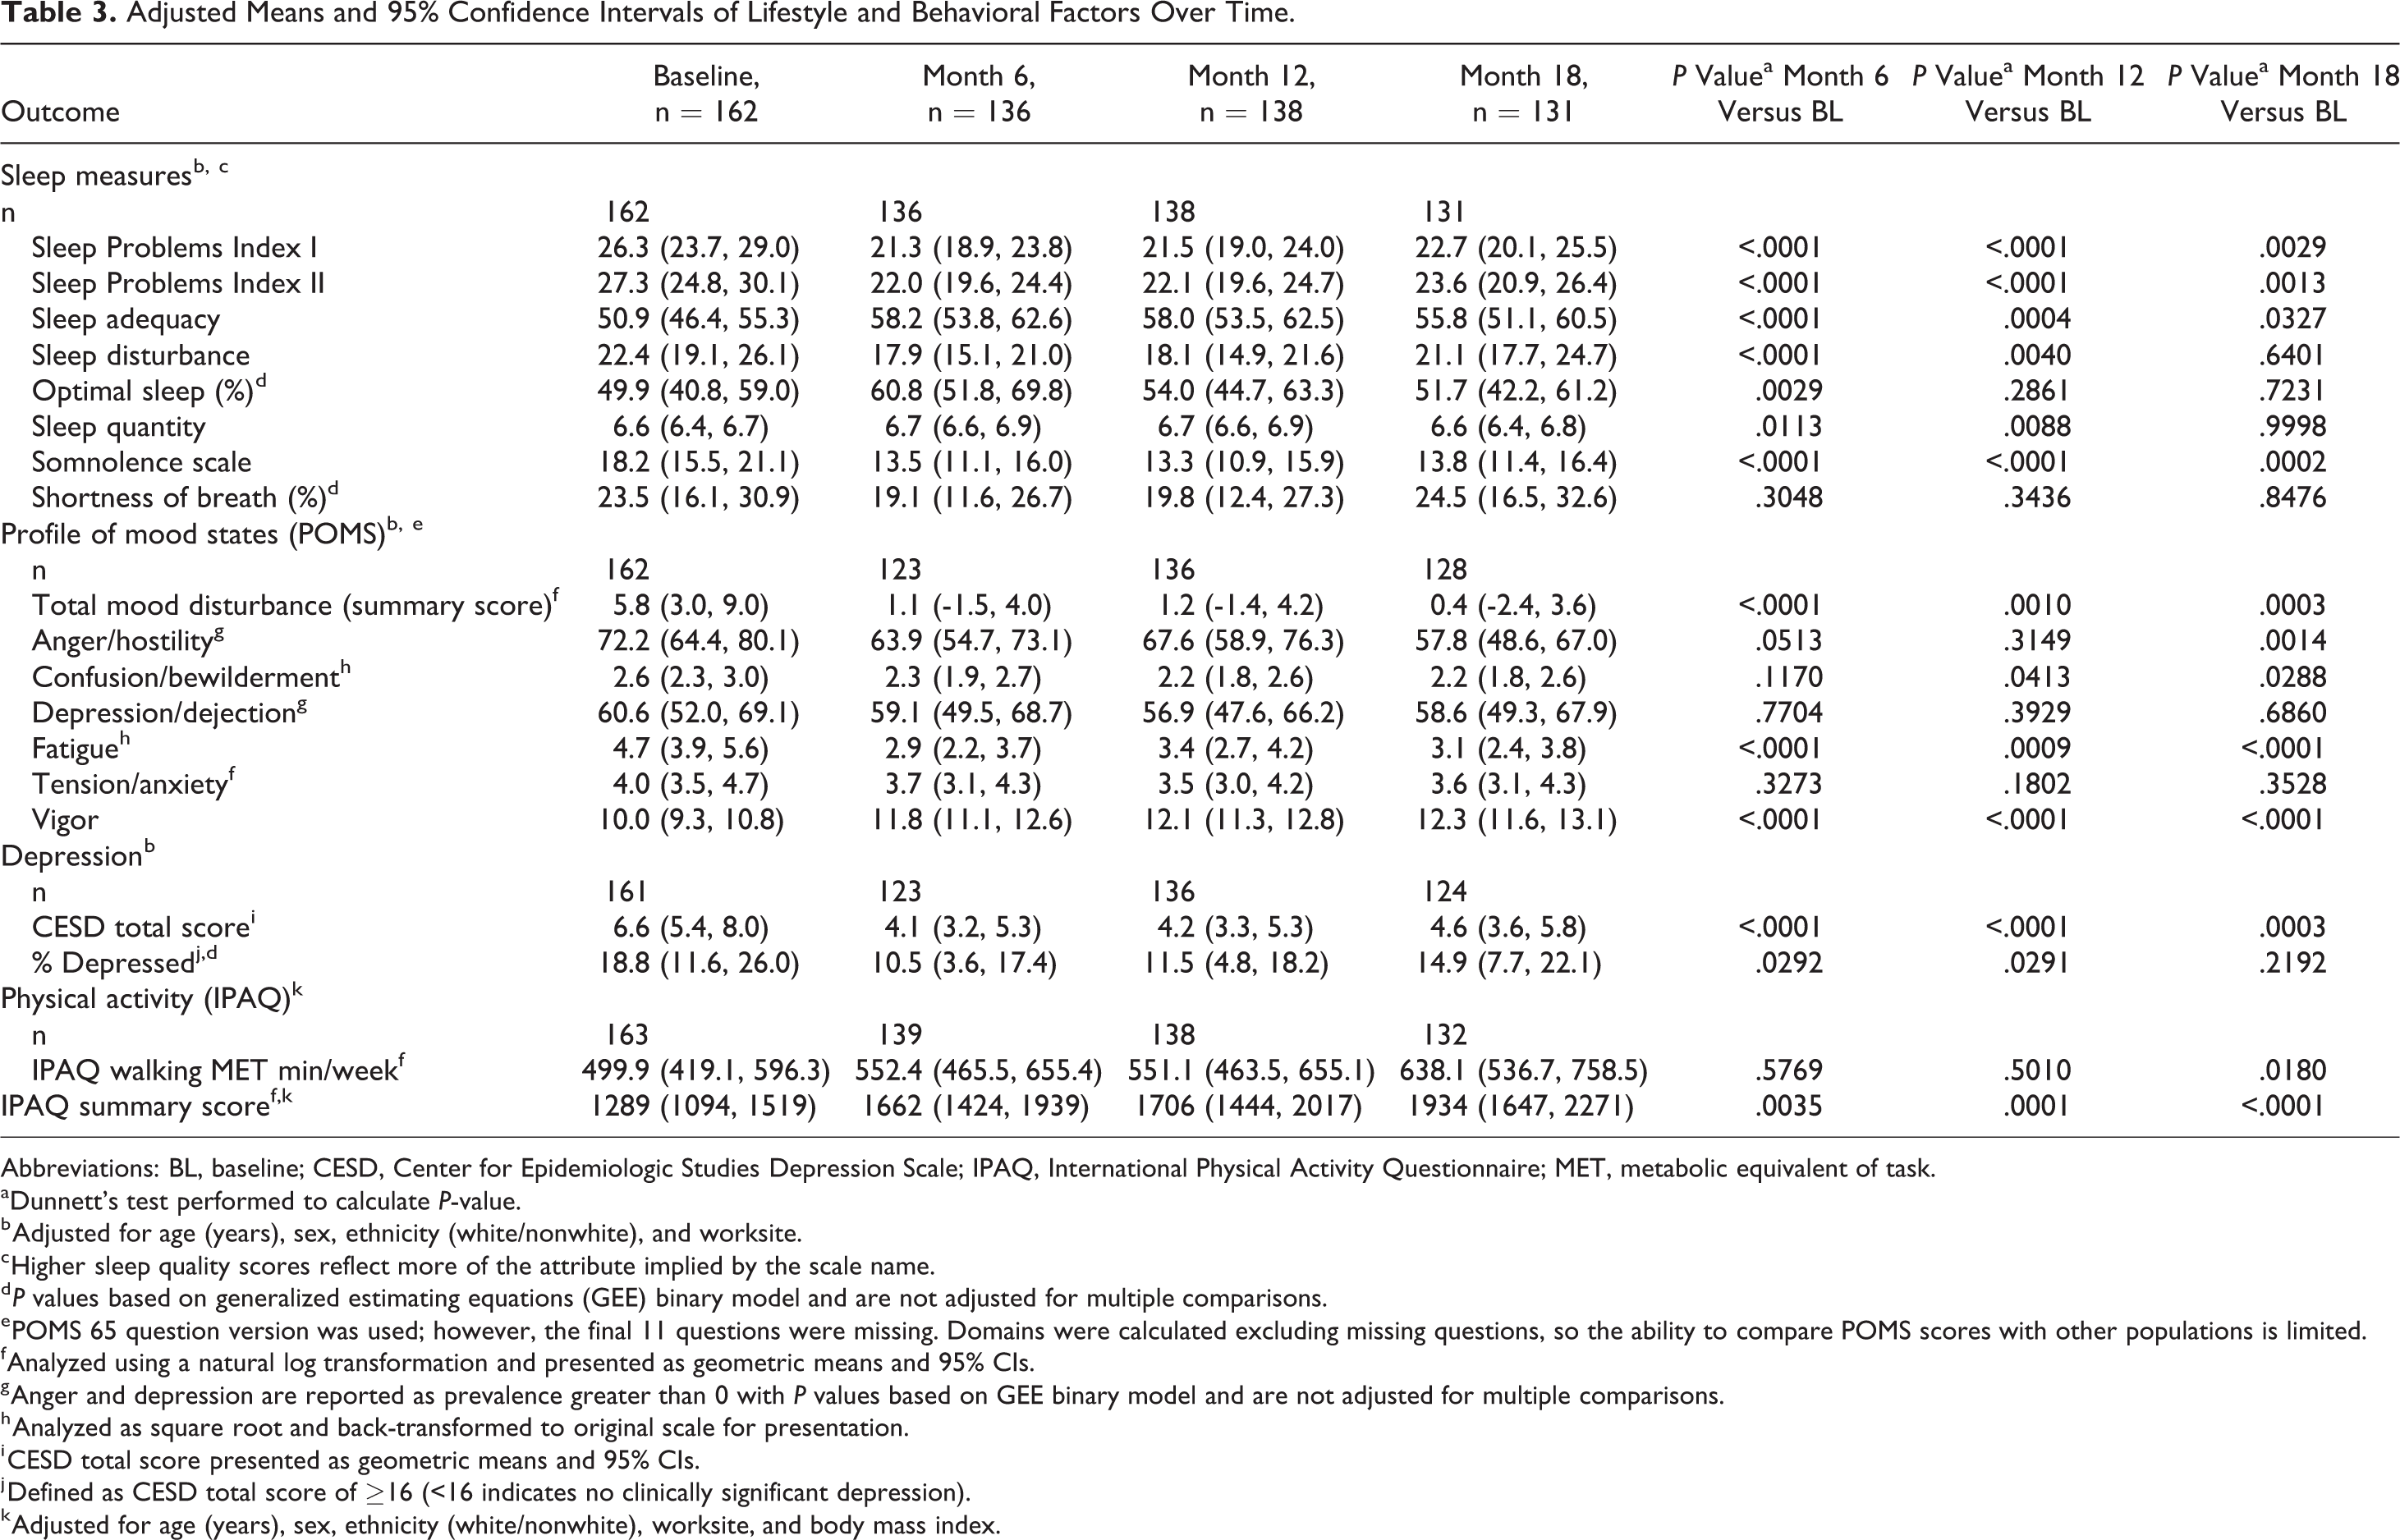
Abbreviations: BL, baseline; CESD, Center for Epidemiologic Studies Depression Scale; IPAQ, International Physical Activity Questionnaire; MET, metabolic equivalent of task.
aDunnett’s test performed to calculate P-value.
b Adjusted for age (years), sex, ethnicity (white/nonwhite), and worksite.
c Higher sleep quality scores reflect more of the attribute implied by the scale name.
d P values based on generalized estimating equations (GEE) binary model and are not adjusted for multiple comparisons.
e POMS 65 question version was used; however, the final 11 questions were missing. Domains were calculated excluding missing questions, so the ability to compare POMS scores with other populations is limited.
f Analyzed using a natural log transformation and presented as geometric means and 95% CIs.
g Anger and depression are reported as prevalence greater than 0 with P values based on GEE binary model and are not adjusted for multiple comparisons.
h Analyzed as square root and back-transformed to original scale for presentation.
i CESD total score presented as geometric means and 95% CIs.
j Defined as CESD total score of ≥16 (<16 indicates no clinically significant depression).
k Adjusted for age (years), sex, ethnicity (white/nonwhite), worksite, and body mass index.
Profile of Mood States
Participants showed statistically significant reductions in mean total mood disturbance and fatigue, as well as a significant increase in vigor scores, at months 6, 12, and 18 compared to baseline (Table 3); these associations held after removal of outliers. Mean prevalence of anger was lower at months 6, 12, and 18 compared to baseline, but only reached statistical significance at month 18 (P = .001). Mean prevalence of confusion/bewilderment also was lower at months 6, 12, and 18, but only reached statistical significant at months 12 and 18 (P < .05). There were no statistically significant differences between mean baseline and follow-up measures for the remaining POMS domains (anger/hostility, confusion/bewilderment, depression/dejection, and tension/anxiety). Results of a complete case analysis were similar with the exception of confusion/bewilderment, which became nonsignificant at months 12 and 18 compared to baseline (data not shown).
Center for Epidemiologic Studies Depression
Compared to baseline, mean depression scores (CESD total scores) were significantly lower at months 6 and 12 (P < .0001 for both time points) and at month 18 (P = .0003). There was also a modest reduction in the prevalence of depression at months 6, 12, and 18 compared to baseline, which was statistically significant at months 6 and 12 (P < .05) after adjustment for multiple comparisons, but not at month 18 (Table 3).
International Physical Activity Questionnaire
Mean walking MET minutes were not significantly different from baseline for months 6 and 12 but were significantly different for month 18 (P =.018; Table 3). Participants showed a statistically significant increase in total physical activity score (IPAQ score), which accounts for minutes per week engaged in walking, moderate-intensity activity, and vigorous-intensity activity, at months 6, 12, and 18 compared to baseline (P = .0035, .0001, <.0001, respectively; Table 3).
Anthropometric Measurements
There were no statistically significant differences from baseline at months 6, 12, and 18 for body weight, BMI, and body fat. Waist-to-hip ratio was significant at months 12 and 18 compared to baseline (P = .031; Table 4). Mean hip circumference was statistically lower at months 6, 12, and 18 compared to baseline (P < .0001 for all time points). Waist circumference, on average, was lower at months 6, 12, and 18 and achieved statistical significance at months 12 (P < .001) and 18 (P = .041). Results from the complete case analysis were similar with the exception of waist circumference, which became nonsignificant at month 18 compared to baseline (data not shown).
Adjusted Means and 95% Confidence Intervals of Anthropometric Measurements and Cardiometabolic Risk Factors Over Time.
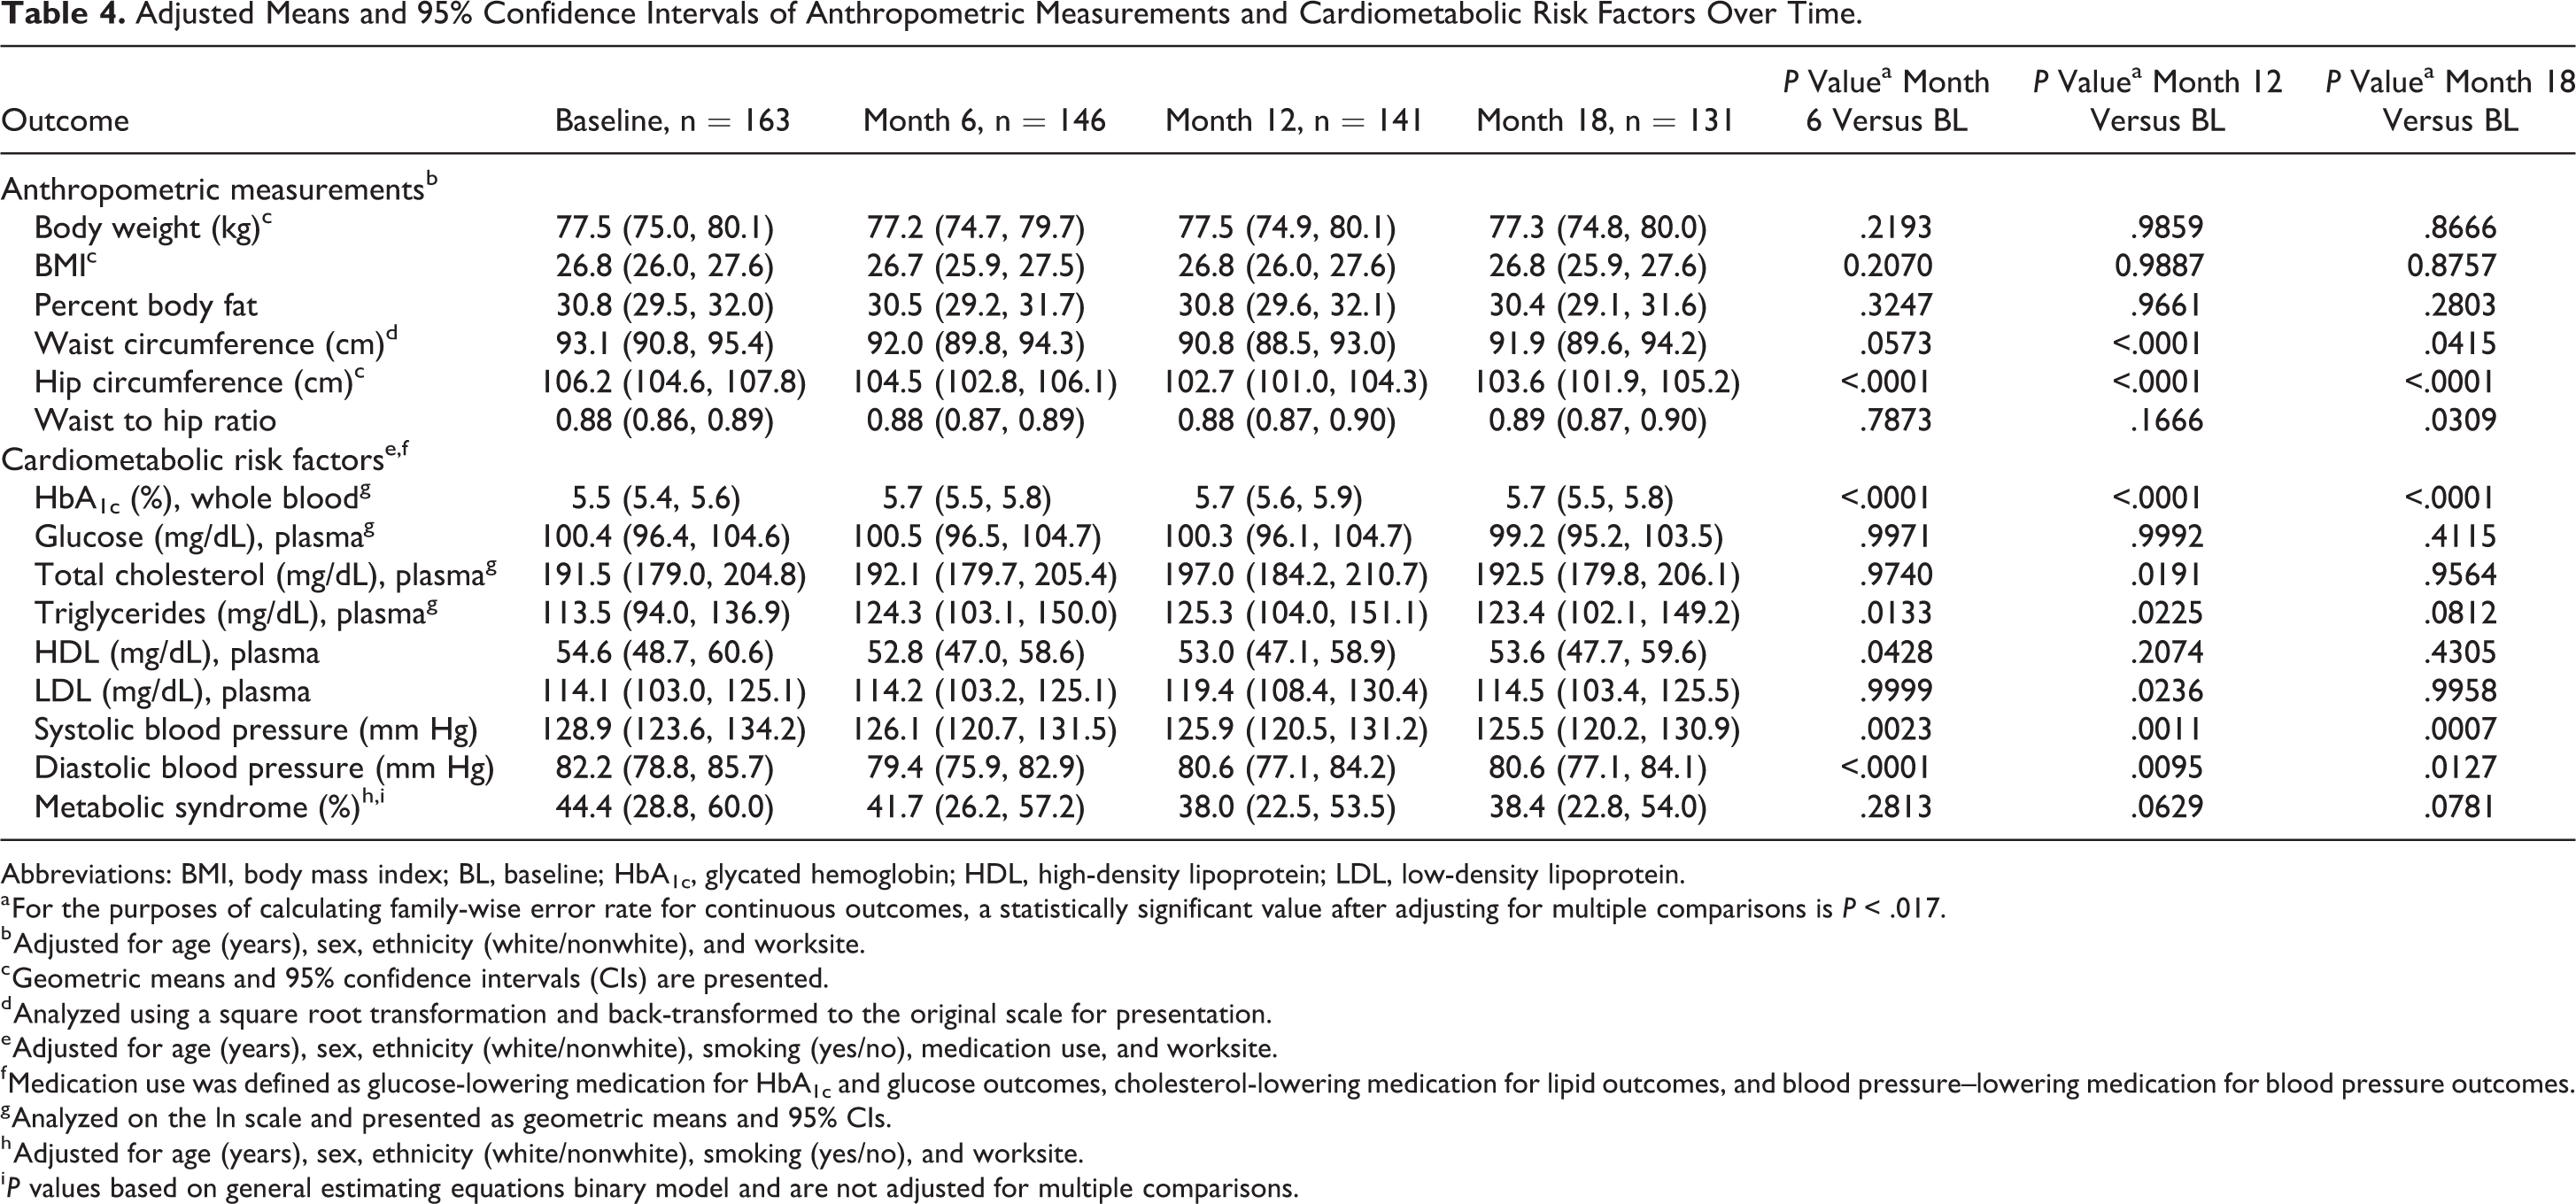
Abbreviations: BMI, body mass index; BL, baseline; HbA1c, glycated hemoglobin; HDL, high-density lipoprotein; LDL, low-density lipoprotein.
a For the purposes of calculating family-wise error rate for continuous outcomes, a statistically significant value after adjusting for multiple comparisons is P < .017.
b Adjusted for age (years), sex, ethnicity (white/nonwhite), and worksite.
c Geometric means and 95% confidence intervals (CIs) are presented.
d Analyzed using a square root transformation and back-transformed to the original scale for presentation.
e Adjusted for age (years), sex, ethnicity (white/nonwhite), smoking (yes/no), medication use, and worksite.
f Medication use was defined as glucose-lowering medication for HbA1c and glucose outcomes, cholesterol-lowering medication for lipid outcomes, and blood pressure–lowering medication for blood pressure outcomes.
g Analyzed on the ln scale and presented as geometric means and 95% CIs.
h Adjusted for age (years), sex, ethnicity (white/nonwhite), smoking (yes/no), and worksite.
i P values based on general estimating equations binary model and are not adjusted for multiple comparisons.
Cardiometabolic Health
Participants had significantly higher mean HbA1c at months 6, 12, and 18 compared to baseline (P < .0001; Table 4). Mean triglycerides were higher at months 6 and 12 compared to baseline (P < .05), but were no longer significantly different by month 18 (P = .081). Mean TC and LDL were higher at month 12 than at baseline (P = .019 for TC; P = .024 for LDL), but were not significantly different from baseline at month 6 or 18. However, participants had significantly lower mean systolic and diastolic blood pressure at months 6, 12, and 18 compared to baseline (P = .0007 at 18 months for systolic, P = .013 at 18 months for diastolic; Table 4).
Although participants did have a slightly lower prevalence of metabolic syndrome at each follow-up time point, we did not see a statistically significant difference in metabolic syndrome prevalence compared to baseline (P = .281 at 6 months, P = .063 at 12 months, and P = 0.078 at 18 months; Table 4).
In a complete case analysis, TC and triglycerides were slightly lower across all time points but changes remained nonsignificant. Estimates for metabolic syndrome were similarly consistent across time points in a complete case analysis.
Discussion
Our findings show that a wellness program targeting QoL can support long-term changes in the well-being of working adults. Employees in the program demonstrated sustained improvements in vitality and PiL, as well as other key QoL measures, over the 18-month study period. By 18 months, participants had maintained an average increase in baseline vitality scores of 17%, indicating a 10-point improvement in scores captured prior to receipt of the program. In a previous report on 6-month outcomes, we observed significant improvements in vitality and PiL in participants receiving the program versus those who did not (controls). 13 Our short- and long-term findings suggest that the skills and education obtained by employees in the wellness program contributed to sustained benefits in overall well-being. The extension of QoL benefits from 6 to 18 months is particularly notable, as the program’s main component is intensive yet brief.
Demands of the modern workplace often leave little time for employees to recharge. When people are chronically exposed to such demands, they can experience low energy levels and suboptimal work performance. 29,30 Vitality, or the “experience of having energy available to one’s self,” 31(p356) is a key component of work engagement and overall well-being. Previous studies have shown that vitality is associated with a range of positive health and wellness indicators, including self-determination, healthy lifestyle behaviors, a balanced workstyle, sustainable employability, effective personal functioning, and social capital. 1 However, worksite interventions aimed at improving vitality over the long term have produced mixed results, with some demonstrating no changes 32 -34 and others significant improvements. 10,35,36 Among the studies observing no long-term changes in vitality, low compliance to the intervention was identified as a major obstacle, and, in one of these studies, 32 favorable changes in general and work-related vitality over 12 months were observed in a subgroup of high compliers only. These findings reinforce the importance of implementing high impact worksite interventions that focus on engagement and compliance. The program evaluated in the current study, whose main feature is an interactive format delivered within a tight time frame, is one promising example.
Life purpose, or the feeling that one’s life is good, meaningful, and worthwhile, has far-reaching benefits, including productivity and engagement in the workplace. 37,38 In our study, participants experienced a significant improvement in PiL over 18 months. The intervention’s effect on PiL is remarkable and calls for further research evaluating its impact beyond 18 months. If the effect can be sustained over time, it could have major implications for working adults in terms of productivity and engagement. A recent study showed that in working and retired adults older than 50 years, stronger life purpose was associated with lower all-cause mortality, 39 suggesting the importance of PiL-focused approaches to improving the health, well-being, and retention of older adults in the workforce. 9
Our findings also show sustained improvements in other QoL measures, such as sleep quality, sleep quantity, mood, and vigor, as well as reduced feelings of depression. These indicators of mental health have been identified as key contributors to well-being. The additional finding of improved health behaviors, including higher dietary restraint and physical activity, suggests that positively reinforcing behaviors—if sustained over time—could reduce morbidity and increase health-related QoL. However, the improvements in role limitations due to emotional problems (at 6 and 12 months) and physical health (at 6 months) were not significantly sustained over the long term. Programmatic adjustments, such as optional refresher sessions targeting these areas, may improve participant outcomes for these domains.
In our study, participants experienced significant improvements in some (blood pressure, waist and hip circumference), but not all, clinical outcome measures. There are several potential explanations for these mixed outcomes. First, participants in this study had optimal values for blood measures at baseline, which may have limited the detection of statistically significant improvements across all measures. Second, the increase in some cardiometabolic risk factors mirrors the progression of cardiometabolic health over the adult life span; however, due to the observational nature of our study, we cannot infer causality. Still, the observed improvements in some clinical outcome measures, coupled with those for QoL, suggest that strategic delivery of 2 distinct but compatible interventions—for example, one targeting QoL and the other metabolic health and risk factors for chronic disease—may have positive synergistic effects. Interventions targeting physical health may also indirectly enhance vitality and PiL, which may be critical to the well-being of working adults. 9
A recent large worksite study evaluating a multicomponent wellness intervention reported changes in health behaviors, but not clinical measures, at 18 months. Among other limitations, the authors cite incomplete data for over half of the employees enrolled in the study. 40 Missing data limit the ability of researchers to interpret their work and could be mistaken for low program efficacy. However, these findings should not detract from research efforts to identify robust worksite wellness programs that have been thoroughly evaluated for efficacy and return on investment.
Key strengths of our study include the high fidelity of the J&J-HPI program, which is delivered by trained coaches using a standardized format. The program was independently evaluated for long-term sustainable impact, with over 80% of participants completing outcome measures at each follow-up. In addition, 91% of employees who were randomized to receive the intervention attended and completed its 2.5-day program, which may reflect the intensive but brief format.
Limitations of this study include the lack of cost-effectiveness analysis, the lack of a control group beyond 6 months, and generalizability. Cost-effectiveness of the intervention, though critical to scale-up efforts, did not fall within the scope of this study. Further research is needed to determine whether wellness programs can offset employer expenses due to absenteeism, reduced productivity, and other factors related to QoL. Next, although the wait-listed control group relegates this longer term analysis to a within-group comparison, it was designed in favor of data quality and retention: Because nonactive controls receive no perceived benefit from participation, the likelihood of attrition may increase, 41 and high attrition can reduce the validity of between-group comparisons, particularly at later time points. Our findings are also limited to office-based employees and may not be generalizable to individuals performing heavy manual labor or other non–office-based work. Further, due to study resources, employee participation was capped at approximately 20 per worksite, and eligible employees were enrolled on first-come, first-served basis. This design may have led to a disproportionate enrollment of eager, health-conscious individuals, which could have favorably skewed outcomes and retention rates. In considering these limitations, we recommend future studies that evaluate the intervention at population level, offer equal enrollment opportunity for eligible employees, and address the research gap of cost-effectiveness in relation to health-care costs.
So What?
What is already known on this topic?
Employee well-being has a direct impact on productivity and health-care costs. Since the average employed adult spends a significant amount of time at work, researchers have recognized the workplace as an ideal setting for disseminating wellness programs. Many employers have followed suit, promoting a culture of well-being in the workplace by adopting on-site wellness initiatives.
What does this article add?
Although programs focused on employee well-being have gained momentum in recent years, few have been rigorously evaluated for long-term impact on health and wellness. Our study reports that 18 months after completing an intensive 2.5-day wellness program, employees experienced improvements in vitality (energy), PiL, sleep, and other QoL measures.
What are the implications for health promotion practice or research?
Studies examining the long-term impact of worksite-based interventions are urgently needed. Although there is a continued focus on employee health and well-being, high-quality studies that rigorously examine the specifics of psychological interventions (eg, QoL measures and overall effectiveness) are somewhat limited. Our findings suggest that wellness programs, such as the one examined here, may be implemented not only to enhance the psychological well-being of employees but also to supplement other health-related interventions. Further research is required to determine whether sustained improvements in psychological well-being reduce medical expenditure and health-care costs. Our findings also support future studies evaluating this and similar employer-based wellness initiatives, which could be combined to maximize benefits for employers and their workforce.
In summary, employees from 8 worksites in Greater Boston reported sustained improvements in vitality and PiL over 18 months after participating in a brief but intensive commercial wellness program (J&J-HPI). Other QoL measures, including sleep, mood, and vigor, were also improved. These findings demonstrate benefits of value to employers and underscore the importance of evaluating different types of wellness programs to address the diverse needs of the US workforce.
Supplemental Material
Supplemental Material, Das_HPI_18M_CONSORTchecklist - Sustained Long-Term Effectiveness of an Energy Management Training Course on Employee Vitality and Purpose in Life
Supplemental Material, Das_HPI_18M_CONSORTchecklist for Sustained Long-Term Effectiveness of an Energy Management Training Course on Employee Vitality and Purpose in Life by Sai Krupa Das, Shawn T. Mason, Taylor A. Vail, Caroline M. Blanchard, Meghan K. Chin, Gail T. Rogers, Kara A. Livingston and Jennifer L. Turgiss in American Journal of Health Promotion
Supplemental Material
Supplemental Material, Das_HPI_18M_S1 - Sustained Long-Term Effectiveness of an Energy Management Training Course on Employee Vitality and Purpose in Life
Supplemental Material, Das_HPI_18M_S1 for Sustained Long-Term Effectiveness of an Energy Management Training Course on Employee Vitality and Purpose in Life by Sai Krupa Das, Shawn T. Mason, Taylor A. Vail, Caroline M. Blanchard, Meghan K. Chin, Gail T. Rogers, Kara A. Livingston and Jennifer L. Turgiss in American Journal of Health Promotion
Footnotes
Authors’ Note
The program tested and evaluated in this research is a commercial product developed by Johnson and Johnson’s Human Performance Institute (HPI). The program, commercially known as the HPI “Performance 2.5 Day,” is a training course typically offered to employees, and participants in this research study received the program free of charge from HPI’s trained coaches. As noted, this trial was sponsored by Johnson & Johnson; however, the evaluations were conducted independently by Tufts investigators, and Johnson & Johnson was contractually prevented from accessing the data, influencing the messaging, or publishing the results of this report. Mason and Turgiss, as employees of Johnson & Johnson Health and Wellness Solutions, Inc, participated in the manuscript review and editing that precluded aspects related to the interpretation of data and findings. They had no role in data collection, did not have access to the raw data, and were not involved in the statistical analyses. Any opinions, findings, conclusion or recommendations expressed in this publication are those of the authors and do not necessarily reflect the view of the US Department of Agriculture or Johnson & Johnson, Health and Wellness Solutions, Inc.
Acknowledgments
The authors thank the participating worksites for their enthusiasm and engagement and all the participants for their time and commitment. They also thank Mira Kahn, MPH, and Edward Martin, MS, for their dedication and support with recruitment and data collection.
Declaration of Conflicting Interests
The authors declared the following potential conflicts of interest with respect to the research, authorship, and/or publication of this article: Mason and Turgiss are employed by Johnson & Johnson, Health and Wellness Solutions, Inc.
Funding
The authors disclosed receipt of the following financial support for the research, authorship, and/or publication of this article: Funding was provided to Tufts University by Johnson & Johnson, Health and Wellness Solutions, Inc.
Supplemental Material
Supplemental material for this article is available online.
References
Supplementary Material
Please find the following supplemental material available below.
For Open Access articles published under a Creative Commons License, all supplemental material carries the same license as the article it is associated with.
For non-Open Access articles published, all supplemental material carries a non-exclusive license, and permission requests for re-use of supplemental material or any part of supplemental material shall be sent directly to the copyright owner as specified in the copyright notice associated with the article.