
Abstract
The authors use data on high school students and teachers from Washington state to connect the observable characteristics and preparation of career and technical education (CTE) teachers to various non-test outcomes (absences, disciplinary incidents, grades, grade progression, and on-time graduation) of students with and without disabilities in their classrooms. The authors find that students participating in CTE tend to have better non-test outcomes when they are assigned to a CTE teacher from the state’s Business and Industry (B&I) pathway—designed for CTE teachers with 3 years of industry experience but no formal teacher preparation—relative to being assigned to a traditionally prepared CTE teacher. These relationships do not significantly differ for students with and without disabilities, despite survey data suggesting that CTE teachers from the B&I pathway receive little formal training in special education. These results suggest that content knowledge and experience may matter more than traditional preparation for CTE teacher effectiveness.
Keywords
A large body of research finds that teachers have significant impacts on student outcomes. Much of this literature relies on test scores as the outcome measure (e.g., Aaronson et al., 2007; Goldhaber & Hansen, 2013; Rivkin et al., 2005; Rockoff, 2004), but newer research finds that teachers also influence students’ non-test outcomes (Backes et al., 2022b; Backes & Hansen, 2018; Gershenson, 2016; Jackson, 2018; Kraft, 2019; Liu & Loeb, 2021). The evidence on teachers’ impacts on these non-test outcomes like attendance, grade progression, and disciplinary incidents—also called “academic and (social-) behavioral outcomes” in the special education literature (e.g., Moeyaert et al., 2021; Sutherland & Wehby, 2001)—has focused overwhelmingly on elementary education teachers or secondary teachers in “core academic subjects” such as math, science, English, and social studies.
On the contrary, almost no empirical attention has been paid to the nearly 20% of the teacher workforce (U.S. Department of Education, 2012) in subjects outside of these core subject areas. Teachers in career and technical education (CTE) represent nearly 5% of the overall public teaching workforce and more than 10% of the high school teaching workforce (U.S. Department of Education, 2012). A focus on non-test outcomes is likely to be particularly important for understanding the contribution that CTE teachers make toward outcomes for students with disabilities (SWDs), as policymakers have expressed concerns about test-based measures of the learning outcomes of SWD, and such measures have faced a number of court challenges (Katsiyannis et al., 2007). There is some evidence that CTE participation predicts later outcomes such as high school graduation, employment, and earnings for SWDs (e.g., Dougherty et al., 2018; Lee et al., 2016; Plasman & Gottfried, 2018; Theobald et al., 2019; Wagner et al., 2006), but surprisingly, there is no empirical research on how and whether CTE teachers contribute to these relationships specifically for SWDs.
In this article, we build on the limited evidence (e.g., Chen et al., 2023) that focuses on CTE teachers by connecting the observable characteristics of CTE teachers to student non-test outcomes. Specifically, we use comprehensive data on high school students in Washington state—which connect students’ CTE course-taking, CTE teacher assignments, and the preparation and licensure pathways of those teachers to a suite of non-test outcomes for those students—to address two specific research questions (RQs):
The remainder of the introduction provides additional motivation and background for these RQs.
Rationale for Study
The primary motivation for this article is that effective CTE instruction is a potentially important policy lever for improving non-test outcomes for high school students and SWDs in particular. A focus on SWDs is important because these outcomes for SWDs tend to lag far behind those of their peers both nationally (e.g., Newman et al., 2010) and in the focal state of this study, Washington (Theobald et al., 2019). Emerging evidence suggests that CTE may be a promising avenue for closing these gaps, which is important because SWDs are significantly more likely to be enrolled in CTE courses relative to non-SWDs (Theobald et al., 2022).
Specifically, four recent studies—all of which use rigorous statistical methods to control for baseline differences between SWDs who do and do not participate in CTE—connect CTE coursework to improved non-test outcomes for SWDs (Dougherty et al., 2018; Lee et al., 2016; Theobald et al., 2019; Wagner et al., 2006). For example, prior research from Washington (Theobald et al., 2019) finds positive associations between the concentrated participation of SWDs in CTE courses and the probability that SWDs graduate from high school, conditional on prior student performance and other observable student characteristics.
However, there is very little evidence about why, and under what conditions, CTE instruction may lead to improved outcomes for all students, including SWDs. Given that a large body of research over the past several decades shows teachers are consistently the most important schooling attribute influencing student testing outcomes (e.g., Rivkin et al., 2005; Rockoff, 2004), a natural focus is on the role that CTE teachers play in these relationships. However, empirical research on CTE teachers has likely been limited by two significant concerns about the use of test-based measures to evaluate schooling outcomes for SWDs and the impact of CTE participation. First, researchers have raised many empirical concerns about the validity of test scores as an outcome measure for SWDs (e.g., Baker et al., 2010; Buzick & Jones, 2015; Jones et al., 2013; McCaffrey & Buzick, 2014; Steinbrecher et al., 2014). Second, test scores may not capture the contribution that CTE teachers make toward students’ education (Borghans et al., 2008; Heckman & Rubinstein, 2001; Lindqvist & Vestman, 2011; Waddell, 2006).
Therefore, this article draws from recent research investigating teachers’ contributions to K–12 non-test outcomes, which tends to show that teachers’ effects on non-test K–12 outcomes are not highly correlated with their effects on student test scores (Backes et al., 2022b; Backes & Hansen, 2018; Gershenson, 2016; Jackson, 2018; Kraft, 2019; Liu & Loeb, 2021). Moreover, Jackson (2018) and Liu and Loeb (2021) have shown that teachers’ contributions to these non-test outcomes like absences, grade progression, and disciplinary incidents are more highly correlated with high school graduation outcomes than teachers’ contributions to test score gains.
A second motivation for this study comes from concerns that not all CTE teachers have the specialized pedagogical training necessary to address the needs of SWD; for instance, universities operate separate general education and special education programs, and CTE teacher preparation is housed within general education programs (Wolfe et al., 2000). Moreover, many states—including Washington, the setting of this study—have adopted alternative pathways for CTE teachers to enter the classroom with even less pedagogical preparation than teachers would typically receive if they obtained their licenses through traditional college- and university-based teacher education programs. Concerns about pedagogical preparation for SWDs in CTE classrooms are noted by CTE teachers themselves; for example, Walter and Gray (2002) found that CTE teachers frequently identified a lack of competency to instruct SWDs as their biggest deficiency.
The final motivation for this study is a unique CTE teacher licensure system in Washington state. We, therefore, provide background information about this licensure system in the next subsection and how it compares to other states’ CTE teacher licensure systems.
Background on CTE Teacher Licensure
Bonsu et al. (2013) provide a national survey of CTE teacher licensure policies. Their report indicates that all states offer a traditional pathway to CTE licensure in which teachers complete a 4-year program in education, with a specialization in CTE. Many states also offer at least one alternative CTE training program for applicants that require limited prior pedagogical training (i.e., individuals are not required to attain a teaching degree). CTE teacher preparation and pedagogical requirements vary considerably across states (Zirkle, 2018), far more so than is true for traditional teacher training (at least on the surface). Although most states require work-based experience for CTE certification, which applicants must verify either through completing a minimum number of years of employment or by submitting a valid (nonteaching) license, as we show in Figure 1, states vary widely in the number of hours of work experience—from 2,000 to 12,000 hours, with Washington near the median at 6,000 hours—required for these alternative pathways. This variation in state policy raises the question of whether more experience in the field is predictive of better outcomes for SWDs. Moreover, differences in CTE requirements are not limited to work experience; for example, research by Zirkle et al. (2007) found that about half of alternative CTE pathways require a bachelor’s degree, about half required additional coursework, and the majority require some type of licensure test.
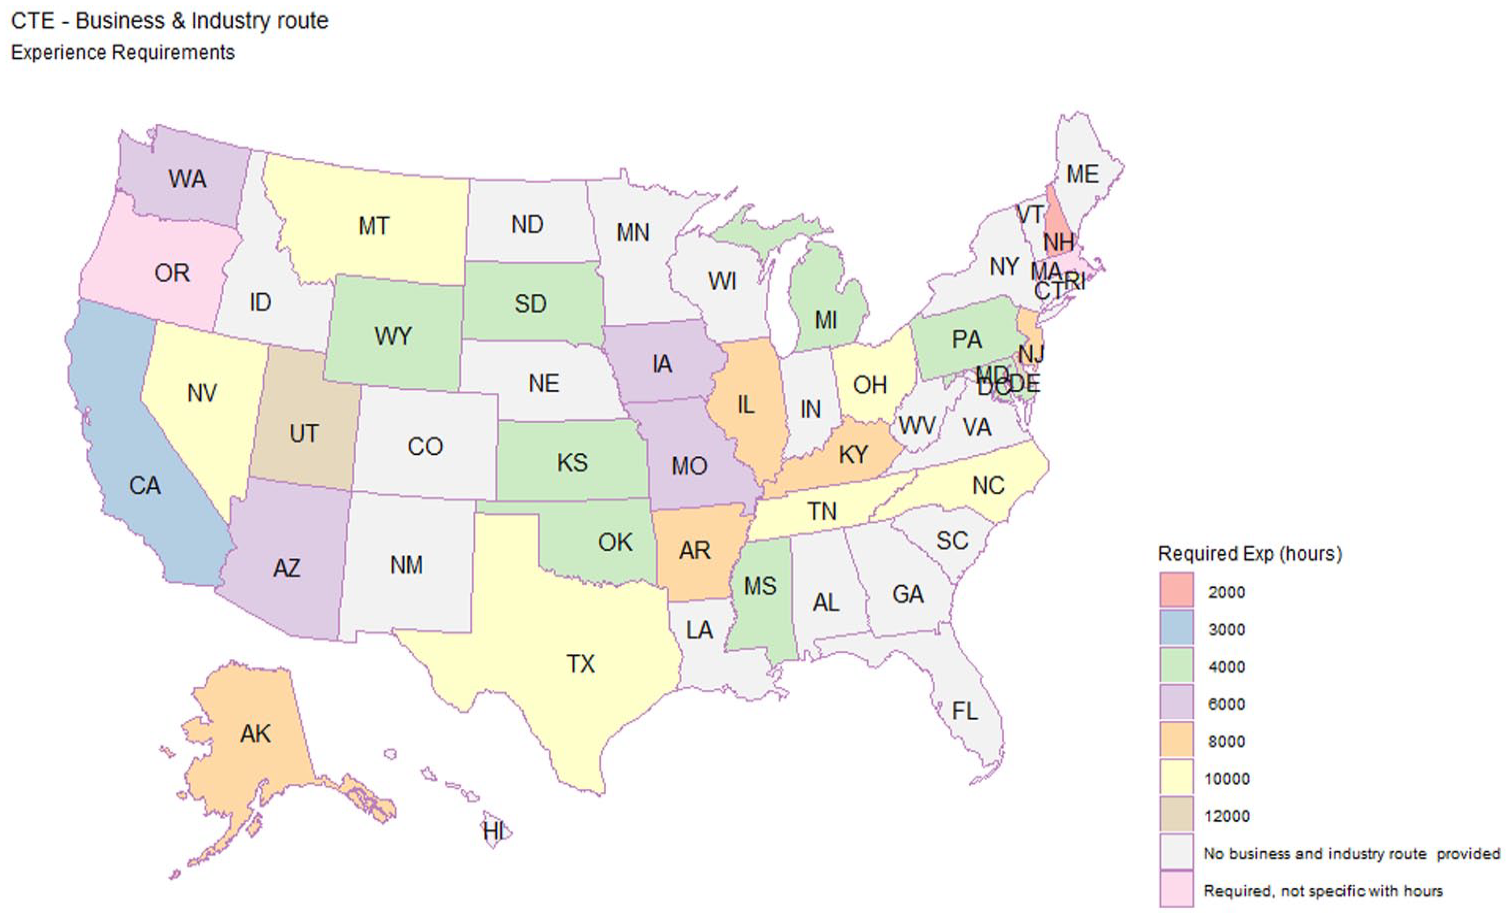
Required Employment Hours for CTE Teachers in Alternative Pathways
Within Washington State, the requirements associated with different CTE teacher licensure pathways vary dramatically. Under the state’s current policies, traditional pathway teachers must obtain a bachelor’s degree with a minimum of 45 quarter hours of study in a specific CTE specialty area. They must also complete a state-approved CTE program in one of four broad areas: Agriculture Education, Business and Marketing Education, Family and Consumer Sciences Education, or Technology Education. These programs are typically short; for example, Central Washington University offers a 5-week course for in-service teachers and includes detailed coursework within a field of CTE (e.g., Apparel, Textiles, and Merchandising; Event Planning; Recreation; Tourism). Teachers must also pass an approved content knowledge test, called the WEST-E (or approved alternative). Finally, they must have 1 year of paid occupational experience in their CTE subject area.
The state’s Business and Industry (B&I) CTE teacher licensure pathway is quite different from the traditional pathway. Unlike the traditional pathway or approximately half of the alternative pathways in other states (Zirkle et al., 2007), this pathway does not require any degree attainment; instead, it involves the completion of specific B&I CTE programs. While the traditional pathway offers current teachers 5-week programs, B&I pathways include greater course loads to address the fact that they do not require a degree in teaching, which is consistent with prior research on alternative pathways (Zirkle et al., 2007). For example, Central Washington University provides a 1- to 2-year program that requires additional courses on teaching methods, occupational analysis and safety, course organization and curriculum design, coordination techniques, history and philosophy of CTE, student and professional leadership, school law and issues related to abuse, and practicum. Washington state requires B&I teachers to have 6,000 hr of paid work experience to ensure these individuals are well-familiar with their CTE area. Finally, B&I CTE teachers are licensed for specific CTE courses (e.g., Electronics, Engineering, and Design), while in contrast, traditional pathway CTE teachers are licensed for broad CTE areas (e.g., Science, Technology, Engineering, and Mathematics).
To explore potential differences in CTE teacher preparation to teach SWDs within these two licensure pathways in Washington, we surveyed the program director of each traditional and B&I CTE teacher preparation program in the state. We sent the survey to 14 different program directors and received responses from seven directors representing eight distinct programs, for a response rate of 50%. The lack of higher response rates suggests that we should use caution in generalizing survey results to the full state. That said, one of the striking findings from the survey was that four of the five directors of traditional CTE teacher preparation programs reported that their program requires a separate course on methods for teaching SWDs, while none of the three directors of B&I programs reported that they require a similar course. This provides preliminary evidence that formal training for teaching SWDs differs across these two licensure pathways.
A final important piece of context is that districts that are not able to hire a traditional or B&I pathway teacher must pursue hiring a teacher with a limited CTE license. CTE administrators or district superintendents must affirm that they cannot hire a regularly licensed teacher for the CTE course in question to initiate this process. Certificates are issued for a maximum of 2 years, and according to the state, it allows the district to hire an applicant who is highly qualified and experienced in the knowledge and occupational skills of the CTE program to be licensed; meets the occupational experience requirements for CTE licensure; and will be employed in new and emerging occupations as defined by the Professional Educator Standards Board and/or its designee. This license includes almost any possible level of teaching preparation, from teachers licensed in non-CTE subjects to individuals with no teacher training whatsoever.
These licensure policies have been in place over the past several decades, but several currently employed CTE teachers entered the state’s workforce under earlier policies with fewer formal requirements (which allowed CTE teachers to teach with a “vocational” or just a high school degree as in the current B&I pathway, as opposed to academic teachers who have always been required to have at least a bachelor’s degree). Throughout the analysis, we distinguish between CTE teachers who entered the workforce through the current B&I pathway and CTE teachers who do not hold a college degree and were grandfathered into the state’s current licensure policies.
Data and Method
Data and Measures
The student-level data for this project were provided by the Washington Office of the Superintendent of Public Instruction (OSPI). The OSPI data include annual files between 2013–2014 and 2018–2019 from the state’s Comprehensive Education Data and Research System (CEDARS) that consist of longitudinal records for all K–12 students in the state, including, for example, information about student demographics (e.g., disability, race/ethnicity) and student program participation (e.g., free/reduced priced lunch [FRL] eligibility, and English language learners services). The CEDARS data also include detailed information about the special education services each SWD receives, such as the extent of inclusion in general education classrooms, as well as assessment files that allow us to control for students’ eighth-grade test scores in both math and English language arts.
We can consider four categories of student non-test outcomes: student attendance, including the number of excused and unexcused absences each year; student disciplinary incidents, including the total number of disciplinary incidents and suspensions each year; students’ cumulative GPA at the end of each year; and grade retention (students show up in the subsequent grade the following year) after Grades 9, 10, and 11, and graduation in 4 years at the end of 12th grade. Student attendance and disciplinary incidents are calculated from the annual CEDARS Student Absence and CEDARS Student Discipline files, respectively, while student GPA is calculated from the CEDARS Grade History file. We calculate student grade progression from the “Exit Codes” in the CEDARS Student Enrollment files, which allow us to distinguish between students who legitimately drop out of school and students who simply do not appear in the following year of data because they moved or switched to a private school. Finally, our primary analysis considers whether each student graduates “on time” (i.e., 4 years after they entered ninth grade), although we consider all valid diploma types (including regular diplomas and diplomas specific to students with Individual Education Plans) because of our focus on SWD.
The CEDARS Student Schedule files include every course taken by each student in the state and include Classification of Instructional Programs codes that allow us to identify CTE courses and the specific CTE cluster and program areas associated with each course. The Student Schedule file is collected on the student and term levels, and different schools and districts in Washington use different term structures. Given this, we weight all results in the paper by student-course weights that indicate the proportion of the year a student spent in a specific course; for example, this weight equals 1 for yearlong courses, 0.5 for semester courses, 0.333 for trimester courses, and so on.
Students can be linked to their classroom teachers through unique identifiers in the Student and Staff Schedule files. These files include fields designed to link students to their individual teachers, based on reported schedules. However, limitations of reporting standards and practices across the state may result in ambiguities or inaccuracies around these links. These links in turn allow us to connect these files to OSPI teacher data, including the S275 (which includes information about teacher demographics, experience, and degree level for each teacher in the state) and teacher licensure data (including all teaching licenses, endorsements, and licensure test scores issued for all teachers in the state). These licenses include both full and limited (“temporary”) licenses, so we create indicators for whether each CTE teacher in the sample had a full or limited teaching license in each school year. We also consider teacher scores on the state’s Washington Educator Skills Test—Basic (WEST-B), averaged across the math, reading, and writing subtests, and the Washington Educator Skills Test—Endorsement (WEST-E), from which we use each teacher’s first test score and create indicators for the specific test field (since prior work has demonstrated considerable variability in the difficulty of these tests: see Goldhaber et al. [2017]). These test scores are only available for a subset of teachers since they have only been required in recent years (since 2002 for the WEST-B and since 2010 for the WEST-E), so we only consider these scores in subsample analyses.
Central to this analysis is identifying CTE teachers who entered the state’s teaching workforce through different licensure pathways. The licensure data also provide information on the CTE areas according to “vocational” (V) codes that can be mapped onto traditional and B&I pathways using crosswalks on the OSPI website. We, therefore, create indicators for whether each CTE teacher entered through a traditional pathway, the state’s B&I pathway, or a different pathway (typically before these formal pathways were introduced). In addition, a number of CTE teachers entered the state’s workforce under earlier policies with fewer formal requirements (which allowed CTE teachers to teach with a “vocational” or just a high school degree as in the current B&I pathway, as opposed to academic teachers who have always been required to have at least a bachelor’s degree). Thus, we distinguish between CTE teachers who entered the workforce through the current B&I pathway and those who entered the workforce under prior requirements and do not hold a college degree.
Samples and Summary Statistics
This article focuses exclusively on students enrolled in CTE courses between Grades 9 and 12 in Washington (see Appendix Table A1 for comparisons between students in CTE and non-CTE courses in the state). In Table 1, we present summary statistics separately by student grade and disability status for the key measures in this analysis. Comparing students without disabilities to SWDs, we see that (in each high school grade) SWDs tend to have more absences and disciplinary incidents, considerably lower GPAs, and are less likely to be retained across grades and ultimately to graduate on time than students without disabilities. SWDs also have much lower average eighth-grade test scores (by over a standard deviation) and are disproportionately male, Black, and eligible for FRL.
Summary Statistics of Student Variables for Students in CTE Courses.
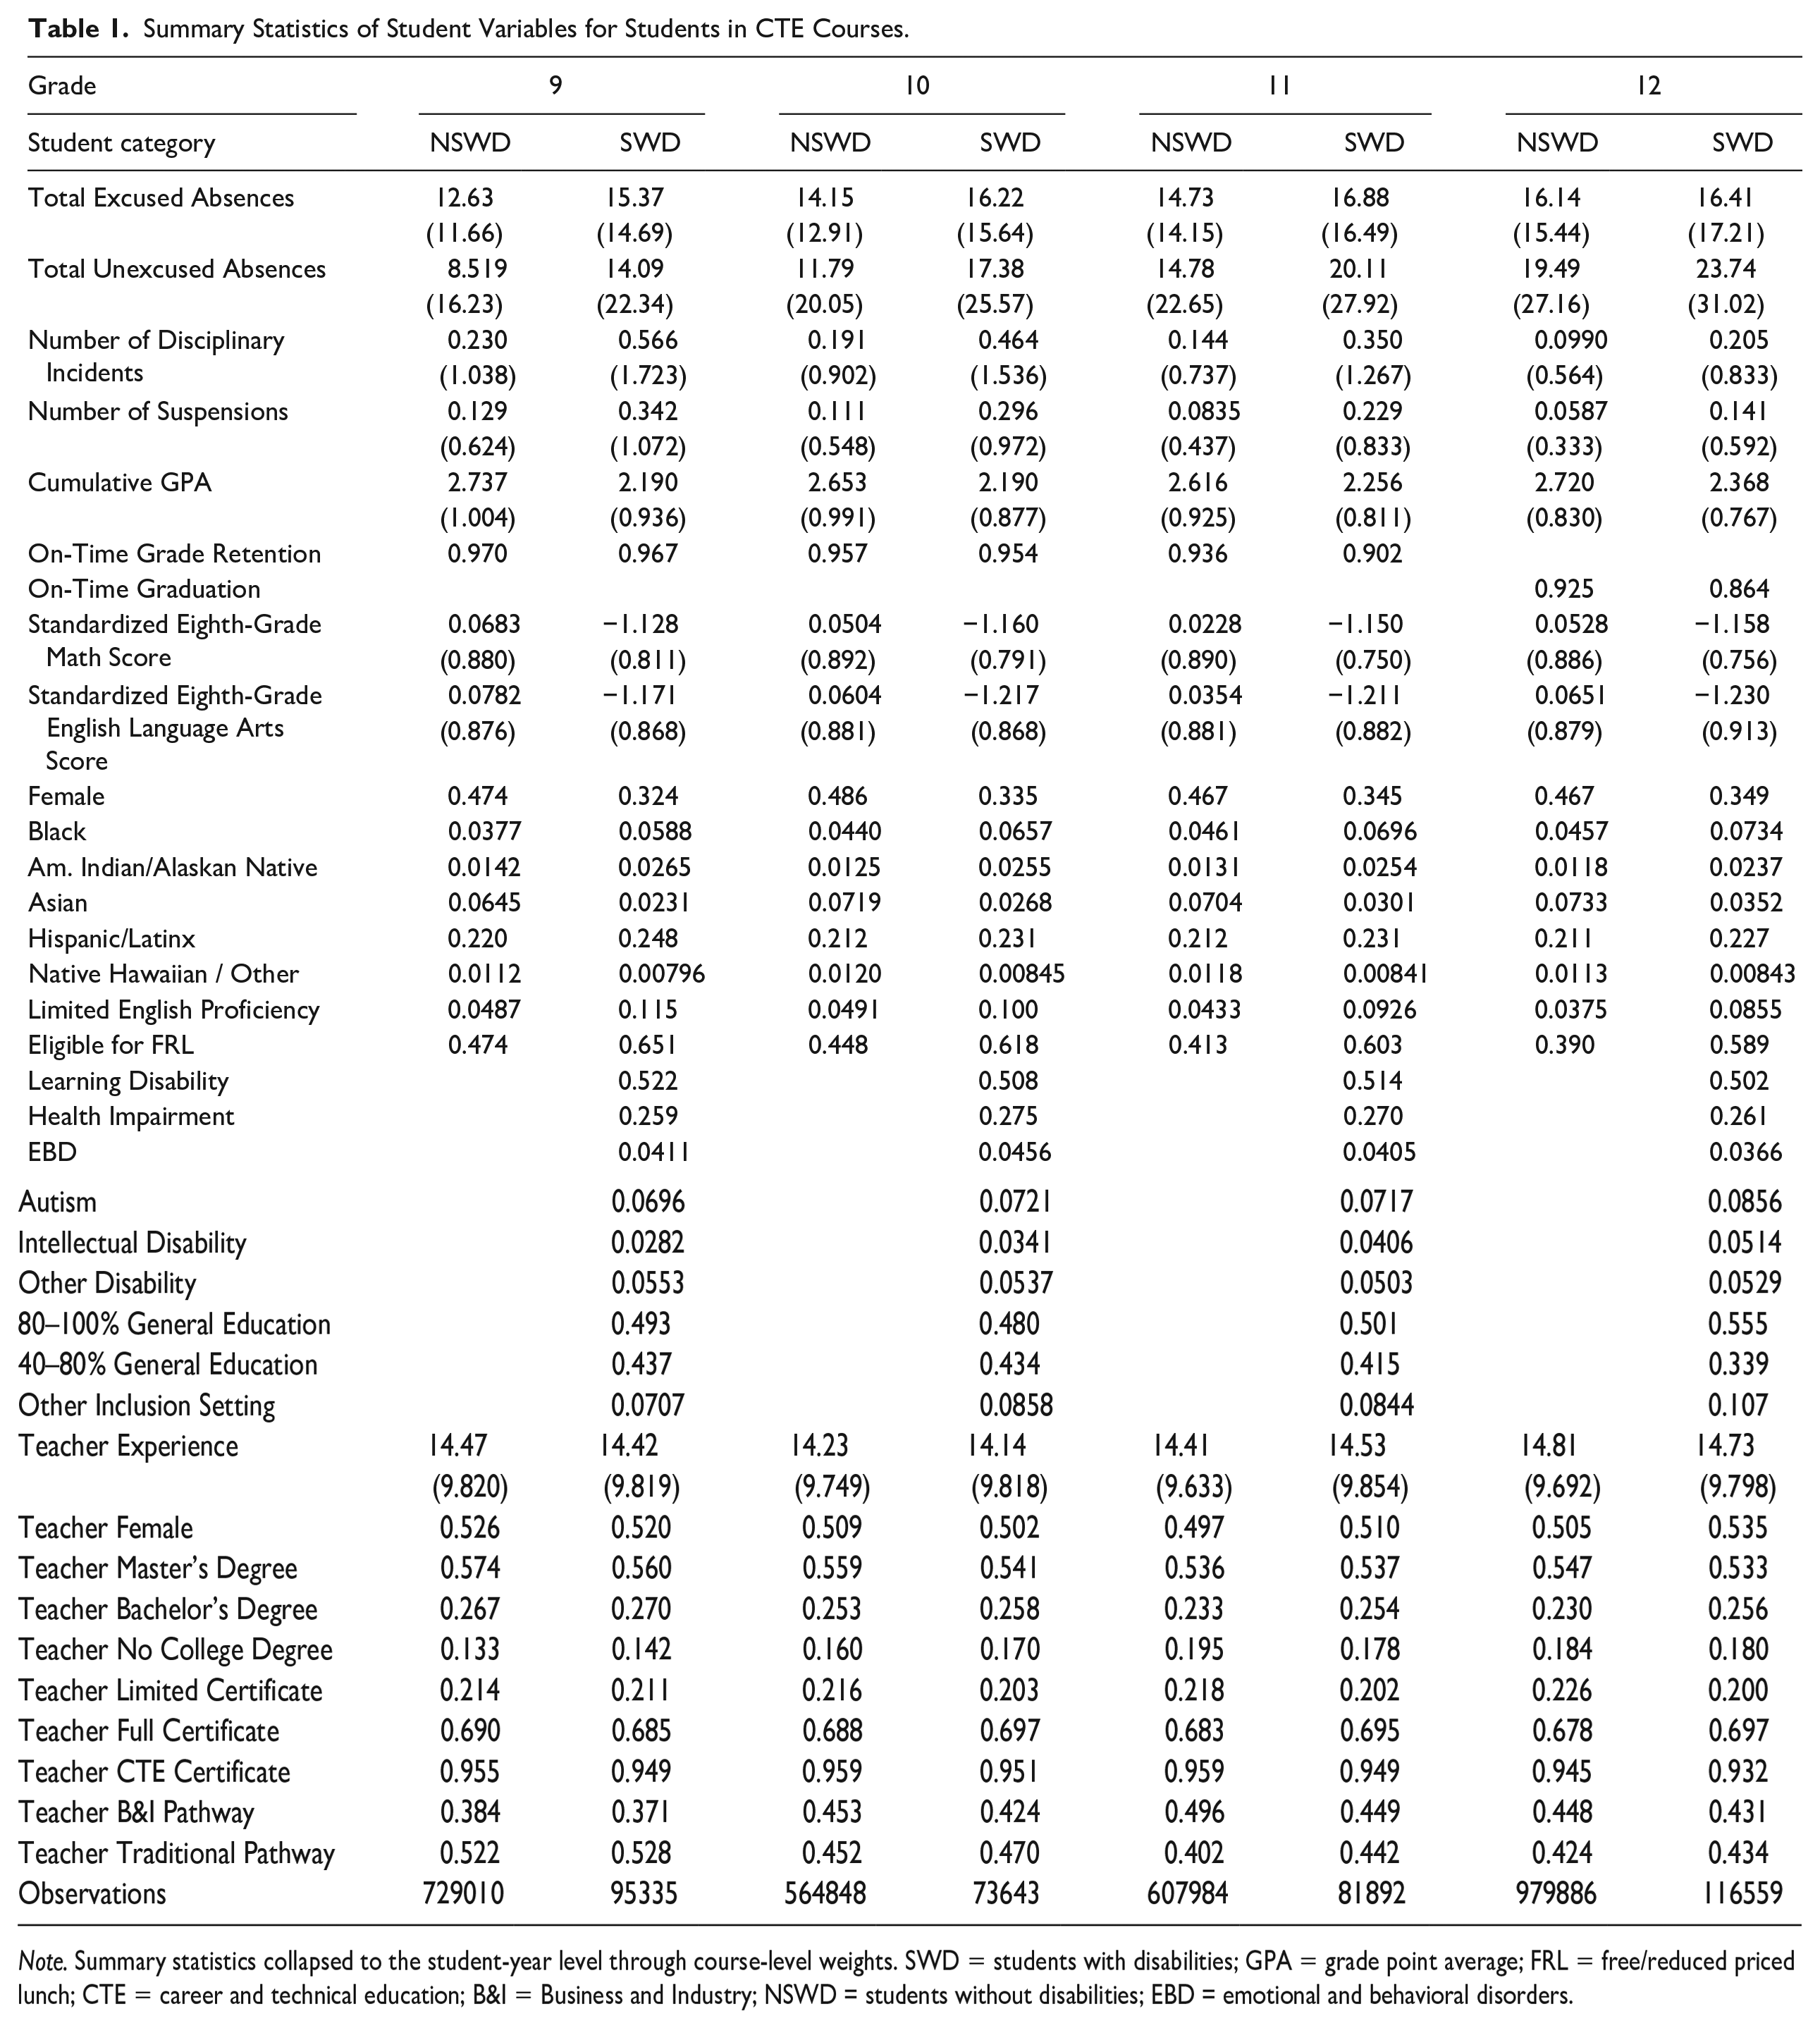
Note. Summary statistics collapsed to the student-year level through course-level weights. SWD = students with disabilities; GPA = grade point average; FRL = free/reduced priced lunch; CTE = career and technical education; B&I = Business and Industry; NSWD = students without disabilities; EBD = emotional and behavioral disorders.
The next several rows of Table 1 highlight two important sources of data specific to SWDs (as thus not observed for students without disabilities) that are important for our analysis. First, we divide this group of SWDs into specific disability categories; more than half of SWDs in each grade are receiving special education services for a specific learning disability; about a quarter have a health impairment, and the remaining students are divided roughly evenly between emotional/behavioral disorder, autism, intellectual disability, and other disability. About half of the SWDs in CTE courses spend 80–100% of their school day in general education courses, about 40% are in general education 40–80% of the school day, while the remainder are in other settings (e.g., 0–40% general education or separate school settings).
The final rows of Table 1 provide summary statistics for the key CTE teacher variables considered in this analysis. Given that we see relatively minimal differences in average CTE teacher characteristics between students with and without disabilities, we focus primarily on the aggregated summary statistics provided in Appendix Table A2 (which also provides summary statistics for the course cluster and program information that we use as controls in all models).
The average teacher of students in CTE courses has slightly less than 15 years of teaching experience, a little more than half are female, and the vast majority are White. A little more than half of students’ CTE teachers have a master’s degree, about a quarter have a bachelor’s degree, and nearly 20% have no college degree. This last statistic is in stark contrast to general education teachers, nearly all of whom are reported to have at least a bachelor’s degree given state requirements.
Finally, focusing on certification information, more than two-thirds of students’ CTE teachers have a full teaching certificate (compared with a limited certificate), and more than 95% are certified in CTE. Finally, these CTE teachers are relatively evenly split between the traditional and B&I pathways described in the introduction, with CTE teachers from traditional pathways more likely to teach CTE courses in earlier grades and CTE teachers from the B&I pathway more likely to teach CTE courses in later grades. We provide further differences between traditional and B&I pathway teachers in Appendix Table A3, showing that B&I pathway teachers tend to be less experienced and more racially and ethnically diverse than traditionally licensed CTE teachers.
Analytic Approach
The underlying basis for much of the analysis is the estimation of the relationships between specific CTE teacher characteristics and the various student non-test outcomes previously discussed. We closely follow the methodology that has been used in prior work that has estimated the contributions of teachers to non-test high school outcomes (e.g., Jackson, 2018) and the effects of CTE teachers in particular (Chen et al., 2023). We begin by estimating a principal components model separately by grade to assess the extent to which the different non-test outcomes load onto a single underlying “non-test factor.” This is useful because it provides an aggregated measure of student non-test “success” that can be used as the outcome variable in subsequent analyses.
Table 2 summarizes the results of the principal components analysis and shows that—consistent with Jackson (2018)—log excused absences, log unexcused absences, log disciplinary incidents, and log suspensions all load negatively onto one underlying factor, while cumulative GPA and on-time grade retention/graduation load positively onto this factor. We then use factor loadings from Table 4 to create a single predicted non-test factor for each student and year that represents a single measure of each student’s non-test outcomes in a specific year.
For the remainder of this section, let

In the abovementioned model,
Results From Factor Analyses of Non-Test Outcomes.
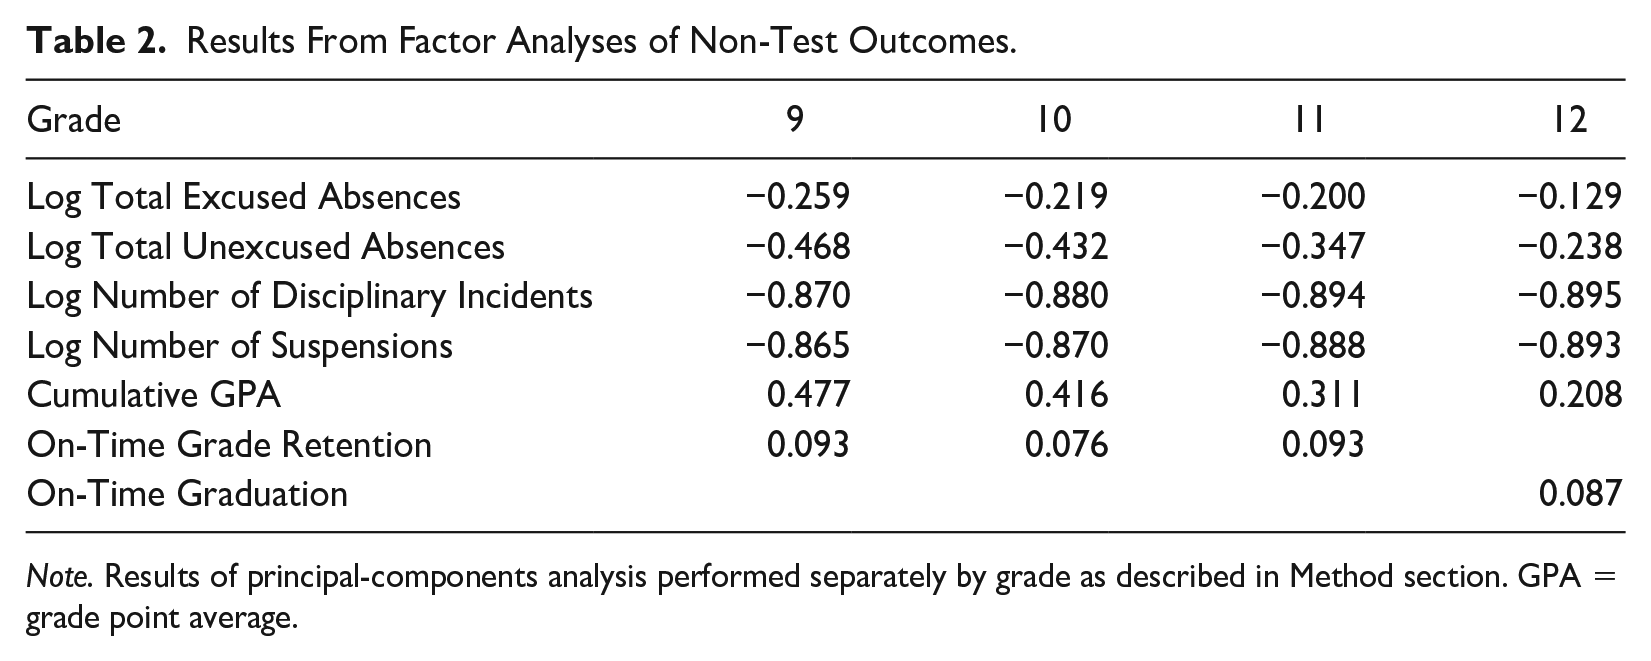
Note. Results of principal-components analysis performed separately by grade as described in Method section. GPA = grade point average.
Following prior work on CTE in Washington (Theobald et al., 2019), our primary model specifications control for district fixed effects to account for the considerable variation in CTE offerings and student outcomes across the 295 school districts in the state. All models also account for year effects, and we cluster standard errors at the teacher level to account for nonindependence between outcomes for different students receiving CTE instruction from the same teacher. Students assigned to multiple CTE teachers in a year are weighted to individual teachers following the “full roster method” of Koedel (2009) and Hock and Isenberg (2017). We first estimate these models separately by grade and then pool across grades by interacting all student- and class-level variables by student grade. Finally, to explore RQ2 (differences in these relationships for students with and without disabilities), we estimate the models described in Equation 1 separately for students with and without disabilities.
The intuition behind the models in Equation 1 is that, after controlling for the student, classroom, and district factors in Equation 1, the relationships between the CTE teacher variables in Equation 1 and the student outcome should represent the “effect” of being assigned to a CTE teacher with a given characteristic. However, there are at least two important threats to this type of causal interpretation. The first is that CTE teachers with different observable characteristics are non-randomly distributed across districts, CTE courses, and students. Indeed, when we explore the distribution of CTE teacher characteristics across educational settings and students, we find that specific districts, different CTE clusters and program areas, and various categories of students can have substantially different observable CTE teacher characteristics. For example, CTE teachers who enter through the state B&I pathway tend to teach slightly higher-performing students and disproportionately teach in technology science programs relative to CTE teachers from other pathways. If CTE teachers with a given characteristic are more likely to teach students who have unobserved (i.e., after controlling for the variables in
The inclusion of district fixed effects alleviates the concern about the nonrandom distribution of CTE teachers and students across districts, and as described in Koedel et al. (2015), estimating models in one stage as shown in Equation 1 accounts for partial correlations between teacher characteristics and student/class characteristics that further help account for this source of bias. As we discuss in the next section, our estimates of CTE teacher “value added” from the model in equation 1 exhibit little evidence of forecast bias, so we are relatively less concerned about this source of bias.
A second and potentially more serious concern—related to our focus on pathways into teaching—is that prospective CTE teachers may non-randomly sort to specific CTE licensure pathways. If individuals with stronger skills or teaching potential are more likely to pursue one type of licensure pathway than another, then we may again misattribute this non-random selection to the effect of the licensure pathway itself. For some purposes, the distinction does not matter; for example, as a parent or principal interested in expected student outcomes associated with assignments to diverse kinds of CTE teachers, it does not matter if these relationships are driven by selection into pathways or the preparation of CTE teachers within these pathways. But from a policy perspective (e.g., in deciding whether to expand or eliminate specific pathways), the distinction is quite important. We, therefore, estimate subsample models that control for the licensure test scores of CTE teachers on the state’s WEST-B basic skills tests that have been required for teacher licensure since 2002 (and thus are only observable for more recently credentialed CTE teachers in the sample) to account for some of this non-random sorting. We also estimate models that consider subject-specific WEST-E licensure test scores (required for most teaching licenses since 2010), although these tests are only required for the traditional CTE pathways and thus represent a variable of interest rather than a control for this type of non-random sorting.
Results
Before discussing the results aligned with RQs 1 and 2, we first estimate the specifications of the model in Equation 1 omitting CTE teacher characteristics to provide some background about the relationships between the student characteristics in Table 1 and the non-test factor that is the outcome in the main results discussed below. As shown in Table 3, students with higher eighth-grade test scores and “better” lagged outcomes (i.e., fewer absences) tend to have higher values of the non-test factor, all else equal. Female students have higher non-test outcomes than male students; Asian, Hispanic, and Native Hawaiian/Other students tend to have higher values of this non-test factor than White students while Black students tend to have lower values; and special education students in Grades 10 to 12 have considerably lower values of the non-test factors than students without disabilities. Finally, students with limited English proficiency have higher values of the non-test factor, all else equal, while students eligible for FRL have lower values. All results discussed in the remainder of this section control for these differences across students (and the differences across CTE clusters and programs not reported in Table 3) to identify the relationships between CTE teacher characteristics and these non-test outcomes.
Student Predictors of Non-Test Factor Outcome in CTE Courses.
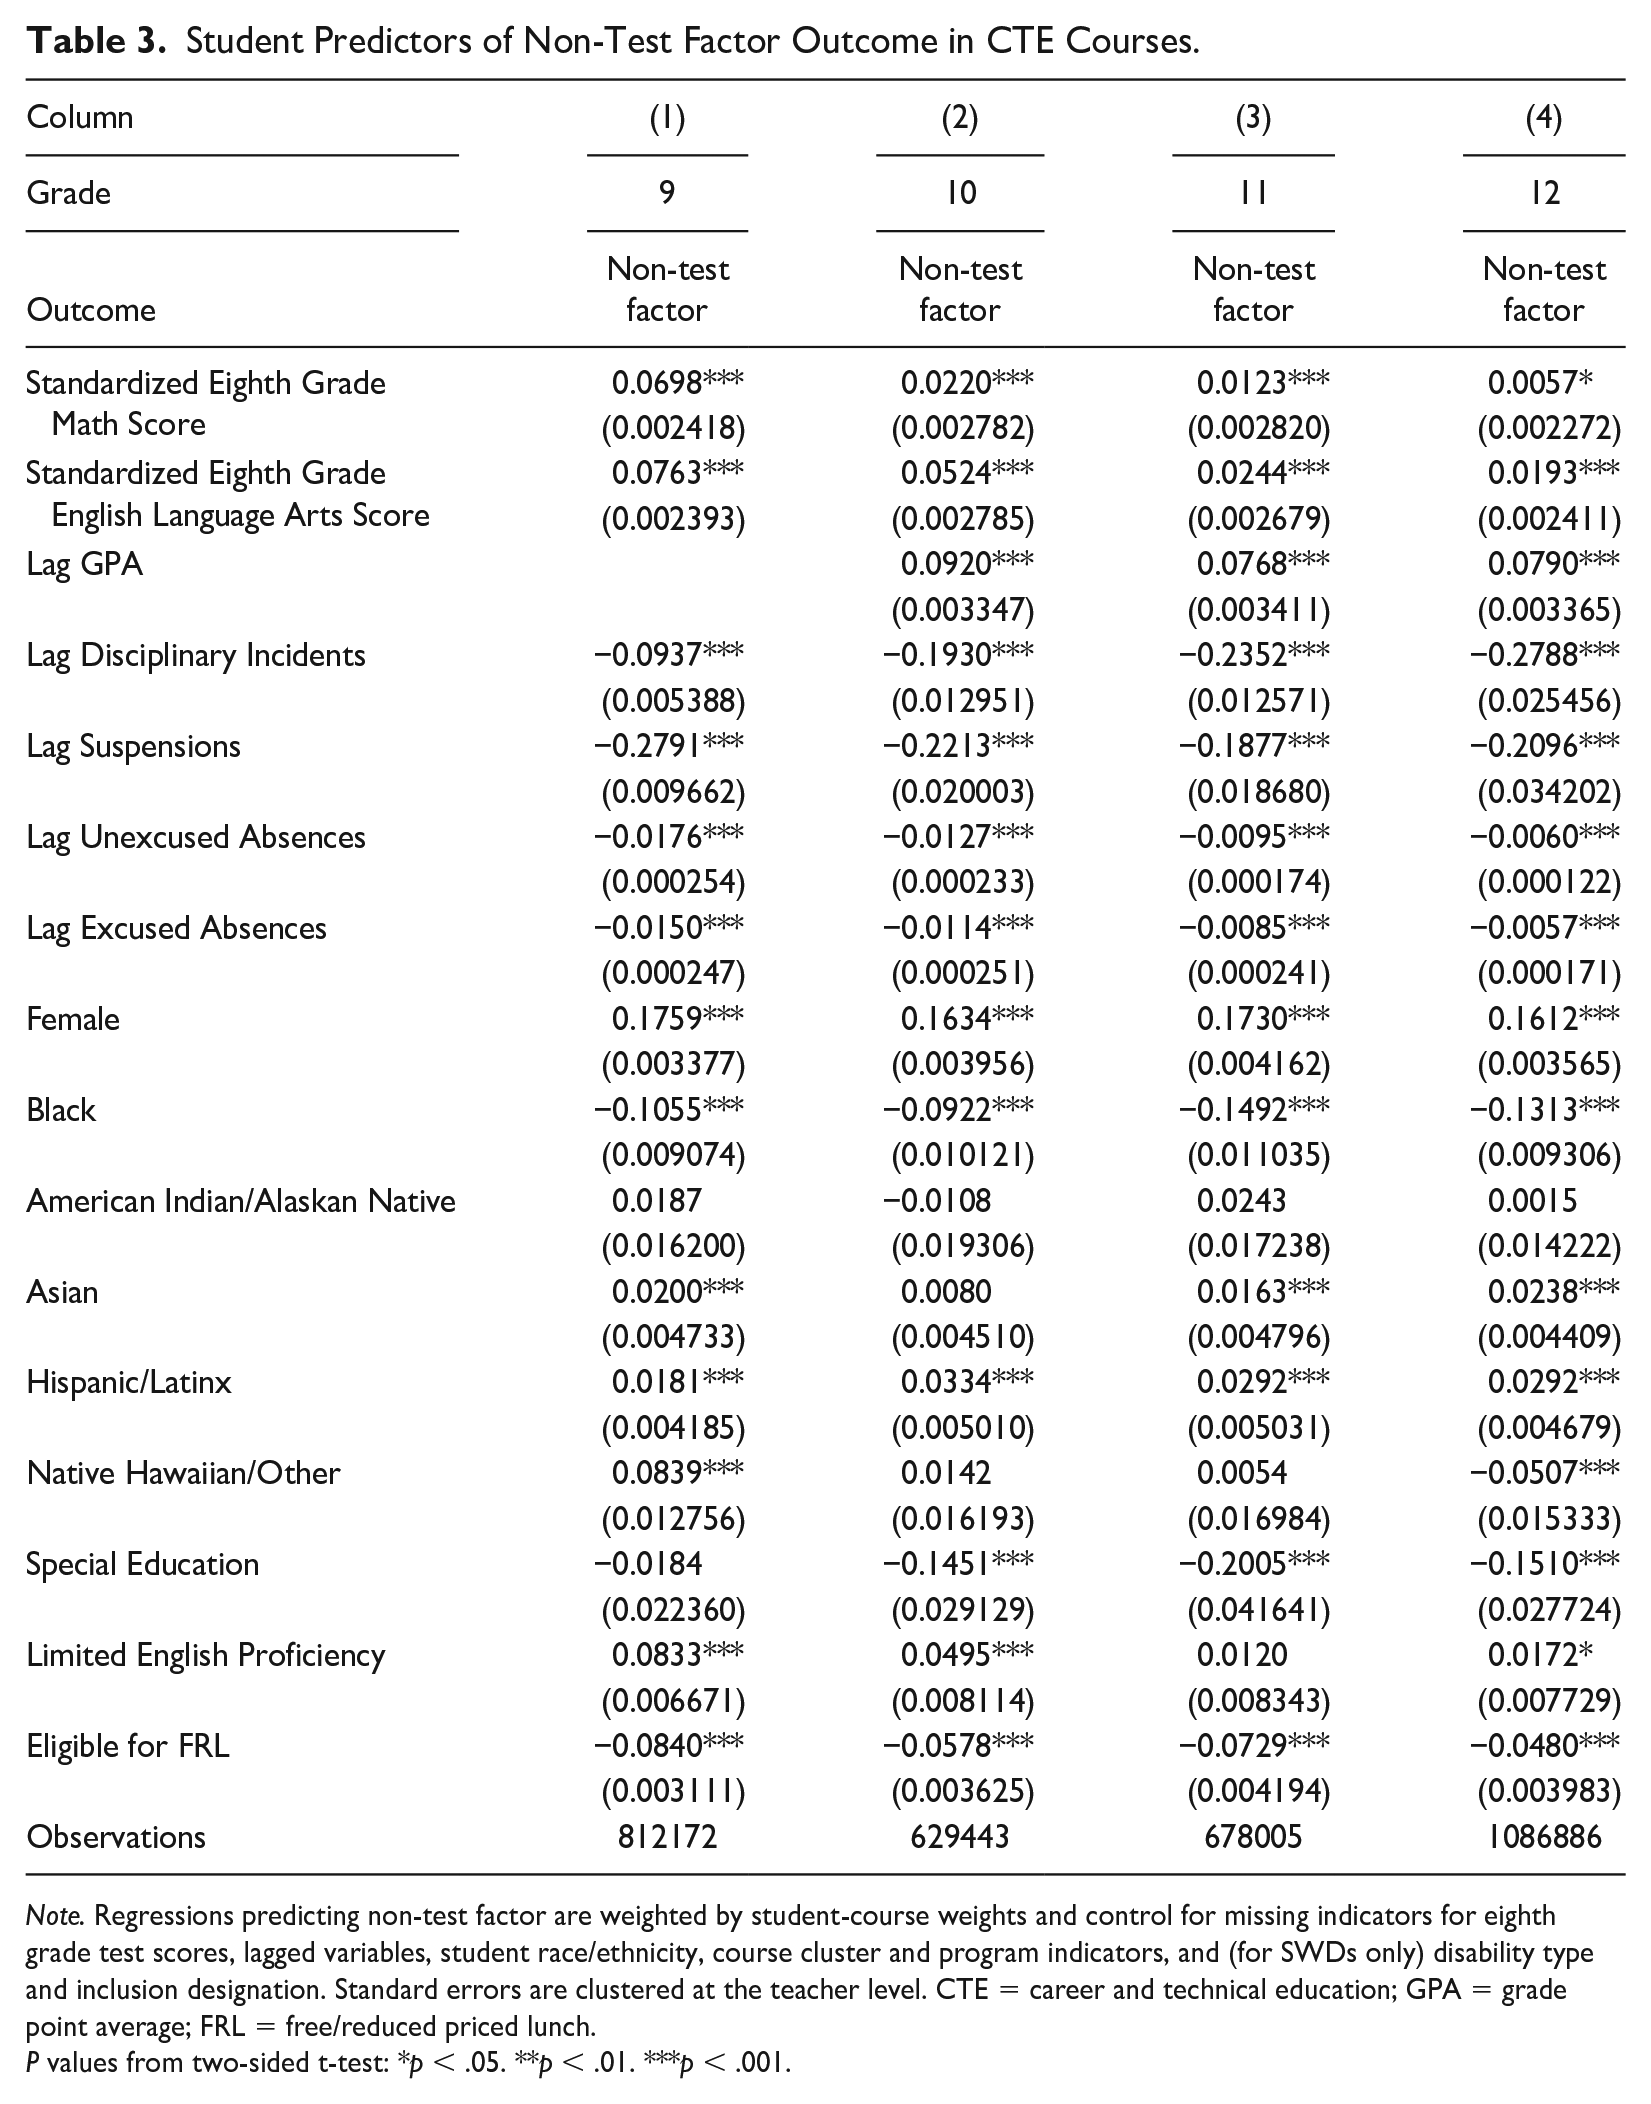
Note. Regressions predicting non-test factor are weighted by student-course weights and control for missing indicators for eighth grade test scores, lagged variables, student race/ethnicity, course cluster and program indicators, and (for SWDs only) disability type and inclusion designation. Standard errors are clustered at the teacher level. CTE = career and technical education; GPA = grade point average; FRL = free/reduced priced lunch.
P values from two-sided t-test: *p < .05. **p < .01. ***p < .001.
We also use the residuals from the models in Table 3—pooled across grades and fully interacted by student grade level—to quantify the magnitude of CTE teacher effects on these non-test outcomes. Specifically, following Kane and Staiger (2008), we take the mean of these residuals by teacher and year and estimate the standard deviation of CTE teacher effects as the square root of the covariance between these average residuals between consecutive years for the same teachers. We estimate that the standard deviation of CTE teacher effects on non-test outcomes is 0.13 standard deviations of the non-test factor. This estimate is like effect sizes reported elsewhere for teacher impacts on both test and non-test student outcomes (e.g., Kane et al., 2013). This provides evidence that CTE teachers do have significant impacts on students’ non-test outcomes that will be the focus of subsequent results.
Finally, we estimate versions of the model in Equation 1 using the “leave-out” specification and forecast bias tests from Chetty et al. (2014). These tests suggest that our estimates of CTE teacher contributions to student non-test outcomes exhibit little forecast bias, meaning that a one-unit change in CTE teacher value added between consecutive years within a given school and grade causes a corresponding increase in students’ aggregated non-test outcomes (
Results RQ1: To What Extent Are CTE Teachers’ Characteristics and Licensure Pathways Predictive of the Non-Test Outcomes of Students in Their Classroom?
The findings reported in Table 4 are organized as follows: We first pool estimates across grades (Column 1) and then estimate the models separately by grade to explore heterogeneity across grade levels (in Columns 2–5). Focusing first on the pooled results (also shown graphically for selected teacher characteristics in Figure 2), we find that CTE teacher gender, experience, birth cohort, and certificate type (full or limited) are not significantly predictive of student non-test outcomes. Due to the large sample sizes in these models (more than 2 million student/year observations), these null effects are precisely estimated, so we can rule out even small relationships between these characteristics and student non-test outcomes with 95% confidence.
Teacher Predictors of Non-Test Outcomes in CTE Courses.
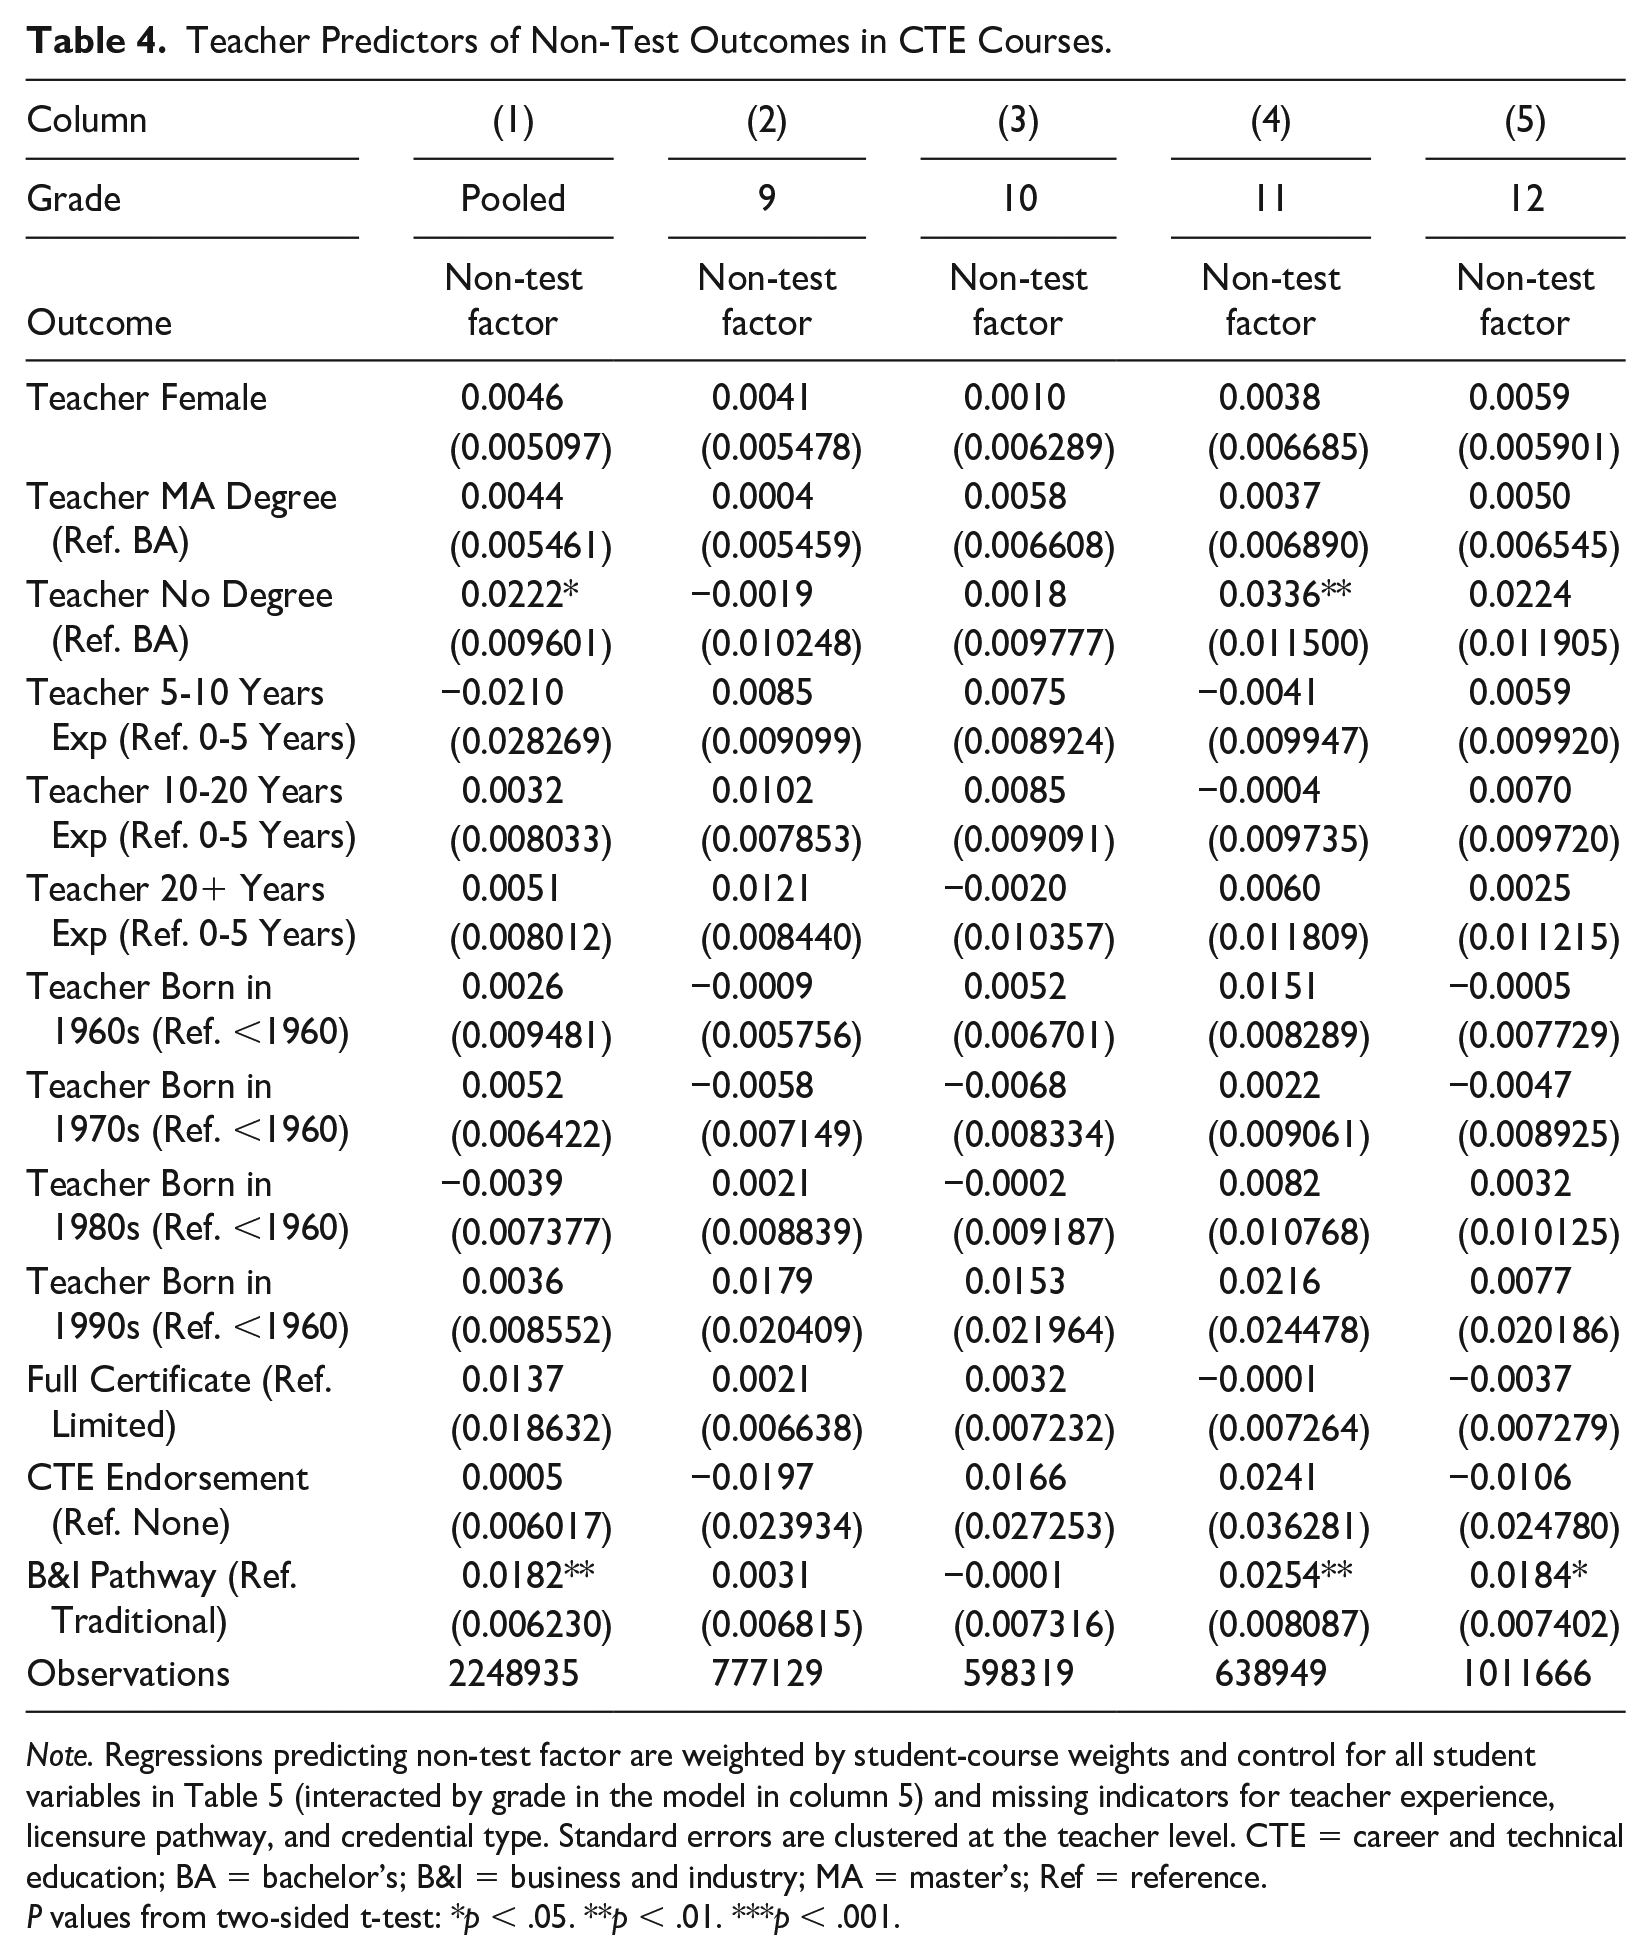
Note. Regressions predicting non-test factor are weighted by student-course weights and control for all student variables in Table 5 (interacted by grade in the model in column 5) and missing indicators for teacher experience, licensure pathway, and credential type. Standard errors are clustered at the teacher level. CTE = career and technical education; BA = bachelor’s; B&I = business and industry; MA = master’s; Ref = reference.
P values from two-sided t-test: *p < .05. **p < .01. ***p < .001.
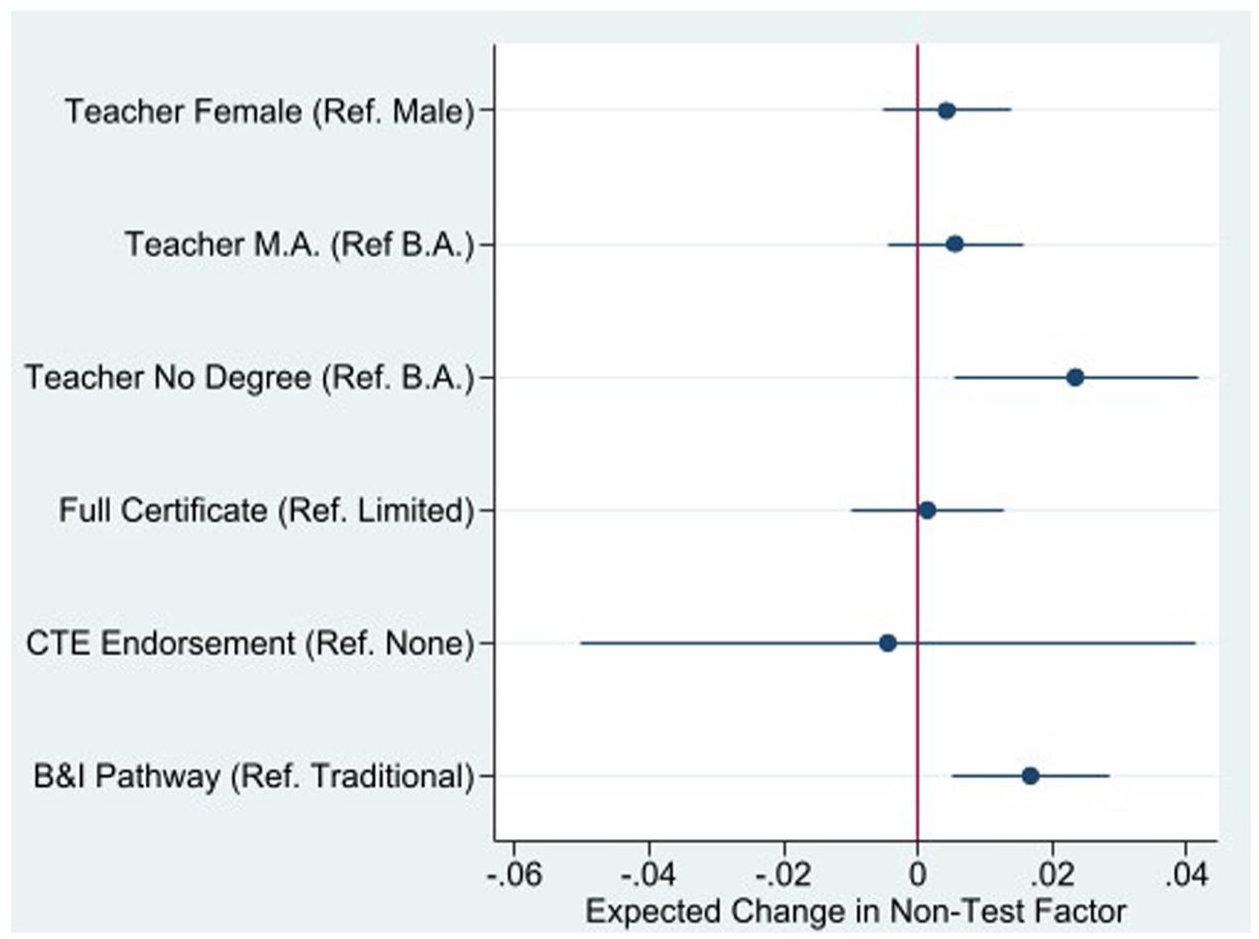
Expected Changes in Student Non-Test Outcomes Associated With Select CTE Teacher Variables
Two CTE teacher characteristics are significantly predictive of student non-test outcomes in these models. Students assigned to a CTE teacher with no college degree tend to have better non-test outcomes than students assigned to CTE teachers with a bachelor’s degree, while students assigned to a CTE teacher from the state’s B&I pathway tend to have better outcomes than students assigned to a CTE teacher from a traditional pathway. In each case, the difference is about 0.02 standard deviations of the non-test factor. Given controls for licensure pathway, teacher age, and experience, the relationship for teachers with no college degree is likely driven by older CTE teachers who were “grandfathered in” to the state’s current licensure requirements. Scanning across the grade-specific results in Columns 2–5, both relationships are driven by older grades, as both relationships are positive and significant for 11th-grade students, while the relationship with the B&I pathway is significant in 12th-grade as well.
The results from Table 4 focus exclusively on the aggregated non-test factor from the principal components analysis in Table 2, but to better understand whether there is heterogeneity in the relationships across different outcomes, we report results for each outcome in Table 5. For comparison, the results in column 1 are copied from column 1 in Table 4, while the remaining columns each consider a different non-test outcome named at the top of the table (in each case pooling across high school grades). The relationship between CTE teachers without a college degree and student non-test outcomes is driven by a lower number of excused and unexcused absences (Columns 2 and 3) and higher GPA (Column 6), while the relationship for the B&I pathway is driven by a lower number of absences and disciplinary incidents (Column 4). To put the magnitudes of these results in context, students assigned to CTE teachers from the B&I pathway have 6.4% fewer excused absences, 4.7% fewer unexcused absences, and 0.5% fewer disciplinary incidents than students assigned to a CTE teacher from the traditional pathway, all else equal.
Teacher Predictors of Non-Test Outcomes in CTE Courses, Pooled Across Grades by Outcome.
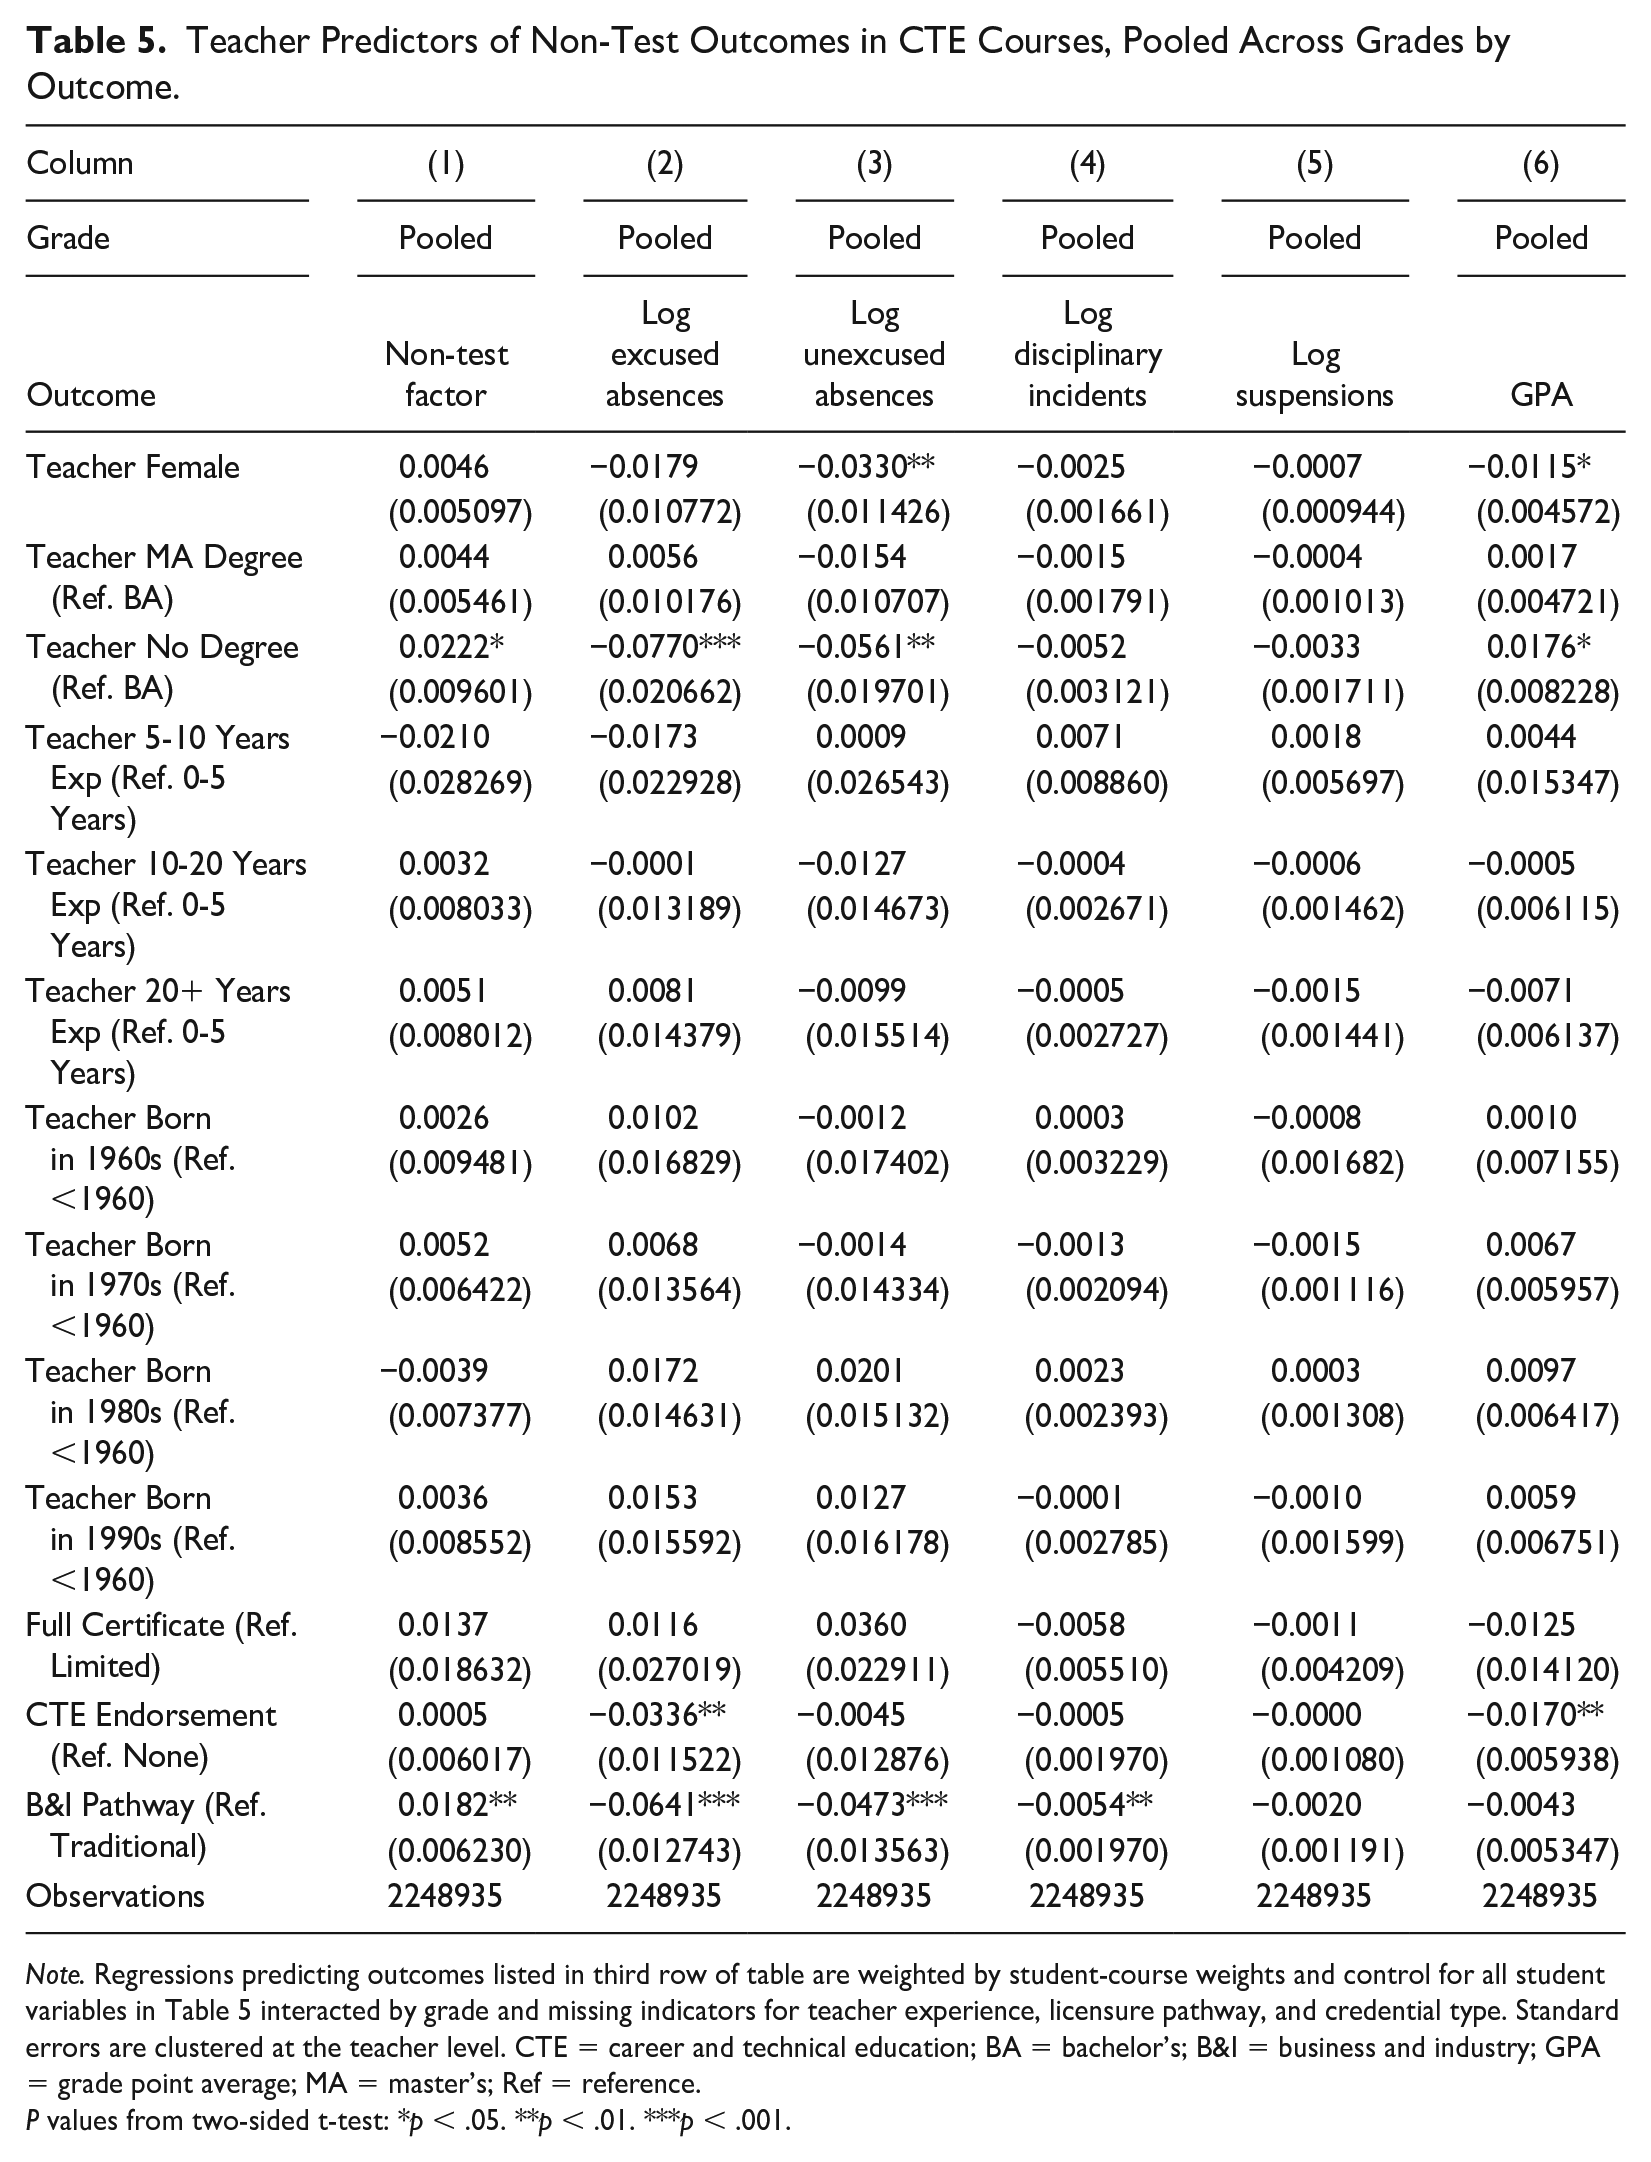
Note. Regressions predicting outcomes listed in third row of table are weighted by student-course weights and control for all student variables in Table 5 interacted by grade and missing indicators for teacher experience, licensure pathway, and credential type. Standard errors are clustered at the teacher level. CTE = career and technical education; BA = bachelor’s; B&I = business and industry; GPA = grade point average; MA = master’s; Ref = reference.
P values from two-sided t-test: *p < .05. **p < .01. ***p < .001.
Finally, as discussed in the previous section, we observe licensure test scores on the state’s WEST-B basic skills test and WEST-E subject test for a subset of CTE teachers in the sample. We include these licensure test scores as additional control variables in separate specifications reported in Table 6, estimated only for the subset of CTE teachers with these test scores. In both cases, CTE teachers’ licensure test scores are not significantly predictive of students’ non-test outcomes. Importantly, the relationship between the B&I pathway and student non-test outcomes in these specifications is roughly comparable to the overall relationship reported in column 1, which provides one robustness check for this result.
WEST-B/WEST-E Robustness Check.
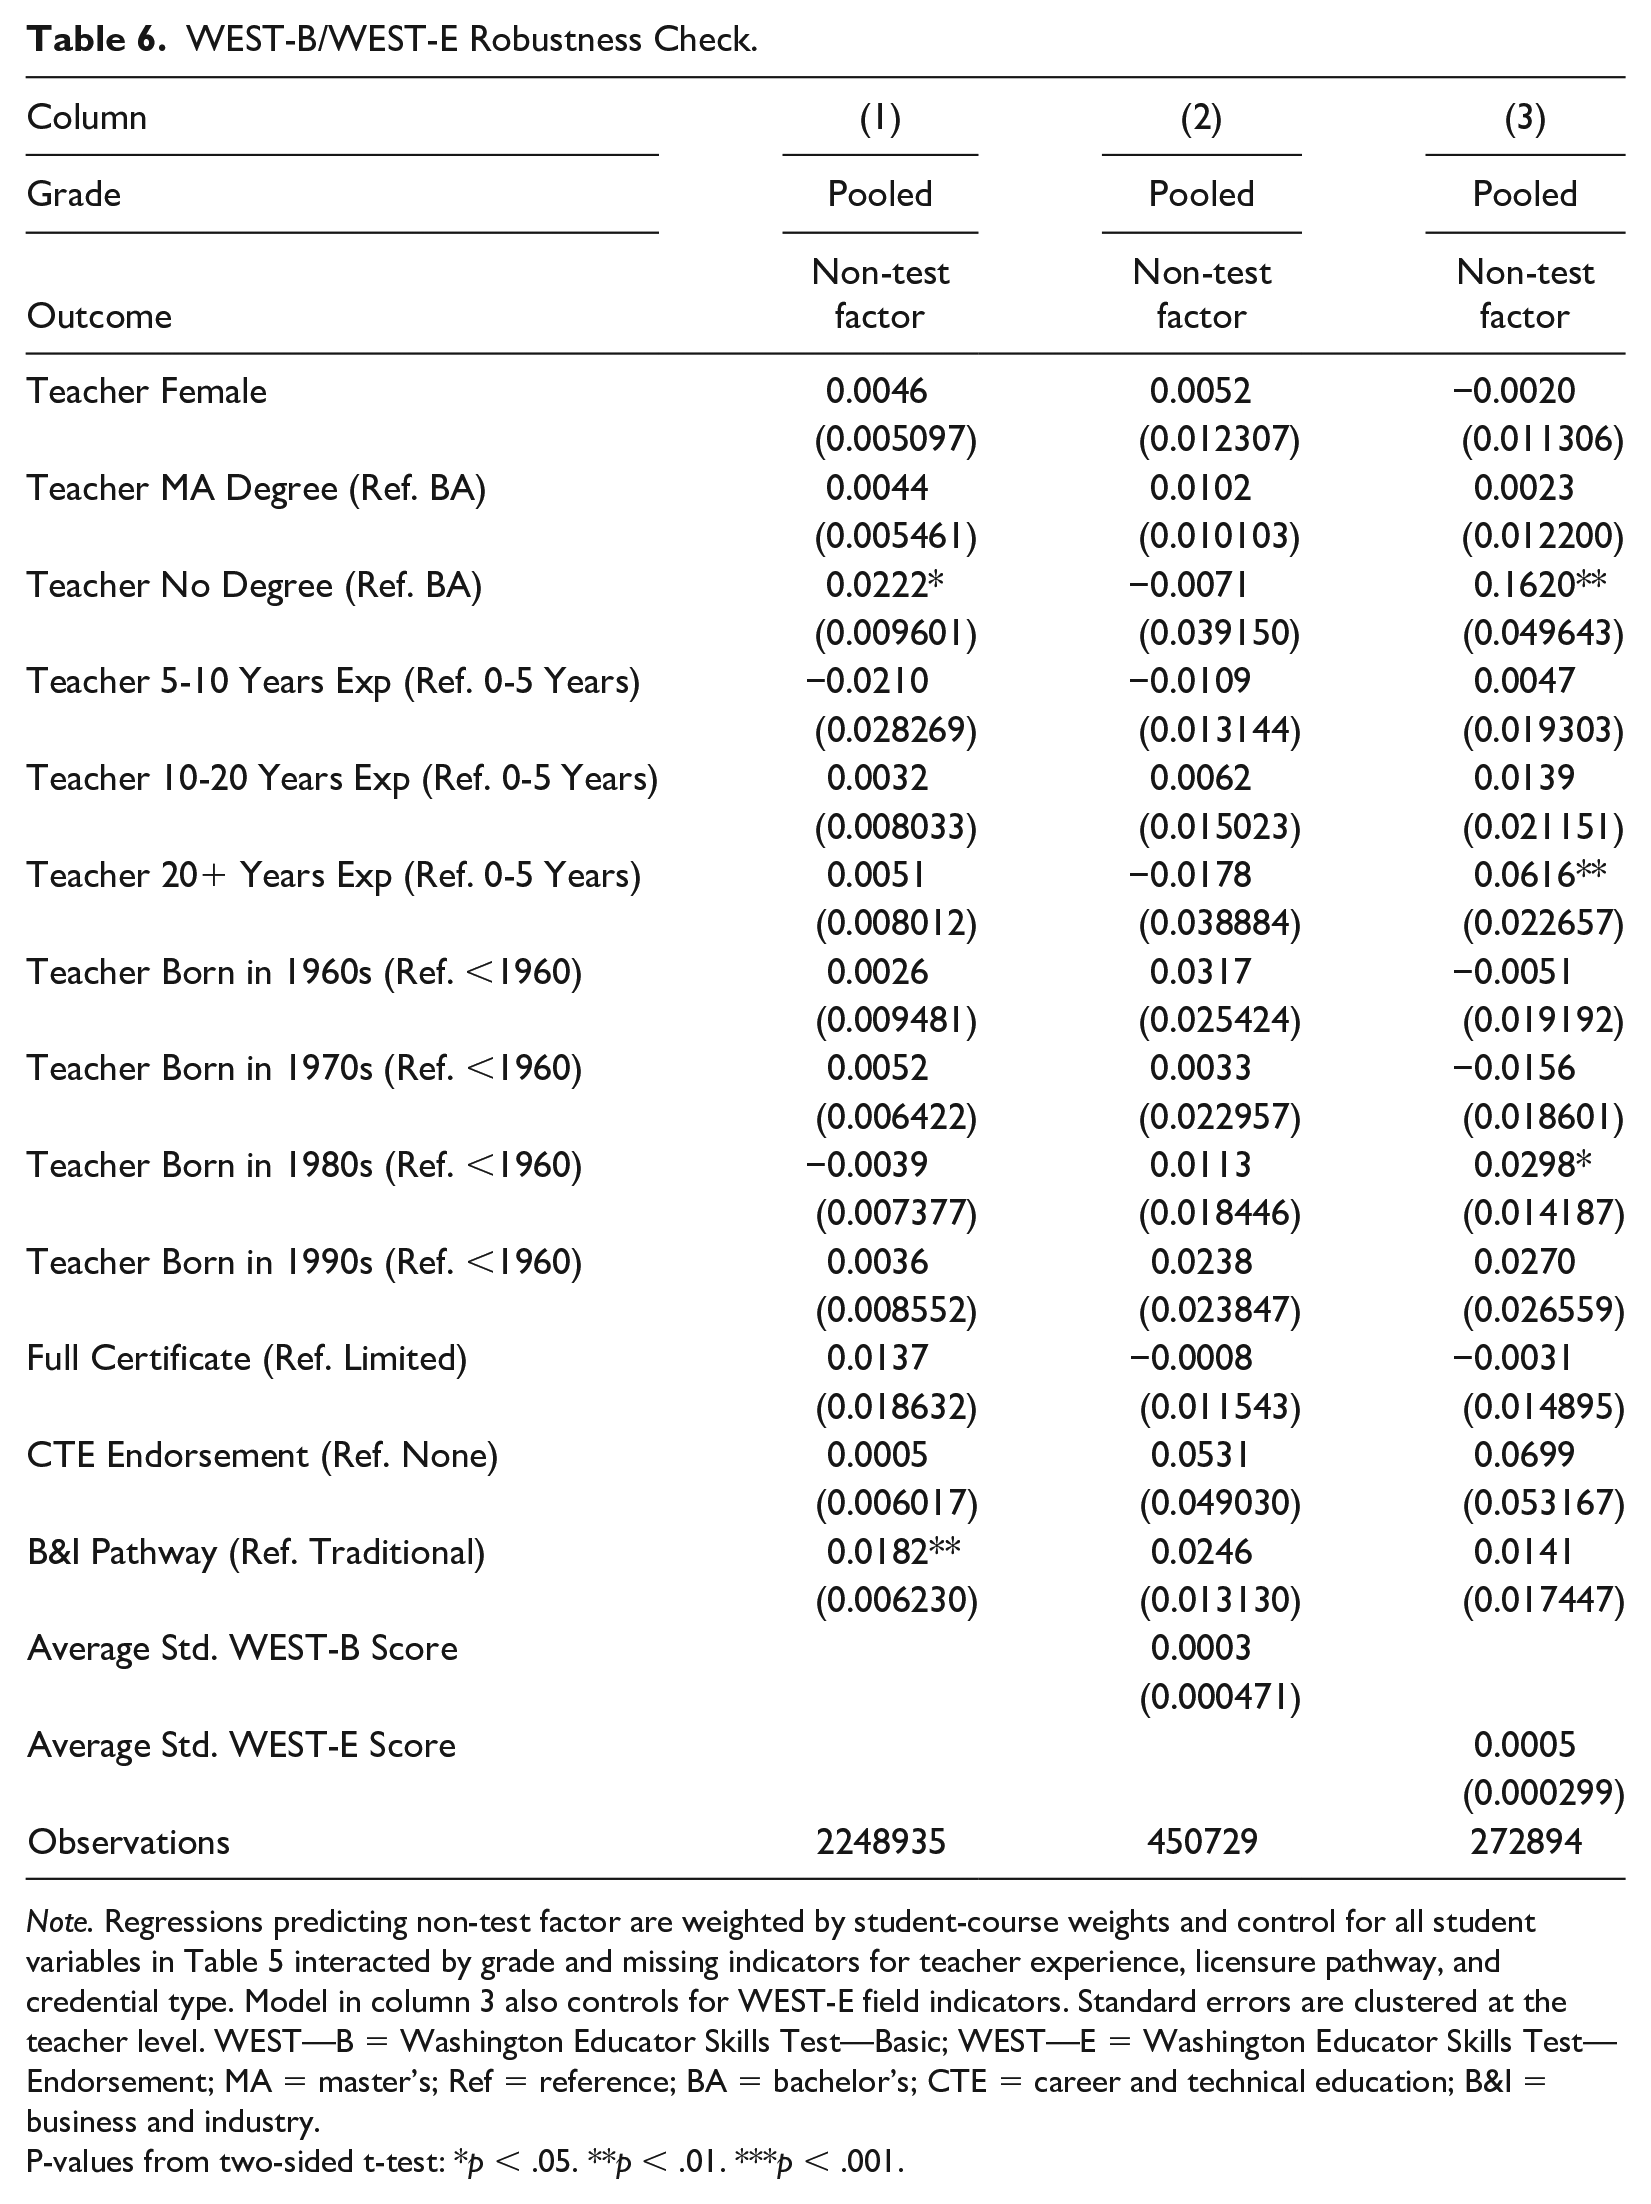
Note.Regressions predicting non-test factor are weighted by student-course weights and control for all student variables in Table 5 interacted by grade and missing indicators for teacher experience, licensure pathway, and credential type. Model in column 3 also controls for WEST-E field indicators. Standard errors are clustered at the teacher level. WEST—B = Washington Educator Skills Test—Basic; WEST—E = Washington Educator Skills Test—Endorsement; MA = master’s; Ref = reference; BA = bachelor’s; CTE = career and technical education; B&I = business and industry.
P-values from two-sided t-test: *p < .05. **p < .01. ***p < .001.
Results RQ2: How Do These Relationships Vary for Students With and Without Disabilities in These Teachers’ Classrooms?
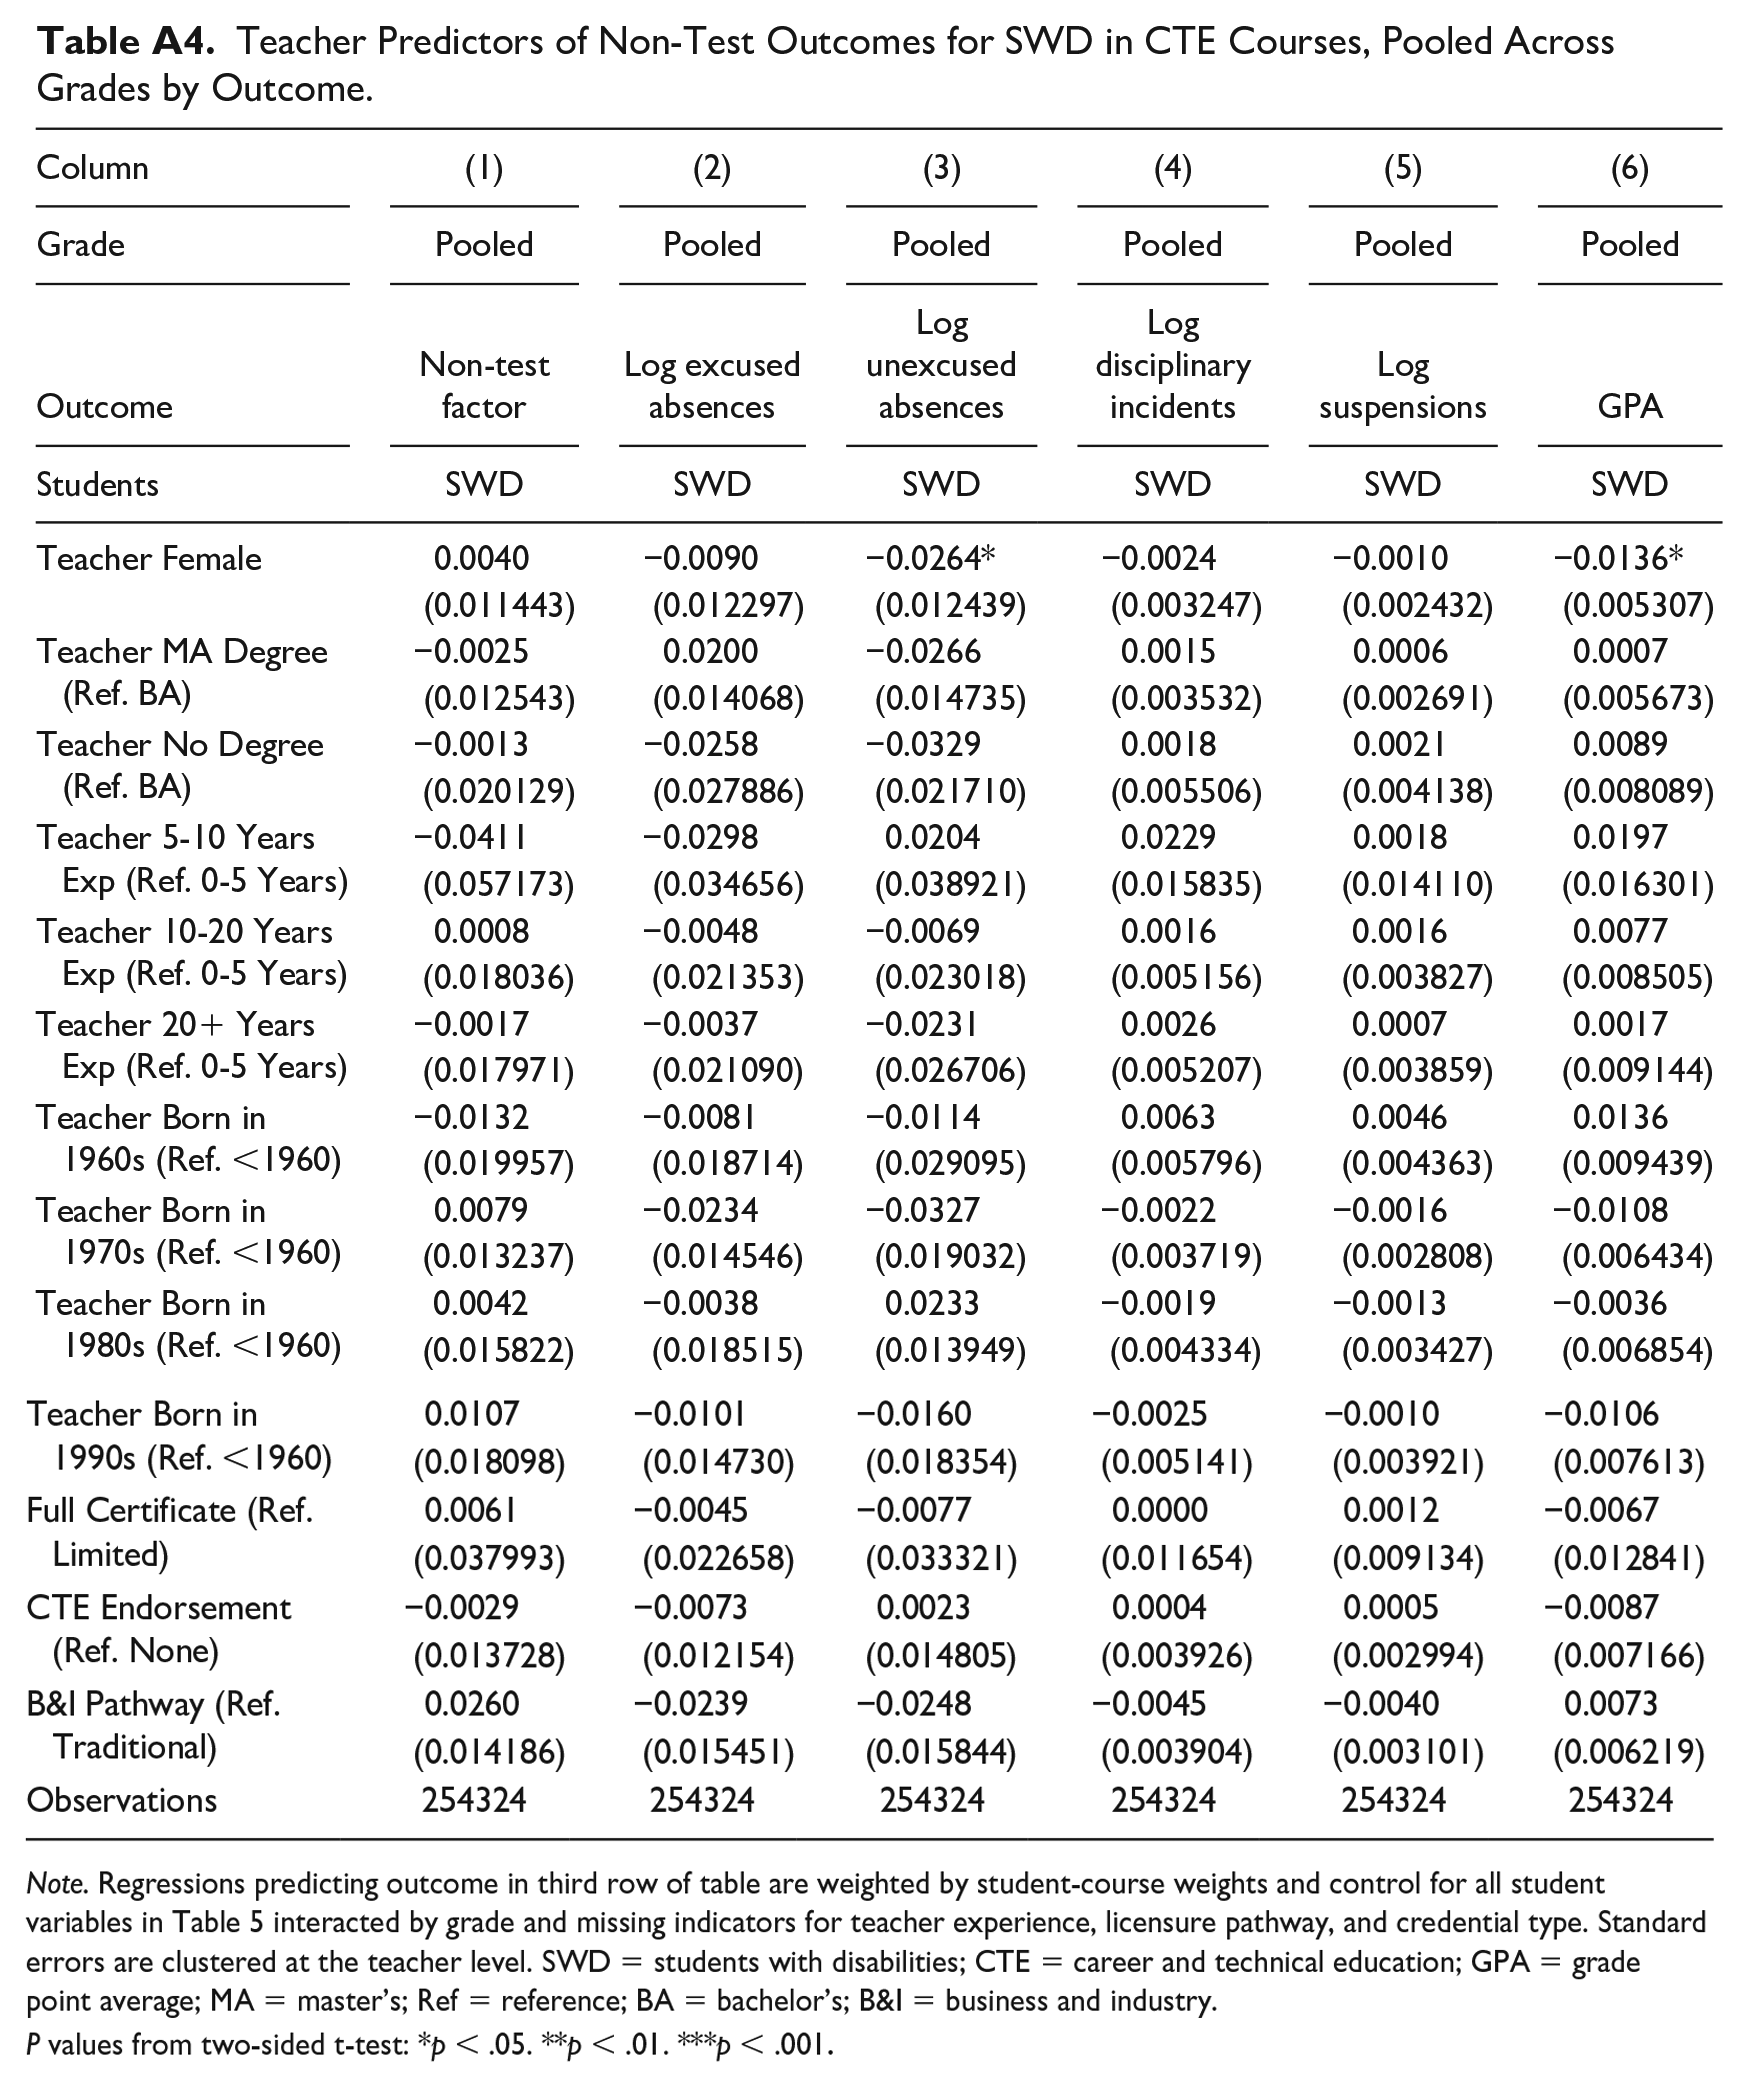
We now turn to the RQ2 and, in Table 7, estimate models separately for students with (Column 2) and without (Column 3) disabilities, again in comparison to the pooled results in Column 1; Figure 3 graphically presents results for selected CTE teacher characteristics. None of the coefficients are statistically significant in Column 2 due to the smaller sample sizes of SWDs, but the magnitude of the relationship between the B&I pathway and student non-test outcomes is even greater for SWDs than for students without disabilities. In contrast, the relationship between assignment to a CTE teacher without a college degree and non-test outcomes is considerably lower (and even slightly negative) for SWDs, although the difference between the estimates in columns 2 and 3 are not statistically significant (and not significantly different across student disability categories). As shown in Appendix Table A4, the relationships between the B&I pathway and the different specific non-test outcomes are comparable in direction and magnitude to the results for all students.
Results for Students With and Without Disabilities.
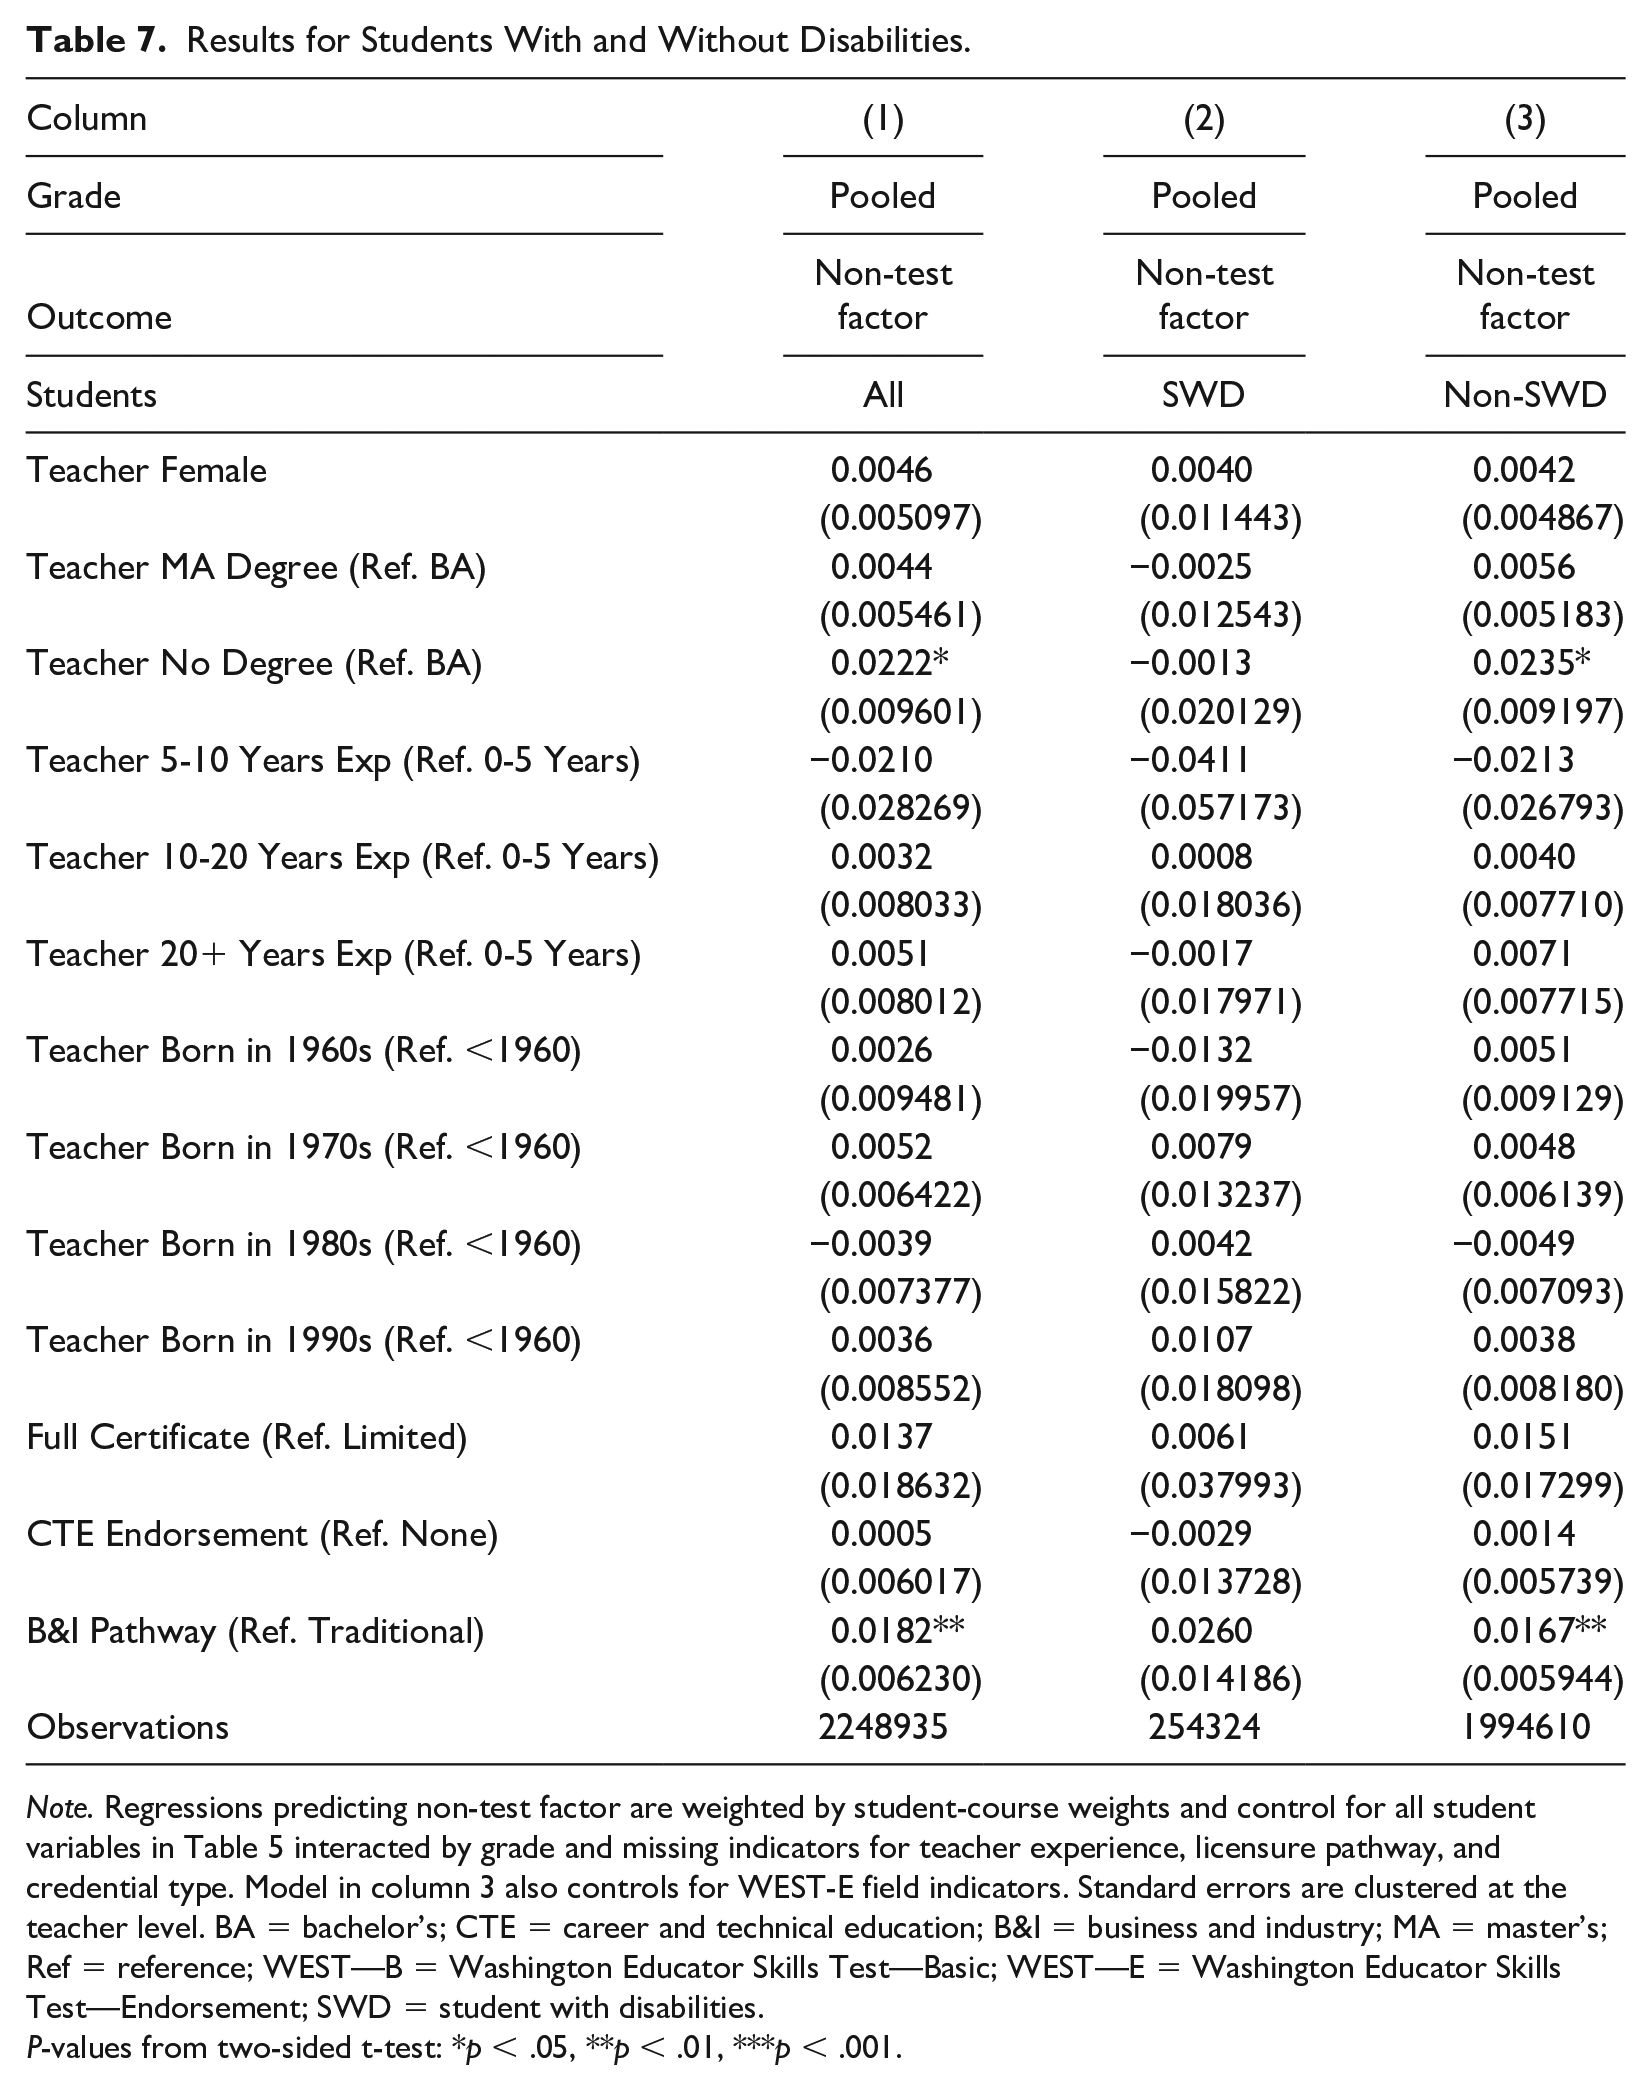
Note. Regressions predicting non-test factor are weighted by student-course weights and control for all student variables in Table 5 interacted by grade and missing indicators for teacher experience, licensure pathway, and credential type. Model in column 3 also controls for WEST-E field indicators. Standard errors are clustered at the teacher level. BA = bachelor’s; CTE = career and technical education; B&I = business and industry; MA = master’s; Ref = reference; WEST—B = Washington Educator Skills Test—Basic; WEST—E = Washington Educator Skills Test—Endorsement; SWD = student with disabilities.
P-values from two-sided t-test: *p < .05, **p < .01, ***p < .001.
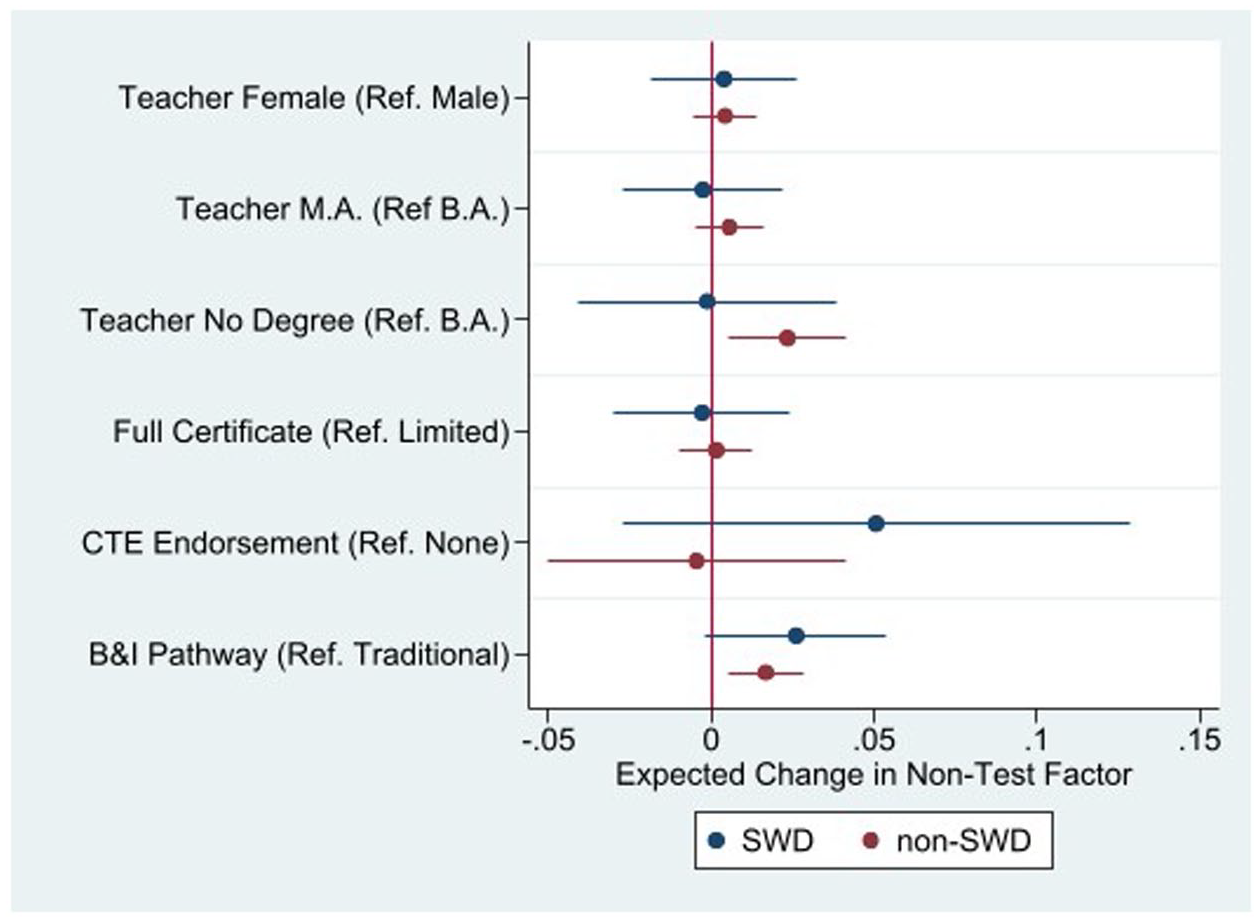
Expected Changes in Non-Test Outcomes Associated With Select CTE Teacher Variables, SWD and Non-SWD
Discussion
This is one of the first studies to explore the connections between CTE teacher characteristics and student non-test outcomes (following Chen et al., 2023), and, to our knowledge, it is the first to disaggregate outcomes separately for SWDs. We find significant relationships between CTE teacher licensure pathways and student non-test outcomes, with students of CTE teachers from the state’s B&I pathways having better non-test outcomes than students with CTE teachers from traditional CTE preparation programs. These relationships are particularly strong for students in higher grade levels, suggesting that CTE teachers may be particularly important in grade levels in which there is more variation in the non-test outcomes we consider (e.g., absences and disciplinary incidents). There are important limitations to consider in this study, outlined in the next subsection, but also some potential policy implications that we discuss in the last subsection.
Limitations
The primary limitation of this study is that the estimation of teacher effects on non-test outcomes is a relatively new empirical terrain, particularly when it comes to CTE. Our robustness checks suggest that our estimates exhibit little forecast bias (Chetty et al., 2014), but we are still cautious to discuss all results in this article in descriptive terms, as we do not believe there is sufficient evidence about the types of empirical models used in this paper to support causal conclusions. Future work could seek to further validate the estimates from these models following emerging research on academic teachers and impacts on other non-test outcomes (e.g., Backes et al., 2022a).
We are also concerned that our focus on non-test outcomes at the high school level may miss important relationships with longer-term outcomes such as college attendance, employment, and earnings. Indeed, the strongest relationships for CTE participation tend to be with employment outcomes (e.g., Theobald et al., 2019), and prior work from Massachusetts has connected CTE teacher licensure directly to student earnings after high school (Chen et al., 2023). In follow-up work, we plan to leverage data from Washington’s P-20 data warehouse to study these relationships in the state’s context to capture the full range of potential relationships between CTE teacher characteristics and student outcomes.
Finally, while Figure 1 provides some evidence that the B&I pathway in Washington is at least comparable to licensure pathways that exist in other states, it is not clear whether the results from this analysis will generalize to other settings and states. A principal conclusion of cross-state studies of CTE (e.g., Goldring et al., 2021) is that relationships between CTE participation and later student outcomes can vary considerably across states, so we urge further research that leverages data from additional states to explore the robustness of these findings.
Policy Implications
Despite the limitations discussed, we believe that this analysis can support some preliminary policy conclusions. The first is related to concerns, outlined extensively in the introduction, that CTE teachers who enter the profession through alternative pathways may not have sufficient pedagogical preparation to serve students, particularly students with diverse learning needs such as SWDs. In terms of the non-test outcomes we investigate, the findings reported in this article assuage these concerns as students actually tend to have better non-test outcomes (i.e., fewer absences and disciplinary incidents) when assigned to CTE teachers from this pathway (as well as older teachers without a college degree who entered prior to the formal B&I pathway) relative to traditionally prepared CTE teachers. It is unclear what the mechanism for this relationship might be, and it will be important for future work to explore whether these relationships extend to longer term outcomes such as employment and earnings, as there are good reasons to believe that these teachers have better employment and industry connections given the requirements of the pathway.
Given the precision of our estimates, some of the nonsignificant findings are also worth noting. For example, despite considerable statistical power, we do not find a significant difference in non-test outcomes between students assigned to CTE teachers who are fully licensed compared to students who are assigned to CTE teachers with a limited license (e.g., emergency or temporary). Finally, the relatively minimal differences in the relationships for students with and without disabilities also suggest that we need to better understand the importance of the preparation that CTE teachers receive to serve SWDs in these different licensure pathways. For example, the fact that SWDs tend to have better outcomes when assigned to CTE teachers from the B&I pathway may be surprising given that these teachers receive limited formal preparation to instruct these students. More evidence is therefore necessary about CTE preparation to teach SWD to inform program policies and improvement.
Finally, this article points to the benefits of better connecting the CTE, teacher education, and special education research and practice communities. As a specific example, it is not clear what professional organization would be primarily responsible for supporting the preparation of CTE teachers to serve SWDs in their classrooms: the Association for Career and Technical Education (ACTE) does not prepare teaching standards, while resources prepared by organizations like the Council for Exceptional Children (CEC) and American ACTE (AACTE) do not typically provide information specific to CTE. This article is therefore an early attempt to connect disparate traditions and fields that could be coordinated more closely to support the education of SWDs who are disproportionately represented in secondary CTE courses.
Footnotes
Appendix
Teacher Predictors of Non-Test Outcomes for SWD in CTE Courses, Pooled Across Grades by Outcome.
| Column | (1) | (2) | (3) | (4) | (5) | (6) |
|---|---|---|---|---|---|---|
| Grade | Pooled | Pooled | Pooled | Pooled | Pooled | Pooled |
| Outcome | Non-test factor | Log excused absences | Log unexcused absences | Log disciplinary incidents | Log suspensions | GPA |
| Students | SWD | SWD | SWD | SWD | SWD | SWD |
| Teacher Female | 0.0040 | −0.0090 | −0.0264* | −0.0024 | −0.0010 | −0.0136* |
| (0.011443) | (0.012297) | (0.012439) | (0.003247) | (0.002432) | (0.005307) | |
| Teacher MA Degree (Ref. BA) | −0.0025 | 0.0200 | −0.0266 | 0.0015 | 0.0006 | 0.0007 |
| (0.012543) | (0.014068) | (0.014735) | (0.003532) | (0.002691) | (0.005673) | |
| Teacher No Degree (Ref. BA) | −0.0013 | −0.0258 | −0.0329 | 0.0018 | 0.0021 | 0.0089 |
| (0.020129) | (0.027886) | (0.021710) | (0.005506) | (0.004138) | (0.008089) | |
| Teacher 5-10 Years Exp (Ref. 0-5 Years) | −0.0411 | −0.0298 | 0.0204 | 0.0229 | 0.0018 | 0.0197 |
| (0.057173) | (0.034656) | (0.038921) | (0.015835) | (0.014110) | (0.016301) | |
| Teacher 10-20 Years Exp (Ref. 0-5 Years) | 0.0008 | −0.0048 | −0.0069 | 0.0016 | 0.0016 | 0.0077 |
| (0.018036) | (0.021353) | (0.023018) | (0.005156) | (0.003827) | (0.008505) | |
| Teacher 20+ Years Exp (Ref. 0-5 Years) | −0.0017 | −0.0037 | −0.0231 | 0.0026 | 0.0007 | 0.0017 |
| (0.017971) | (0.021090) | (0.026706) | (0.005207) | (0.003859) | (0.009144) | |
| Teacher Born in 1960s (Ref. <1960) | −0.0132 | −0.0081 | −0.0114 | 0.0063 | 0.0046 | 0.0136 |
| (0.019957) | (0.018714) | (0.029095) | (0.005796) | (0.004363) | (0.009439) | |
| Teacher Born in 1970s (Ref. <1960) | 0.0079 | −0.0234 | −0.0327 | −0.0022 | −0.0016 | −0.0108 |
| (0.013237) | (0.014546) | (0.019032) | (0.003719) | (0.002808) | (0.006434) | |
| Teacher Born in 1980s (Ref. <1960) | 0.0042 | −0.0038 | 0.0233 | −0.0019 | −0.0013 | −0.0036 |
| (0.015822) | (0.018515) | (0.013949) | (0.004334) | (0.003427) | (0.006854) | |
| Teacher Born in 1990s (Ref. <1960) | 0.0107 | −0.0101 | −0.0160 | −0.0025 | −0.0010 | −0.0106 |
| (0.018098) | (0.014730) | (0.018354) | (0.005141) | (0.003921) | (0.007613) | |
| Full Certificate (Ref. Limited) | 0.0061 | −0.0045 | −0.0077 | 0.0000 | 0.0012 | −0.0067 |
| (0.037993) | (0.022658) | (0.033321) | (0.011654) | (0.009134) | (0.012841) | |
| CTE Endorsement (Ref. None) | −0.0029 | −0.0073 | 0.0023 | 0.0004 | 0.0005 | −0.0087 |
| (0.013728) | (0.012154) | (0.014805) | (0.003926) | (0.002994) | (0.007166) | |
| B&I Pathway (Ref. Traditional) | 0.0260 | −0.0239 | −0.0248 | −0.0045 | −0.0040 | 0.0073 |
| (0.014186) | (0.015451) | (0.015844) | (0.003904) | (0.003101) | (0.006219) | |
| Observations | 254324 | 254324 | 254324 | 254324 | 254324 | 254324 |
Note. Regressions predicting outcome in third row of table are weighted by student-course weights and control for all student variables in Table 5 interacted by grade and missing indicators for teacher experience, licensure pathway, and credential type. Standard errors are clustered at the teacher level. SWD = students with disabilities; CTE = career and technical education; GPA = grade point average; MA = master’s; Ref = reference; BA = bachelor’s; B&I = business and industry.
P values from two-sided t-test: *p < .05. **p < .01. ***p < .001.
Acknowledgements
We thank the Washington Office of Superintendent of Public Instruction (OSPI) for providing the confidential data used in this paper through data-sharing agreement 2021DE-009, as well as Carly Urban and partners at OSPI, including Avram Bourdeau, Rachel Buckle, Jamie Mazzola, Michelle Rogers, Cameron Smith, Kaori Strunk, and Rebecca Wallace, for comments that improved the manuscript. Responsibility for any and all errors rests solely with the authors.
Declaration of Conflicting Interests
The author(s) declared no potential conflicts of interest with respect to the research, authorship, and/or publication of this article.
Funding
The author(s) disclosed receipt of the following financial support for the research, authorship, and/or publication of this article: The research reported here was supported by the Institute of Education Sciences, U.S. Department of Education, through Grant R324A200092 to the University of Washington. The opinions expressed are those of the authors and do not represent views of the Institute or the U.S. Department of Education.