
Abstract
Criminal justice reforms and corrections cost forecasts require appropriate estimates of the marginal costs of incarceration to adequately assess cost savings and projections. Average costs are simple to calculate while marginal cost calculations require much more detailed data and advanced methods. We undertook a scoping review to identify, report, and summarize the existing academic and gray literature covering the different estimation methods of calculating the marginal costs of incarceration, following the Arksey and O’Malley framework. Eighteen publications met criteria for inclusion in this review, with only one from the peer-reviewed literature. The three main approaches in the literature and their use are reviewed and illustrated. We conclude that there is a lack of, and need for, peer-reviewed literature on methods for calculating the marginal cost of incarceration, and marginal cost estimates of incarceration, to assist program evaluation, policy, and cost forecasting in the field of corrections.
The Costs of Incarceration
After many years of rapid growth, the adult incarceration rate in the United States has been declining steadily since 2008. In 2018, the adult incarceration rate in the United States was 650 adult inmates per 100,000 Americans, a decrease of 8% from 2008 (760 adult inmates per 100,000 Americans; Maruschak & Minton, 2020). Despite the decrease, the United States continues to have the highest incarceration rate in the world. By comparison, the incarceration rate in 2018 was 604 in El Salvador (the highest for the rest of the Americas), 324 in Brazil, 214 in New Zealand, 172 in Australia, 140 in England and Wales, 127 in Canada, 75 in Germany, and 41 in Japan (Malakieh, 2020; Walmsley, 2018). Furthermore, the amount of government spending on incarceration in the United States continues to increase even though the incarceration rate and the number of incarcerated individuals have declined. Total state spending on correctional institutions was approximately US$42.1 billion in 2016, an increase from US$33.4 billion in 2006, by 26% in nominal terms and by 7% in real terms after adjusting for inflation (Hyland, 2019; Perry, 2008, U.S. Bureau of Statistics, n.d.).
The high monetary costs of imprisonment and highest rate of incarceration in the world are some of the factors that are driving the demand for criminal justice reform in the United States (Executive Office of the President of the United States [EOP of the United States], 2016). The present high incarceration rate and prison population numbers in the United States are mainly the result of policies that have promoted heavier penalties, as examples, longer minimum sentences, harsher penalties for repeat offenders, three-strikes-and-you’re-out laws, truth-in-sentencing laws, as well as the expansion of criminal code offenses and higher conviction rates (Austin et al., 2016; EOP of the United States, 2016; Mai & Subramanian, 2017; National Research Council, 2014). Meanwhile, governments are struggling with tight budgets, and are looking at ways to minimize the growth in incarceration and spending. To effectively do so, policy-makers must have a good awareness of the fiscal implications of potential reforms and alternatives to incarceration, and make informed decisions that will result in policies that reduce the costs to governments and to society as a whole (Austin et al., 2016; Henrichson & Delaney, 2012). Furthermore, cost savings for the government from incarceration reforms present opportunities to spend money on effective alternatives to prison time, such as probation, electronic monitoring, treatment, community service, fines, and restitution, and to support education and employment opportunities of at-risk groups to reduce crime and arrest rates (Austin et al., 2016; EOP of the United States, 2016).
To understand the fiscal impact of reforms, we must understand and quantify the costs of incarceration. Current estimates of the costs of incarceration are often generated in practice by taking total aggregate direct government spending on incarceration, and then calculating the average cost per inmate. This average direct cost estimate is relatively simple to calculate, and total spending and population data are often published and freely available (Mai & Subramanian, 2017; Maxwell, 2015). However, average cost figures are not the best figures to use to forecast custody costs with projected changes in prison populations, nor for evaluating the net benefits of new programs and policies to reduce incarceration and its costs (Henrichson & Galgano, 2013; Maxwell, 2015; McDonald, 1989; Shabses, 2013). These total and average direct costs of incarceration include many cost components which do not vary with changes in the prison population. For example, costs of central administration may not change with the day-to-day, or even year-to-year changes in the prison population. However, some costs, including meals, clothing and supplies, and overtime pay may vary proportionally with the day-to-day changes in prison populations. In addition, full-time staff salaries may not change with day-to-day changes in the prison population, but may change over longer periods as prisons open and close units to deal with temporary changes, add additional prison capacity to reduce overcrowding, and to house a growing number of inmates over time.
Marginal cost calculations and estimates attempt to measure the changes in total costs with changes in the prison population. Marginal costs can be broken down into short- and long-run marginal costs. Short-run marginal costs identify the increase in costs due to incremental or small changes in inmates over a short period of time, and include cost items which are directly variable to the number of inmates. As an example, the incarceration of one additional inmate at a prison or jail is expected to cause immediate increases to the cost of clothing, bedding, and food services (Norwood et al., 2017). Long-run marginal costs identify the increase in costs due to larger changes, typically over longer periods of time, with changes in staffing levels and housing capacity. Long-run marginal costs include variable and step-fixed costs; step-fixed costs are costs that do not change unless output increases or decreases outside of a given range of operation (Henrichson & Galgano 2013). For example, the incarceration of 1 to 10 additional inmates may not require additional correctional staff; however, the incarceration of 11 additional inmates in a facility may require more correctional staff to work at the prison or jail, and may require opening up new space with new beds and equipment.
Marginal costs are more complicated to calculate than average costs, requiring detailed data that are often difficult and time-consuming to obtain (Funke, 1981; Henrichson & Galgano, 2013). It is possible that the extra effort involved in calculating the marginal cost is a deterrent for those tasked with estimating the cost of changes in incarceration. However, if the average cost instead of the marginal cost was used to calculate changes in the cost of incarceration with changes in prison populations, the cost of incarcerating one more inmate would likely be well overestimated (Brown, 2000; Henrichson & Galgano, 2013; Morgan, 2018). This means the average cost would overestimate the dollar amount of both costs and savings associated with changes. This is obviously problematic for the evaluation and selection of new policies or programs. By comparison, marginal cost estimates would provide accurate and reliable estimates of costs and savings associated with policy changes or program implementation (Maxwell, 2015; Shabses, 2013).
At this point, it is important to note that the discussion so far has focused only on the costs of governments to operate prisons and jails. Incarceration is also costly to offenders, their families, and to society as a whole, as these costs tend to be excluded from the analysis. Incarcerated individuals suffer from immediate income losses when in jail and losses in lifetime earnings, and suffer from poor health (Cloud et al., 2014; Pager, 2007; Schnittker & John, 2007; Tyler & Brockman, 2017; Weidner & Schultz, 2021; Wildeman & Muller, 2012). Partners, children, and families of incarcerated individuals are affected by losses in household income and benefits, including health care coverage, poor health, and household and marital instability (Arditti & Few, 2006; Massoglia & Schnittker, 2009; Miller & Barnes, 2015; Provencher & Conway, 2019; Turanovic & Rodriguez, 2017; Turney, 2014; Western & Pettit, 2010). Society as a whole is also affected by incarceration through lost public service and social capital, increased possibility of criminal behavior, violence and victimization, anxiety in the public, and links to poor overall population health outcomes (Clear, 2007; Clear et al., 2003; Dumont et al., 2012; Lynch & Sabol, 2004; Renauer et al., 2006; Rose & Clear, 1998; Sampson & Loeffler, 2010; Wildeman, 2012). The total, average, and marginal costs of incarceration are thus much larger than the total, average, and marginal direct costs of incarceration borne by governments. In any evaluation of various policies, programs, and alternatives to incarceration, all of the costs (and of course, all of the benefits) need to be discussed and examined. However, while the effects of incarceration on individuals, families, and society are well-documented and qualified, their associated costs have proven to be challenging to estimate, monetize, and quantify (Provencher & Conway, 2019). As such, current estimates of the costs of incarceration only include the direct costs to government to operate prisons and jails to detain individuals convicted of crimes and individuals awaiting the conclusion of trial proceedings.
With an emphasis of criminal justice reform focused on reducing prison populations and government expenditures on incarceration, we seek to answer the question: How are the marginal costs of incarceration calculated? We present the results and a discussion based on a scoping review of the literature to examine the different calculation methods and their uses.
Scoping Review Methods
The scoping review is increasing in popularity and its use has expanded to many different subject fields in recent years (Peters et al., 2015; Pham et al., 2014). This type of review is typically undertaken to describe the breadth of the existing literature and to summarize and share the research findings with persons or groups who would benefit from having this information (i.e., policy analysts, practitioners, and knowledge users; Arksey & O’Malley, 2005). Consequently, the results of the scoping review are typically used by researchers to identify knowledge gaps, set research agendas, and identify implications for policy and practice (Tricco et al., 2016).
The scoping review is similar to the systematic review in some ways. Both reviews follow a systematic and structured approach to searching and screening the literature and to extracting and presenting the data (e.g., Blonigen et al., 2016; Grant & Booth, 2009; Swaray et al., 2005). The generic (or traditional) review, on the other hand, typically follows a less systematic and structured approach, is smaller in scope (with a focus on recent literature only), and is usually more susceptible to bias (e.g., Grant & Booth, 2009; Pinchevsky, 2018; Whittle, 2018). The critical review, too, follows a less systematic structured approach, is smaller in scope, and is more susceptible to bias given the emphasis of this review type is not on completing a comprehensive search of the literature, but on generating new or innovative conceptualizations or theories based on the literature (e.g., Dae-Young, 2016; Grant & Booth, 2009). The major difference between these other review types and the systematic review is that only the systematic review can evaluate and appraise the quality of the research included in the review (Arksey & O’Malley, 2005).
We followed the Arksey and O’Malley (2005) scoping review methodology to carry out the present literature review, as the aim of this literature review is to identify, report, and summarize (or map) the available literature on methods of assessing the marginal cost of institutional corrections. The main question that guides this literature review is: What are the estimation methods reported in the literature for calculating the marginal cost of incarceration?
Search Strategy, Screening, and Data Extraction
With the advice of a librarian, we selected academic databases for the purpose of this project. To conduct a thorough search of the literature on methods of assessing the marginal cost of corrections, a combination of economics, criminology, and multidisciplinary databases were chosen (Criminal Justice Abstracts, EconLit, JSTOR, NCJRS Abstracts, ProQuest Dissertations, and Web of Science). As well, we included Google in the search strategy to complete a comprehensive search of gray literature on the marginal cost of corrections. All searches were limited to English language literature and included all geographic areas and time periods. We carried out searches within the databases and Google. After many search trials involving a variety of search terms, the following key search terms were used to conduct the searches for the scoping review: (“marginal cost” OR “marginal costs”) AND (“correctional”). This combination of search terms produced the most relevant results across all databases, and the term “correctional” generated more relevant literature than “corrections.” Searches with additional terms such as prison*, imprison*, jail*, or incarcera* sometimes produced much less relevant results depending on the database searched, and so were left out as key search terms for the scoping review. Next, the documents that resulted from the searches were screened. One author (J.L.) screened by title, abstract, or full-text depending on the relevance of each document. The second author (S.J.W.) provided consultation when the appropriateness of a particular document was questioned. In these cases, we deliberated until agreement was reached about whether or not to include a specific document in the literature review.
We defined a set of inclusion criteria prior to screening. The criteria for inclusion and exclusion were refined as the screening process progressed. A document was accepted for inclusion in the literature review if two criteria were met: (a) the population consisted of incarcerated individuals (inmates) and (b) a method for calculating the marginal cost of incarceration was described. The document should also be written in English and published prior to July 2020. Furthermore, we established the types of documents eligible for inclusion in the literature review prior to screening. We anticipated that there would be few relevant documents in the literature (especially the peer-reviewed literature), and so, document types searched in academic databases were set to be inclusive of a wide variety of peer-reviewed and gray publications, including articles, editorials, essays, reviews, books, book chapters, research reports, working papers, conference papers, Master’s theses, and doctoral dissertations. Gray literature was further expanded to include issue papers and briefs, audits, fiscal notes, and reports prepared by governments or non-profits after we became familiar with the literature found on Google. We created a standardized tool to extract relevant data from documents appropriate for inclusion in the literature review, following Levac et al. (2010) and Colquhoun et al. (2014). We collected the following information from each publication that made the literature review for a tabular summary of articles: “Author(s) (year), Country;” “Literature Type;” “Aim(s)/Objective(s);” “Population and Setting, Average Cost Estimate(s);” “Marginal Cost Estimation Method(s);” and “Marginal Cost Estimate(s).” 1
Scoping Review Results
A total of 736 records resulted from searching the academic databases, and search engines selected for this project. 2 After duplicates were removed, 690 records remained. Records were screened by title or abstract, and full-text documents were retrieved for records with abstracts that appeared to meet inclusion/exclusion criteria. After criteria were applied to full-text documents, 17 publications were included in the scoping review. References of these publications were hand-searched by title for additional publications suitable for inclusion in the scoping review. One additional publication was added to the scoping review based on this search. A final total of 18 publications met inclusion criteria for the scoping review. All of the resulting publications presented estimation methods to calculate the marginal direct costs to government of incarceration only, and while not purposefully screened out by our search criteria, none of the publications presented methods to calculate the broader marginal costs of incarceration to society.
Country and Literature Type
All but two publications originated from the United States. Of the two remaining publications, one originated from Canada (Sagynbekov, 2015) and the other from Australia (Queensland Audit Office, 2016). Two publications presented non-original research (i.e., review, theoretical paper; Funke, 1981; Henrichson & Galgano, 2013), while the rest were original research studies. Only one publication was from the peer-reviewed literature (Owens, 2009), with the remaining from gray literature. Of the gray literature publications included in this review, many were academic papers (i.e., technical reports or discussion papers; Block & Ulen, 1979; Sagynbekov, 2015), dissertations (Funke, 1981; Waldfogel, 1990), reports prepared by non-profit research organizations (Austin, 1991; Henrichson & Galgano, 2013; Schlueter et al., 2014), papers or reports prepared by governments (i.e., fiscal reports, audit reports, issue papers or reports; Aos & Drake, 2010; Collins et al., 2014; Congressional Budget Office [CBO], 1977; Maxwell, 2015; Office of Performance Evaluations Idaho Legislature [OPE Idaho Legislature], 2020; Queensland Audit Office, 2016; Rhode Island Office of Management and Budget [Rhode Island OMB], 2015; San Mateo County Civil Grand Jury, 2016), and one performance audit report prepared by a contractor hired by a county government (Christopher Murray & Associates, 2009).
Aims/Objectives
The aims and objectives of publications included in the review varied widely. Two publications explicitly aimed to instruct on methods to estimate the marginal cost of incarceration (Henrichson & Galgano, 2013; Maxwell, 2015). Two were dissertations demonstrating applications of economic theory to corrections (Funke, 1981; Waldfogel, 1990). Three publications were specifically focused on providing marginal cost estimates of correctional systems for policy-makers in California, Pennsylvania, and Saskatchewan (Block & Ulen, 1979; Collins et al., 2014; Sagynbekov, 2015). Two publications focused on the development of tools or models to assist program and policy evaluation and to assess costs (i.e., a tool to identify policies that can reduce crime and costs called Washington State Institute for Public Policy (WSIPP) benefit-cost tool; a cost model of the criminal justice system in Vermont called Vermont Results First; Aos & Drake, 2010; Schlueter et al., 2014). Four publications weighed the costs and benefits of specific correctional interventions (i.e., the effect of an early prison release program on public safety, prison crowding, and costs; a jail diversion program; a policy for shorter sentences; and evidence-based programs for reducing recidivism; Austin, 1991; Christopher Murray & Associates, 2009; Owens, 2009; Rhode Island OMB, 2015). Two publications focused on operational efficiencies at correctional facilities (comparisons between privately and publicly operated prisons in terms of cost efficiencies and quality of containment, supervision, and rehabilitation services; an evaluation of operational changes and efficiency in state corrections; OPE Idaho Legislature, 2020; Queensland Audit Office, 2016). One publication examined the role of bail practices in regards to public safety and protecting the rights of defendants awaiting trial (San Mateo County Civil Grand Jury, 2016), and another explored alternative funding options for the possible construction of new prisons in the future (CBO, 1977). The remaining publication was an annual report on state corrections (Norwood et al., 2017).
Population and Setting
Men, women, and juvenile inmates residing at county jails, state prisons, and federal prisons were the subjects of publications in this review. Inmate population numbers ranged from fewer than 300 inmates at individual correctional institutions (Collins et al., 2014; Rhode Island OMB, 2015) to 43,800 prisoners state-wide (Maxwell, 2015); in some cases, no information was given about inmate population sizes. Some publications specifically estimated the cost of women’s facilities (Queensland Audit Office, 2016), juvenile detention facilities (Aos & Drake, 2010; Collins et al., 2014; Rhode Island OMB, 2015; Schlueter et al., 2014), privately operated facilities (Queensland Audit Office, 2016), and out-of-state placements for prisoners (OPE Idaho Legislature, 2020; Schlueter et al., 2014).
Inmate population numbers and financial data regarding the cost of incarceration (i.e., jail expenditures) were usually gathered from state or provincial corrections departments (Austin, 1991; Block & Ulen, 1979; Collins et al., 2014; Maxwell, 2015; Norwood et al., 2017; OPE Idaho Legislature, 2020; Queensland Audit Office, 2016; Rhode Island OMB, 2015; Sagynbekov, 2015; Schlueter et al., 2014), state child and family services (Rhode Island OMB, 2015; Schlueter et al., 2014), state or national statistics databases (CBO, 1977; Rhode Island OMB, 2015; Sagynbekov, 2015; Waldfogel, 1990), and/or county or state budgets (Block & Ulen, 1979; Collins et al., 2014; Owens, 2009; San Mateo County Civil Grand Jury, 2016).
Marginal Direct Costs to Governments—Estimation Methods and Estimates
There are two primary approaches in the literature to calculate the marginal direct costs of incarceration to governments or organizations—the bottom-up approach and the top-down approach (Henrichson & Galgano, 2013). A third approach, the new capacity cost approach, involves forecasting the capital and operating costs of new capacity.
Method 1: The Bottom-Up Approach—Classifying Cost Components
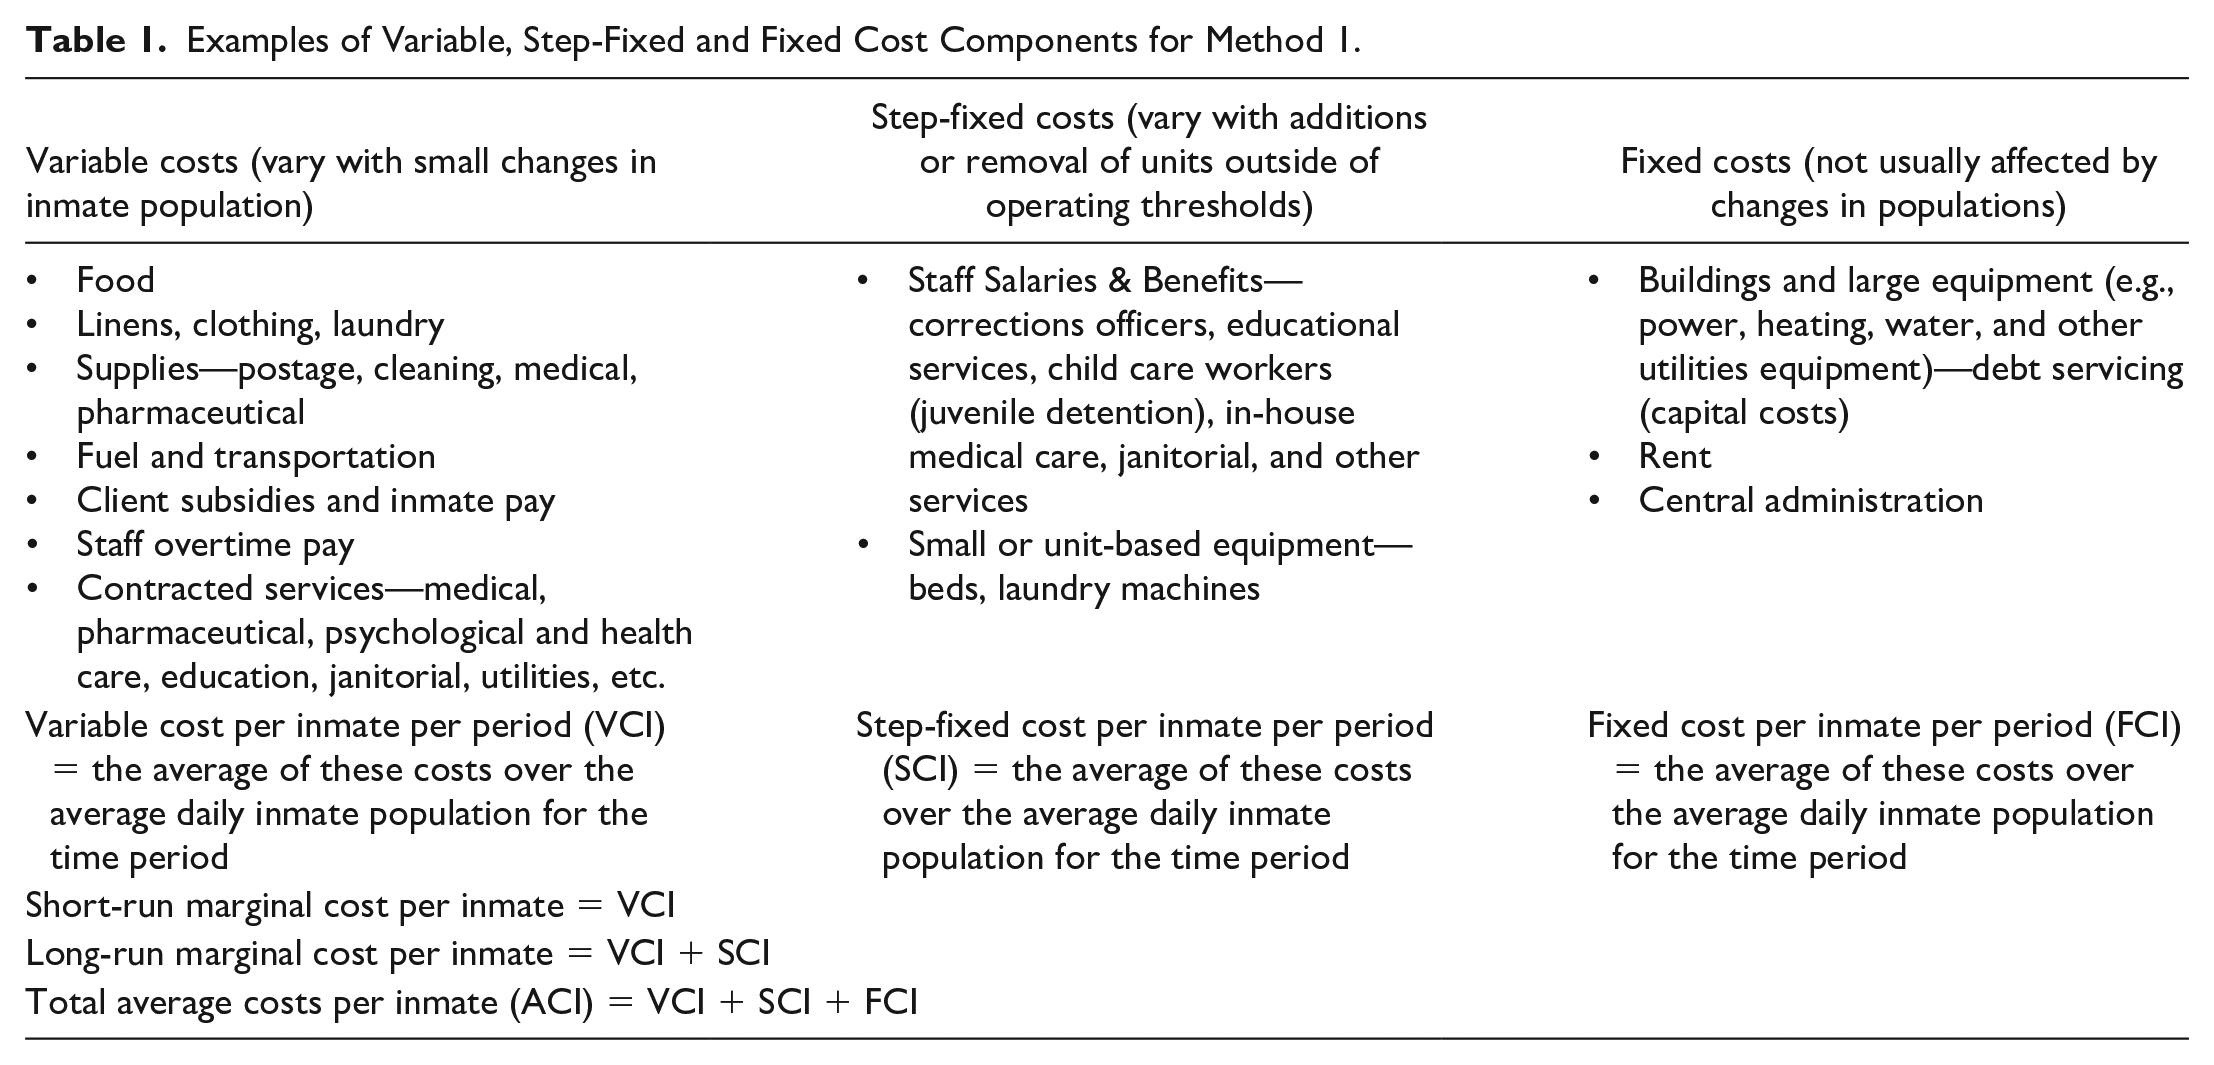
The bottom-up approach follows a method of examining each cost component tied to a prison system, and identifying and classifying the nature of that component as either variable, step-fixed, or fixed, relative to population counts. Variable costs vary in proportion with day-to-day and small changes in population counts. Examples of variable costs include laundry services, food, and overtime pay. Step-fixed costs do not vary within small ranges of population counts, but vary as units are opened and closed for use; staff salaries are the prominent example of a step-fixed cost item. Fixed costs are invariant to prison population levels, with central administrative salaries as an example. Short-run marginal costs per inmate-period are estimated by summing the variable cost components over a given period (e.g., fiscal year) and dividing them by the daily average number of prisoners over that same period. Long-run marginal costs per inmate-period are estimated by summing all of the variable and step-fixed costs and then dividing by the daily average number of prisoners for the period of study.
The bottom-up approach was the most frequently used method of estimating the marginal cost of incarceration in the literature. Of the 18 publications that resulted from the literature review, 10 illustrated the bottom-up approach (Austin, 1991; Christopher Murray & Associates, 2009; Collins et al., 2014; Henrichson & Galgano, 2013; Maxwell, 2015; Norwood et al., 2017; Queensland Audit Office, 2016; Rhode Island OMB, 2015; San Mateo County Civil Grand Jury, 2016; Schlueter et al., 2014).
The first of these articles, Austin (1991), examined the Supplemental Meritorious Good Time (SMGT) program of early release on public safety, prison crowding, and on costs for the State of Illinois. As part of the evaluation, Austin estimated the cost of adding one inmate to a corrections institution for 365 days using the bottom-up approach with data from the Illinois Department of Corrections (IDOC). The marginal cost calculation included items deemed to vary with inmate counts—meals, clothing, household and equipment supplies, medical supplies, postage, water and sewer, and miscellaneous contractual services, as well as inmate wages, equipment, and staff overtime. These component costs were summed and then averaged on a per capita basis for fiscal year 1990, so that the marginal cost per inmate-year was US$3,640 in 1990. In comparison, the total costs for IDOC state prisons ranged from US$13,675 to US$20,815 per inmate, so that the short-run marginal costs ranged between 17% and 27% of average costs.
The bottom-up method was used by Christopher Murray & Associates (2009) to evaluate a drug treatment and education program as an alternative to jail custody for pre-trial defendants and short-term sentenced felons, called Breaking The Cycle, for Pierce County, Washington. The direct variable cost estimates of incarceration were calculated using the per capita average costs of facilities, care and custody of prisoners, food, medical, pharmacy, medical escort and mental health services. These direct costs amounted to US$6,508 per inmate-year, or US$17.83 per inmate-day in 2009; this was the short-run marginal cost estimate. The average costs of staff per bed at facilities were then added to derive the long-run marginal cost estimates, at US$49.10 per inmate-day in general population units, US$52.00 per inmate-day in Escort Units, and US$66.49 per inmate-day in intake units. Administration and staff training, reception, maintenance, legal research, pre-trial investigations, and work crew costs were among the items excluded from variable and step-fixed costs. The total average cost was US$105.78 per prisoner per day. Given these estimates, the short-run marginal cost was equal to 17% of average costs, and the long-run marginal costs ranged from 46% to 63% of average costs depending on the type of unit.
In 2013, the Vera Institute published a guidebook to assist policy analysts in calculating marginal costs to use for benefit–cost analyses of criminal justice programs and interventions (Henrichson & Galgano, 2013). This guidebook described both the top-down and the bottom-up approaches to calculating marginal costs, the distinctions between variable, step-fixed, and fixed costs and provided examples of each, and in particular, cited and used Christopher Murray & Associates (2009) for an illustration of using the bottom-up approach to identify and calculate the marginal costs of incarceration.
Several reports have since used the bottom-up approach to calculate short-run and long-run marginal cost estimates of incarceration, to assist policy development and program evaluation (Collins et al., 2014; Maxwell, 2015; Norwood et al., 2017; Queensland Audit Office, 2016; Rhode Island OMB, 2015; San Mateo County Civil Grand Jury, 2016; Schlueter et al., 2014). Each of these publications identified their relevant variable, step-fixed and fixed costs for calculations of short- and long-run marginal costs. The cost components included in the studies and their categorization may differ across organizations for various reasons. Some costs may be borne by different government ministries or organizational units; for example, health care services may be provided to inmates and covered by other government ministries (Queensland Audit Office, 2016). Some types of health care costs may be considered as variable costs while others are considered as step-fixed costs (Maxwell, 2015). Juvenile detention facilities are often more expensive and have high variable and/or step-fixed costs due to contracted and/or in-house educational and developmental services provided to youth (Collins et al., 2014; Rhode Island OMB, 2015). Maximum security, minimum security, and county jails have different security features, and have different fixed costs, and different step-fixed costs with different staff training and experience requirements. And cost items which may normally be classified as fixed costs to a facility (capital costs and facility administration) become step-fixed costs to governments and corrections departments when new prisons and jails are built (see Methods 2 and 3 below).
Table 1 provides summative examples for the three different types of costs (variable, step-fixed, and fixed) defined by the reviewed publications using the bottom-up method. For each facility and organization, short-run marginal costs are always less than long-run marginal costs, which are always less than total average costs, per inmate per period. From the reviewed literature using the bottom-up approach, the short-run marginal cost estimates average approximately 15% of average costs, while the long-run marginal cost estimates average approximately 70% of average costs.
Examples of Variable, Step-Fixed and Fixed Cost Components for Method 1.
Method 2: The Top-Down Approach—Regression Models
The top-down approach of calculating the marginal cost of incarceration was also described by Henrichson and Galgano (2013). The top-down approach uses aggregate data for prisons, their total costs and number of prisoners, and then examines how total costs change over different levels of prisoners, over time, and/or across individual institutions. Short-run marginal costs are estimated by empirically assessing changes in total costs due to small changes in the number of prisoners, in short time periods and over small workload ranges. Long-run marginal costs are estimated by empirically assessing changes in total costs due to large changes in the number of prisoners and over longer time periods. Regression methods are commonly used to empirically estimate these marginal costs.
Of the 18 publications that resulted from the literature review, seven explained and/or used the top-down approach (Aos & Drake, 2010; Block & Ulen, 1979; Funke, 1981; Henrichson & Galgano, 2013; Owens, 2009; Sagynbekov, 2015; Waldfogel, 1990). Of this set of articles, Funke (1981) provided a review of Block and Ulen (1979), while Henrichson and Galgano (2013) included a review of the method, and neither presented any new results estimating the marginal costs of incarceration.
A general model used in regression analysis and applied to corrections data is:

In this model, EXP is real expenditures (adjusted for inflation), ADC is the average daily inmate count, X is a matrix of additional explanatory variables, and the subscript i either indexes time for a specified single prison in a time-series study, or indexes individual prisons in a cross-section study of many prisons at one point in time.
Block and Ulen (1979) provided the first attempt at estimating the marginal costs of corrections using regression models, for state and county jails in California, using both time-series and cross-sectional data. 3 The model in Equation 1 was first applied to time-series data over 1948 to 1964 from the maximum security Folsom State Prison and three medium security prisons, the Correctional Training Facility (Soledad), the Deuel Vocational Institute (Deuel), and the California Man’s Colony (San Luis Obispo). Folsom State Prison did not experience any capacity changes over the period, so that the marginal cost estimates are short-run estimates, while the three medium security prisons did experience considerable changes in capacity so that their marginal cost estimates are long-run estimates. The estimates for the short-run marginal cost of incarceration for Folsom State Prison were US$296 per inmate-year with no other explanatory variables, US$268 per inmate-year when the fraction of inmates who committed violent crimes was included in the matrix X from Equation 1, and US$207 per inmate-year when a time trend was included in the matrix X, all in 1967 real dollars. The marginal cost estimates for Deuel and San Luis Obispo were US$1,773 and US$1,548 per inmate-year, respectively with no other variables included in X. The regression for Soledad included a statistically significant and negative coefficient estimate for the square term of ADC, and so that, the marginal cost estimate ranged from US$874 per inmate-year with an ADC of 600 (its design capacity in 1948), to US$827 per inmate-year with an ADC of 3,239 (its design capacity in 1964), all in 1967 dollars. The model in equation 1 was then applied to cross-sectional jail data using ordinary least squares (OLS). The estimates of marginal costs across California City and county jails were US$2,881 per inmate-year when no other variables were included, US$2,040 per inmate-year at the ADC mean of 240 when the squared term of ADC was included, and US$1,627 per inmate-year when detention floor space per bed was included as an explanatory variable, all in 1971/1972 dollars. Given the data provided in Block and Ulen (1979), the average cost may only be calculated for Folsom State Prison, at US$1,281 in 1967 dollars, and the short-run marginal cost estimate of US$296 per inmate-year was 23% of the average cost (p. 26). The long-run marginal costs for Deuel and San Luis Obispo medium security facilities were approximately equal to their average costs (Block and Ulen, 1979, p. 13).
The basic regression model in Equation 1 was also used by Waldfogel (1990), using weighted least squares (WLS) to examine the cost structure of US state prisons in 1985, with the prison population, prison population squared, and the ratio of prison population to prison capacity used as explanatory variables (p. 136). The marginal cost of incarceration was increasing in the number of inmates, and ranged from US$20,304 per inmate-year in North Dakota with a relatively small state prison population to US$45,677 per inmate-year for the large prison population in Texas in 1985 dollars. The median state prison population was 10,500 in 1985, with an implied marginal cost estimate of US$27,350 per inmate-year.
The estimation techniques used to examine marginal costs of incarceration may also be expanded for a panel study, which examines cross-sections of many institutions over many time periods:

This model controls for unobserved effects which are fixed for each individual prison (i) over time (t). The fixed effects panel regression (FEPR) version of this model was used by Owens (2009) using data for 24 Maryland state prisons over the 1993 to 2005 period, and included year effects, dummy variables which captured periods when capacity was increasing and when decreasing, dummy variables for minimum and maximum security prisons, as well as multiplicative variables of each of these dummies with average daily prison population. The marginal cost estimate per inmate-year was US$11,000 when no dummies or interactive variables were included, and US$13,000 per inmate-year with the full set of controls, all in 2005 dollars. These marginal cost estimates ranged from to 46% to 55% of average costs.
One of the most revolutionary advances in regression estimation methods has been the development of techniques to account for the non-stationary properties of many time-series that trend over time. The error correction model (ECM) was formalized by Granger (1981) and Engle and Granger (1987), and refined by Johansen (1988), and may be used for individual time-series as well as for panels. If there is a long-run stationary relationship between the variables, the series are said to be cointegrated. The following model may be used to estimate both short- and long-run relationships between the variables of interest, in this case, average daily prison population, and real expenditures:

For this panel model (i is the individual prison series index and t is the time index), the long-run marginal cost of incarceration estimate is α, the immediate short-run marginal cost estimate is

In contrast to this model specification, the application of equations 1 and 2 may result in spurious regressions if the series are non-stationary and not cointegrated.
The ECM model was used by Aos and Drake (2010) to provide marginal cost estimates of incarceration for county and state adult prisons as well as for county juvenile institutions in Washington State. It was first applied to county adult jail data from 39 counties in Washington over the 1995 to 2008 period. The immediate short-run, three-period short-run, and the long-run marginal cost estimates were US$3,457, US$33,533, and US$39,640 per inmate-year in 2009 dollars, respectively; in comparison, average costs were US$28,900 per inmate-year in 2009 dollars. While the long-run relationship was statistically significant, the short-run estimates had high standard errors and only the second lag of the change in the average daily population variable was statistically significant at the .10 level. This model was then applied to the annual state juvenile detention expenditure and average daily population data from 1974 to 2009, with the additional control of state real per capita income. The series were not cointegrated, so that, no long-run relationship existed and no long-run marginal cost could be estimated. The contemporaneous (immediate) short-run marginal cost estimate was US$5,846 per inmate-year, and the three-period marginal cost estimate was US$36,743 per inmate-year, while the average cost was US$51,716 per inmate-year, all in 2009 dollars. The regression estimates were, however, not statistically significant at the .10 level. The model was also applied to annual state adult corrections data and average daily population data from 1982 to 2009, again with the additional control of state real per capita income. These series were not cointegrated, and so no long-run marginal cost could be estimated. The contemporaneous and four-period marginal cost estimates were US$4,495 and US$13,921 per inmate-year, and 14.3%, and 44.3% of average cost, respectively, in 2009 dollars. These regression estimates did have high standard errors, with only the second and third lags of the change in average daily population variables being statistically significant at the .10 level. The short-run marginal costs for these three types of facilities in the state of Washington ranged from 11% to 14% of average costs, while the long-run marginal costs ranged from 44% to 137% of average costs.
The most recent attempt to provide regression estimates of the marginal cost of incarceration was by Sagynbekov (2015), who used several time-series approaches and structured cost functions with annual adult corrections data for real expenditures and average daily inmate counts over 1981 to 2012 from the province of Saskatchewan in Canada. Equation 1 was first applied to the annual data using OLS with time trends, and generated a marginal cost estimate of US$22,290 per inmate-year in 2002 dollars. The ECM model of Equation 3 was then applied to the data, with the series exhibiting non-stationary properties. No long-run cointegrating relationship was found between the expenditure and count series. The contemporaneous short-run marginal cost estimate was US$21,996 per inmate-year, and the three-period marginal cost was US$27,716 per inmate-year, in 2002 dollars.
Sagynbekov (2015) also estimated Equation 1 by OLS, with the prices for labor (real average wages) and for capital (interest payments as a percentage of revenues) included as additional explanatory variables in a structured cost function using average daily inmate counts, and in another structured cost function using average daily counts for both sentenced and remanded (pre-trial detention) inmates. The marginal cost estimates were US$25,774 per inmate-year, US$35,161 per sentenced inmate-year, and US$65,462 per remanded inmate-year, all in 2002 constant dollars, evaluated at the average daily counts for 2012; however, these estimates were not statistically significant at the .10 level and had large confidence bounds.
In these publications, the marginal costs of incarceration were calculated using the operational expenditures of custodial corrections of individual facilities or counties (Aos & Drake, 2010; Block & Ulen, 1979; Owens, 2009), or using aggregate data at the state or provincial level (Sagynbekov, 2015; Waldfogel, 1990). As was the case with the studies using the bottom-up approach, the data include primarily direct expenditures for custodial operations, and may not include the costs of capital which change over time and by facility size, or the costs of services provided by other agencies (e.g., health care).
The primary advantages of Method 2 are that it does not require data on all of the cost components, and that it statistically determines how a cost series changes with changing populations, rather than the Method 1 requirement of having the cost component data, and identifying and assuming which cost components change with changing populations. The primary disadvantages of Method 2 are that it requires a large sample of observations, either through time (a time-series sample of one facility or organization), across facilities (a cross-sectional sample in a given period), or across both time and facilities (a panel sample), and that Method 2 estimates are generated as a statistical average over the sample, with some degree of variance (a point estimate with a confidence band of statistically probable values), while Method 1 requires only data for one period, and provides one estimate for that given period, following the assumptions made.
Method 3: The New Capacity Cost Approach—Building and Operating New Facilities
The third method for calculating the marginal costs of incarceration is an extension of the long-run costing approaches from Methods 1 and 2, and involves estimating the cost of building and operating a new facility to deal with growth in the prison population. Three studies using this approach were identified in our scoping review. In these cases, the costs of constructing new buildings are considered step-fixed costs. These estimates look specifically to the future costs of adding capacity combined with the operating costs of model prisons, while estimates developed using either of the top-down or bottom-up approaches used existing data on costs and inmate counts to assess marginal costs due to changes in prison populations as experienced in previous years.
In 1977, the Bureau of Prisons estimated that the federal inmate population would increase from 32,900 in 1976 to 39,200 in 1987 (CBO, 1977). As such, new facilities were being planned. The average budgeted operating costs amounted to US$9,600 per inmate-year without including depreciation. Estimates of the costs of operating new facilities at contemporary standards were developed based on the costs of new prison construction and operation at Pleasanton, California, and at Oxford, Wisconsin. The total annual operating costs per inmate were estimated by category (security, food and farm operations, counseling and case management, medical, psychiatric and drug services, education and vocational training, other inmate services, maintenance and operations, general administration, and pay adjustments), at US$13,520, which was 40% higher than the average cost per inmate at existing facilities. An additional US$3,785 was allocated for the annual amortization of capital costs, for a total estimate of US$17,305 per inmate for new prisons.
While Austin (1991) provided marginal cost estimates using the bottom-up approach reviewed above for the SMGT program for Illinois, the program was projected to substantially reduce the prison population, by up to 4,161 minimum security inmates by the year 2000, and to avert new prison construction and operation. Operational costs for new minimum security prisons were estimated at US$17,046 per inmate-year given 1991 fiscal year costs, and new capital costs were projected at US$43,433 per bed in fiscal year 1991. These capital costs amortized over 20 years at the 8% interest rate for state bonds would equate to US$4,466 in annual capital costs per bed, an additional 26% above annual average operating costs, for a total long-run marginal cost estimate of US$21,512 per inmate-year in 1991 dollars for rising minimum security prison populations requiring new facilities.
More recently, the OPE Idaho Legislature (2020) conducted an assessment of its correctional capacity, in light of the tremendous growth in its prison population, in-state capacity shortages, and the increased contracted use of county jails and of prisons in Texas. On a contractual basis for the Idaho Department of Corrections, the estimated marginal cost of an additional inmate-day was US$55 for the first 7 days, and US$75 thereafter for placements in Idaho county jails, but inmates at county jails do not receive the enhanced medical, psychological, and educational programming received at state prisons, valued at up to US$25 per day. In light of the insufficient capacity for inmates at Idaho state prisons, the estimated marginal cost of corrections was US$95 per inmate-day at county jails if services were enhanced to levels at state prisons. By comparison, the efficiency average cost benchmark for Idaho state medium security prisons was US$82 per inmate-day for men’s prisons. The contracted costs per inmate-day were US$82 for out-of-state placements at Eagle Pass, Texas, and these were the estimated marginal costs incurred per inmate while the department was dealing with insufficient in-state capacity. The department estimated that the inmate population might grow from 9,458 inmates in 2020 to 10,300 in 2021, and to 10,800 in 2025. To mitigate the lack of in-state capacity and high cost of contract placements, OPE Idaho Legislature (2020) estimated that new medium security prisons operating at high efficiency would cost US$77.41 per inmate-day, which includes operating and capital costs, and was slightly less than the marginal costs of contract facilities and the average cost at the efficiency state prison benchmarks, suggesting operational efficiencies and savings by building and operating new facilities, versus contracting for out-of-state placements when custodial needs continually exceed in-state capacity.
This approach may also be modified for use in cases where facilities are decommissioned. The reductions in operating costs (e.g., facility staff) and any additional capital decommissioning costs (e.g., clearance and clean-up costs) must be included in organizational planning. For example, long-run cost studies at the organization level (departments or governments) should include these costs as old facilities are decommissioned, just as when new facilities are opened.
Discussion
The literature identified in this scoping review present three distinct methods to calculate the marginal direct costs of incarceration to governments, and indicate how important it is to identify and use the appropriate marginal costing methodology for the situation. First, the institutional environment and nature of the data used for the exercise must be addressed. Will the marginal cost estimates reflect only the direct costs borne by the facility itself or by the corrections department or organization as a whole (i.e., at the state level)? This question will help define which costs will be included and excluded from the analysis. For example, some health care costs may be covered by other organizations or government agencies (Queensland Audit Office, 2016). In addition, the standard fixed costs of administration and buildings of a new facility may be step-fixed costs for an organization or government, especially in a time-series study when new buildings and capacity are added and/or decommissioned over a large time period (Austin, 1991; Block & Ulen, 1979; CBO, 1977; OPE Idaho Legislature, 2020; Sagynbekov, 2015). Second, the data itself will help dictate which approach will be used. If the data are of a short-term nature, for one or a few facilities, and contain costs for various accounts (i.e., is disaggregated by cost type or component), then the analysis should use Method 1—the bottom-up approach. If the data span a large time period and/or a large number of facilities (for more than 40 observations), and are primarily at the aggregate level, then Method 2—the top-down approach—is appropriate. If, however, the question is one of constructing (or decommissioning) new facilities, then facility-level fixed costs of capital and administrative staff need to be projected and incorporated (with additional step-fixed, but temporary decommissioning costs), and Method 3 is the suitable approach combined with Methods 1 or 2 to address operational cost changes.
The literature illustrates the marginal cost differences across different types of institutions and settings. Female and male facilities, state prisons, county jails, and juvenile detention centers were examined. These facilities serve different functions and offer different programming. Juvenile detention facilities tend to have higher short-run (and/or long-run) marginal costs associated with contract (or in-house) educational and youth development services. Maximum security prisons require enhanced security features and personnel training.
The literature also shows how important it is to use the appropriate marginal cost estimates as opposed to average cost estimates, for forecasting, and for program evaluation and policy changes, be they for short-run small changes in prison populations, for long-run and larger changes in populations, or for growing prison populations requiring the construction and operation of new facilities. Overall, for the studies using either the top-down or bottom-up approaches, the short-run marginal cost estimates average approximately 20% of average costs, while the long-run marginal cost estimates average approximately 70% of average costs; however, long-run marginal cost estimates using regression models may exceed average costs, typically when facilities are operating near or above official capacity. When the costs of constructing and operating new facilities are used to estimate the marginal costs of housing additional inmates, these costs per inmate-day may range from 94% of average costs for new efficient facilities in Idaho in the 2020s to 140% of average costs for new facilities with improved standards in the 1970s.
Knowing this, it is crucial for analysts, practitioners, and policy-makers to consider cost estimates of institutional corrections that are reliable and accurate for their use and to use the appropriate methodology to assess costs for forecasting or program evaluation. The policy implications of using average cost figures in program evaluation and forecasting are clear. If the policy and program changes and/or forecasts involve small-scale changes in prison populations when prisons are operating at less than full capacity, then the marginal cost estimates to be appropriately used will be much less than (at approximately 20% of) the average cost figures, and the use of average costs will greatly overstate cost savings or cost forecasts. If larger scale changes in prison populations, which require the opening (or closing) of units and/or the conversion of other spaces into custody spaces (e.g., retrofitted gymnasium spaces), along with staffing changes, then the marginal cost estimates will tend to be less than average costs (at approximately 70%), and the use of average costs in program evaluation or forecasting will also tend to overstate changes in costs. By extension, the additional decommissioning or construction and capital costs must be included in the calculation of cost changes when facilities are being decommissioned or built, and these costs may not be included in operating cost figures.
Limitations
The primary limitations of this review are fourfold. First, the literature searches were limited to English language documents only. Second, while the scoping review is intended to report on the extent and nature of the research on a particular topic, it is unlikely that all available English-language literature had been identified in the review. As examples, two recent briefs from the Illinois Sentencing Policy Advisory Council (Saltmarsh, 2018, 2019) illustrated the use of the bottom-up approach and calculated marginal costs over many ranges of prisoner populations for both state prisons and county jails, and were not picked up by our systematic searches but rather by generic searches we had previously conducted; although these documents do not provide a new calculation method, they do provide an additional valuable illustration of an existing method for reference. Third, the literature identified in this scoping review only addressed methods to calculate the marginal direct costs borne by the organizations and governments that supply incarceration services; methods to calculate the marginal direct and indirect costs of incarceration borne by individuals, families, and society as a whole were not uncovered among the publications identified in this scoping review. There is a large body of literature that has identified and qualified these other effects and costs of incarceration, but these costs are difficult to monetize and quantify, although this work is progressing (deVuono-Powell et al., 2015; Provencher & Conway, 2019). The marginal direct costs to government to house people in custody are much less than the overall societal costs of incarceration. Estimates of the marginal lifetime benefits and costs of incarcerating an individual, with the various effects on recidivism, employment, health, and well-being on government, the individual, the family, actual and potential victims, and overall society which accrue over the life-course would be particularly helpful to investigate justice issues, including the marginal effects of sentencing policy changes to and from harsher penalties like mandatory minimums and those for repeat offenders in thorough benefit–cost analyses. Fourth, only one peer-reviewed publication was identified in the search, indicating another potential source of bias in the inferences generated from this literature review, as the peer-reviewed literature on the methods of calculating the marginal direct costs of incarceration to government has not been developed. This scoping review, therefore, should not be considered an exhaustive list of all available literature on the topic of methods of calculating the marginal direct costs of institutional corrections, nor of the marginal costs to society of incarceration.
The strengths of this review also should be mentioned. Scoping reviews have several advantages over generic literature reviews which help achieve rigor (Munn et al., 2018; Peters et al., 2015). Similar to systematic reviews, we established and followed a protocol for searching, screening, extracting data, and presenting information (Peters et al., 2015). We also reported the review’s methodology in a clear and detailed manner and by displaying the data in a useful way for the reader (a transparent and replicable review; Peters et al., 2015). Unlike systematic reviews, scoping reviews do not evaluate and appraise the quality of the research included in the review (Arksey & O’Malley, 2005), and so, this review is limited in that sense (Grant & Booth, 2009). That noted, the scoping review methodology was appropriate for the intended purpose of this project (Munn et al., 2018), which was to map the body of literature on methods of assessing the marginal cost of incarceration no matter the quality of the research (Peters et al., 2015) and answer the specific review question: “What are the estimation procedures reported in the literature for calculating the marginal cost of incarceration?”
Conclusion and Future Directions
A scoping review was undertaken to identify, report, and summarize the available literature on methods of assessing the marginal costs of incarceration. A total of 18 publications met criteria for inclusion in the review, and only one of these publications was from the peer-reviewed literature. All other publications were from the gray literature, the majority of which were found on Google (i.e., 10 publications). All of the publications included in the review provided methods to only calculate the direct costs to governments to incarcerate individuals—no publications were found on methods to calculate the broader marginal costs of incarceration to society, including the costs to incarcerated individuals and their families, with the search criteria.
The following methods to estimate the direct costs to government of incarceration were identified in the literature, along with their applications, and presented in this review: The bottom-up approach of identifying the nature of specific cost components as variable, step-fixed, and fixed in relation to changes in inmate counts; the top-down approach that uses regression estimation methods; and the approach of estimating the capital and operating costs for new capacity. The marginal direct cost estimates of incarceration in the short run, for small changes in population counts, averaged approximately 20% of the average direct costs of operating custodial facilities in the publications reviewed, while those in the long run, which allow for changes in capacity and staffing levels, averaged approximately 70% of average direct costs. Marginal direct cost estimates using the new capacity cost approach incorporate fixed capital costs and were slightly less than the average costs of existing facilities when operational efficiencies were improved, and were up to 40% higher than existing average costs when new facilities were to be built with improved and more costly operational standards. These results indicate that the evaluation of changes in carceral policies and programs that affect carceral populations, and cost forecasts of carceral populations, need to use the appropriate marginal direct cost of incarceration estimates, rather than average costs. This scoping review provides analysts, policy-makers, and other practitioners with guidance on the range of estimation methods and procedures for calculating the direct costs to government of additional inmates at a jail or prison, and comparative or benchmark estimates of the marginal costs of incarceration for various types of prisons, jails, and systems. This scoping review may serve as a valuable resource for those conducting economic analyses and carrying out the important work of forecasting, program evaluation, policy planning, and decision-making for incarceration and correctional alternatives.
We conclude that there is a knowledge gap on the topic of marginal cost estimation methods in the peer-reviewed corrections literature, where academics and practitioners would expect to find reliable information about critical issues in their field. More peer-reviewed research on marginal cost estimation methods, their development beyond the inclusion of only the direct costs of government, and their empirical applications would be beneficial to policy analysts, practitioners, and decision-makers who evaluate new programs and policies.
Supplemental Material
sj-docx-1-cjp-10.1177_08874034211060336 – Supplemental material for Methods of Calculating the Marginal Cost of Incarceration: A Scoping Review
Supplemental material, sj-docx-1-cjp-10.1177_08874034211060336 for Methods of Calculating the Marginal Cost of Incarceration: A Scoping Review by Stuart John Wilson and Jocelyne Lemoine in Criminal Justice Policy Review
Footnotes
Declaration of Conflicting Interests
The author(s) declared no potential conflicts of interest with respect to the research, authorship, and/or publication of this article.
Funding
The authors disclosed receipt of the following financial support for the research, authorship, and/or publication of this article: This research was supported through funding provided by the Collaborative Centre for Justice and Safety at the University of Regina, and the Saskatchewan Ministry of Corrections, Policing, and Public Safety. The statements and opinions presented in this article remain solely those of the authors and do not reflect those of the Collaborative Centre for Justice and Safety nor those of the Saskatchewan Government.
Supplemental Material
Supplemental material for this article is available online.
Notes
Author Biographies
References
Supplementary Material
Please find the following supplemental material available below.
For Open Access articles published under a Creative Commons License, all supplemental material carries the same license as the article it is associated with.
For non-Open Access articles published, all supplemental material carries a non-exclusive license, and permission requests for re-use of supplemental material or any part of supplemental material shall be sent directly to the copyright owner as specified in the copyright notice associated with the article.