
Abstract
Living wage values are normally calculated using the cost-of-living for a shopping basket, but they can also be seen as a test score threshold for meeting the cost-of-living. Extant research already demonstrates a critical but indeterminate wage range in functions linking (i) wage value to (ii) wage efficiency. This article outlines a protocol for inducting a more precise living wage price-point within that range, that delivers the most efficient marginal return beyond largely inefficient legal Minimum wages. The protocol was pilot tested with a recently archived dataset from a national study of wages and job satisfaction in two waves straddling the COVID-19 pandemic in New Zealand. We find the added precision from applying the protocol (if it had been used to set the living wage at the time), would have made a Just Noticeable Difference (JND) on the pass rate (helped more people to be job-satisfied rather than -dissatisfied).
Keywords
Introduction
The function of wages is to reward people for the work they do, and a function of Job Evaluation has been to set those wages at sustainable levels for employees and employers (Carr, 2023). Since the COVID-19 Pandemic, however, the world has witnessed a Cost-of-Living crisis (ILO, 2025a). The label “Cost-of-Living crisis” problematizes prices of goods and services, but through a Humanistic lens, they are also deficits in purchasing power from non-living wages (Project GLOW, 2020). Living wages, in turn, deliver more wage than the statutory Minimum, subsistence wages (Yao et al., 2017). Paid by employer choice rather than legal mandate, they may also support human Capabilities, meaning any functioning that people value in their daily lives and livelihoods (Sen, 1999). Work and wage-related Capabilities include, for example, being satisfied (and productive) at work (Carr et al., 2016). Conventional policy is to capture such thresholds indirectly, using econometric estimates of the cost of a weekly or monthly shopping basket, estimated for a typical household and employment configuration, including hours of paid work. The hourly rate of pay required to pay for the shopping basket is then derived arithmetically, without any recourse to human experience, and is thus conducted by fiat (Carr, 2023): “In most cases… living wages are determined based on cost-of-living estimates, with the assumption that a life with dignity becomes possible once an individual can afford a specified basket of goods” (Surmeier et al., 2024, p. 1). Such evaluations begin and end with money, with two main data points: Basket cost; and the hourly wage rate required to reach it (Anker & Anker, 2017; ILO, 2025b; Junais et al., 2024).
Human experiences can—and arguably should—be captured more directly (Fisher, 2010). With rapidly rising costs of living, wellbeing attitudes have recently, reportedly, fallen dramatically, globally, to critical levels (Gallup, 2025). In response to calls for more directly humanized approaches to economic recovery, including wage-setting policy (ILO, 2021, 2025a), this brief article outlines a novel Psychometric approach to setting living wages that support(s) human capabilities. In psychological testing, test score thresholds determine the proportion of people who would have performed well in a job if the threshold had been, or were in future to be used, when making selection decisions. We show how to substitute “wage threshold” for test score threshold, and to locate the price-point (monetary value) at which wages become efficient at affording human capabilities (Sen, 1999). This responds to a global call for Human-centered approaches to UN Sustainable Development Goal (SDG) 8—Decent Work [and Economic Growth] (ILO, 2021, emphasis and parenthesis added). Like the dominant econometric approaches we also begin with money, but then determine a range of counterfactual capability gains that increments in wage value bring. Living wage values thereby become anchored in psychometric experience and econometric costs (Carr, 2023).
Research on capabilities as a function of wage, replicated across diverse settings, has indicated a relationship that is sigmoidal (Project GLOW, 2020). There is a visible wage threshold at which individuals report becoming able to realize their capabilities (Carr et al., 2022). Figure 1 illustrates this pivotal threshold value with one such capability—Work Satisfaction as a function of wage income (Fisher, 2010). At the lowest levels of wage, there is a working poverty trap, where increments in wage make no difference (Carr et al., 2016): People remain trapped in “working poverty,” they are unable to realize work satisfaction ( Living wage as a function of wage income. Source: Carr (2023, with permission). ). Moving from left-to-right along the x-axis in Figure 1, the Minimum wage begins at the first, orange vertical line, with a first inflexion point in the green curve. Nonetheless, people remain below the waterline (i.e., dissatisfaction lessens). It is only at the second, that is, yellow vertical line that work satisfaction tends to be reported (>).
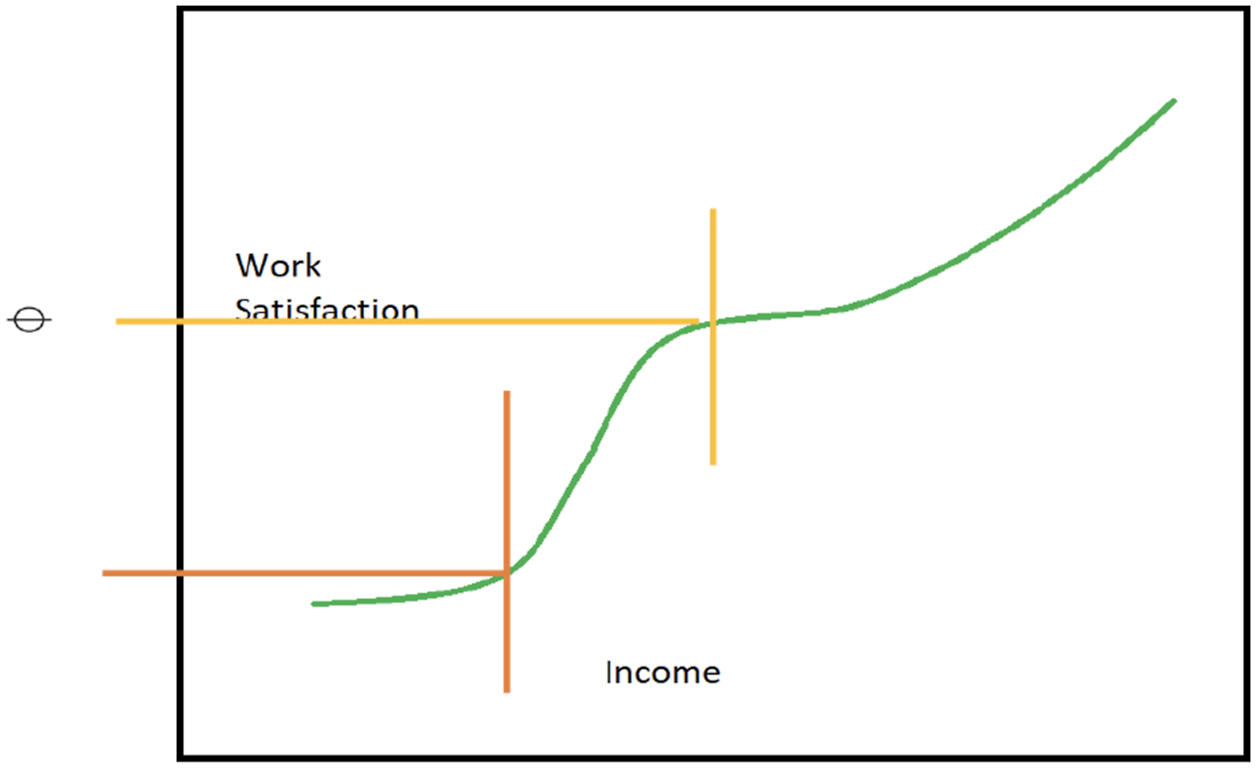
We consider this point of inflection the living wage threshold (Carr et al., 2016). Finding it has economic as well as humanitarian capability import, because the same capabilities on which living wages have been shown to hinge, for example, work satisfaction, also predict individual and unit level work performance (e.g., review, see Carr, 2023). Finding the living wage may, therefore, help meet both facets of UN SDG-8, decent work and economic growth.
What noticeable gains can be expected from this approach to determining living wages, compared to the Minimum wage? This is where psychometrics becomes relevant. Work selection tests have cutoff scores to help choose job candidates who will likely succeed (Aamodt, 2010). Before a threshold is set, incumbents complete the test and have their work performance assessed, either concurrently or over the course of time. Performance expectations can then be plotted as a function of test score, by constructing an Expectancy Chart.
Figure 2 presents an imaginary Expectancy Chart for wage (which is substituted for test score) and wellbeing (i.e., how well wage performs for people who earn it). Test scores tend to have fixed ceilings, unlike wages. Accordingly, Figure 2 is focused on a wage range, from Figure 1’s sigmoidal function. This runs from the legal Minimum wage (orange vertical line on the left, at the first inflection in Figure 1), then past the second, vertical line on the right (living wage cusp; second inflection point) and up to a second upward inflection (Carr et al., 2018). This range (third vertical blue line, far right vertical line on Figure 1) marks the range for living wage concerns (Yao et al., 2017). Expectancy chart for wage and (Dis)satisfaction.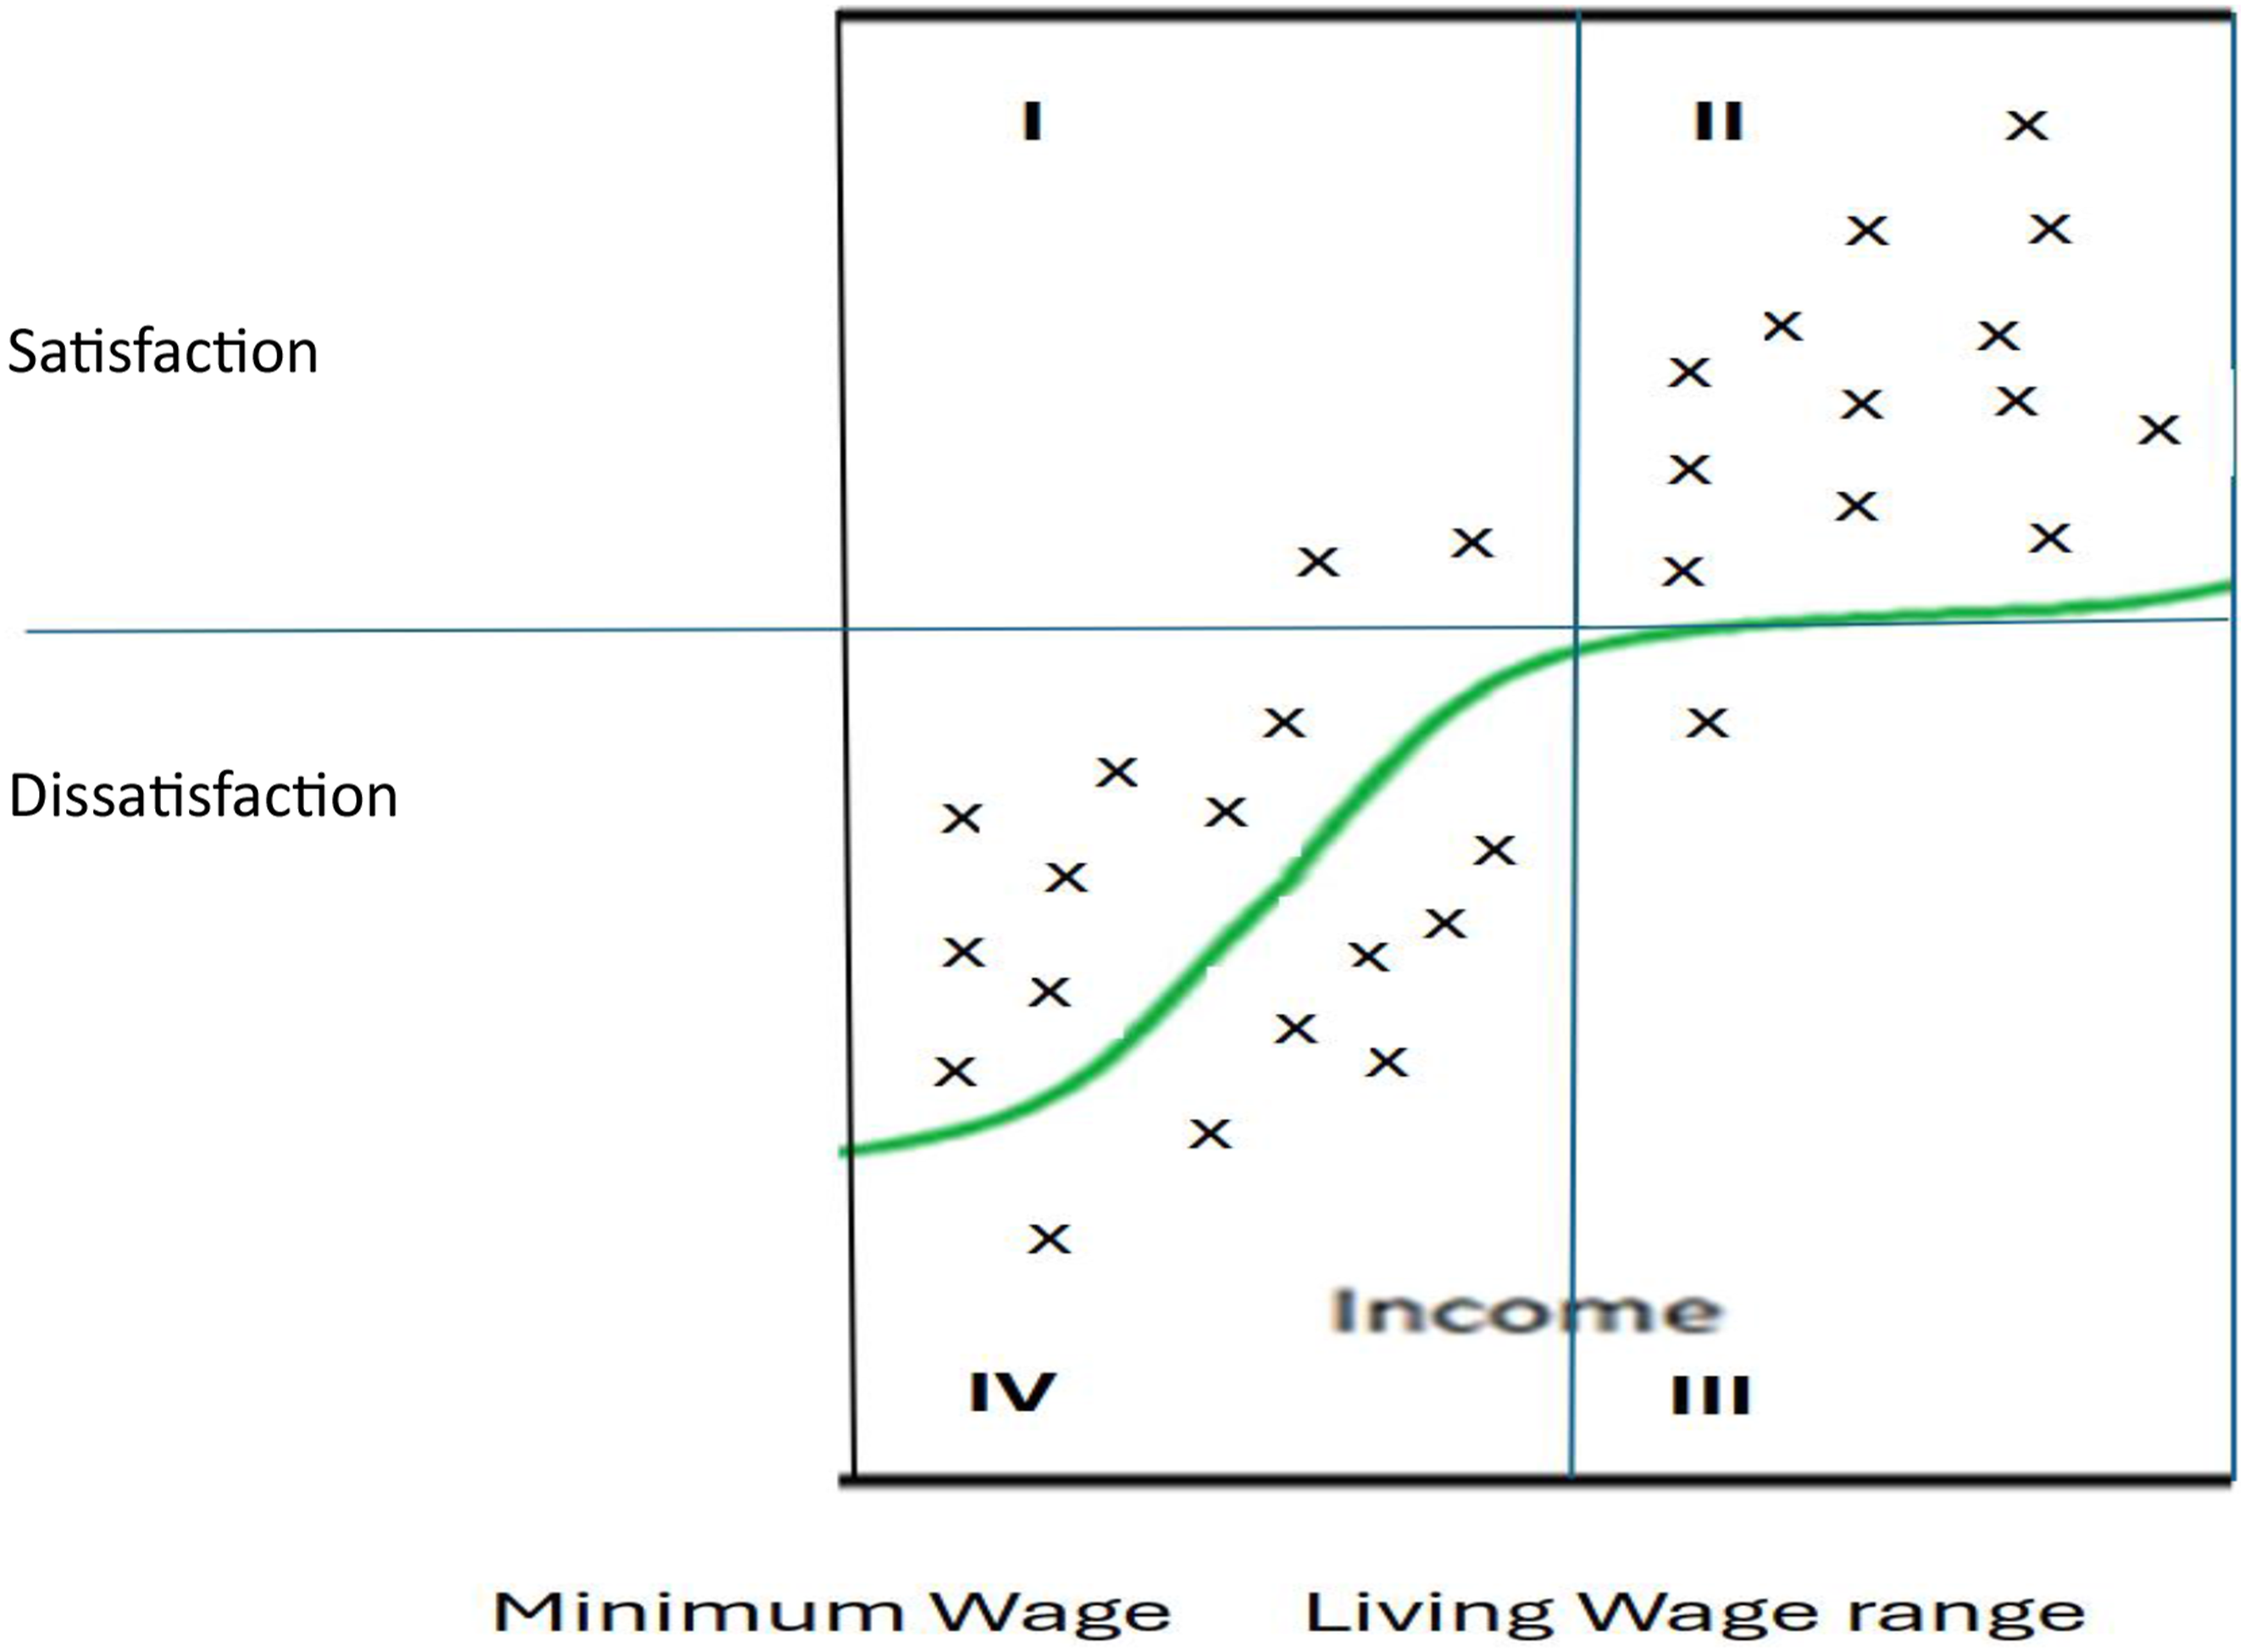
Baseline
Our best estimate of the living wage would be the middle vertical line in Figure 1 (where wage-earners tend to report being able to realize their capabilities/the life they value. Above the middle blue horizontal line is the proportion of respondents who report wellbeing rather than illbeing, irrespective of whether wage level is at the Minimum wage or more (in the example in Figure 2, baseline = 15/31, or 48%). In testing, this would be the expected pass rate if no selection test and its threshold score was used. It is thought of as a baseline proportion, here of all sampled wage-earners who are making ends meet, including those paid the legal Minimum.
Marginal Gain
We can next estimate the increase in proportion of workers making ends meet if a living wage is introduced, compared to relying on the Minimum wage alone. We compute information from quadrants I–IV in Figure 2. Points in quadrant 1 represent workers earning less than living wage estimate and yet faring well (i.e., predictive failures). Points in quadrant II represent workers earning at or above the living wage and faring well (Predictive successes). In quadrant III are the employees earning above estimated living wage but still struggling (predictive failures). Points in quadrant IV represent those earning below the estimated living wage threshold and faring poorly (test predictive successes).
The more data points in quadrants II and IV (successes), compared to predictive failures (I and III), the more effective test cutoffs are. In Figure 2, points in quadrants II and IV/total points in all quadrants = 28/31 = 90%, almost double the baseline. However, in our wage case we are not selecting people “out” (from a job), we are selecting them “in” (into decent wages). A more apt indicator of effectiveness/inclusion is thereby percentage of workers who would make ends meet if they were paid the living wage threshold. This is finally derivable from II/(II + III), which in Figure 2 corresponds to13/14 = 93%.
Fine Tuning
This is an imaginary dataset and likely somewhat exaggerated. Assuming the gain were less, it is still possible to tweak the living wage estimate by inching the middle vertical line to the left and right, and re-calculating marginal gain each time (Carr, 2023). Gain might go up, depending on data point overlap and spread (Isodensity). Isodensity is partly a reflectoin of the fact that livable wages are dependent on one's life situation, for example young single, single parent, or part of a two-wage family (Peer reviewer, anon). Living wage campaigns often assume a typical household (in New Zealand, 1.5 full time incomes and two dependent children), which may or may not protect most people (Carr et al., 2019). Alternatively, if we took a more empirical approach, in which young single, etc. are taken as error, then we might simply induct, from wage-wellbeing data, the price-point at which there is a JND in wellbeing, for a non-costly increment in wage—the very essence of a living wage cusp, or threshold value (Carr, 2023; Carr et al., 2016).
In summary, just as a test score threshold “x” can yield increases in productivity “y,” inducting living wage thresholds (x’) may serve human capabilities implied by SDG-8 (y’). As greater realized capabilities equate to greater wellbeing, the approach further contributes to SDG-3 (health and wellbeing). Tests are also evaluated for fairness to disaggregated minority groups (Aamodt, 2010), implying a role for this Brief in meeting SDG-10 (Inequality). As one example, we demonstrate using secondary data how the gender pay gap might be narrowed through the outlined approach.
Method
Participants
Many databases concerning wages are commercially sensitive and thus protected. Open access databases, meanwhile, often do not contain all variables required (Carr, 2023). A rare exception was a database from studies conducted in New Zealand, under a government Marsden Grant (Carr et al., 2022; see Acknowledgment). Carr et al. have already reported that the wage-capability curve, in two successive national sample survey groups, straddling the COVID-19 pandemic, produced replicable curves, with indeterminate wage cusp ranges corresponding to the ones outlined by Yao et al. (2017), around NZ$20 per hour. This data archive was used in the current pilot study.
Each survey wave included n = 1000 participants who were purposefully selected from lower-income jobs, defined as earning a personal annual income, before tax = NZ$60,000 or less. As in most labor markets the living wage in New Zealand is reported as an hourly rate, only participants indicating their hourly pay rate were included. The number of participants in our pilot test was therefore reduced to a total N = 1283, in two survey groups, one drawn in 2018 before the pandemic (n1 = 613) and another just after lockdowns in 2020 (n2 = 670; for Demographic details of both sub-samples, Carr et al. (2022).
Measures & Procedure
Wellbeing can be measured in a wide range of ways depending on purpose (Carr, 2023). In our study, we chose a conceptual variable related to work capability, work satisfaction (Fisher, 2010). Job satisfaction was measured using a three-item measure (Judge et al., 2005, α = .91), with the scale’s factor structure confirmed in each group (see Carr et al., 2022), with a five-point scale (−2 to +2), ranging from extreme dissatisfaction and dissatisfaction to satisfaction and extreme satisfaction, through a mid-point at 0. For the purposes of thresholds, we re-coded the database five-point scale into a binary (below satisfied (−2 to 0) versus satisfied or above (+1 and +2)).
Wage thresholds were measured by setting variable limits at whole dollar values. Setting the baseline were the legal Minimum wages in place in NZ at the time ($15.75 and $18.90/hr. in 2018 and 2020, respectively). The campaigned-for National Living wages at the time in turn were, respectively, $18.90 (in 2018) and $22.10 (in 2020). Using the method outlined earlier and depicted in Figure 1, Carr et al. found that a living hourly wage fell around $20/hr. To show the marginal gain from setting the living wage threshold at different points around the 20 dollar/hour mark, we re-coded these hourly NZ$ wage rates in Statistical Package for the Social Sciences (SPSS) version 30.0, to “less than/at-or-greater-than,” successively, $19, 20,21 etc., dollars-per-hour. For the 2018 survey group, therefore, we began at $17 and for the 2020 group we began at $19 (in both cases, just above the legal Minimum at the time of the respective survey).
Findings
Lower-Paid Employees (%) Who Would Have Been Job-Satisfied (y) at Living Wage “$x”.
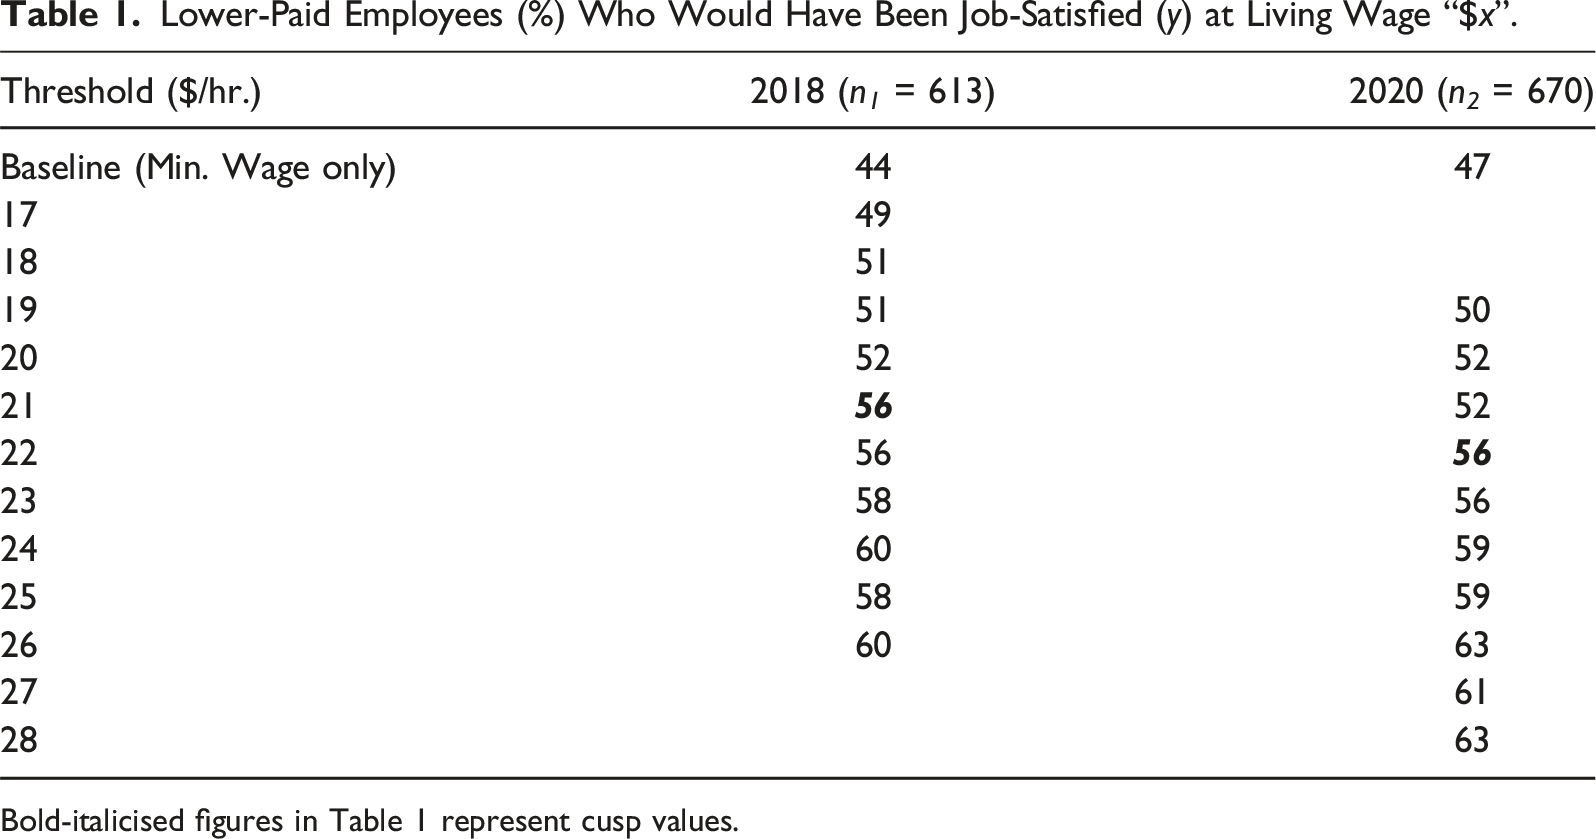
Bold-italicised figures in Table 1 represent cusp values.
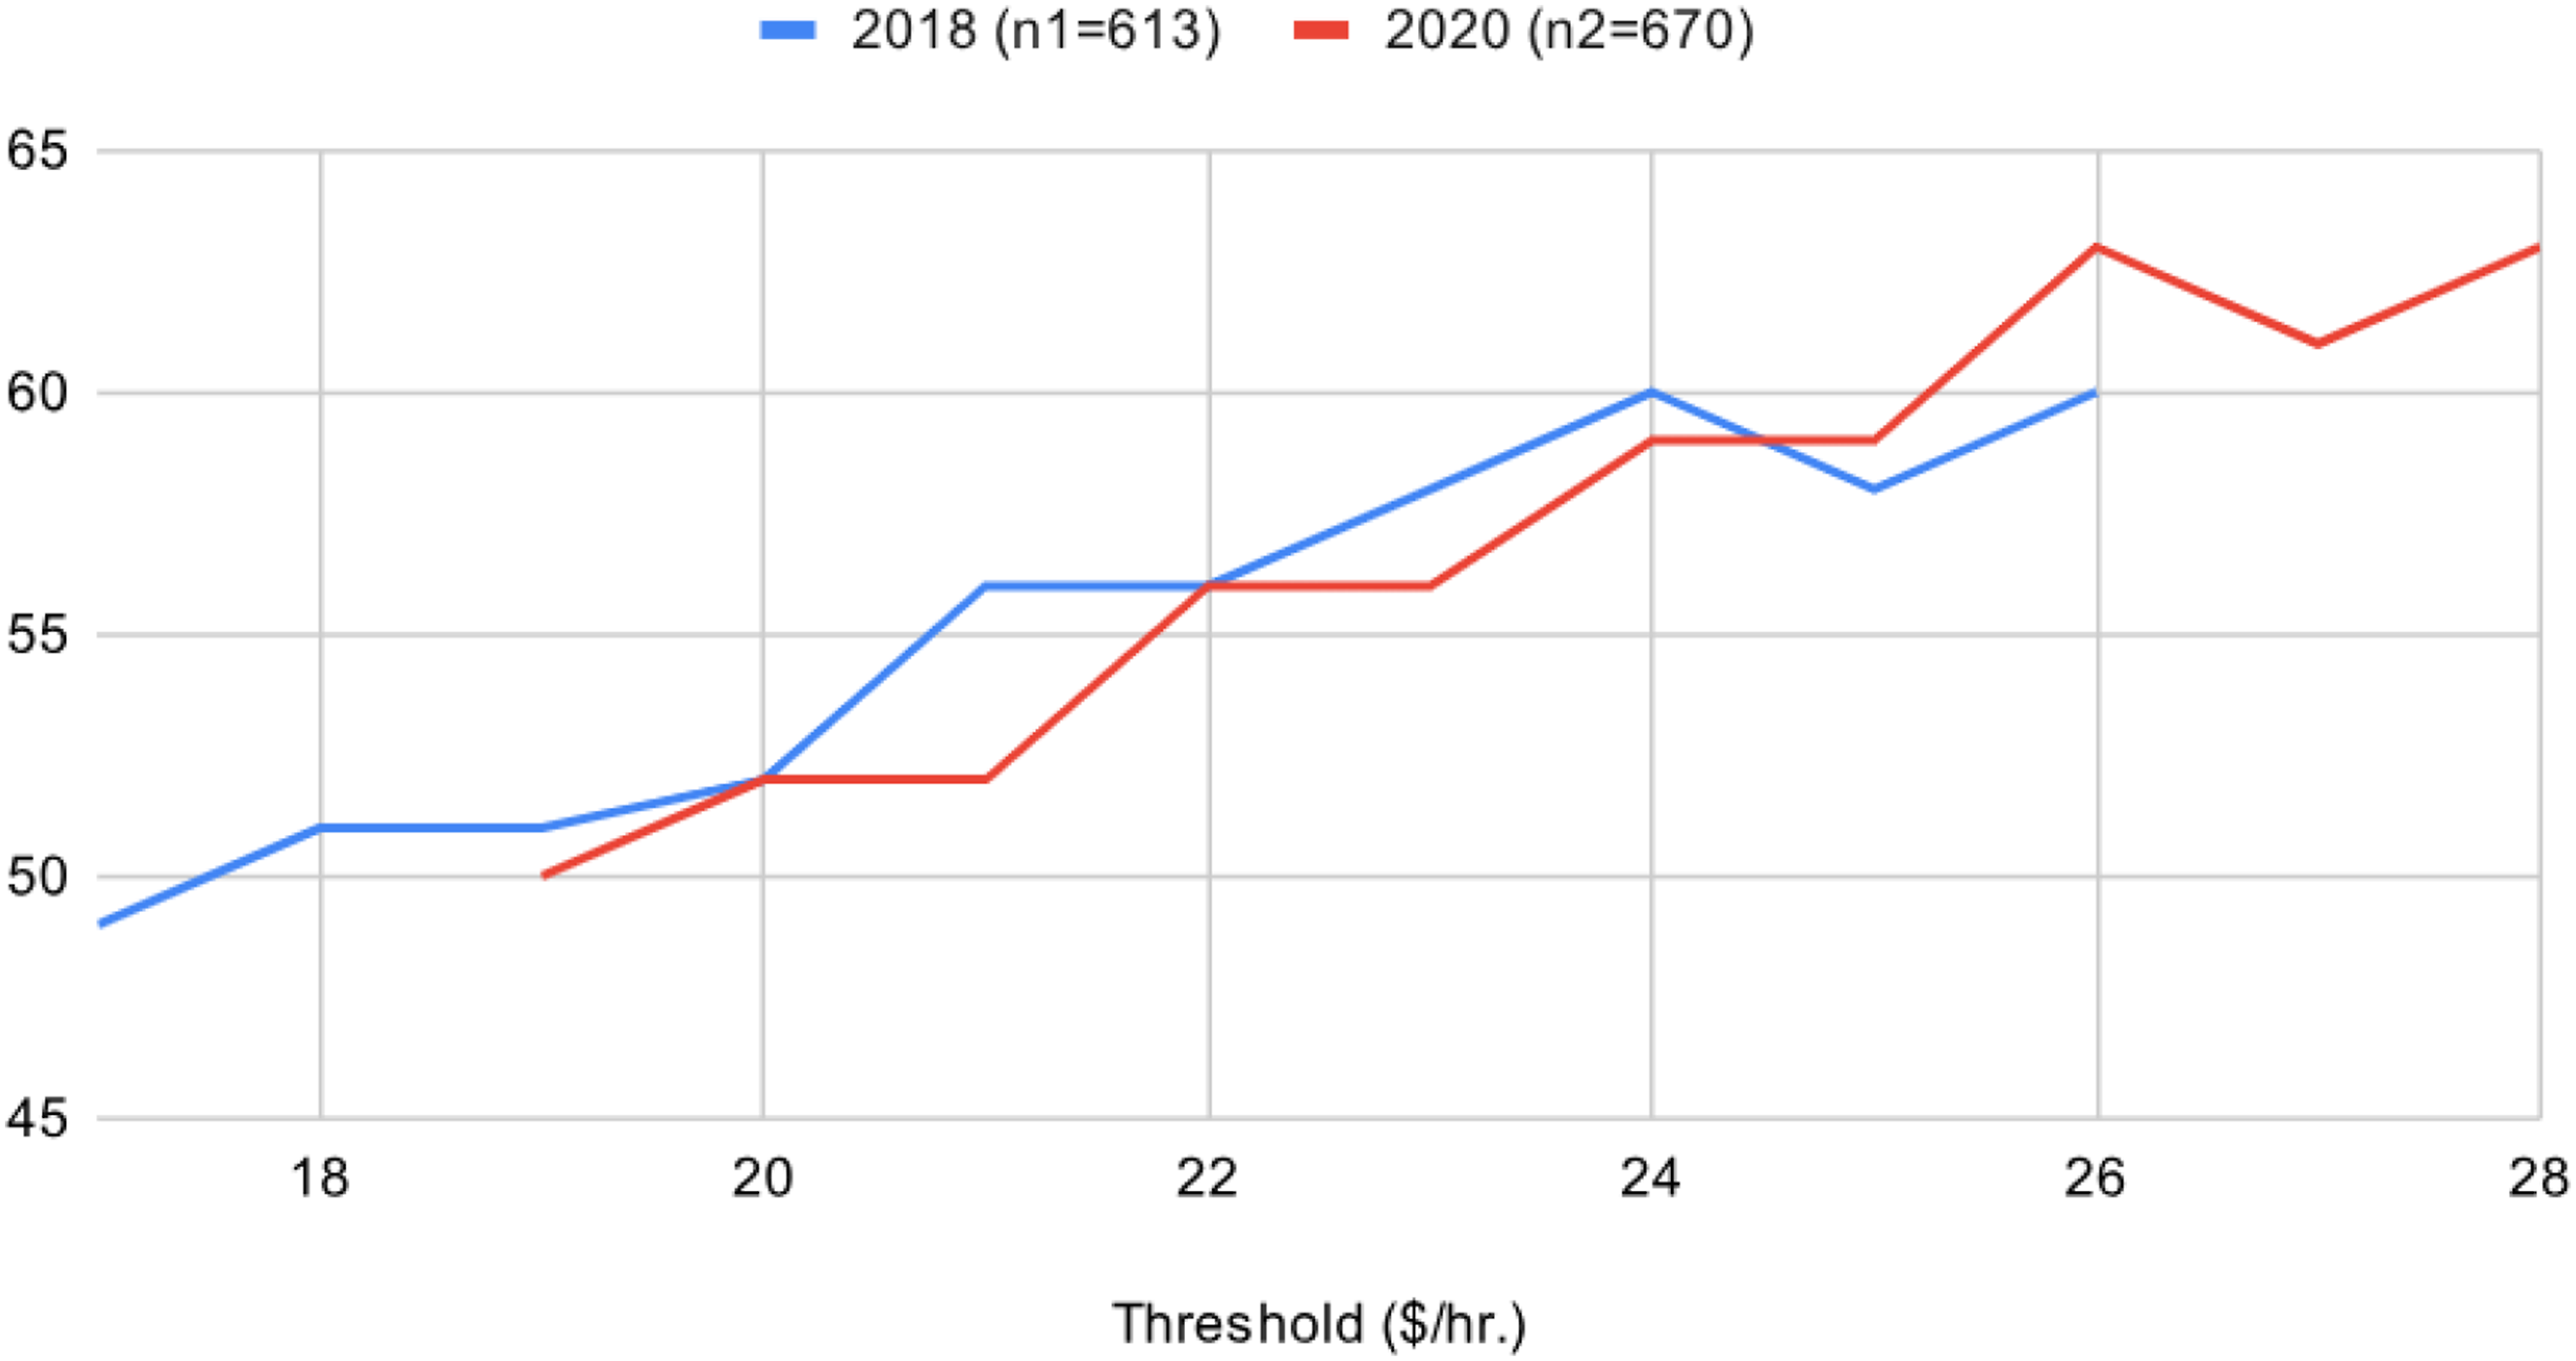
% age job-satisfied 2018 (n1=613) and 2020 (n2=670).
Beyond the baseline (I, and by computing II/II + III based on Figure 2), In Table 1 we have derived the proportions of lower-paid workers who would have been expected to be satisfied with their work had the living wage been set at that (counterfactual, and empirically derived) threshold value.
In 2018, the Living Wage in effect at the time of the survey, based on the dominant shopping basket method, was $20.55/hour, and in Carr et al., using empirical experience, it was circa $20. Our analysis, using an Expectancy approach, based on a most noticeable jump in percentage satisfaction in Table 1, was $21/hr. (56% satisfied). In other words, both the shopping basket and the empirical experience methods (unrefined), were (probably) marginal under-estimates of the true score living wage (Carr, 2023). Using our adjustment protocol in this paper would have adjusted the $20 up to at least $21/hr.
In 2020, the Living Wage was $22.10, and the Carr et al. (2022) estimate was circa $20. From Table 1, we see a relatively noticeable jump at $22/hr. (again, 56% satisfied), which is consolidated at $23/hr. 1 There is another comparable jump at $26/hr., to 63% job-satisfied (net 4% increase). This second cusp is consistent with other living wage research which has consistently found a second cusp, due in part perhaps to wage compression for those earning immediately above the Living wage, and/or influence from credit card debt arising from attaining credit card wage thresholds (Carr, Maleka, Meyer et al., 2018; Project GLOW, 2020). It therefore remains debatable whether enough employers would volunteer to pay such an amount, which would have been almost $4/hrs. over-and-above the Living Wage for that financial year.
Hence this nuanced method for adjusting living wage values, in effect striking the most likely sustainable and adoptable balance between the cost-of-living and a living wage, would have been to confirm, and thus convergently validate, at least the campaign Living Wage (of $22.10/hr.).
Discussion
This policy-focused briefing paper has outlined a novel method for fine-tuning estimations of living wages, in response to calls from major policy-making bodies, like the ILO and the UN, to render wage-setting more human-centered (ILO, 2021, 2025a). The protocol outlined has further been pilot tested, using one proxy variable for work-related wellbeing, job satisfaction (Fisher, 2010). It has the potential to help mitigate the wage and wealth gap, for example, by providing useful information to socially responsible small to medium enterprises (Ertel, 2019).
In theory, such indicators could be expanded, to include other job- and work-related attitudes, for example, from organizational commitment and work engagement to work-life balance (Carr et al., 2022). These could in principle be weighted to derive a composite and to that extent, a more construct-valid estimate of overall wellbeing. Work satisfaction itself, when taken in concert with other job attitude variables, has demonstrated meaningfully large (variance explained) relationships, to work productivity, and thereby economic growth (Carr, 2023). Thus, this protocol contributes to extant theories of Capability, both social and economic (Sen, 1999).
In policy terms, these two facets of measurable value, from living wages, namely, decent work conditions and economic growth for all, are captured as part of the 2016–30 UN SDGs. All 193 of United Nations members have committed to upholding these goals, including SDG-8—Decent Work and Economic Growth. Thus, this protocol has relevance to upholding commitments to sustainable livelihoods, in the support of the primary SDG-1—eradicate poverty in all its forms everywhere, through a combination of research and practice, that focuses on enabling decent work conditions for especially lower-paid workers. As we have seen, the current cost-of-living crisis has meant working poverty for many employees—a crisis of non-living wages. This protocol thereby offers a piloted contribution to global development in general, and towards the eradication of working poverty in particular.
There are clear limitations to this protocol. It needs to be more extensively tested, with more substantive databases and a wider range of potentially weighted criterion variables (and their measures). The method we have outlined further does not differentiate between single versus multiple-waged lower-income households, which recent research shows may differ in terms of work satisfaction, which in turn is also linked to ability in the household to make ends meet (Pohlig et al., 2020). In our protocol, we have assumed that one living wage works equally well for all people, and that circumstances can be treated as randomized noise, against which we simply try to find the wage value at which most people can sustainably be paid.
Future research then should evaluate whether and how the protocol affects single versus dual or multiple-income households, and indeed dual income couples within the same organization (Martin, 2020). A further direction for future research would be on gender pay gaps (Parker et al., 2025). In their living wage research, for example, Parker et al. found that increments of wage were experienced (valued) differently for men versus women. For women, the gains from increments in wages came quicker, implying that the same wage may make differentially noticeable differences by gender.
An interesting and timely application for this novel protocol would therefore be to determine the percentages gained by each gender, in separate Expectancy tables, as well as in combination. Such an approach has the potential to identify where and how a living wage can make the most difference to closing the gender pay gap (Maleka et al., 2025). It may also contribute to policy debates, for example, in countries like New Zealand, across private sector (https://www.women.govt.nz/news/developing-voluntary-gender-pay-gap-calculation-tool) and Public Service (https://www.publicservice.govt.nz/system/public-service-people/pay-gaps-and-pay-equity).
In conclusion, we have conceptualized, and pilot tested, a novel protocol for fine-tuning wage estimates based on what they may functionally deliver for Human Capability and sustainable livelihoods. Whilst nascent, we believe it has potential to contribute to the Decent Work and the SDGs. It stresses the relevance of psychometric approaches to gauging living wages, for extant work wage conditions. As such, it offers a recently called-for revival of wage research that builds on past traditions, and values, which advocate making a positive, evidence-informed contribution to the world of work (de Glind et al., 2025).
Footnotes
Acknowledgments
Thanks are due to the editor and reviewers, and to the Marsden project team listed in ![]() , for their inputs to the original studies, and in particular to its survey-based database. We are further grateful to Dr Evan Valdes for his kind suggestions on the graphics and tabulation contained in this paper.
, for their inputs to the original studies, and in particular to its survey-based database. We are further grateful to Dr Evan Valdes for his kind suggestions on the graphics and tabulation contained in this paper.
Declaration of Conflicting Interests
The author(s) declared no potential conflicts of interest with respect to the research, authorship, and/or publication of this article.
Funding
The author(s) disclosed receipt of the following financial support for the research, authorship, and/or publication of this article: This work was supported by the Project GLOW (Global Living Organizational Wage).