
Abstract
Street-intercept interviews are the gold standard recruitment method in night-time economy research; however, online recruitment methods are an important tool for researchers, particularly when conducting pilot projects or when resources are limited. The two studies presented aim to further our understanding of how key outcome variables relevant to nightlife research vary between samples recruited through different methods. Study 1 compared survey data from a Qualtrics online panel sample (n = 475) and a social media sample (n = 465) on key outcome variables including: frequency of alcohol consumption, pre-drinking and experiences of nightlife-related aggression and harassment in the past 12 months. Study 2 compared experiences of nightlife harassment within the last 3 months across the Qualtrics panel online survey sample and a street-intercept interview sample (n = 223). Analyses were split by participant gender. For Study 1, chi-square analyses indicated that female social media participants were significantly more likely to report experiences of sexual harassment within night-time entertainment precincts within the past 12 months compared to female panel participants (p < .001). Several demographic differences also emerged across samples. In Study 2, female street-interview participants were significantly more likely to report both sexual (p < .01) and physical (p < .001) harassment in night-time entertainment precincts within the last 3 months compared to female panel participants. There were no such differences across methodology type for male participants. The current study demonstrated that the proportion of participants reporting harms within the nighttime economy differed based on the data collection method used. The findings suggest that researchers should be cautious about underreporting females’ experiences of nightlife-related sexual and physical harassment when utilising samples from online panel providers. The findings may assist researchers in selecting the most appropriate participant recruitment method, given their specific research question.
Introduction
Recruitment methods in survey research have undergone a profound shift in recent decades, with a decline in response rates from traditional methods such as telephone and mail-based surveys (Stedman et al., 2019; Vaske et al., 2024). Meanwhile, the advancement of the internet and social media has allowed for the development of a new wave of participant recruitment practices. Social media websites are online spaces that facilitate information dissemination and peer connection (Gelinas et al., 2017). Recruitment on these platforms can involve paid advertisements, whereby the platform promotes the survey to relevant members. Snowballing is another common recruitment technique, in which participants are asked to share the survey link on their social media accounts in order to identify additional participants (Leighton et al., 2021). Snowballing is a popular recruitment strategy as it requires minimal effort and little to no cost from researchers (Sadler et al., 2010). However, with many researchers utilising social media recruitment, potential respondents may become increasingly less likely to engage with online surveys (Lehdonvirta et al., 2021). In addition, the success of advertisements varies greatly across studies (e.g., Kapp et al., 2013; Shaver et al., 2019), and snowballing may be less successful when the topic is ‘extremely’ personal or sensitive (Waters, 2015). More recently, market research panels (e.g., Qualtrics & MTurk) have become a common participant recruitment method in social psychology research (Belliveau et al., 2022). These organisations facilitate participant recruitment on behalf of the researchers by distributing the survey to large groups of individuals who have previously consented to be solicited for survey recruitment. While panel samples tend to cost more than traditional social media recruitment methods, their increase in usage likely stems from benefits such as fast-data turn-around and the ability to recruit targeted samples (Belliveau et al., 2022)
In night-time economy research, street-intercept interviews are the gold standard participant recruitment method, as they allow for the collection of samples that are locally representative of patrons present in the nightlife environment. Street-intercept interviews directly target the population of interest, have demonstrated a consistently high response rate across studies (77% to 91%; De Andrade et al., 2023; Miller et al., 2016), and allow for the assessment of response rates and bias (Graham et al., 2014). However, such projects are resource-intensive and not necessarily suitable for pilot projects or small research teams. Patrons may also show less willingness to disclose sensitive information (e.g., experiences of harm) in face-to-face interviews, whereas the anonymous nature of online surveys may encourage greater openness and disclosure (Murdoch et al., 2014). For these reasons, online survey recruitment methods are an important and promising tool for examining alcohol use and experiences of harm in the nightlife context.
Research suggests that survey methodology can influence participant responses, with one study finding that participants’ level of reported risky behaviour changed depending on the length of the interview (Coomber et al., 2018). However, little is known about the impact of online recruitment methods on participant characteristics (e.g., sociodemographics, drinking behaviours) compared to street-interviews. Waldron et al. (2020) compared a social media sample to a sample of nightlife patrons and festival attendees and found that estimates of drug use and nightlife engagement were significantly more conservative in the online sample, with the exception of nightclub attendance (Waldron et al., 2020). However, this was a large study (N = 9,682), not representative of smaller pilot studies that might benefit most from online research methods. Additionally, the study did not examine participants’ experiences of harm and did not compare different methods of online data collection. Developing a clearer understanding of the differences in participant characteristics, behaviours and experiences across sample types could help inform the selection of the most appropriate recruitment technique for nightlife researchers, particularly when researchers are unable to recruit a representative nightlife sample.
The current paper aims to address the gaps in existing literature through two studies. Study 1 will compare participant characteristics across an online panel sample and a social media sample, and study 2 will compare the online panel sample with a representative nightlife patron sample. Specifically, the two studies will seek to answer the following research questions:
RQ1 (Study 1). How do online panels and social media samples differ in terms of sociodemographic characteristics, alcohol use, frequency of nightlife visits and experiences of harassment?
RQ2 (Study 2). Do online panel samples and street-intercept interview samples significantly differ in experiences of harassment/aggression?
Study 1
Method
The data utilised in this study came from a larger project around sexual harm in Australian nightlife venues. Ethical approvals were granted from Deakin University Human Research Ethics Committee (2022-284; 2022-112).
Participants and Procedure
Data were obtained from a social media sample and an online panel sample. The data were comparable as an identical base survey was utilised across both samples. For the purpose of the wider study, a small number of additional items were administered to the panel sample only; however, these were positioned after all sections relevant to the present analysis. All key measures analysed were identical across both samples. Individuals were able to participate in either survey if they were over the age of 18 and had visited a nightlife venue at least once in the past 12 months. Both surveys were hosted on the online survey platform, Qualtrics.
Social Media Recruitment
A two-component social media recruitment method was utilised. Social media snowballing occurred whereby researchers disseminated a flyer and link to the survey across Twitter, Facebook and Instagram and encouraged other users to share this information. To increase the sample size, paid advertisements ($500 AUD) across Facebook and Instagram were also employed. Participants who clicked the link on the flyers or advertisements were redirected to the survey. Participants were required to read a plain language statement and provide informed consent before completing the 20-min survey. After survey completion, participants had the option to enter the draw to win 1 of 10 $50 gift vouchers by providing an email address on a separate webpage. Data collection occurred from January 2023 until September 2023, with a total of 587 participants clicking the survey link. Some participants did not consent to the survey (n = 2), consented but did not complete any further questions (n = 14) or had not entered a nightlife venue in the past 12 months (n = 8). Seventy participants were excluded as they had completed less than 38% of the survey. This cut-off was determined based on whether participants had completed at least one of the non-sociodemographic variables of interest. Following the removal of individuals who did not specify their gender and gender-diverse individuals (n = 28), 465 participants (84.5% female) were included in the social media sample. Participants’ ages ranged from 18 to 80 years (Mdn = 23, IQR = 22, 31).
Online Panel Recruitment
The social media sample was smaller and contained fewer male participants than was originally anticipated. As such, for the purpose of the wider project, a second sample was recruited directly from the Qualtrics panel provider service. This constituted a convenience sample, as participants were drawn from an opt-in online panel based on availability, without the use of random sampling or nationally representative demographic quotas. The research team requested approximately 300 males and 150 females (with a natural dispersion of gender diverse individuals). The sampling approach was not intended to achieve an exact gender balance, but rather to increase male representation to ensure their experiences could be meaningfully examined.
The process of participant recruitment, data collection and participant reimbursement were facilitated by Qualtrics. Data collection occurred from September 2023 until October 2023, and the total cost per participant was $10.86 AUD (for 460 full responses). Qualtrics provided the research team with incomplete responses and participants who had been screened out. A total of 632 participants clicked into the survey. A number of participants did not consent to the survey (n = 23), had not been to a nightlife venue in the past 12 months (n = 94) or had completed less than 38% of the survey (n = 23). Following the removal of individuals who did not specify their gender and gender-diverse individuals (n = 14), 475 participants (57.3% male) were included in the panel sample. Participants’ ages ranged from 18 to 65 years (Mdn = 25.5, IQR = 23, 29).
Total Sample
As gender quotas were applied to the panel survey, resulting in a sample that was approximately 60% male, this introduced a non-naturally occurring gender distribution. To account for this, analyses were stratified by gender, and no direct gender comparisons were made between samples. Further, as only a low proportion of the panel sample (2.8%) and the social media (5.6%) sample identified as gender diverse (e.g., transgender or non-binary), meaningful analyses with this subgroup could not be conducted. As such, only individuals who identified as male or female were included in the current study. Overall, 940 (63.4% female) participants, whose ages ranged from 18 to 80 years (Mdn = 25, IQR = 22, 30) were included in Study 1.
Measures
Social Media and Panel Survey Tool
The survey instrument comprised of several sections; the items used for the current study are outlined below.
Sociodemographic
Participants were asked about their gender, age, relationship status, sexuality, sexual partners, employment status, annual income and student status. These were included as categorical variables for analyses.
Physical and Verbal Harassment
Participants were asked if they had experienced verbal harassment (e.g., sworn or yelled at) or physical harassment (e.g., pushing, shoving, choking, slapping, punching) in or around nightlife venues in the past 12 months. Dichotomous variables (0 = no, 1 = yes) were created for both physical harassment and verbal harassment.
Sexual Harassment
Participants were asked if they had experienced verbal sexual harassment (e.g., inappropriate sexual jokes, unsolicited requests for sexual favours) or physical sexual harassment (e.g., pinching of the bottom, groping, fondling, kissing) around nightlife settings in the past 12 months. One sexual harassment dichotomous variable (0 = no, 1 = yes) was created. A value of ‘1’ indicated that participants had experienced either physical or verbal sexual harassment (or both) in the past 12 months.
Alcohol Use
Participants were asked about the frequency with which they consumed alcohol in the past 3 months on a 6-point Likert scale. They were also asked how often they engaged in pre-drinking in the past 3 months on a 5-point Likert scale. These were included as categorical variables.
Analytical Plan
Chi-square analyses were conducted to determine if there were significant differences in participant’s sociodemographic characteristics, alcohol use and experiences of harassment across the social media and panel samples. The analyses were stratified by gender, with the p-value for significance set at < .05. Participant numbers differ across analyses due to incomplete responses from some participants. Missing data primarily resulted from a technical survey error that excluded the age question for a subset of panel participants, and from higher dropout rates towards the end of the survey for social media participants, particularly in the section on alcohol use. Little’s Missing Completely at Random test indicated that the data were not missing completely at random; however, follow-up chi-square analyses showed no significant demographic differences (in age, gender or employment status) between those who completed the survey and those who dropped out, suggesting minimal risk of systematic bias.
Results
Table 1 demonstrates the distribution of sociodemographic and nightlife variables across the social media and panel samples for female participants. Chi-square tests for independence revealed a significant difference in all sociodemographic variables between the female panel sample participants and social media participants, except for their studying status. For example, the panel sample had higher proportions of heterosexual and unemployed individuals. No significant differences were found between females’ frequency of nightlife visits, alcohol use and experiences of physical and verbal harassment across the two samples. However, female participants in the social media sample were significantly more likely to report experiencing sexual harassment compared to those in the panel sample.
Comparison of Female Participants From Social Media and Panel Samples Using Chi-Square Analysis.
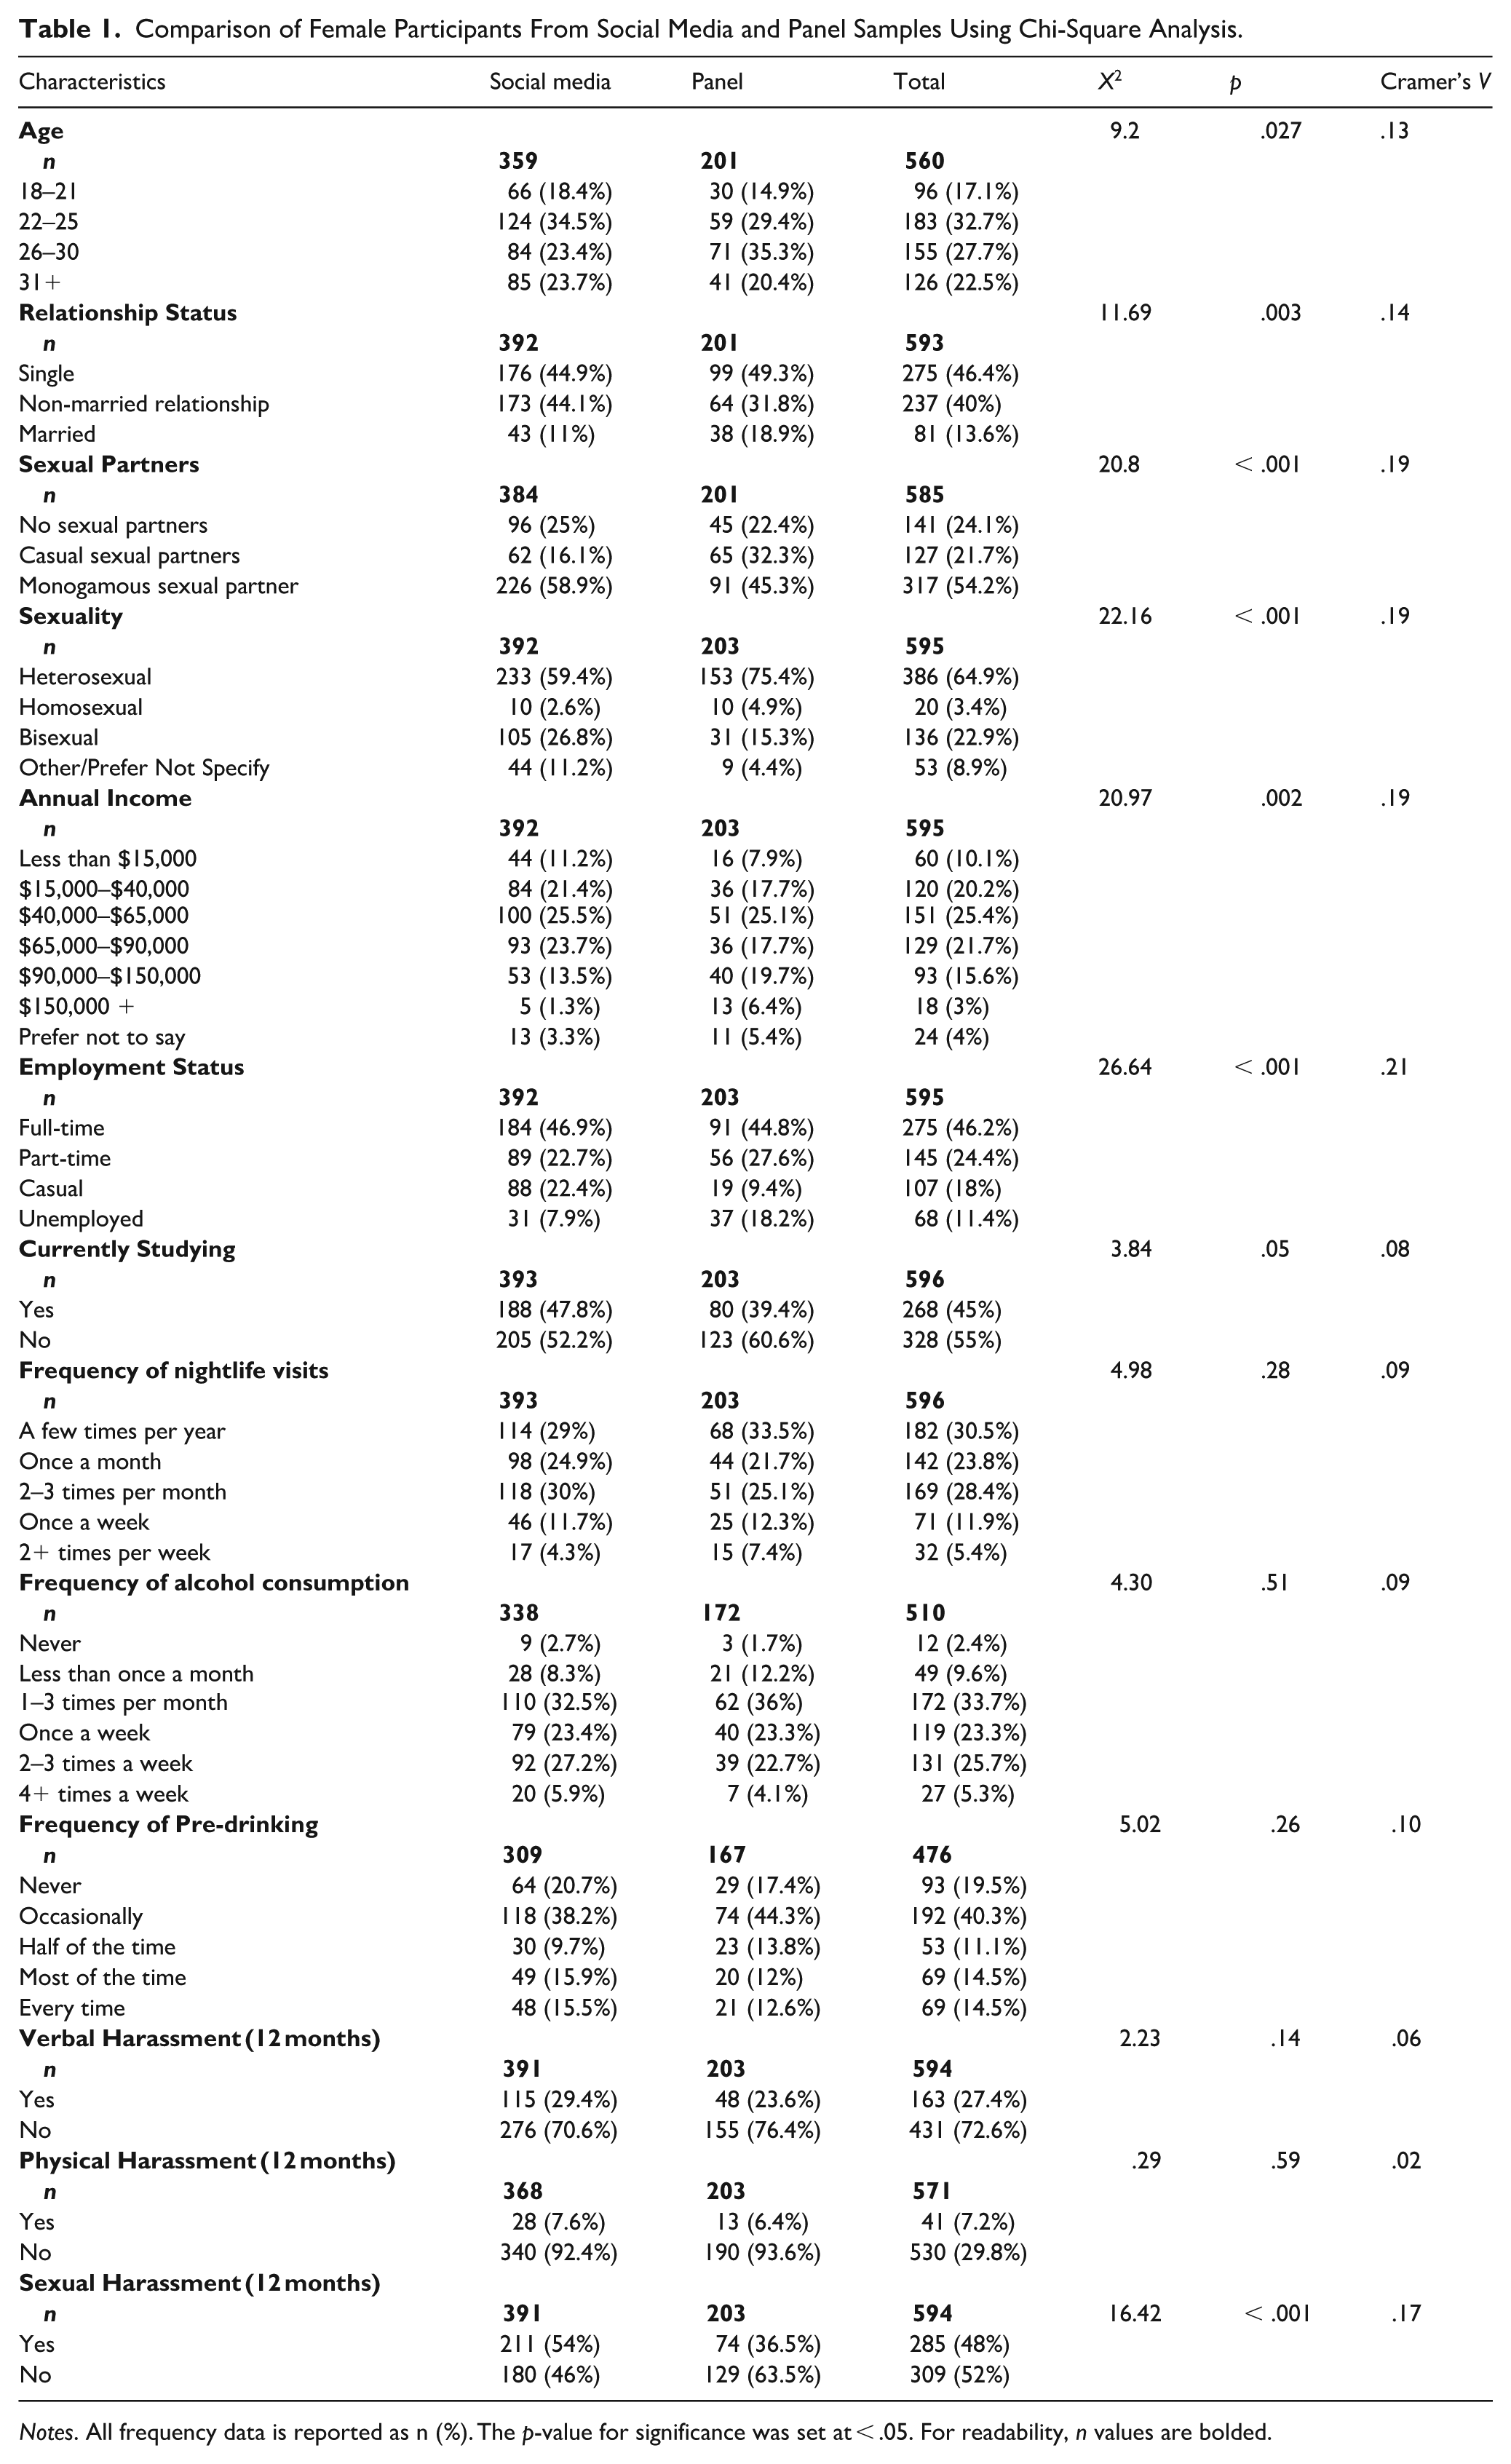
Notes. All frequency data is reported as n (%). The p-value for significance was set at < .05. For readability, n values are bolded.
Table 2 demonstrates the distribution of sociodemographic and non-sociodemographic variables across the social media and panel samples for male participants. Chi-square tests for independence revealed a significant difference in all sociodemographic variables between the male panel sample participants and male social media participants, except for relationship status and studying status. For example, the social media sample had a greater proportion of older adults (31+) and a lower proportion of heterosexual participants compared to the panel sample. No significant differences were found between males’ frequency of nightlife visits, alcohol use and experiences of harassment across the two samples.
Comparison of Male Participants From Social Media and Panel Samples Using Chi-Square Analysis.
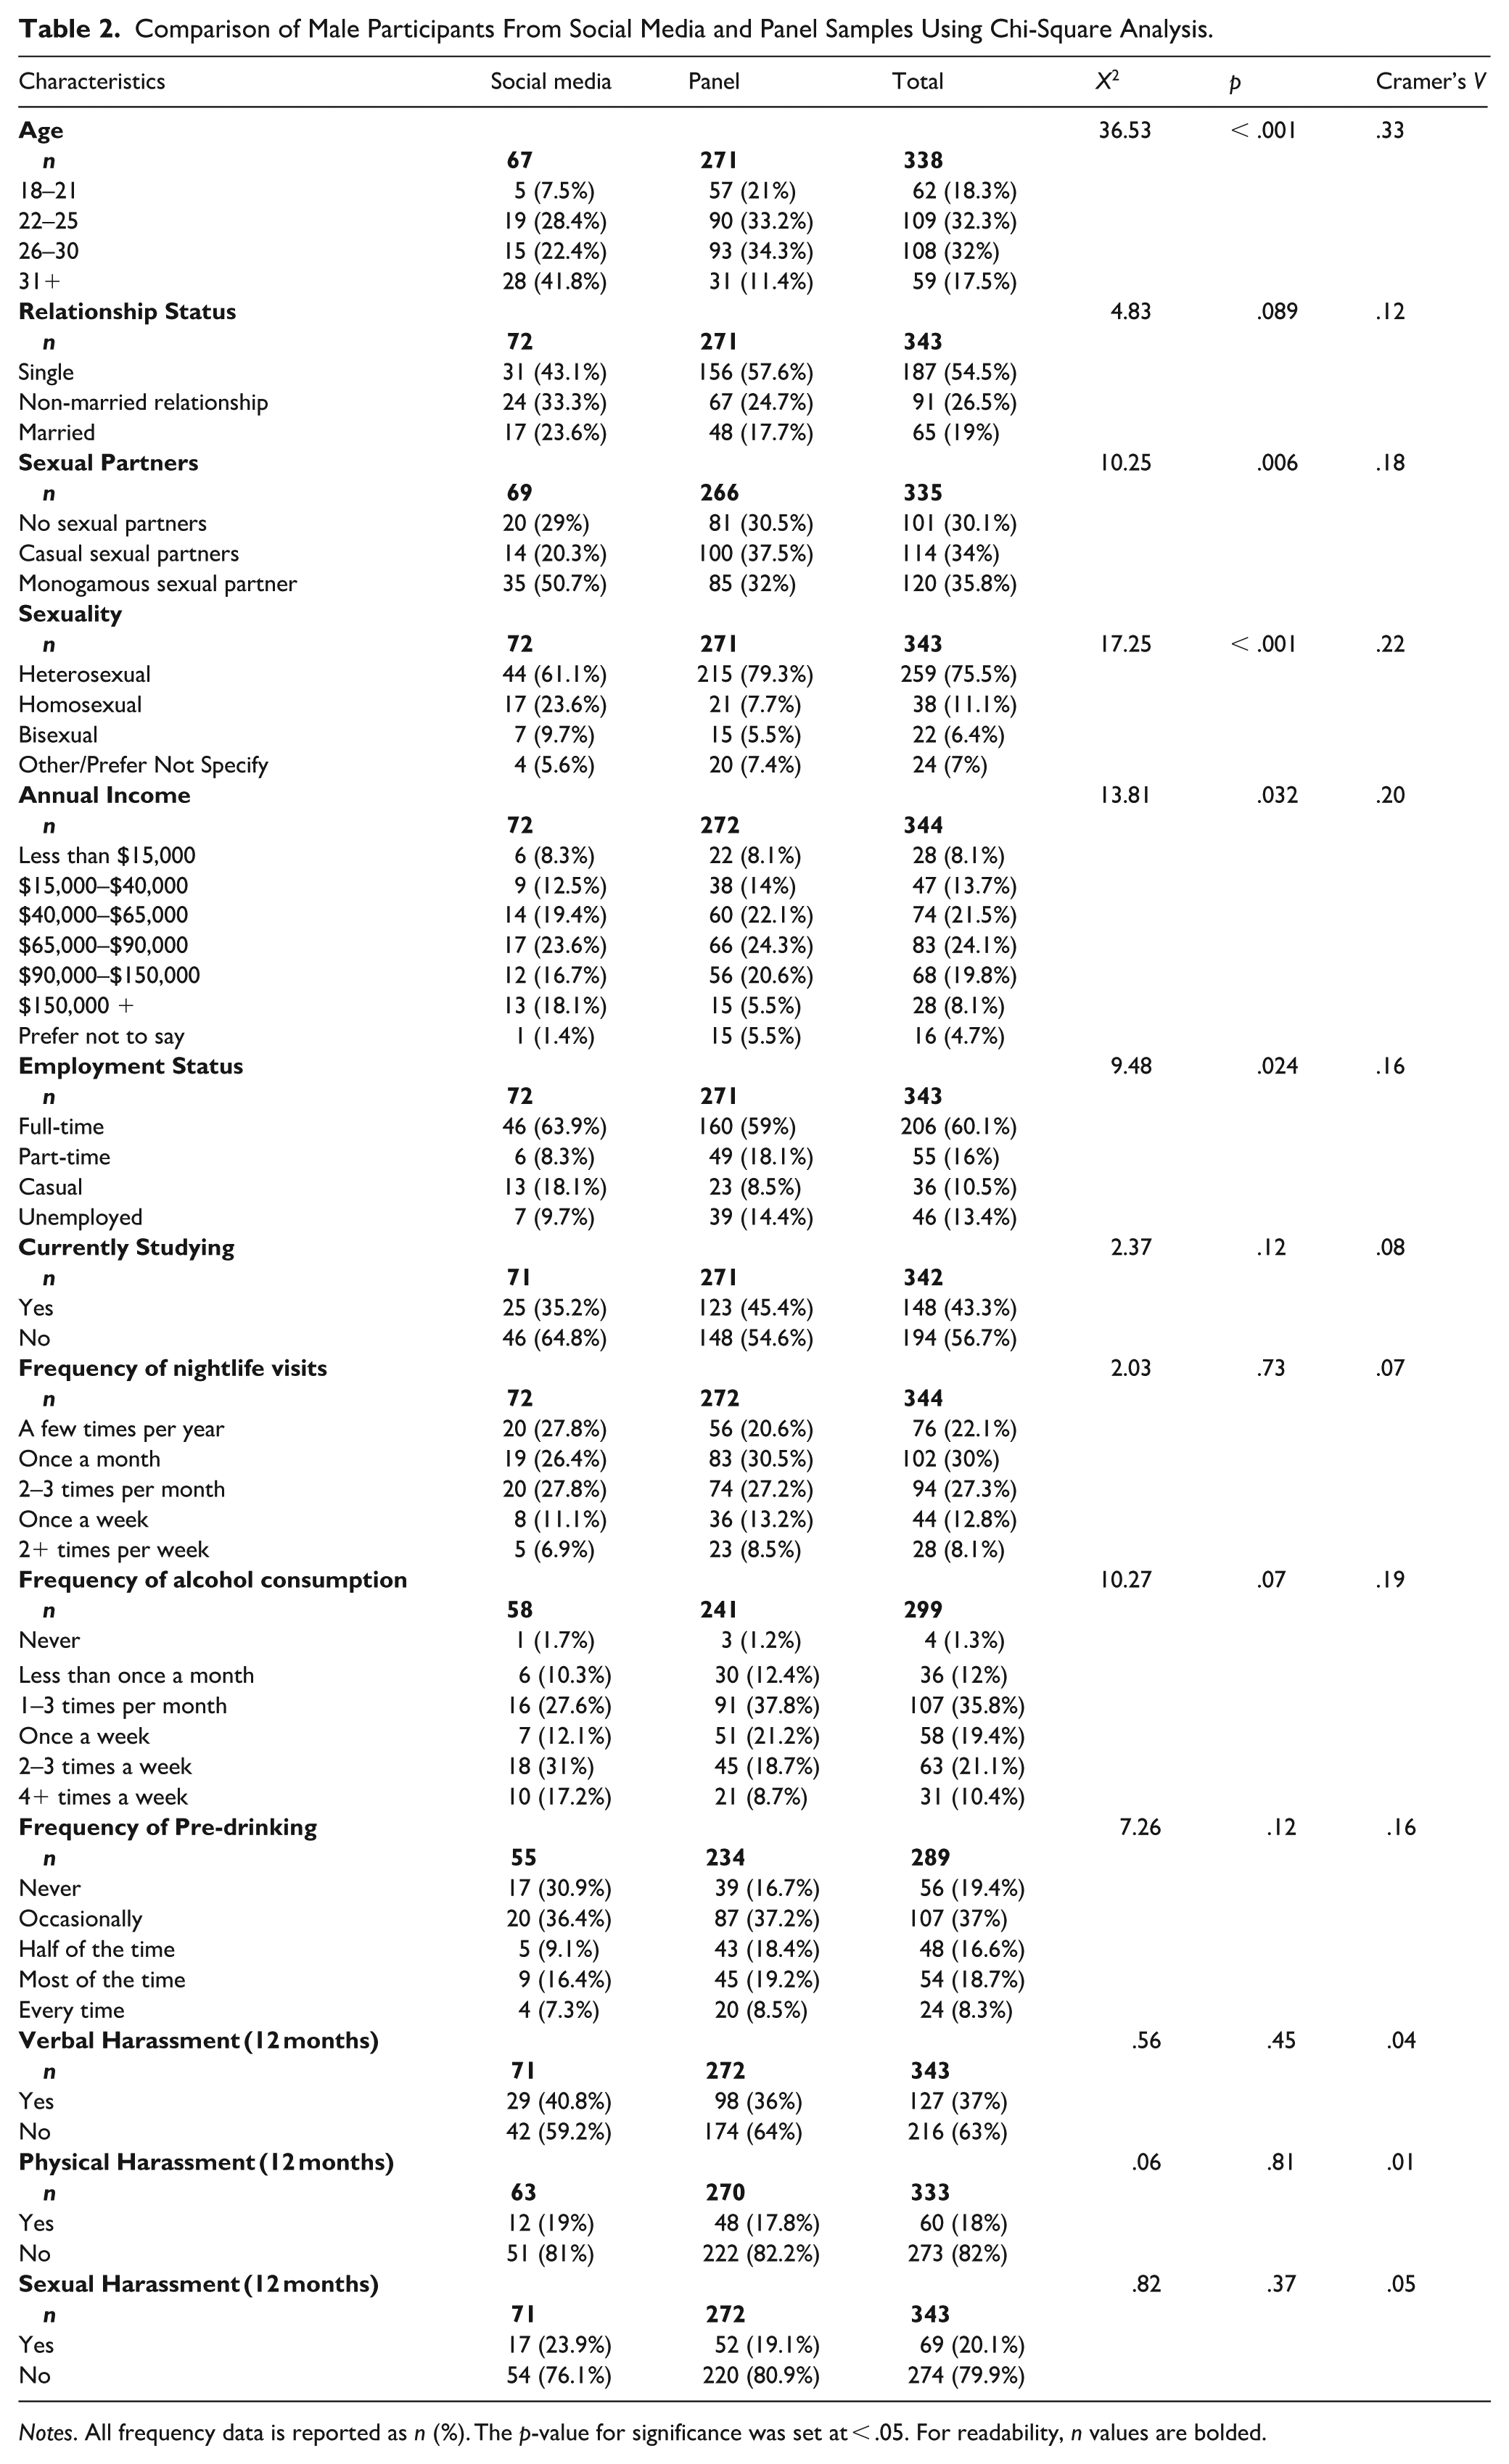
Notes. All frequency data is reported as n (%). The p-value for significance was set at < .05. For readability, n values are bolded.
Study 2
Method
Participants and Procedure
The study compared data from the online panel sample and a patron street-interview sample. In the street-interviews, participants were asked about their experiences of nightlife-related aggression in the past 3 months. To make the data comparable, questions were added to the panel survey regarding participants’ experiences of each form of harassment in the past 3 months. Overall, 698 participants (53.9% male), whose ages ranged from 18 to 65 years (Mdn = 24, IQR 20, 28) were included in Study 2.
Street-Intercept Interviews
Street-interviews were conducted in Geelong, which is the largest regional city in Victoria, Australia. Interviews took place between 10 pm and 3 am on Saturday nights from December 2022 until February 2023. Teams of four or more research assistants gathered a systematic random sample by approaching approximately every third patron who walked by, or who were queueing for a venue. Data were collected via the offline Qualtrics application on iPhone and iPad devices. In total, 305 patrons were approached to be interviewed, with 73 individuals refusing (76.1% participation rate). For the current study, six participants were excluded as they only partially completed an interview and did not complete the non-sociodemographic questions of interest. Following the removal of three additional participants who did not specify their gender, 223 patrons were included in the street-interview sample (53.4% female), with participants’ ages ranging from 18 to 62 years (Mdn = 20, IQR = 19, 24).
Online Panel Recruitment
Details for online panel recruitment are described in the Method for Study 1.
Measures
Street-Intercept Interview Survey Tool
The street-interview survey tool was derived from prior research (Miller et al., 2013).
Sociodemographic Characteristics
Participants were asked to provide their age and which gender they identified as, with both being included in the analyses as categorical variables.
Verbal and Physical Aggression
Participants were also asked if they had experienced any verbal (e.g., arguments or disputes) or physical aggression (e.g., fights) in or around licensed venues in the past 3 months. Dichotomous variables were created for physical aggression and verbal aggression (0 = no, 1 = yes).
Panel Survey Tool
Full details of the panel survey are provided in the Study 1 Method. Panel participants were also asked about their experiences of physical, verbal and sexual harassment in the past 3 months in order to make the data comparable to the street-intercept interviews.
Analytical Plan
Chi-square analyses were conducted to investigate the differences in age and experiences of harassment/aggression in the past 3 months between the panel sample and the patron sample. The analyses were stratified by gender, and the p-value for significance was set at <.05. Participant numbers varied across the analyses due to incomplete responses from some participants.
Results
Table 3 illustrates the distribution of age and experiences of aggression/harassment across the panel sample and the patron sample. For female participants, chi-square tests for independence revealed a significant difference between age and experiences of nightlife-related physical and sexual harassment/aggression in the past 3 months across the two samples. Notably, females in the patron sample were significantly more likely to report experiencing physical and sexual harassment/aggression in nightlife settings compared to panel participants. For male participants, no significant differences were found in experiences of physical, sexual and verbal harassment/aggression across the two samples.
Comparison of Panel and Street-Interview Participants Using Chi-Square Analysis.
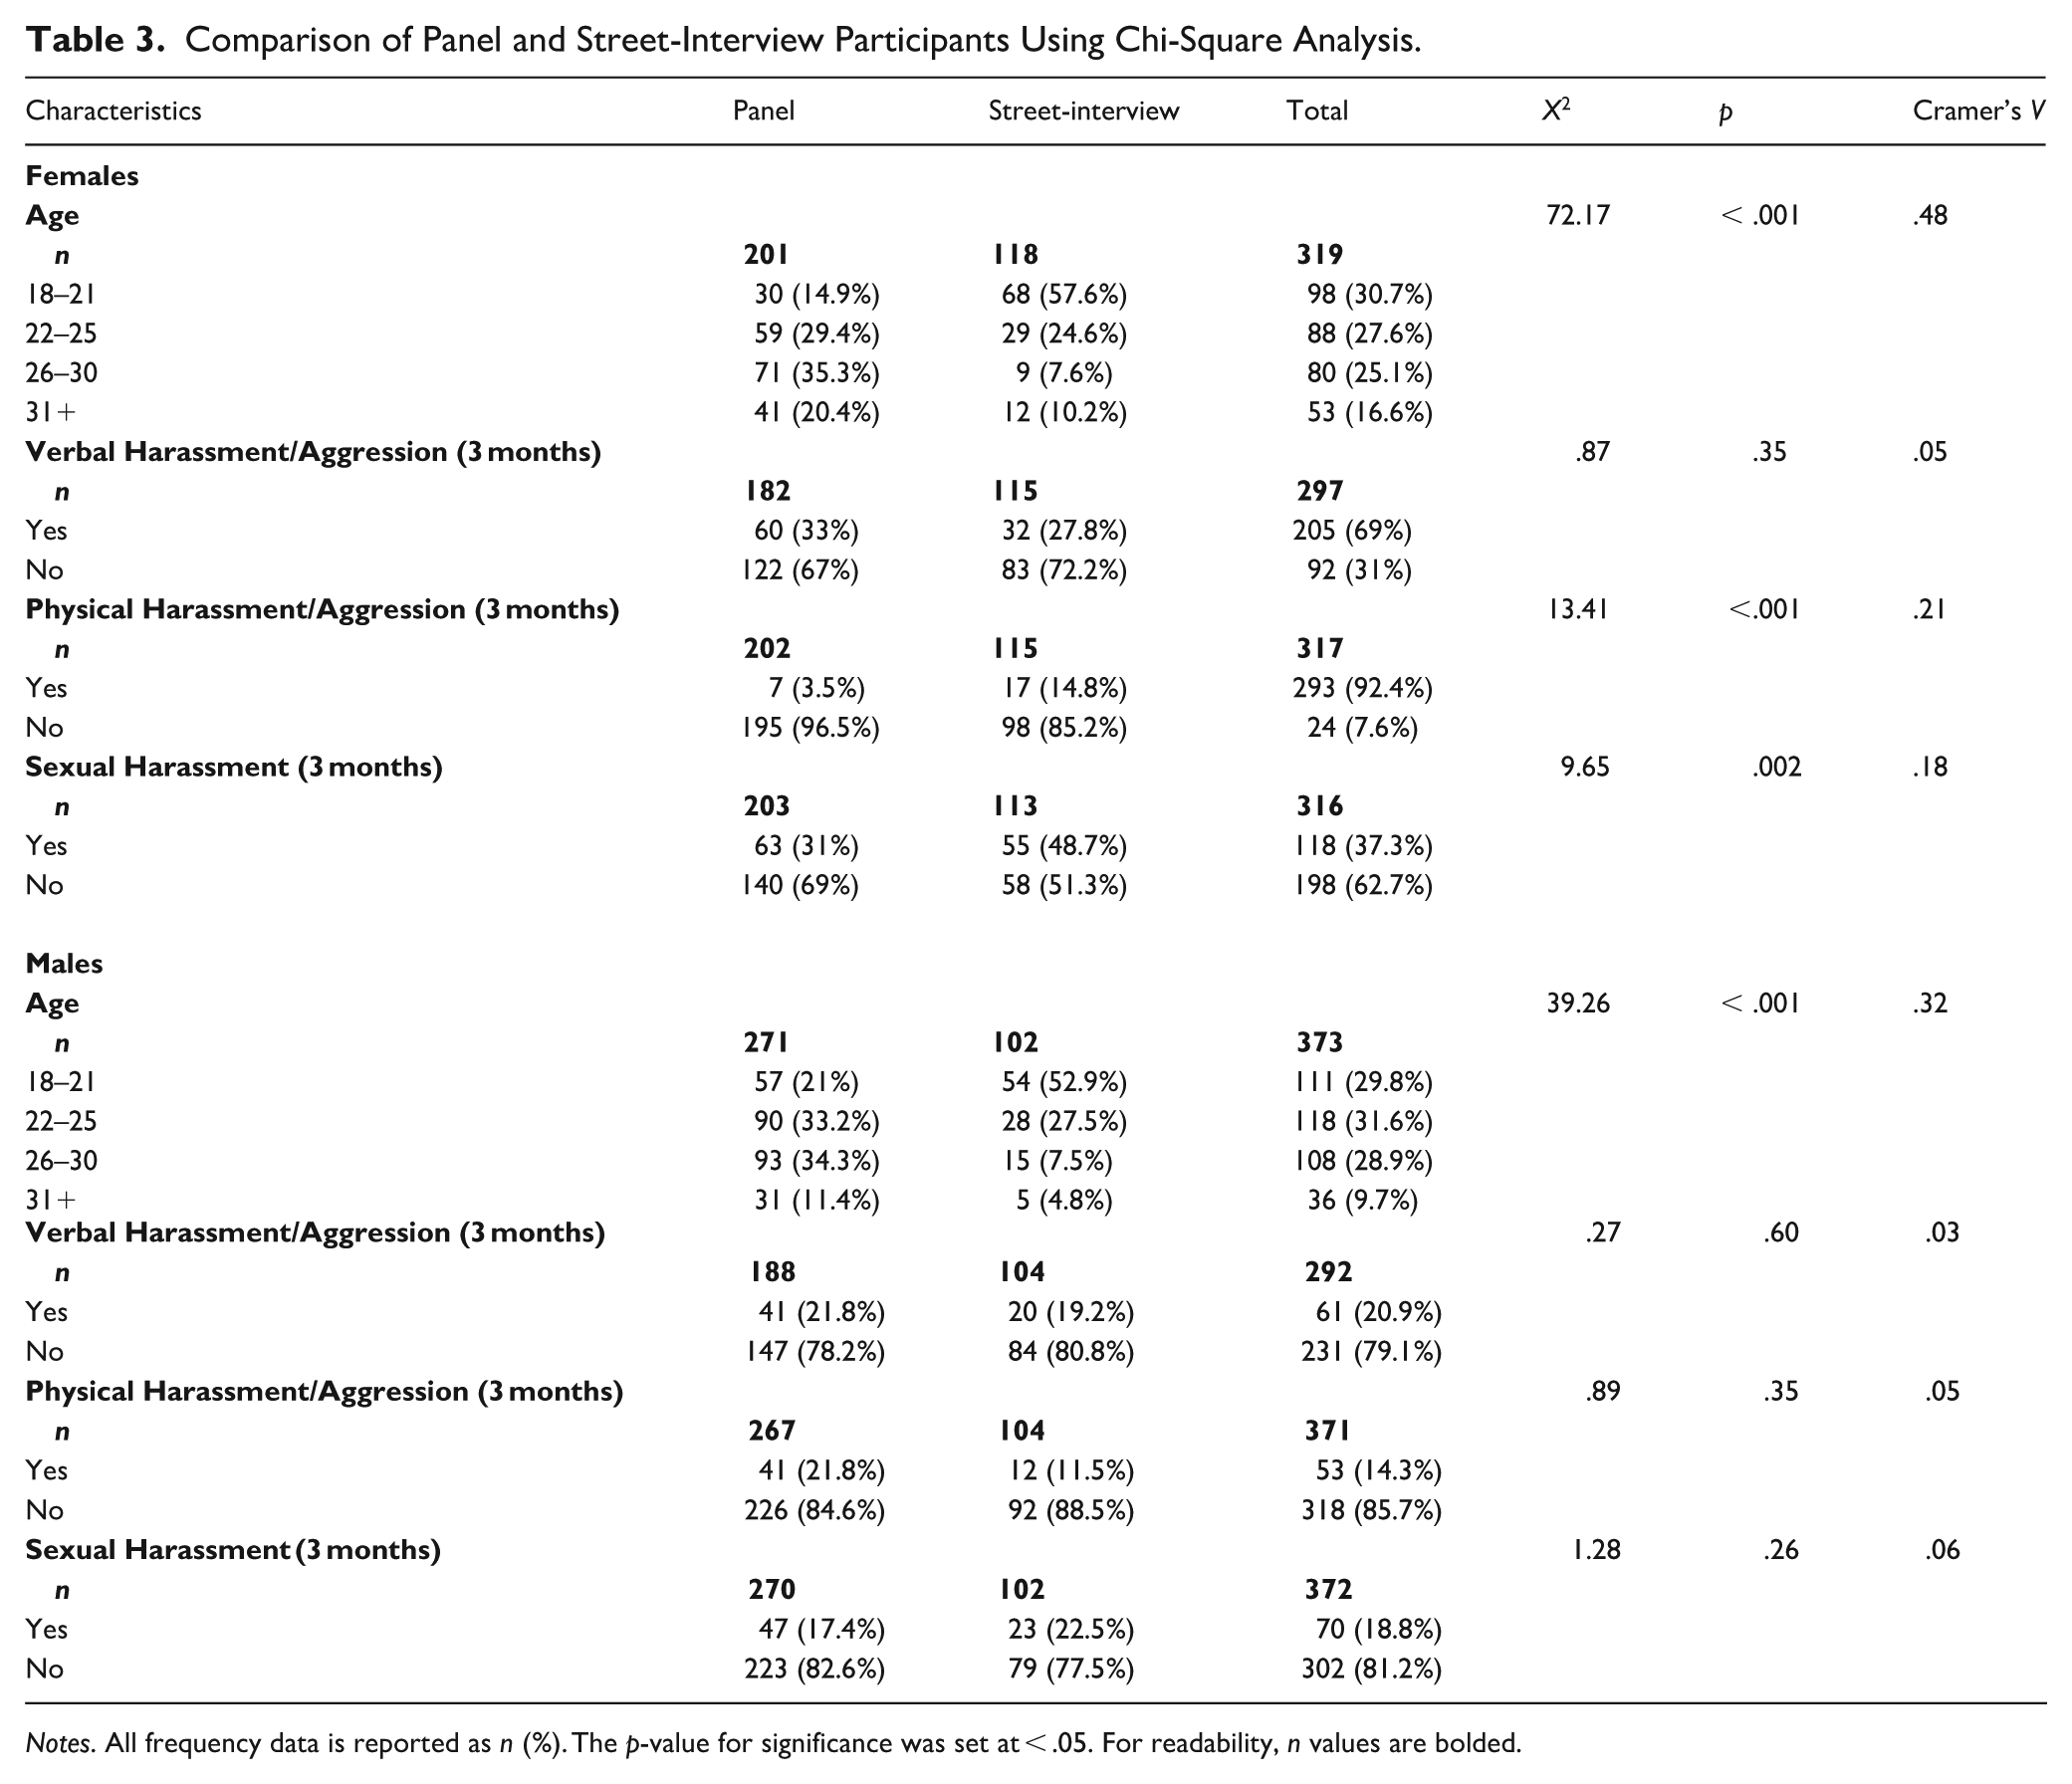
Notes. All frequency data is reported as n (%). The p-value for significance was set at < .05. For readability, n values are bolded.
General Discussion
Research suggests that the methodology employed for participant recruitment can notably influence the characteristics of the obtained sample (Belliveau et al., 2022). The current studies sought to understand the differences in participant characteristics between (a) a panel sample and a social media sample; and (b) a panel sample and a street-interview sample. The findings from Study 1 indicated several of the measured sociodemographic characteristics differed across the panel and social media samples. However, with the exception of females’ experiences of sexual harassment, there were no differences in alcohol use and experiences of harassment. Further, Study 2 found there were no significant differences in experiences of harassment/aggression for males when comparing the street-interview and panel samples. Although female street-interview participants experienced a greater proportion of physical and sexual harassment in the past 3 months compared to female panel participants. Collectively, the findings illustrate that methods of recruitment can influence certain sociodemographic and non-sociodemographic variables of a sample.
Notably, a greater proportion of female social media participants reported experiencing sexual harassment in the past 12 months compared to panel participants. These findings align with prior comparative methodology research, which found that a social media sample reported significantly higher rates of sexual assault compared to a panel sample (Canan et al., 2022). The findings may be attributed to self-selection bias, as participants with personal experience of nightlife sexual harassment may have been more inclined to participate when they see the advertisement materials on social media (Bethlehem, 2010; Canan et al., 2022). This may be less prevalent in panel recruitment, as panel survey participants are typically compensated for completing surveys (Keusch et al., 2014). As such, their motivation for survey completion may be more financially driven as opposed to having a personal connection to the study topic. Similarly, a greater proportion of the female street-interview sample experienced sexual harassment compared to panel participants. This difference may reflect the relatively low frequency of nightlife attendance among female panel participants, resulting in reduced exposure to nightlife environments where harassment is more likely to occur. Collectively, these findings indicate that researchers should be mindful of under-reporting females’ experiences of sexual harassment when utilising panel samples.
In relation to males’ experiences of nightlife harassment, no such differences emerged across the samples. This is noteworthy, as men are often considered less likely to report on sensitive topics in research, particularly in the presence of peers, where social norms around masculinity may discourage disclosure (Robb, 2022). Although patron interviews were typically conducted around peer groups, the consistency in reported experiences of harassment and aggression across methods suggests that social desirability pressures did not substantially influence male participants’ responses in this study. As no differences in harassment reporting were observed across recruitment types, both social media and panel surveys may be appropriate alternatives for engaging men in night-time economy research when patron interviews are not feasible.
Alcohol use and pre-drinking are common predictors and outcome variables in night-time economy and addiction research (e.g., Cameron et al., 2022; Fung et al., 2021). No differences were identified in the frequency of alcohol use and pre-drinking across the social media and panel samples. These findings are consistent with prior gambling addiction research, which found that a Qualtrics panel sample and a social media recruited community sample did not significantly differ on their level of alcohol use problems (Belliveau et al., 2022). Therefore, when street-interviews are not a viable option for researchers examining alcohol use, both panel and online samples may be an appropriate alternative. Further, in accordance with prior research (Belliveau et al., 2022; Boas et al., 2020; Canan et al., 2022), several sociodemographic differences between the social media and panel samples emerged. Age, relationship status, sexual partners, annual income and employment status varied significantly between the two online samples in the current study, although there were some differences across genders. Similar to prior literature, the social media sample had a higher proportion of older individuals compared to the panel sample (Boas et al., 2020). This may be attributed to the greater representation of younger individuals in some crowdsourcing research panels, with younger adults being more likely to provide their email or mobile number to join such panels (Dasgupta et al., 2023). There was also a higher proportion of unemployed females in the panel sample, which may be due to participants joining these platforms as a means of earning some income through survey participation (Keusch et al., 2014).
Another notable difference was that the panel sample had a higher proportion of heterosexual individuals compared to the social media sample. This may, again, reflect self-selection bias, as non-heterosexual individuals, who experience disproportionate rates of sexual harassment (Dawson et al., 2024), may have been more motivated to participate after seeing advertising materials outlining the study’s focus. However, given that approximately only 3.5% of Australians identify as non-heterosexual (Wilson et al., 2020), both online samples in the current study likely over-represented individuals identifying as lesbian, gay and bisexual. The sociodemographic differences across online samples could guide researchers in selecting the most appropriate method for recruiting targeted populations. For example, when recruiting a non-heterosexual sample, researchers may utilise a social media sample given its demonstrated ability to attract higher proportions of non-heterosexual individuals.
Limitations
The findings should be interpreted in light of the studies’ potential limitations. Firstly, we were unable to compare the street-interview sample to the social media sample due to substantial differences in the questions that were asked. Secondly, when enquiring about experiences of physical and verbal harm, the term ‘aggression’ was used in the street-interviews, whereas ‘harassment’ was used in the online survey tool. This difference in wording could have influenced how participants framed their experiences and, in turn, affected reporting rates across samples. While the use of consistent behavioural examples across recruitment types may have helped guide participant understanding, future research should examine how wording may influence participant responses. Thirdly, as the research team requested quotas for male and female participants for the panel sample, we were unable to compare gender distribution across the different samples. Fourthly, in Study 2, an Australia-wide panel sample was compared to a street-intercept sample recruited from one Australian regional city. As street-intercept sampling is subject to geographical and temporal limitations, and behaviours such as alcohol use are typically higher in regional areas compared to metropolitan areas (Redwood et al., 2024), the findings may not reflect national patterns. Future research could address this by recruiting street-intercept samples from diverse nightlife precincts across Australia.
Conclusion
The current study highlights the importance of participant recruitment methods, as they can impact the sociodemographic and non-sociodemographic characteristics of the sample. The findings have implications for researchers in the night-time economy field, as they may assist researchers in selecting the most appropriate participant recruitment technique, given their specific research question. Caution should be taken when utilising panel samples for sexual and physical nightlife harassment research, as these outcomes are likely under-reported in female panel participants. However, for researchers investigating alcohol use and males’ experiences of nightlife-harassment, panel and social media recruitment may be an appropriate and cost-effective alternative to street-interviews. Findings from the current study also highlight the importance of understanding the limitations and possible biases in data due to differing methodologies when used to develop interventions or policy. Knowledge of how each recruitment method shapes results is crucial to developing robust, evidence-based interventions and legislation.
Footnotes
Ethical Considerations
Ethical approvals were granted from Deakin University Human Research Ethics Committee (2022-284; 2022-112).
Consent to Participate
For street-interviews, respondents gave verbal informed consent, and for the online survey’s respondents provided written informed consent.
Consent for Publication
Not applicable.
Funding
The author(s) disclosed receipt of the following financial support for the research and/or authorship of this article: Kira Button is supported through an Australian Government Research Training Program Scholarship.
Declaration of Conflicting Interests
The author(s) declared no potential conflicts of interests with respect to the authorship and/or publication of this article.
Data Availability
The ethics approval for the current study does not permit the dataset to be made publicly available.