
Abstract
Domestic violence, especially intimate partner violence (IPV), is an important issue worldwide, especially in India. Those that experience it may not always be able to come forward or have access to the required social support to act against it. We use National Family Health Survey data (n = 66,013 women) to create machine learning models which can predict IPV instances with a recall of 78%. We use the top 15 best predicting questions that avoid sensitive issues to create a field tool that frontline health workers can use to identify women with a high risk of IPV and provide the support they need.
Introduction
Domestic violence (DV) is a global issue where the affected suffer in silence. Recent studies suggest that as many as one out of three women globally will be subjected to some form of domestic abuse during their lifetimes (World Health Organization (WHO), 2021). In addition, data from a systematic review by the WHO suggest that women in South-Asian countries have a higher likelihood of suffering intimate partner violence (IPV) than their counterparts in Western countries (WHO, 2010). In India, traditional gender roles, a patriarchal society (Pew Research Center, 2022 in Jonathan, 2022), and the extra “value” bestowed upon a male child (UNPFA, 2007) propagate a view of women as subordinates right from birth. In addition, cultural norms such as dowry and child marriages have historically impacted women’s agency in Indian society. According to the National Family Health Survey 2015 to 2016 (NFHS-IV), almost 30% of Indian women aged between 15 and 49 years were subjected to some form of DV in the last year. In absolute terms, this would translate into almost 100 million women, which is more than the combined populations of Australia, Canada, and Spain.
In India, machine learning (ML) techniques have been used to build predictive models that efficiently predict women’s likelihood of experiencing IPV, either using national-level cross-sectional datasets (Mcdougal et al., 2021) or using region-specific analysis (Choudhary, 2018; Ram et al., 2019; Rawat et al., 2021; Shambhavi et al., 2019). While these studies have established significant determinants relevant to the Indian context, there is a gap in the accurate prediction of IPV. We use nationally representative cross-sectional data of 66,013 women to create ML models which can predict IPV instances with 78% sensitivity. Our model comprises features that can be asked with a relatively low risk of desirability bias and operationalized by health workers in the field to identify women with a high probability of experiencing IPV.
Literature Review
The concept of IPV has been well explored in literature, and a concise definition is provided by Krug et al. (2002). They define IPV as behavior within an intimate relationship that causes physical, sexual, or psychological harm, including acts of physical aggression, sexual coercion, psychological abuse, and controlling behaviors. However, studying IPV proves challenging because many cases remain unreported, and victims often choose not to disclose their experiences in surveys. Leon et al. (2022) examined the willingness of other individuals to report IPV through vignettes in Spain and found that only 28% of respondents would report an episode of violence to the police. In addition, a victim of IPV is perceived as less moral and more responsible for what happened than a victim of generic violence, making them vulnerable to ostracism and reputational threats (Pagliaro et al., 2022). Moreover, recent events such as the pandemic-induced lockdowns have exacerbated the issue. It is suggested that DV cases in China, the United Kingdom, the United States, and other countries increased after the coronavirus disease 2019 pandemic began (Godin, 2020).
Studies have divided the risk factors of IPV into four levels: individual attributes (demographics, exposure to child maltreatment, mental disorder, substance abuse, and acceptance of violence), relationships (multiple relationships/infidelity), community specific (poverty, weak community sanctions) and societal (legal framework, gender, and social norms). Multiple studies have found that having limited access to education is the most consistent factor associated with both the perpetration and experience of IPV and sexual violence across studies (Ackerson et al., 2008; Boy & Kulczycki, 2008; Boyle et al., 2009; Brown et al., 2006; Chan, 2009; Dalal et al., 2009; Gage, 2006; Jeyaseelan et al., 2004; Johnson & Das, 2009; Koenig et al., 2006; Martin et al., 2007; Tang & Lai, 2008). In addition, women with more education than their husbands are more likely to be victims of IPV (Ackerson et al., 2008; Xu et al., 2005). Younger women from low-income households are more likely to experience IPV (Coll et al., 2020). Separated, divorced, pregnant, or depressed women are at higher risk of victimization. In a meta-analysis, Wang et al. (2022) showed a high prevalence of IPV among infertile women in Africa and Asia. Given the asymmetry in gender roles in India, Weitzman (2019) showed that the sex of the firstborn child is associated with domestic abuse.
Many studies have aimed to find nuanced relationships between these factors discussed in the literature and exposure to IPV. In a large-scale study in India, Boyle et al. (2009) investigated the effects of women’s education, attitudes regarding mistreatment, and living circumstances on IPV at the community and individual levels. Women’s education was found to lessen the likelihood of IPV exposure, and the link was nonlinear at the individual level, with the protective influence being stronger at higher levels. Women’s attitudes toward mistreatment and living standards explained the link between women’s education and IPV at the community level. Another study (Raj et al., 2018) investigated whether women’s economic empowerment and financial inclusion predict incident IPV. The most potent effects were seen for women who had joint control over their husband’s income, with women who lost joint control being more vulnerable to IPV than those who never had control. Uthman et al. (2009) investigated the impact of sociodemographic characteristics on men’s and women’s views on intimate partner abuse against women. Under certain conditions, IPV was broadly acceptable, particularly among women, younger people, less educated, lower income, rural, with little access to the media, and single decision-makers. In addition to the abovementioned studies, another paper (Emery et al., 2017) explored the influence of spouses’ perceptions of the possibility of IPV intervention by their neighbors on the likelihood of violent perpetration through vignettes designed to induce sexual jealousy. When spouses believed that there was a low likelihood of reporting IPV from their neighbor’s side, their responses suggested a higher likelihood of violence perpetration.
ML techniques have become increasingly prevalent in the prediction and identification of determinants of DV as they have shown superior efficacy in uncovering risk factors and accurately forecasting instances of IPV compared to conventional logistic regression methods (Petering et al., 2018). Amusa et al. (2022) tried to predict factors that increase the risk of experiencing IPV using ML by interviewing 1816 ever-married women in South Africa. Decision tree learning using the classification and regression trees algorithm, random forest, gradient boosting, and logistic regression were used for prediction. Random forest and decision tree learning outperformed, but the latter was chosen due to greater sensitivity than specificity. McDougal et al. (2021) identified new and potentially controllable elements impacting marital sexual violence (MSV) in India using ML algorithms with qualitative thematic analysis. The NFHS-4 survey was used to obtain information regarding sexual assault experiences in marriages in the previous 12 months. The neural network model discovered factors that closely matched major themes associated with MSV found through iterative thematic analysis, including experiences of/exposure to violence, sexual behavior, decision-making and freedom of movement, demographics, media access, health knowledge, health system interaction, partner control, economic agency, reproductive and maternal history, and health status.
Using Least Absolute Shrinkage and Selection Operator (LASSO), random forest, and boosted classification trees on a nationwide household survey dataset from India, Brahma and Mukherjee (2021) found neonatal and infant mortality predictors. Given the imbalanced nature of the datasets, they use multiple techniques to balance the dataset, providing further evidence that ML models outperformed logistic regression in prediction accuracy for newborn death. The resampling-based approaches (RUSBoost and SMOTEBoost) yielded comparable prediction accuracies to existing interpretable ML algorithms for infant mortality. Jayachandran et al. (2023) aimed to provide a novel method for designing a short survey measure by integrating mixed data collection methods and ML. The study measured women’s agency through a semi-structured interview (the gold standard), a close-ended questions survey, and a lab-in-the-field test. They used LASSO and random forest to find the five survey questions closest to semi-structured interviews in estimating women’s agency. According to the study, random forest collected more information from five factors, potentially being the first choice of researchers. In addition, Rituerto-González et al. (2019) used data augmentation techniques to assess the impact of stress on speech and its consequences on a speaker identification (SI) system. Their SI system achieved 96.05% accuracy using neutral and emphasized original utterances. The best results were achieved with naturally stressed samples, followed by stress-like samples created synthetically.
Methods
Preprocessing
We used data from the National Family Health Survey 2015 to 2016 to build and test our models. The NFHS-4 is a nationally representative survey funded by United States Agency for International Development and conducted by the Indian Institute of Population Sciences and the Central Government to measure demographic and health indicators. Similar Demographic and Health Surveys are conducted in other developing countries and are widely considered the gold standard dataset for public health researchers and demographers.
NFHS-4 was conducted with 601,509 households from all states and union territories in India. In each household, women aged between 15 and 49 years who had stayed in the house the previous night were eligible to be interviewed. In total, 699,686 eligible women were surveyed. A randomly selected subsample of 15% of households was administered to the DV module. One eligible woman was randomly selected to answer the module in each of these selected households. Out of these 79,729 women who completed the DV module, we selected a subsample of women who have been in a union, totaling 66,013.
We performed a preliminary screening of the variables to ensure that the data were compatible with the algorithms and that no redundant information was passed on to the models. First, we removed all variables with more than 30% missing values. Second, we checked if there were variables in the women’s questionnaire and household questionnaire that replicated the information; wherever there was duplication, we deferred to variables from the household questionnaire. Third, we removed variables that could be interpreted as proxies for our outcome variable. This list includes the individual components of our outcome variable, whether they have been hurt by individuals other than their spouses, and instances of sexual abuse. Finally, we dropped all variables that provided meta-information about the survey, such as the enumerator information, interview day, and unique identifiers.
We were left with 652 variables for the next phase of cleaning. These 652 variables were a mix of Boolean, numeric, and categorical variables. Since most ML algorithms that we used required numerical variables, we needed to preprocess these variables into forms that were acceptable to the algorithms.
Boolean variables were coded as 0 and 1 for false and true values, respectively. We checked the distribution of the numeric variables and capped outliers at the 5 and 95 percentile levels.
Our first step in preprocessing categorical variables was to compare the distribution of the variable with our dependent variable. We then recoded to combine levels to increase the interpretability of the model. For example, multiple levels with low observations and similar values for the dependent variable were binned into a single level. We also generated a few variables encoding information about the household and respondent, for example, the household density and whether the caste of the respondent matched the caste of the head of the household.
We used self-reported exposure to physical violence as our dependent variable to build the predictive models. NFHS-4 collects information about physical violence on two levels, exposure to less severe violence and exposure to severe violence. Since the models we wanted to use work best for binary classification, we created a composite variable where exposure to either level of violence was coded as 1, and no exposure to violence was coded as 0. As a robustness check, we later compared the reported level of violence to our predicted risk probability of IPV.
Modeling
We built and tuned predictive models using logistic regression, LASSO, random forest, and gradient-boosted decision trees.
Before beginning the fitting and hyper-tuning process, we randomly subsampled and separated 25% of the dataset as our test or hold-out set. We used the 75% dataset to train and tune our models, and the 25% test set was used to measure out-of-sample performance. An out-of-sample test set allowed us to mitigate concerns about overfitting the model and was an unbiased measure of model performance.
We demonstrate our hyper-tuning process for our random forest model below. For random forest models, the tuning parameters we iterated with were the number of estimator trees, the minimum number of samples in a node to be split on, and the maximum depth of decision trees. First, we fixed the values for two parameters: the number of features to consider at each node and a maximum number of samples to build trees. We did this by varying the values of these parameters and measuring cross-validated scores for area under the curve of the receiver operating characteristic curve, giving us exact values for these two parameters with which we initialized the model. Cross-validation scores were highest when we used the default for the square root of the total number of features at each node and used bootstrapped samples for each tree.
Optimizing the hyperparameters was an empirical question. We needed to compare the performance of models across different combinations of values for each parameter. We first ran multiple iterations with a wide range of values for each hyperparameter to narrow down each hyperparameter. We eliminated value ranges with low validation ROC_AUC scores and a large score difference for the validation and train fold. Low validation scores indicated poor predictive performance and a large difference in the validation and train fold indicated an overfitted model.
Once we had a range of values that provided good prediction without much overfitting, the grid search cross-validation technique helped compare performance for different combinations of hyperparameter values. The grid-search techniques allowed us to compare performance for a narrow range of values, providing information on model performance for granular changes in hyperparameter values. To pick the ideal model, we used the same criteria as the random search—models with high ROC_AUC scores and low differences in train and validation scores. A list of the final hyperparameters for all the models is shown in Supplemental Table S1.
Since our labels had a skewed distribution (~70/30 in favor of no DV incidence), using the default threshold of 0.5 for converting class probability into class prediction was likely to underestimate the distribution of label 1 in our out-of-sample prediction. As a mitigation measure, we moved the threshold for classifying test cases as 0 or 1 using the ROC curve. The ROC curve plotted the false-positive rate (1—Specificity) versus the true-positive rate (Sensitivity) for several threshold values. We used the geometric mean of Specificity and Sensitivity to measure the model’s performance for each threshold value and selected the threshold value with the highest geometric mean for Specificity and Sensitivity (Barandela, 2004; Kubat, 1997). Moving the threshold improved the out-of-sample performance of the model, from 46% recall to 72% recall.
As an additional robustness check, we created synthetic samples for the minority class and repeated the model-building exercise. We took our training dataset and ran Synthetic Minority Oversampling Technique (SMOTE) on it, that is, creating additional samples of the minority class, and converting the 70/30 distribution of the target class to a 50/50 distribution. We got similar performance results with a recall of 72%. We then repeated our model-building and hyper-tuning process as specified above, except for the threshold moving exercise.
Results
We trained and evaluated multiple ML algorithms on the full dataset of 66,013 respondents, with a 70/30 split for training and testing. Our sample was predominantly middle-aged, rural, Hindu, and lower-caste and lower-income groups. The median age of respondents and spouses was 32 and 36, respectively. Seventy-one percent resided in rural areas, and 75% of the sample was Hindu. Seventy-nine percent of the sample were part of Other Backward Caste, Scheduled Caste, or Scheduled Tribe categories. Fifty-two percent of the sample had completed secondary school, and 33% had worked in the last 12 months.
Given the ubiquity, ease of interpretability, and straightforward execution of logistic regression, we used its performance as the baseline to benchmark other algorithms’ performance. The positive recall rate in our test sample for a logistic regression model was 63%. We built on the logistic regression by introducing two regularization parameters, L1 type and L2 type. L1 type regularization, more commonly known as LASSO regularization, performed significantly better, with a positive recall rate of 74%. L2 type regularization, on the other hand, matched logistic regression’s performance of 63%.
Next, we trained models on tree-based algorithms, with random forest models performing at 72% and gradient-boosted trees giving a relatively high performance of 77%.
Figure 1 shows the positive recall rate for all the algorithms tested, with LASSO, random forest, and gradient-boosted tree algorithms providing some of the best performance. Table 1 describes all precision and recall metrics for each label class, the model’s weighted precision and recall scores, and the weighted F1 score. The F1 score serves as a balanced measure of model performance, and we calculate the weighted average of the F1 score, where the “weight” used is the proportion of each class’s occurrence. The same three models of LASSO, random forest, and gradient-boosted tree score the highest in all the metrics.
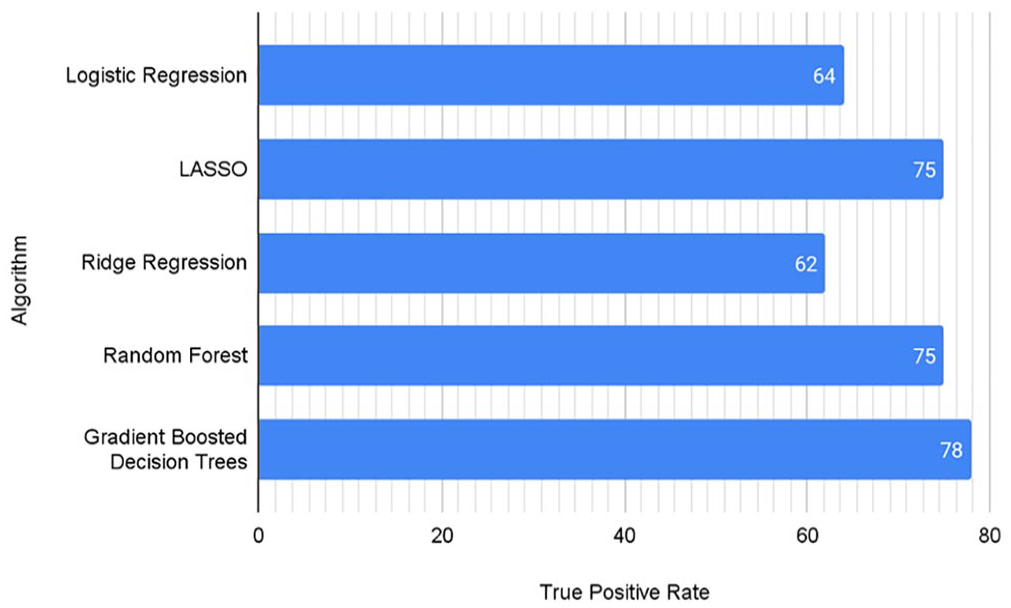
True-positive rate for each of the different algorithms.
Key Performance Metrics for Each of the Algorithms Used.
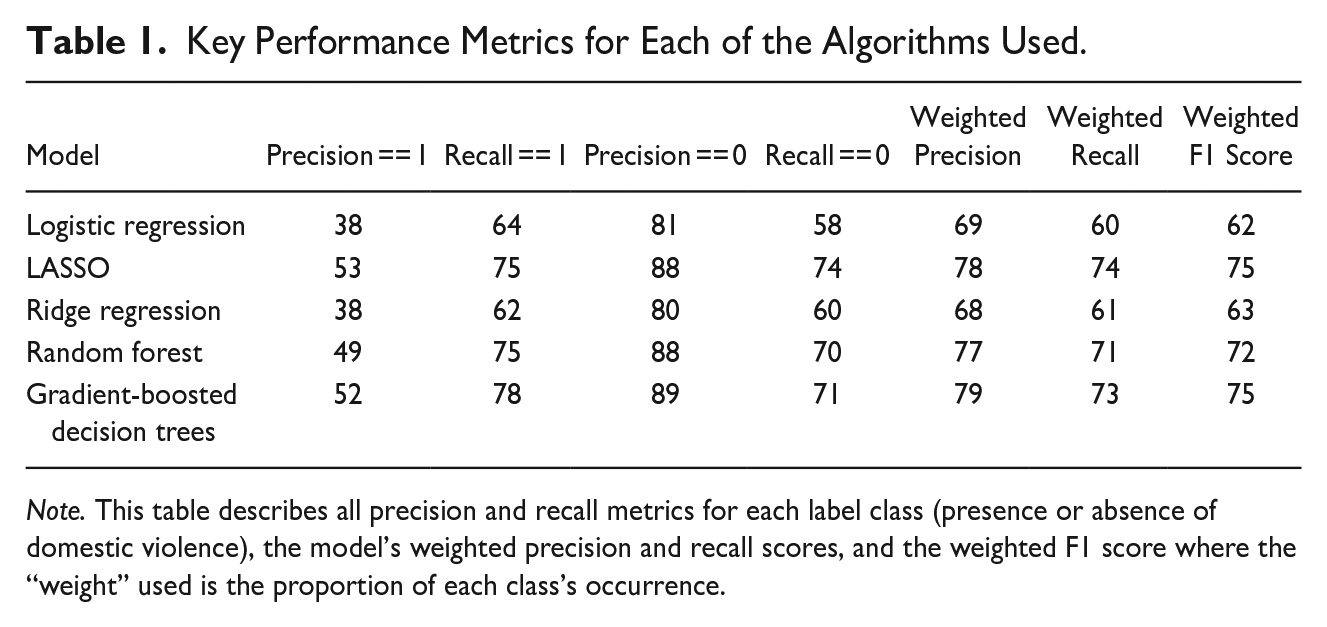
Note. This table describes all precision and recall metrics for each label class (presence or absence of domestic violence), the model’s weighted precision and recall scores, and the weighted F1 score where the “weight” used is the proportion of each class’s occurrence.
Table 2 shows the top 30 predictors for random forest model. Figure 2 compares feature importance across our three best models to understand the major thematic predictors of DV. Objective variables that describe the husband’s and father’s behavior and the woman’s circumstance are some of the best predictors of IPV. These include the two most significant predictors of IPV for married women: alcohol consumption by the husband and prior exposure to intergenerational violence (e.g., if the woman’s father ever hit her mother). Other variables in this category include marital separation and miscarriage. The wife’s perception of the husband’s control issues, such as the husband being jealous of the wife talking to other men, him insisting on knowing her location, him accusing her of being unfaithful, and limiting her family visits are some of the best predictors across the three best models.
Top 30 Features for Random Forest Model.
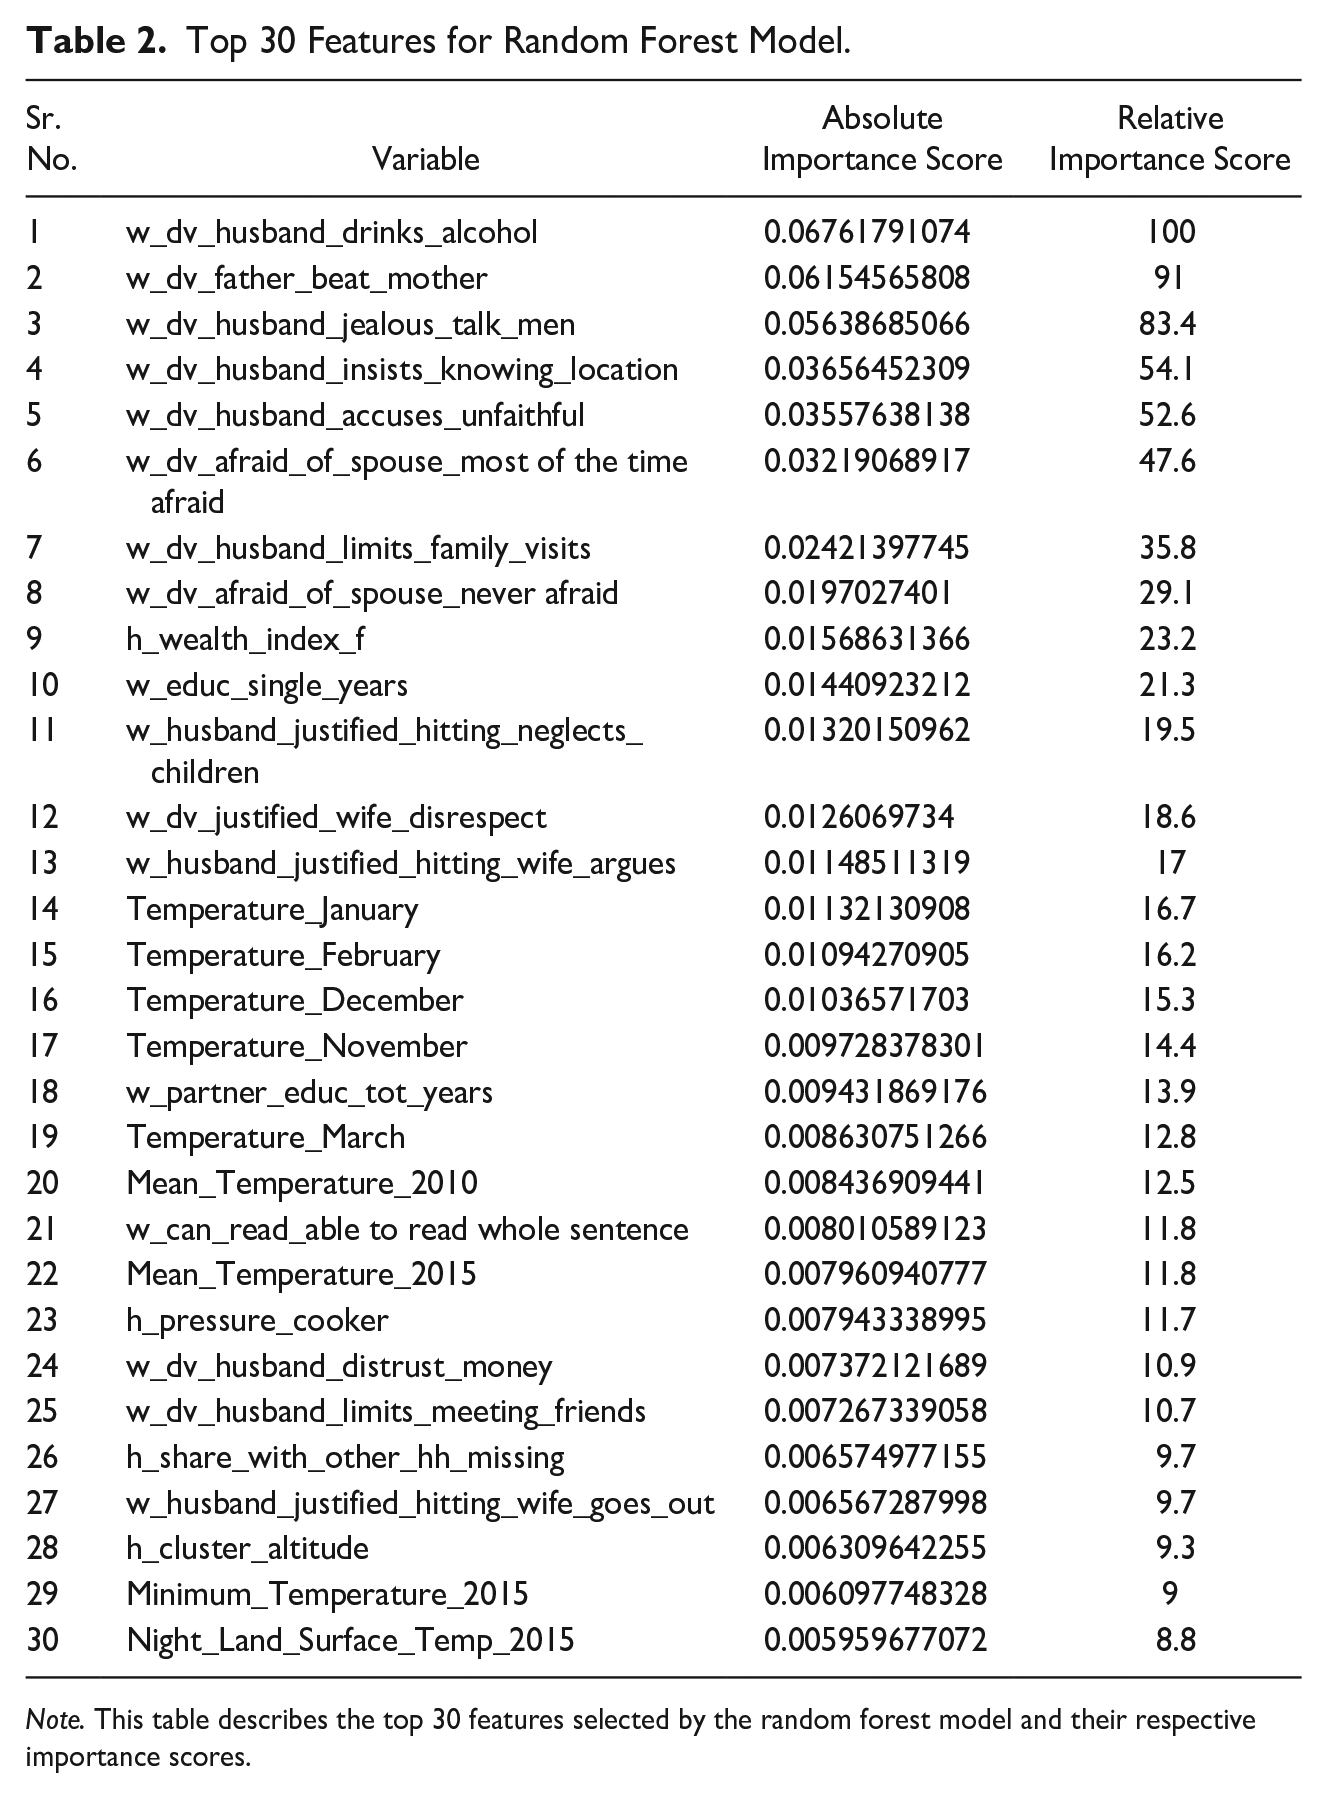
Note. This table describes the top 30 features selected by the random forest model and their respective importance scores.
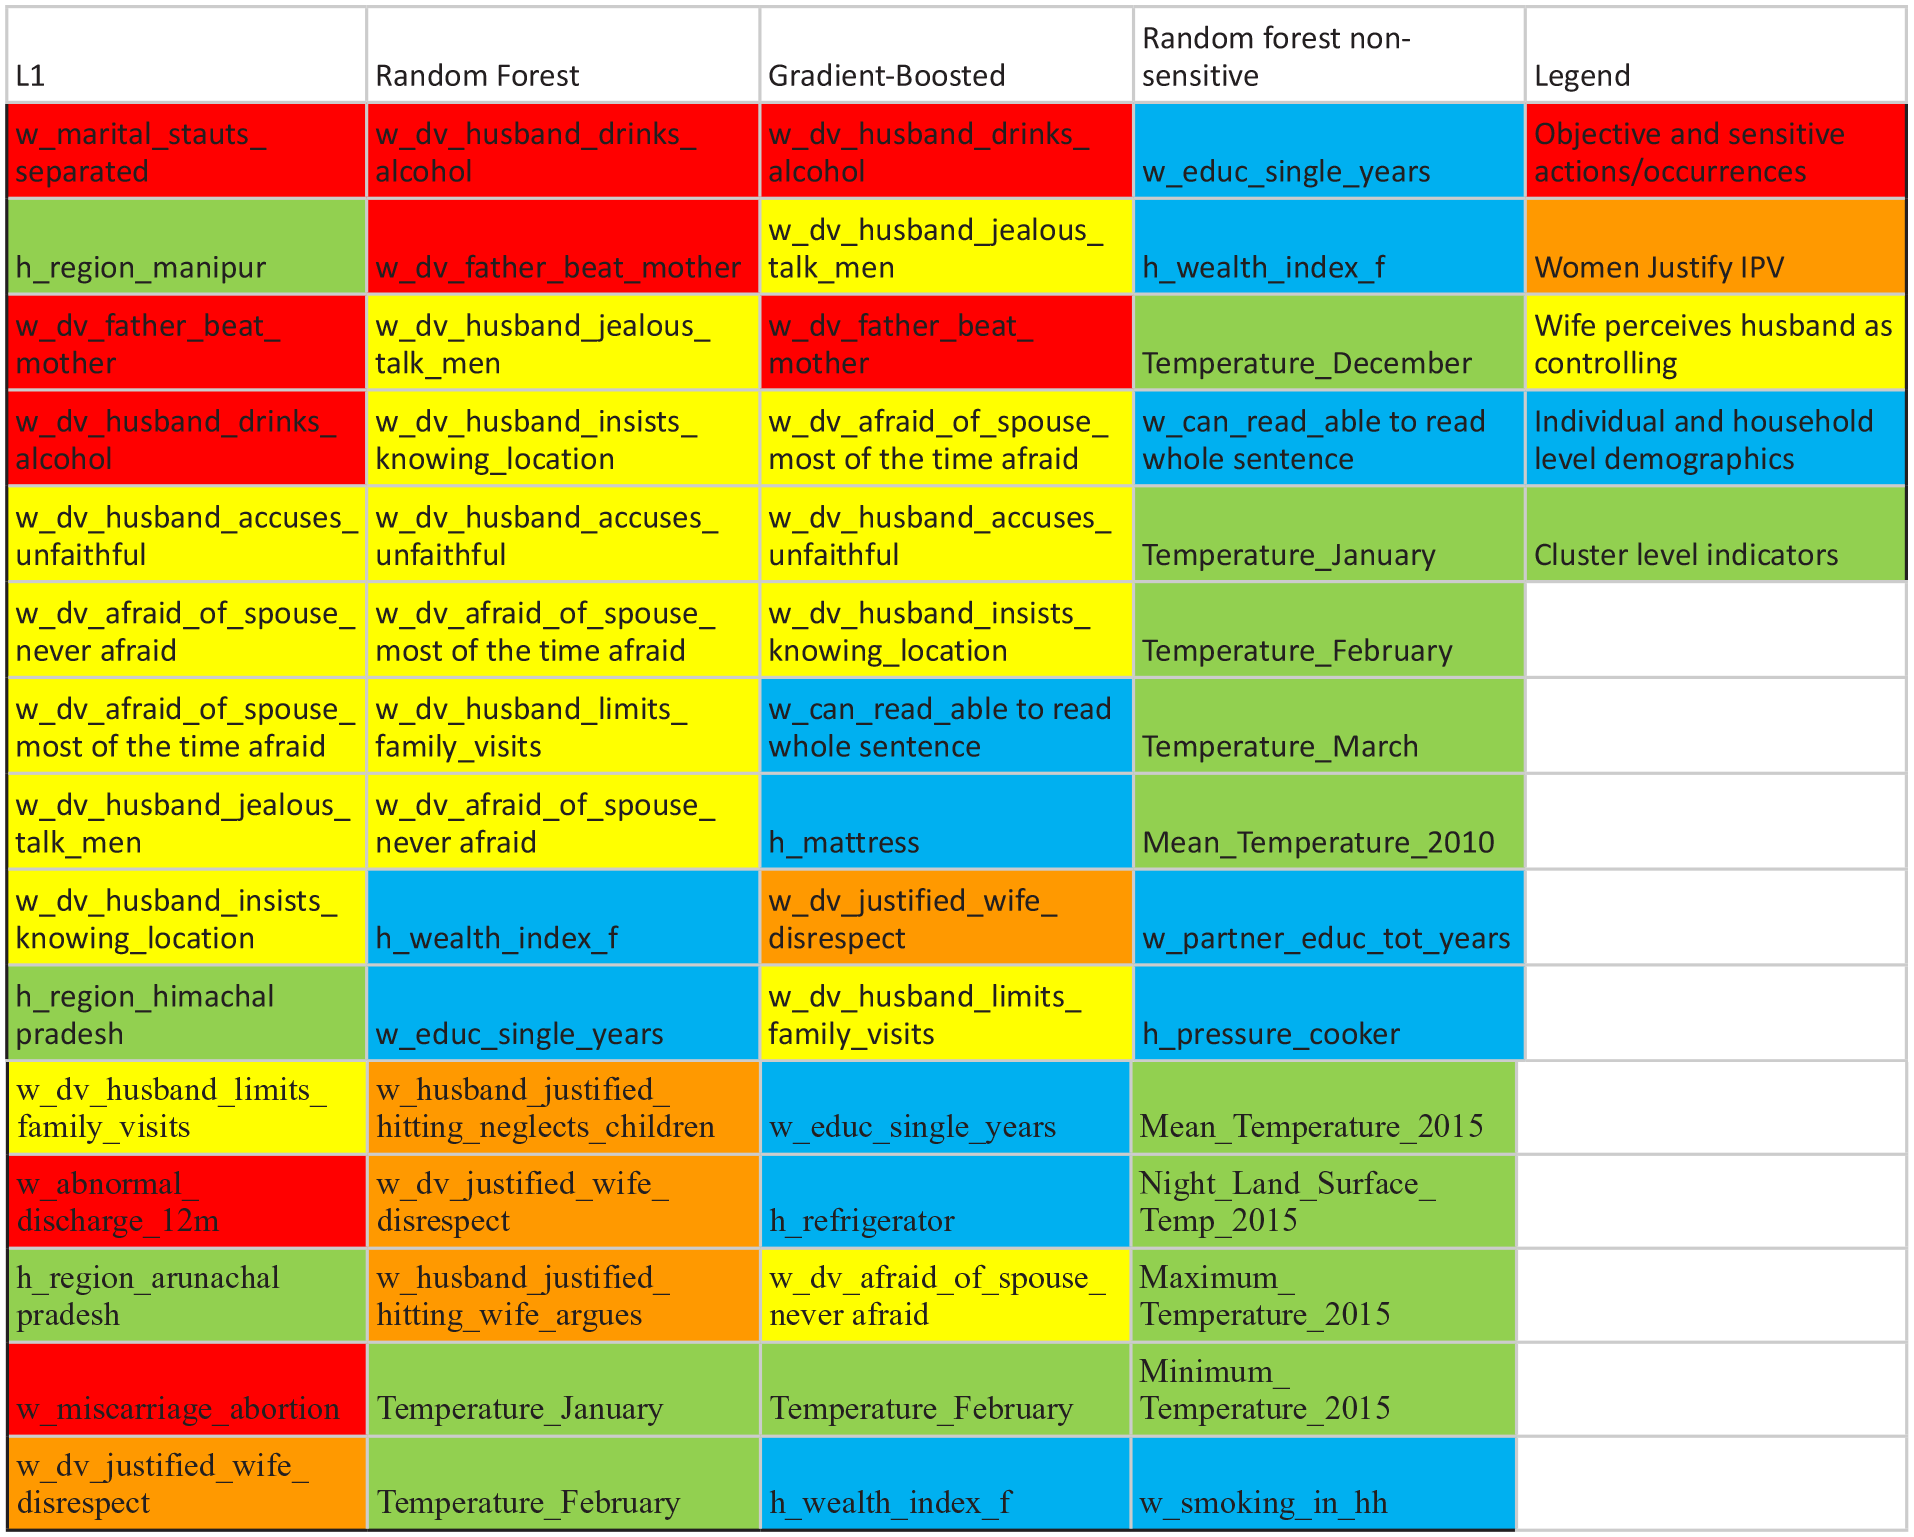
Comparison of the top 15 features across the best-performing three models.
Interestingly, both women saying they are never afraid of their husbands and saying they are afraid most of the time are predictors of IPV. Another important category of variables is women justify IPV for the wife showing disrespect or arguing and neglecting children. These are part of the top 15 predictors for all three models.
Demographic descriptors such as the relative household wealth, measured as a composite of the consumer durable goods the household possesses, is a significant predictor, as well as the household having a mattress and a refrigerator. In addition to household-level demographic descriptors, individual-level predictors such as education level and ability to read a whole sentence for the respondent are important predictors of IPV, with lower socioeconomic levels predicting a higher incidence of IPV. Temperature measures significantly predict high IPV locations among the cluster-level geospatial covariates.
We repeated this exercise for the random forest model by removing all the questions in the DV module and those that could be considered “sensitive,” that is, answers that the respondent might not be comfortable sharing and therefore give socially desirable answers, especially when they do not match the actual answers. Table 3 provides a list of questions/features omitted in this set. The top predictors are demographic and cluster-level factors. As seen before, the woman’s education, ability to read a whole sentence, and household wealth are factors. Besides, the husband’s education and household-level smoking indicators and owning a pressure cooker are top predictors. Different temperature indicators are also significant, with higher mean temperatures predicting IPV.
Excluded Predictors of Sensitive Nature.
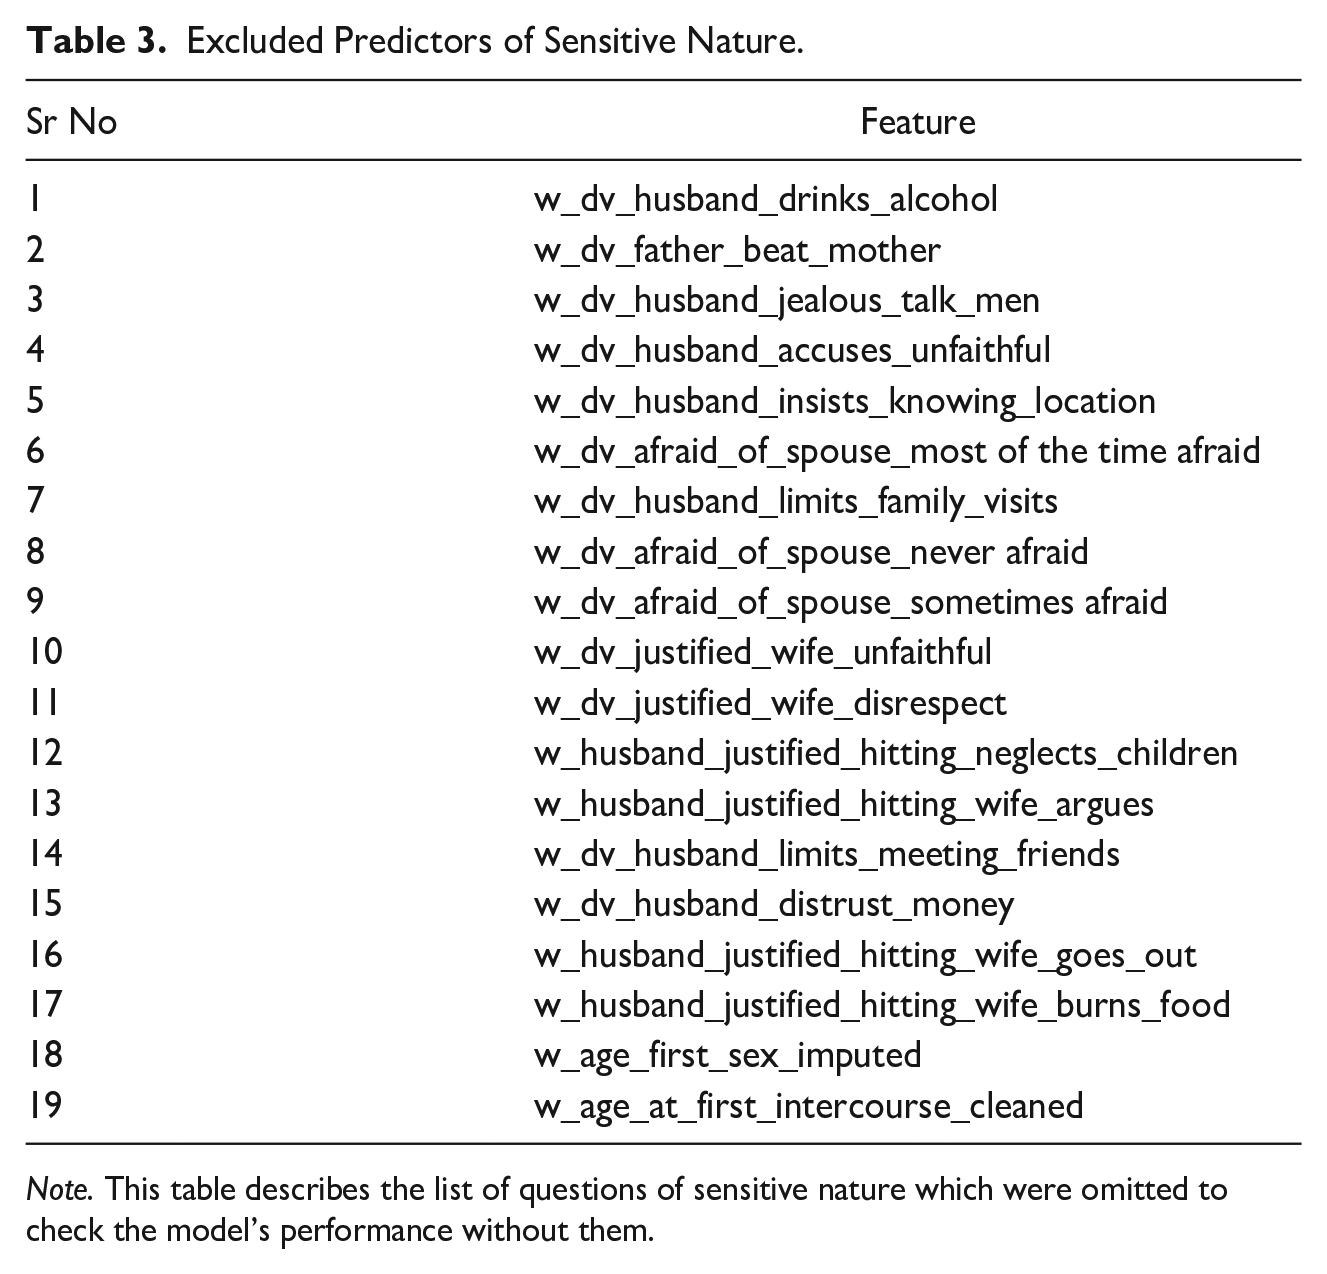
Note. This table describes the list of questions of sensitive nature which were omitted to check the model’s performance without them.
Next, we aimed to find the top 30 questions with the best predictive performance. We ran iterative models, adding features in sequential order of importance from the random forest model and observing how the performance changes depending on the number of features selected (Figure 3). This process was done with and without sensitive features. We see that performance in terms of recall rate and ROC-AUC increases as more features are added in the model, both in the case of all features and when using only nonsensitive features, up to a limit of about 50 features, where performance starts plateauing out. There is a noticeable decrease in performance of 8% to 10% when sensitive features are omitted, which persists even when 300 features are used.
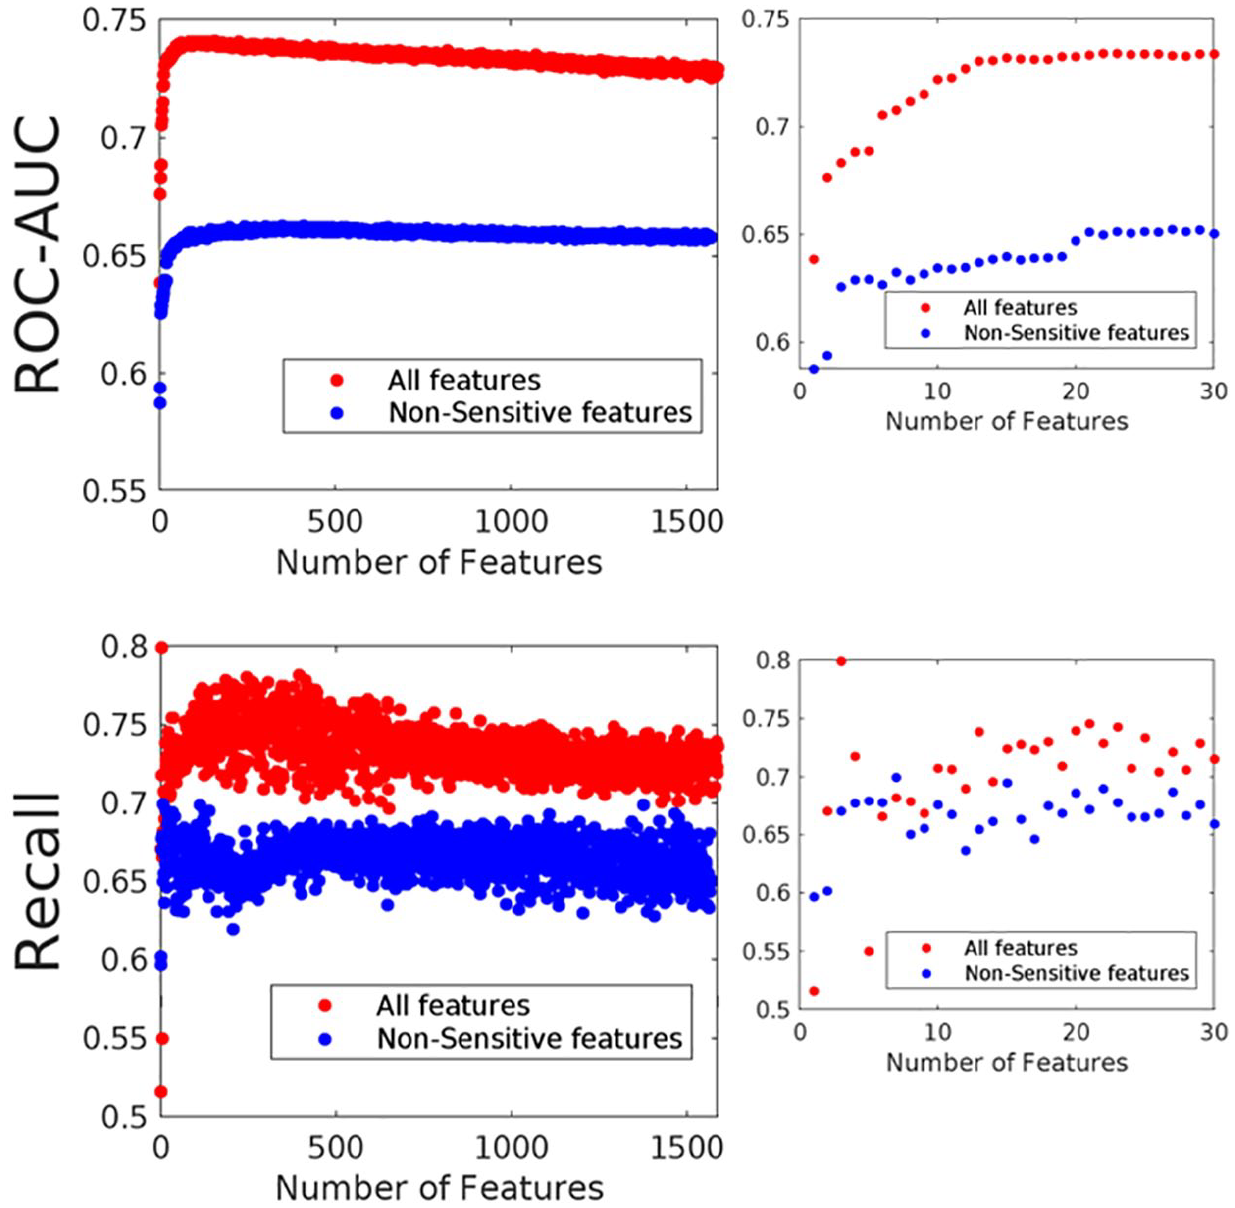
Performance of random forest models based on the number of features included.
Lastly, we tested the robustness of our model by understanding the nature of false positives and negatives. The NFHS-4 survey’s DV module questions allow us to classify women as not experiencing IPV, experiencing low severity, and experiencing high severity. The low and high severity were clubbed as the IPV class for model training purposes. Table 4 shows the confusion matrix for the random forest. We see that very few of the high-severity cases are classified as no-IPV (14.7%). The probability the model assigns is greater for the high-severity cases, even though the model has not directly trained on the difference between high- and low-severity cases.
Random Forest Predictions Across the Severity of Cases.
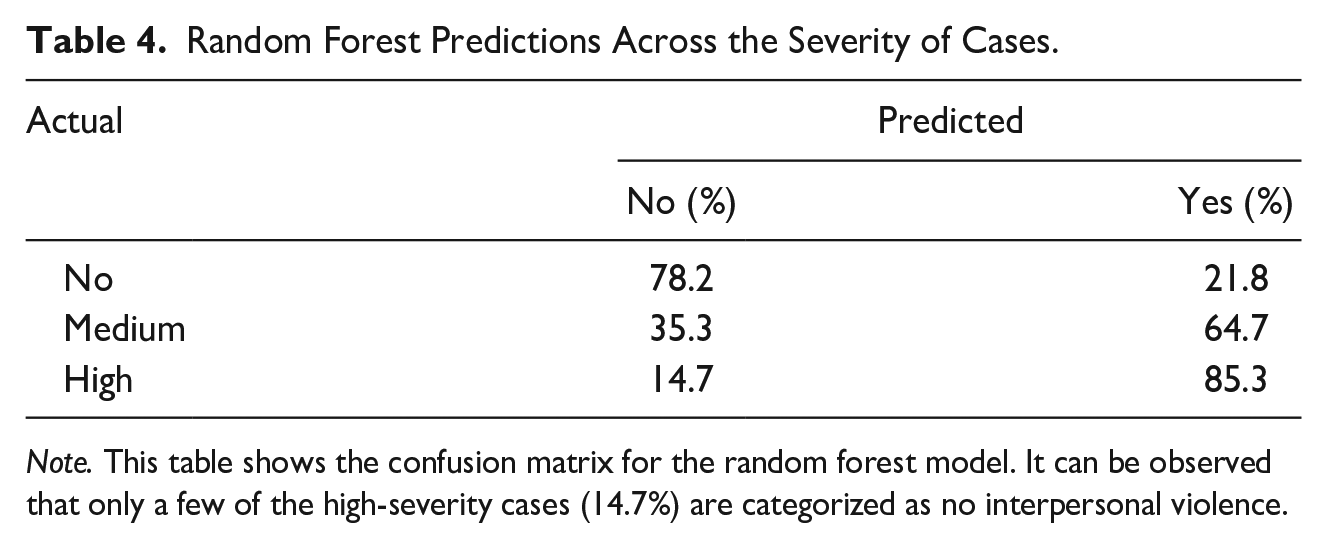
Note. This table shows the confusion matrix for the random forest model. It can be observed that only a few of the high-severity cases (14.7%) are categorized as no interpersonal violence.
Discussion
Building ML models provides one way to systematically assess the relative importance of predictors from a high-dimensional feature space. In this study, we attempt to isolate the best predictors of IPV among married couples across India. We train our model on a representative dataset—the National Family and Health Survey 2016 to 2016, providing what we think are reasonably generalizable insights into IPV in India. The two most important predictors of IPV are alcohol consumption by the husband and exposure to intergenerational violence by the wife. Alcohol use has been well known to be a predictor of DV (Hagelstam & Häkkänen, 2006; Mayshak et al., 2022), hypothesized to be related to IPV in multiple ways (Sontate et al., 2021). It lowers cognitive function and self-control and causes failure to resolve conflicts in nonviolent ways (Beck et al., 2013). It is a confound in that excessive drinking causes poor decision-making, exacerbating financial situations (Greene et al., 2017).
Women who think spousal violence inflicted by husbands is justified in certain perceived transgressions, such as if the wife neglects her children, argues with the husband, burns food, or goes out of the household, are associated with IPV. Prior literature on the directionality of such self-blame among IPV victims is mixed. Psychology literature suggests that self-blame in IPV victims is a consequence of violence. It is associated with low self-esteem and posttraumatic stress disorder among IPV victims and victims of sexual abuse (Beck, 2013; DeJonghe et al., 2008). Reich (2015) suggests that self-blame in IPV victims is a coping strategy for violence. Believing that the woman’s transgressions lead to deserved punitive actions from the spouse makes these actions wholly preventable, thus providing victims with a superficial level of control over the violence. Another view on self-blaming states that exposure to intergenerational violence in the formative years for the wife and spouse could reinforce patriarchal social norms of wives being of low status in marriage (Choi, 2020).
In addition, multiple measures of controlling behavior by the husband in the relationship are strong predictors of violence, including the husband not trusting the wife with money, insisting on always knowing her location and not allowing the wife to meet family or friends. Such behavior can be linked to a desire by the husband to reduce the wife’s autonomy and mitigate any exit options the wife may have from the relationship. Controlling behavior can also be seen as a reaction to the perceived threat of infidelity, which our models corroborate—women whose husbands accused them of being unfaithful or were angry if they talked to other men were at higher risk of DV (Kyegombe et al., 2022). Among demographic indicators, lower levels of wealth and education are associated with IPV, and cluster-level indicators of high mean temperatures are also predictive. A study in Spain also showed an increased risk of IPV with heat waves. They found that, independently of the trend and seasonalities, a positive and statistically significant relationship existed between the different IPV indicators analyzed and the maximum temperature reached during heat waves (Sanz-Barbero et al., 2018).
Using the random forest algorithm, we create a list of 15 questions that predict IPV with 74% recall (Figure 3). It is essential because it may not be possible to replicate the exhaustive nature of data collection as the NFHS survey questionnaire in the field. We then omit questions that could be construed as sensitive (Table 3) and thus lead to less honest answers from respondents and generate a set of 15 nonsensitive questions that predict IPV with 63% recall. While there is a sizable difference in predictive power between the two sets of questions, using the set without sensitive questions might give us more reliable data.
While fitting ML models, there is always the danger of overfitting models on the training dataset, leading to poor out-of-sample performance. To mitigate this error, we train our models using cross-validation methods over five splits of the train dataset. We compare the ROC-AUC score between the four train splits and one validation split to ensure that our hyperparameter search does not provide overfitted models. Since our target variable is naturally skewed toward value 0 (~70:30), we use synthetic minority oversampling to create a balanced dataset as a robustness check for our model. Training on these “balanced” datasets provides similar out-of-sample performance (68%), where the test split skews toward value 0.
We perform additional robustness checks to ensure that our final model provides reliable estimates. First, we generate a set of plausible responses to the feature set by randomly selecting the value of each feature from the complementary superset of values taken by the particular feature for each row for the test split. Predicting the DV incidence for this synthetic dummy dataset gives us inferior performance (39% recall for a positive class using random forest), suggesting that our prior performance was meaningful and based on the pattern of responses. Second, we check for performance when all features take random values for each row. This randomly generated test split feature set shows an overwhelming bias to classify respondents as victims of DV (94% of the test set is classified as a positive label class), again indicating the model picking up on an actual pattern. We use measures such as F1 scores as it balances precision and recall and minimizes false positives and false negatives. Achieving a high F1 score would imply a good trade-off between identifying all actual high-risk cases and avoiding false alarms, as achieved by LASSO and the gradient-boosted decision trees. Lastly, the model is less likely to wrongly classify a high-severity IPV case as no-IPV, suggesting the algorithm is based on authentic patterns underlying IPV.
Although our study provides valuable insights into the predictors of IPV, it is crucial to consider contrary findings and potential fallacies. The study identifies alcohol consumption by the husband and exposure to intergenerational violence by the wife as the most significant predictors of IPV. However, it is necessary to acknowledge that there are divergent views on the relationship between alcohol use and IPV, with some studies suggesting a causal link and others highlighting complex interdependencies (Kearns et al., 2015). Controlling behavior by the husband and accusations of infidelity are identified as strong predictors of IPV; yet, it is crucial to consider the potential biases and limitations inherent in self-reported data. One of our models’ major limitations is that the label/ground truth is based on self-reports (Follingstad, 2017). Our models are based on only those cases of IPV where the woman can also self-report IPV. Cases where the women were not forthcoming but did experience IPV are labeled “no-IPV” in the dataset. Thus, our models might pick up characteristics of women that can come forward about their experience rather than characteristics common to all women enduring IPV. To this end, we propose to validate further our models on data where the incidence of IPV is established through independent means. We could implement a format where the women answer these questions anonymously, reducing bias (Sanmani et al., 2013). Another possibility is to approach others in the women’s social network to ascertain the incidence of IPV (Latta & Goodman, 2011; Parker, 2015). Furthermore, we could use Keynesian beauty contest like methods to incentivize truth from the participants.
We further plan to test both sets of questions, with and without sensitive features, to empirically answer the question of which set fares better in a real-world scenario, the one with greater predictive power or the one where the data are potentially more reliable.
Our results validate the important thematic areas in the study of IPV through a large-scale representative survey in India. While these areas have been investigated before, combining them into one study allows for a prioritization exercise to isolate the most critical predictors of IPV and the areas to develop interventions against IPV. Our analysis opens at least two major avenues for further investigation and interest from researchers and policymakers. First, self-blame by IPV victims and exposure to inter-generational violence are understudied predictors of IPV. More research is required to understand the direction of causality between these predictors and IPV incidence. While causal linkages may be challenging to investigate immediately, a first step could be understanding if accepting interpersonal violence decreases women’s agency. Second, it is well understood that DV is severely underreported through formal channels. Women fear social stigma, humiliation, familial discord, and even physical backlash due to reporting DV. In such a scenario, predicting the quantitative risk of IPV based on responses to less-sensitive questions could help provide women with plausible deniability and reduce informational asymmetry between institutional support and IPV victims. Our model performs well with a limited set of reasonably nonintrusive features and could potentially be tested in the field as a diagnostic tool.
Supplemental Material
sj-docx-1-jiv-10.1177_08862605231191187 – Supplemental material for Using Machine Learning Prediction to Create a 15-question IPV Measurement Tool
Supplemental material, sj-docx-1-jiv-10.1177_08862605231191187 for Using Machine Learning Prediction to Create a 15-question IPV Measurement Tool by Sneha Shashidhara, Pavan Mamidi, Shardul Vaidya and Ishank Daral in Journal of Interpersonal Violence
Footnotes
Acknowledgements
We are grateful to Dr. Sharon Barnhardt at CSBC for her guidance.
Declaration of Conflicting Interests
The author(s) declared no potential conflicts of interests with respect to the authorship and/or publication of this article.
Funding
The author(s) disclosed receipt of the following financial support for the research and/or authorship of this article: This research has been funded by a BMGF core grant to CSBC (INV 026871).
Supplemental Material
Supplemental material for this article is available online.
Author Biographies
References
Supplementary Material
Please find the following supplemental material available below.
For Open Access articles published under a Creative Commons License, all supplemental material carries the same license as the article it is associated with.
For non-Open Access articles published, all supplemental material carries a non-exclusive license, and permission requests for re-use of supplemental material or any part of supplemental material shall be sent directly to the copyright owner as specified in the copyright notice associated with the article.