
Abstract
This study compared how two different measurement methods of client-perpetrated violence influence findings on prevalence rates and mental health outcomes in a probability sample of 660 Norwegian public sector child welfare workers. Using a single-item self-labeling approach, 15.4% reported exposure to physical violence, and 19.3% reported exposure to threats. Using a 15-item behavioral experience inventory, the prevalence rates ranged from 4.4% to 65.7%. A comparison of these methods uncovered a high number of false negatives when using the single-item approach as 62.2% of those who indicated that they had not experienced any workplace violence when answering the single-item questions reported being exposed 1 to 2 times when responding to the behavioral inventory. Results based on the behavioral inventory further revealed that the most frequently occurring actions in the child welfare service were direct and indirect forms of threats (24.5%–65.7%), while the least reported behaviors were threats and violence including objects (4.4.%–9.1%). Although client-perpetrated violence was significantly associated with mental health problems (e.g., symptoms of anxiety, depression, and post-traumatic stress [PTS]) for both assessment methods, the magnitude of the effect sizes differed from η2 = .000 to η2 = .121. These findings highlight that the use of different measurement methods for workplace violence has significant consequences for the assessment of prevalence rates, as well as on results of associated outcomes. Consequently, the decision on how to assess workplace violence has practical implications for uncovering how prominent the issue is, as well as the way in which this negative workplace exposure is subsequently addressed and counteracted. Therefore, both scholars and the child welfare service, and similar fields in which workplace violence frequently occurs, should take these findings into consideration for future assessments.
Introduction
Health and social service workers report higher occurrence of work-related threats and violence than other occupational groups with child welfare workers having a particularly enlarged risk of experiencing client-perpetrated violence (Shin, 2011). Some of this increased vulnerability could in part be explained by the very nature of child welfare work. Unlike other social workers, who work with clients that usually want their help, child welfare workers often handle clients who might not want their involvement (Burry, 2002). Thus, the way in which child welfare workers intervene (e.g., through investigations or child removal) could result in challenging and unpleasant consequences for the families involved (Shin, 2011). This may thereby partly explain the high levels of client-perpetrated violence among child welfare workers (Shin, 2011).
A recent assessment revealed that 40% to 76% of employees in the child welfare service had been subjected to threats or violence at work in the past 12 months, and that 72% to 82% had either experienced it themselves and/or knew of others that had experienced such mistreatment (Hagen & Svalund, 2019). Experiencing aggression at the workplace may be highly detrimental as systematic reviews and meta-analyses show that targets are at significantly higher risk of developing mental and somatic health complaints (Lanctôt & Guay, 2014; Nielsen et al., 2014; Rudkjoebing et al., 2020). In addition to having detrimental effects on the employees’ physical and psychological health, workplace violence may also pose a financial burden to the organization and the society (Hassard et al., 2018; Lanctôt & Guay, 2014). Findings further show that workplace violence is a risk factor for increased turnover, sick leave, absenteeism, and role rotations (Lanctôt & Guay, 2014; Robson et al., 2014; Shin, 2011). In addition, workplace violence has been linked to decreased quality of services within the field of child welfare (Littlechild et al., 2016). Subsequently, this might affect all the children and families involved in the child welfare system.
There are, however, some significant knowledge gaps in the literature on workplace violence, and especially regarding how the use of different measurement methods influence findings on prevalence rates and outcomes of threats and violence. As workplace violence is highly prevalent in the child welfare service, it is of particular interest to address the abovementioned knowledge gap within this specific occupation. Studies on other forms of workplace aggression, such as bullying and sexual harassment have shown that their prevalence rates are highly dependent on the measurement method used (Nielsen et al., 2009, 2010). However, it remains to be investigated whether this discrepancy is also apparent for the assessment of workplace violence and, if so, what the possible consequences of this might be. To fill this knowledge gap, the overarching aim of the current study was to investigate how a global single-item indicator of workplace violence compares to a multiple item scale inventory regarding findings on prevalence rates and mental health outcomes in child welfare workers.
Operationalizing and Assessing Workplace Violence
As a concept, workplace violence encompasses any acts of physical violence or threats thereof, as well as harassment, intimidation, or other threatening disruptive behavior that occurs at work or while on duty (NIOSH, 2021; OSHA, 2022). Despite being based on a relatively uniform and well-established theoretical definition, it has been argued that problems with the operationalization and measurement of different forms of workplace aggression have thwarted the overall scientific progress on this topic (Bowling et al., 2015). For instance, studies on other forms of workplace aggression, such as bullying (Nielsen et al, 2009) and sexual harassment (Ilies et al., 2003; Nielsen et al., 2010) have shown that prevalence rates are highly dependent on the measurement method used. Given that well-founded knowledge on workplace violence and its outcomes is essential in developing efficient preventive measures and interventions, ensuring a proper and valid assessment of the phenomenon have important implications for the understanding and handling of this negative workplace exposure. While psychological aggression can be perpetrated by both clients and colleagues, physical violence is mainly perpetrated by clients (Milczarek, 2010; Parent-Thirion et al., 2007). Thus, to capture the full range of workplace violence experienced by child welfare workers, the current study will focus on client-perpetrated violence. This includes violence from children and youths in the child welfare system, as well as their families.
Workplace violence has emerged as an important safety issue for members of the workforce all over the globe (Milczarek, 2010; Parent-Thirion et al., 2007). While 5% of workers in Europe report being subjected to workplace violence (Parent-Thirion et al., 2007), the general prevalence is 7% among the Norwegian working population (STAMI, 2021). Additionally, almost 2 million people in the US workforce report being subjected to violence at work annually (OSHA, 2002). Although workplace violence is present in the general workforce, some occupations are more at risk than others. Previous research has found workplace violence to be especially prevalent in samples of social service workers (Harris & Leather, 2012; Koritsas et al., 2008; Macdonald & Sirotich, 2005; Shier et al., 2018; Shin, 2011; Zelnick et al., 2013). A systematic review on work-related violence among social workers in children and family services found annual rates of psychological violence to range from 37% to 97%, while rates of physical violence ranged from 2% to 34% (Robson et al., 2014). Explanations that may account for this observed variation in prevalence could be related to methodological issues such as measurement methods and research design. An especially likely explanation is that the rates obtained in different studies is a result of how violence is operationally defined.
Operationalizing violence in a broad manner, where only a general term is provided (e.g., using single-item questions), may limit the number of cases that is classified as violent or threatening. As such an approach leaves it to the respondent to determine whether a specific incident should be classified as violence; this could possibly result in lower prevalence estimates. In contrast, specifying what the term includes and ensuring that several aspects of the phenomena are covered (e.g., using a behavioral inventory), allows for a more accurate identification of cases, and should thereby provide higher and more precise estimates of workplace violence (Arvey & Cavanaugh, 1995; Timmerman & Bajema, 1999).
Although using single-item questions are straightforward and also efficient when it comes to both time and space in an overall larger questionnaire, questions of this sort might not be optimal in capturing the actual prevalence of such sensitive topics. Specifically, the use of single-item questions requires the respondent to identify as a victim, and to label the acts they have experienced as violent. In some settings, such as in the child welfare service, this labeling and identification might be both challenging and difficult for the employees (Andersson & Överlien, 2018). While child welfare workers have an increased risk of being exposed to work-related violence, many workers and child welfare agencies also perceive this as a normal and inevitable part of their job, or as a “call-for-help” on behalf of their clients and users (Andersson & Överlien, 2018; Lamothe et al., 2018; Radey et al., 2022). Combined, having this mindset may increase the employees’ threshold for labeling these aggressive acts as violent incidents. Additionally, child welfare workers might hesitate to label aggressive acts as violent incidents due to the stigma related to being a victim, as well as an underlying fear of being blamed for the incident (King, 2019; Munobwa et al., 2021).
Child welfare workers have been found to often draw a distinction between the psychological and physical incidents they experience, with only the latter to be perceived as actual violence (Andersson and Överlien, 2018). Although this distinction provides the employees with a way to avoid labeling themselves as victims, research shows that psychological violence and indirect exposure to client-perpetrated violence can have a negative impact on emotional wellbeing that is equal to or even more severe than the impact of physical violence (Bride et al., 2007; Lee et al., 2021; Naughton et al., 2017; Thoresen & Hjemdal, 2014). It seems that psychological violence and threats of violence are normalized within the institutional setting (Andersson, 2020; Andersson & Øverlien, 2021), while also being the most common form of violence in the child welfare service (Andersson & Överlien, 2018; Graham & Shier, 2010; Littlechild et al., 2016; Shin, 2011). This emphasizes how the way certain types of frequently occurring threats and violence are defined and normalized within the child welfare context might lead to underreporting, which in turn poses a problem for both risk assessment and risk management (Littlechild, 2002; Munobwa et al., 2021). Thus, simply asking whether child welfare workers have been exposed to threats or violence, leaving them to define for themselves what such actions are, might underestimate the actual occurrence of workplace violence. When addressing such sensitive topics, it may therefore be more beneficial to use a behavioral inventory to obtain a more nuanced measure at a lower abstraction level. Addressing the occurrence of specific aggressive behaviors will spare the employees of having to make any interpretations about whether any encounters at the workplace should be considered as “violence.” In addition, it does not require the respondents to explicitly label themselves as victims. Thus, the use of a behavioral inventory should minimize the number of respondents that would otherwise hesitate to label themselves as exposed to workplace violence.
However, selecting behavioral inventories should be done carefully. For instance, while the Perception of Prevalence of Aggression Scale (POPAS) (Oud, 2001) covers a wide range of specific forms of threats and violence, this scale explicitly labels these acts as different forms of aggressive behaviors, thereby emphasizing the victimization following such exposure. This explicit labeling also counters the very advantage of behavioral inventories, that is, the possibility to focus on the actions without labeling the responders as “victims” or referring to the intention behind the acts. This makes the POPAS less suitable for occupations like the child welfare service where workplace violence is highly prevalent but also normalized (Andersson & Överlien, 2018). Although the POPAS is a quite comprehensive scale, one should aim at keeping the scales short to minimize response biases caused by boredom or fatigue (Schmitt & Stults, 1985). While additional items could specify unique aspects of the phenomena, they would also demand more time to administrate (Hinkin, 1998). Consequently, the POPAS is limited in its practicality and is not suitable to administer as part of comprehensive surveys on work environment and health that are carried out in organizations. To counteract the limitations described above, the current study will utilize a behavioral inventory that takes into account these concerns.
The use of response scale alternatives is also likely to influence findings on workplace violence. For instance, although King (2021) made use of a behavioral inventory, the operationalization of the violent incidents was still limited, as they were measured using dichotomous response categories. That is, the respondents only had to answer “yes” or “no” as to whether they had experienced the specific acts of violence or not. Consequently, determining the frequency at which the different acts occurred was not possible. In addition, the use of dichotomous response categories also limits the ability to further assess whether level of severity or frequency of incidents could have any impact on subsequent outcomes. By not assessing the frequency of the range of violent actions the employees experience, it would also be difficult for the employers to know which forms of violence are most prominent at their workplace. In such cases, it will be challenging for the employer to implement efficient strategies and procedures to target and counteract the specific forms of violence that their employees are exposed to. From a prevention perspective, it is therefore important to also assess the frequency with which specific acts of workplace violence occurs, and not only focus on mere prevalence rates of threats and violence as overarching concepts.
Aims of the Current Study
When investigating sensitive and somewhat ambiguous phenomena, such as workplace violence in the child welfare service, ensuring proper and valid assessment of the prevalence is crucial. Not only could poor assessment methods provide incorrect estimates of prevalence, but it could also have serious implications for all research on subsequent outcomes and thereby for the development of intervention strategies. The first objective of the current exploratory study is therefore to investigate the prevalence of workplace violence among child welfare workers using two different measurement methods (single-item questions vs. multiple item scale) to see whether this yields significantly different results of prevalence.
There also remains a gap in the literature as to which specific acts of threats and violence occur in the child welfare service. Therefore, the second objective of the current study is to use a multiple item behavioral inventory to identify which acts of threats and violence are common in the child welfare service, and which acts are less common. Using a behavioral inventory with response categories that assess the frequency with which the incidents happen further allows for the identification of when and under which conditions this may pose a problem for those working in the child welfare service.
Finally, the third objective is to investigate whether the use of two different measurement methods for workplace violence will also yield different results in outcomes. While there has been an increasing attention in investigating the relationship between mental health and different job characteristics (Harvey et al., 2017), less attention has been dedicated to investigate the possible mental health consequences following adverse social behavior at the workplace, such as threats and violence (Sterud & Hanvold, 2021). Thus, more specifically, the current study will investigate whether the use of different measurement methods might be a determinant factor when investigating associations between employees’ exposure to workplace violence and mental health-related outcomes such as mental distress (e.g., symptoms of anxiety, depression, and Post-Traumatic Stress [PTS]).
Methods
Design and Sample
The data were collected as part of the “Oslo Workplace Aggression Survey” (OWAS), which is a collaborative project between the National Institute of Occupational Health in Norway (STAMI) and The Vice Mayor of Education and Child Services in Oslo municipality. All employees (N = 1,182) working full or part time in the child welfare service in Oslo municipality were invited to participate in a prospective survey that included three measurement points over 12 months. At survey time 1 (T1) the employees were asked to fill in an anonymous self-reporting questionnaire assessing exposure to threats and violence, workplace bullying and conflicts, different aspects of the psychosocial working environment, work stress, and health and wellbeing. The T1 survey was conducted electronically over a 5-week period from March to April in 2020. A further description of the project is provided in a separate project protocol (Nielsen et al., 2020). A total of 660 questionnaires were returned, yielding an overall response rate of 55.84% at T1. The sample consisted of 76.7% women and 23.33% men. The mean age was 40 years (SD = 10.66). A total of 83.1% worked in a full-time position, 10.3% in a part-time position, while 6.0% were on-call staff. 0.6% were on temporary leave. Altogether 16.7% of the respondents had some sort of formal leadership responsibility.
Ethical Approval and Consent to Participate
The project was conducted in accordance with the World Medical Association Declaration of Helsinki. The Regional Committees for Medical and Health Research Ethics in Norway (REC South East) have approved the project (project number 28496). In line with the General Data Protection Regulation (GDPR), the National Institute of Occupational Health acquired permission from the Norwegian Centre for Research Data (NSD; approval: 226309) to process the personal data in this project for research purposes. When accessing the web-based questionnaire by a personal login code, the respondents had to confirm their informed consent before responding to the questionnaire. This procedure for securing informed consent was approved by the ethics committee and NSD. No personally identifiable information about respondents were available to the researchers, as data were de-identified prior to analyses.
Instruments
Exposure to physical violence and threats of violence was assessed using four single-item questions and a multiple item scale. Two of the single-item questions asked about general exposure to threats and violence at work for the past 6 months. Response alternatives were “yes” and “no”. The other two single-item questions asked about general exposure to threats and violence at work that was experienced more than 6 months ago, but still within their current workplace. Response alternatives for these single-item questions were “no, never”, “sometimes”, “often”, and “very often”.
Exposure to physical violence and threats of violence was also assessed with a 15-item questionnaire. This behavioral inventory captures exposure to specific forms of threats and violence, rather than more general categories. Most of these items were taken from two established indicators for assessing workplace violence (Barling et al., 2001; Gadegaard et al., 2015). To ensure that our scale was comprehensive and captures the types of threats and violence experienced by child welfare workers, a reference group from the child welfare service (with leaders on different levels, employees, and union members) was involved in the development of the behavioral inventory. As a result, some additional items were added to those already included from the two established scales. Respondents were asked to indicate their level of exposure to each of the incidents for the past 6 months before the survey. Example items were “Been threatened with a sharp object” and “Someone threatened to kill you.” Response alternatives were “never”, “once”, “twice”, “three times”, “four times”, and “five or more times”. The scale had strong internal consistency with a Cronbach’s Alpha value of .93.
The Hopkins Symptom Checklist (HSCL) was used to assess symptoms of depression and anxiety (Derogatis et al., 1974). Respondents were asked to indicate to which degree, or how much during the past week they had been bothered by 17 given symptoms. Example items for anxiety were “Anxious”, “Nervous”, and “Shivering”, while example items for depression were “Feeling lonely”, “Worrying too much”, and “Have thought about taking your own life”. Responses were given on a 4-point scale; 1 = “not at all”, 2 = “a little”, 3 = “quite a bit”, and 4 = “extremely”. Both the Anxiety and Depression scales had acceptable Cronbach’s Alpha values at α = .82 and α = .87, respectively.
Symptoms of PTS following a specific incident of workplace violence was measured using the 6-item Impact of Event Scale (IES-6) (Thoresen et al., 2010). Before giving their responses, the participants were presented with the following instructions: “Below you find a list of statements from people after traumatic events. Please read each statement and indicate how often these comments have been true for you in the past seven days regarding the event. If you haven’t experienced any of these during this period, please indicate this by checking the “not at all”- alternative”. The respondents were then instructed to think back at a specific event at work where they had been subjected to violence or threats of violence and indicate how often the subsequent statements had been true for them following that specific event. Example items were “Thought about it when you didn’t mean to”, “Experienced that other things kept making you think about it”, and “Tried not to think about it”. Response alternatives were 1 = “not at all”, 2 = “seldom”, 3 = “sometimes”, and 4 = “often”. The IES-6 had an acceptable Cronbach’s Alpha value at α = .95.
Statistical Analyses
Statistical analyses were performed using IBM SPSS Statistics 25.0. The behavioral inventory responses were grouped into “never”, “1 to 2 times”, and “3 or more times” to obtain acceptable group sizes for analysis. In addition, the two single-item questions were combined for the comparison, so that answering “yes” on one or both would indicate exposure to threats and/or violence. This would ensure a proper comparison between the methods as the behavioral inventory also covers both exposures simultaneously. Differences in the outcome variables (symptoms of anxiety, depression, and PTS) were investigated using a one-way between-groups analysis of variance (ANOVA). One-way ANOVAs were conducted for each outcome measure using both measurement methods. The behavioral inventory scale for workplace violence was used alongside the two single-item questions regarding exposure to workplace violence for the past 6 months because these single-item questions covered the same time period as the behavioral inventory. By doing so, it is possible to compare the effects and investigate whether the use of different measurement methods for workplace violence would also yield different results in outcomes. Summary scores were calculated for each scale based on a mean-score of their respective items. The significance levels for all analyses were set to p = .05. Effect sizes were estimated using partial eta squared (η2). In interpreting the partial η2 = .01, .06, and .14 indicate small, medium, and large effects, respectively.
Results
Prevalence Rates for Single-item Questions
The single-item indicators showed that 15.4% of the employees in the child welfare service reported being exposed to violence at work during the past 6 months, while 19.3% reported being exposed to threats. For the single-item questions addressing threats and violence experienced more than 6 months ago, but still within their current workplace, the prevalence rates were higher. In total, 68.9% reported having experienced threats in their current job (sometimes = 52.2%, often = 11%, very often = 5.7%) and 27.9% reported being subjected to physical violence (sometimes = 19.9%, often = 5.9%, very often = 2.1%).
Prevalence Rates for Behavioral Inventory
Appendix A displays the prevalence rates for all acts included in the behavioral inventory. The five most frequently reported behaviors in the child welfare service were “been exposed to verbal aggression (been shouted or cursed at)” (65.7%), “having someone threaten you indirectly (threatening looks, ambiguous verbal threats or threatening movements)” (49.5%), “experienced that someone threatened with self-harm” (27.2%), “having someone lose control and shatter or break something while you were present” (25.5%), and “having someone threaten to hit you” (24.5%). The two least reported behaviors were “had someone try to strike you with a weapon-like object” (4.4%) and “gotten personal belongings damaged or destroyed (car, clothes etc.)” (5.2%).
Comparing Methods for Assessing Prevalence of Workplace Violence
Table 1 shows that 37.1% of those indicating that they had not been exposed to threats and/or violence when answering the single-item questions had neither indicated exposure to any specific acts of threats and violence through the behavioral inventory. There were also a small number of false positives, meaning that 0.6% indicated exposure to threats and/or violence answering the single-item questions while they simultaneously had never been exposed to any specific acts of threats or violence as captured by the behavioral inventory. However, 62.2% of those who indicated that they had not experienced any threats and/or violence for the past 6 months when answering the single-item questions did indicate that they had experienced workplace violence 1 to 2 times when responding to the behavioral inventory. Lastly, 0.7% of those who indicated that they had not experienced any threats and/or violence at work when responding to the single-item questions did report experiencing acts of threats and violence 3 or more times when responding to the behavioral inventory.
Cross-Tabulations of the Behavioral Inventory and the Single-Item Questions.
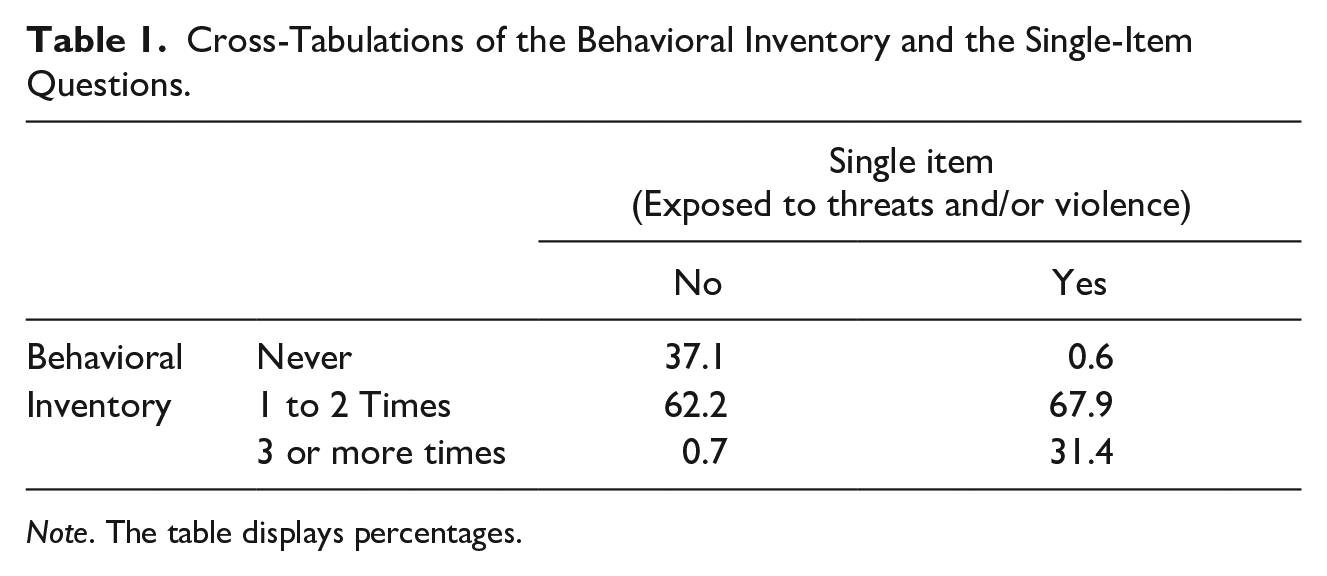
Note. The table displays percentages.
Associations With Symptoms of Anxiety
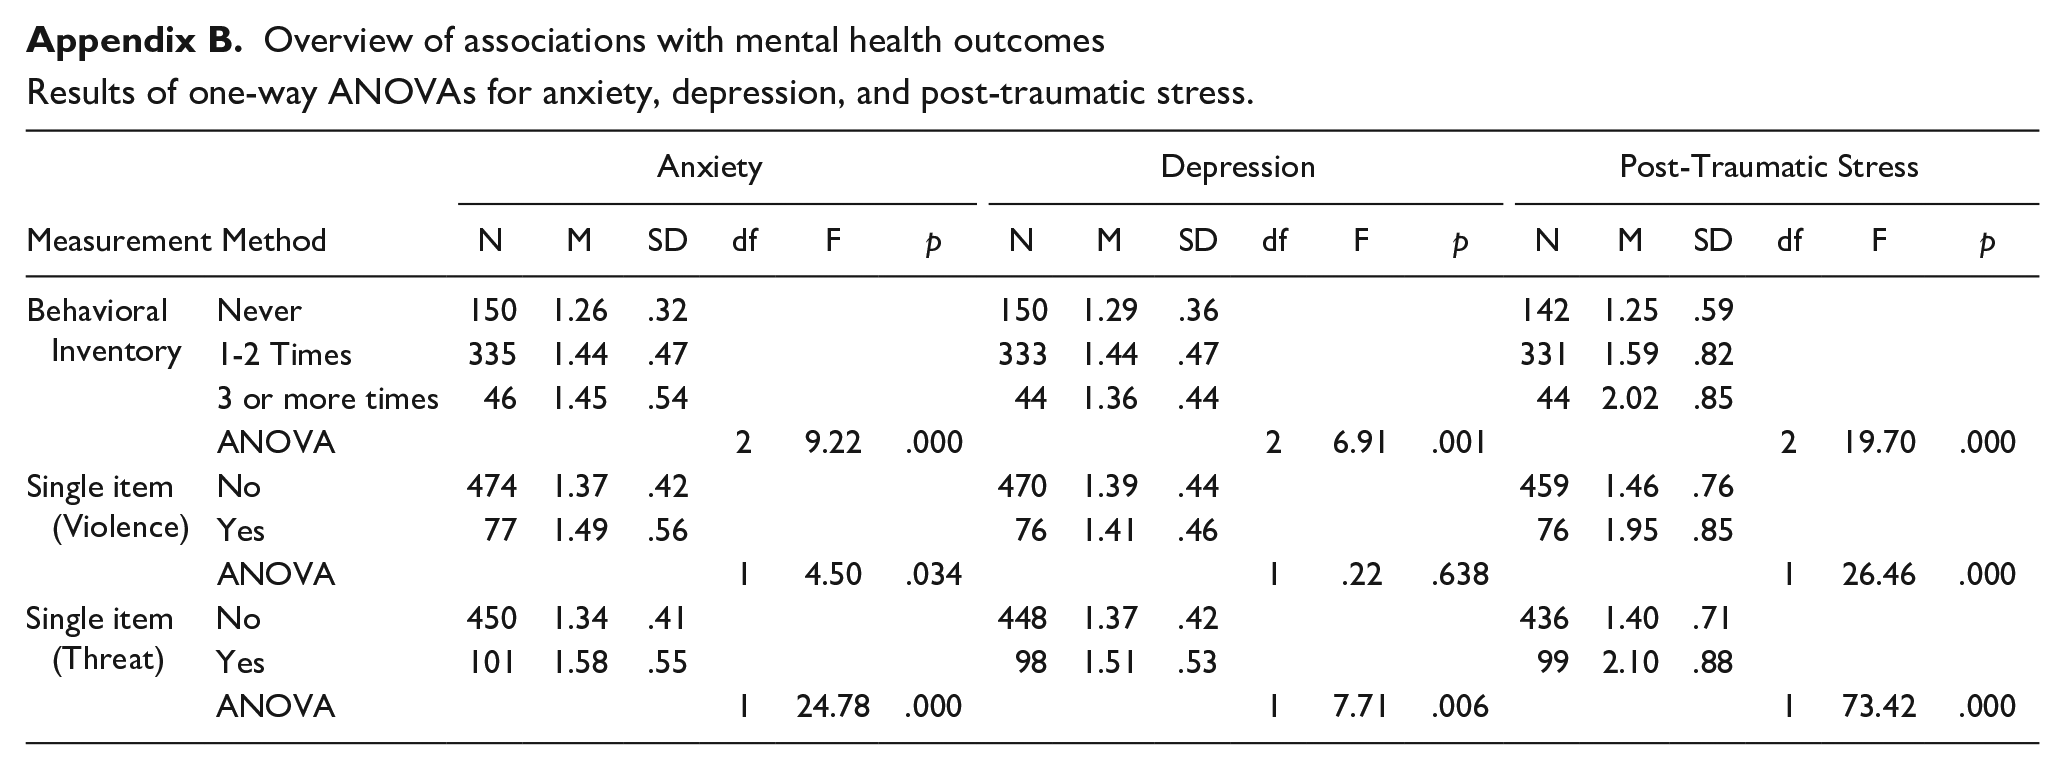
Results from the one-way ANOVAs are displayed in Appendix B. A significant main effect was found for the single-item question about violence experienced for the past 6 months, F (1,549) = 4.50, p = .034; partial η2 = .01 Pairwise comparisons of anxiety symptoms (least significant difference) between those that were exposed to violence and those that were not exposed were significant (p = .034). A significant main effect was also found for the single-item question about threats experienced for the past 6 months, F (1,549) = 24.78, p < .000; partial η2 = .04. Pairwise comparisons of anxiety symptoms (least significant difference) between those that were exposed to threats and those that were not exposed were significant (p < .000).
Using the behavioral inventory scale to investigate differences in anxiety, a significant main effect was also found for the behavioral inventory, F (2,528) = 9.22, p = .000; partial η2 = .034. Pairwise comparisons of anxiety symptoms (least significant difference) between those that were never exposed and those that were exposed 1 to 2 times was significant (p = .000). There was also a significant difference in anxiety symptoms between the group that was never exposed and those that were exposed 3 or more times (p = .01). The difference in anxiety levels between those that were exposed 1 to 2 times and those that were exposed 3 or more times was not significant (p = .890).
Associations With Symptoms of Depression
There was no significant main effect of the single-item question about violence experienced for the past 6 months on levels of depressive symptoms, F (1,544) = .222, p = .638; partial η2 = .000. Pairwise comparisons of depressive symptoms (least significant difference) between those that were exposed to violence and those that were not exposed were also not significant (p = .638). A significant main effect was found for the single-item question about threats experienced for the past 6 months, F (1,544) = 7.714, p < .006; partial η2 = .014. Pairwise comparisons of depressive symptoms (least significant difference) between those that were exposed to threats and those that were not exposed were also significant (p = .006).
Using the behavioral inventory scale to investigate differences in depression, a significant main effect was found for the behavioral inventory, F (2,524) = 6.91, p = .001; partial η2 = .026. Pairwise comparisons of depressive symptoms (least significant difference) between those that were never exposed and those that were exposed 1 to 2 times was significant (p = .000). There was no significant difference in depressive symptoms between the group that was never exposed and those that were exposed 3 or more times (p = .332). The difference in depressive symptoms between those that were exposed 1 to 2 times and those that were exposed 3 or more times was also not significant (p = .224).
Associations With Symptoms of PTS
There was a significant main effect of the single-item question about violence experienced for the past 6 months on levels of PTS symptoms following a specific incident of workplace violence, F (1,533) = 26.46, p = .000; partial η2 = .047. Pairwise comparisons of symptoms of PTS (least significant difference) between those that were exposed to violence and those that were not exposed were also significant (p = .000). There was also a significant main effect of the single-item question about threats experienced for the past 6 months on levels of PTS symptoms, F (1,533) = 73.42, p = .000; partial η2 = .121. Pairwise comparisons of symptoms of PTS (least significant difference) between those that were exposed to threats and those that were not exposed were also significant (p = .000).
Using the behavioral inventory scale to investigate differences in PTS symptoms following a specific incident of workplace violence, a significant main effect was also found for the behavioral inventory, F (2,514) = 19.70, p = .000; partial η2 = .071. Pairwise comparisons of PTS symptoms (least significant difference) between those that were never exposed and those that were exposed 1 to 2 times was significant (p = .000). There was also a significant difference in PTS symptoms between the group that was never exposed and those that were exposed 3 or more times (p = .000). The difference in levels of PTS between those that were exposed 1 to 2 times and those that were exposed 3 or more times was also significant (p = .000).
Discussion
The current study found that prevalence rates for threats and violence in the child welfare service were dependent upon the measurement method used to assess this negative workplace exposure. The single-item questions measuring exposure for the past 6 months indicated that 15.4% of the child welfare workers labeled themselves as exposed to physical violence, while 19.3% reported being exposed to threats. In contrast, results from the behavioral inventory revealed that the prevalence of specific acts of workplace violence experienced for the past 6 months ranged from 4.4% to 65.7%.
A main finding of this study is the high number of false negatives observed when comparing the prevalence rates obtained from the two different measurement methods. Among those who indicated that they had not experienced any threats and/or violence for the past 6 months through the single-item questions, 62.2% reported that they had in fact been exposed 1 to 2 times when responding to the behavioral inventory. A closer look at the results from the behavioral inventory revealed that the most frequently occurring actions in the child welfare service were direct and indirect forms of threats, while the least reported behaviors were threats and violence including some sort of physical objects.
In terms of mental health outcomes, this study shows that exposure to workplace violence is related to increased levels of mental distress in the form of elevated symptoms of anxiety and depression, as well as elevated symptoms of PTS following a specific incident of workplace violence. However, the different measurement methods gave somewhat different results regarding the investigated outcomes. For the single-item question about experienced violence, there was increased levels of anxiety and PTS but no increase in levels of depressive symptoms. The single-item question on threats showed a statistically significant association with all three outcome variables. In contrast, results using the behavioral inventory revealed that experiencing workplace violence 1 to 2 times is enough to increase child welfare workers’ symptoms of anxiety and depression, while any additional exposure does not seem to worsen these symptom levels. However, for symptoms of PTS following a specific incident of workplace violence there was an initial increase of symptom levels after being exposed 1 to 2 times, as well as an additional increase in symptom levels for those who were exposed 3 times or more.
Different Measurement Methods Result in Different Prevalence Rates
Generally, the range of obtained prevalence rates in the current study are similar to those observed in other studies (Hagen & Svalund, 2019; Robson et al., 2014). However, comparing the obtained prevalence rates from the two different measurement methods (e.g., single-item questions vs. behavioral inventory) illustrates that the type of measurement method have an impact on the results. This, in turn, extends the findings from previous research on adjacent phenomena such as bullying and sexual harassment (Nielsen et al., 2009, 2010), and thus also applies to the field of workplace violence.
The high level of false negatives observed indicates that there are many child welfare workers who are exposed to workplace violence but, for some reason, do not view these acts as serious or frequent enough to label themselves as victims when answering the overarching single-item questions. One possible explanation for this underreporting could be that those exposed, consciously or unconsciously, find it threatening to their self-esteem to label themselves as victims (Nielsen et al., 2010). Other possible explanations could include the stigma child welfare workers feel related to being a victim or an underlying fear of being blamed for the incident (King, 2019). Moreover, given that workplace violence is deemed to be an inevitable part of their job (Lamothe et al., 2018), the threshold child welfare workers have for perceiving and reporting something as actual violence might be considerably higher compared to workers in other sectors in which workplace violence is not a prominent issue (e.g., within construction or finance). Taken together, our findings suggests that more frequently exposed employees are also more likely to label themselves as victims. However, while some employees refrain from such labeling even with frequently occurring events, the discrepancy between single-item prevalence versus behavioral inventory prevalence remains larger for exposures of low frequency (e.g., 1–2 times).
While making use of single-item questions could be considered efficient, several disadvantages could reduce the validity of this assessment method, especially when utilized in settings involving sensitive topics such as workplace violence. First and foremost, single-item questions require the respondent to self-label and identify themselves as victims, as well as consider whether the acts they experience can or should be labeled as violent incidents. Thus, the specific labeling and identification required by such single-item questions might be particularly challenging for child welfare workers due to the very nature of their job. Considering that child welfare workers are well aware of the circumstances these children and families come from, they might be more inclined to perceive many of the actions they are exposed to more as a “call-for-help” rather than just acts of threats and violence per se (Lamothe et al., 2018). Additionally, child welfare workers with their highly intensive jobs may forget one or several incidents over time and may therefore not be able to recall these events when answering overarching single-item questions. This may especially apply to violent actions that do not leave physical marks or injuries or more indirect forms of threats like getting shouted or cursed at. At other times, workers could anticipate some sort of violence because they perceived their safety to be at risk, even though nothing has happened (Kim & Hopkins, 2015; Vogus et al., 2016). Although there is merit in also asking participants for their subjective experiences of client-perpetrated violence, this mere anticipation does not count as part of the prevalence statistics. Nonetheless, understanding this aspect of workplace violence could also be essential in identifying solutions to address both actual prevalence and the perceived safety of the employees (Lamothe et al., 2018; Vogus et al., 2016).
However, unless a very precise definition of the phenomenon is provided alongside the single-item questions, which was not the case in this study, the employees are left to themselves to define what counts for as workplace violence. Hence, this self-labeling method is a rather subjective approach which, among other things, can be affected by which kinds of behaviors that are normalized, and even expected to occur in the child welfare service. Thus, utilizing single-item questions without including a clear definition makes the concept largely dependent on “the eye of the beholder” (Lengnick-Hall, 1995). This, in turn, threatens the validity of the method as we cannot expect that every child welfare worker views this concept in the same manner when responding to such single-item questions.
On the other hand, assessing workplace violence using a behavioral inventory could be considered a more “objective” and less abstract approach as what is being asked is more direct and does not leave much room for different interpretations. Thus, it is easier for the employees to indicate what they have experienced, instead of having to evaluate whether any encounters at the workplace are serious enough to be considered as “violence.” While being a more comprehensive assessment method, this method, in contrast to single-item questions, also spares the employees of having to explicitly label themselves as victims. Another advantage with behavioral inventories is that they can deliberately exclude any reference to emotions, cognitive appraisals, or attitudes of the listed behaviors. This approach may also provide a more precise estimate because it can trigger employees’ memory, especially for the incidents of low intensity that might have been easily forgotten otherwise. Taken together, the behavioral inventory seems to be more beneficial when assessing the occurrence of client-perpetrated violence in the child welfare service.
Which Specific Forms of Violence Occurs in the Child Welfare Service
The results from the behavioral inventory reveals that the most frequently occurring actions in the child welfare service are direct and indirect forms of threats. This includes acts such as being shouted or cursed at, receiving threatening looks, ambiguous verbal threats or threatening movements and being threatened with self-harm. Moreover, it includes actions whereby someone loses control and shatter or break something while you are present, having someone threaten to hit you, and being threatened with having something thrown at you. In contrast, the least reported behaviors were threats and violence including some sort of objects. This includes being threatened with a sharp object, being threatened with assault-weapons or tools, gotten your personal belongings damaged or destroyed, or had someone try to strike you with a weapon-like object. For an overview of the specific, physical, and violent actions found in between these extremes see Appendix A.
Overall, these findings are in line with previous research stating that psychological violence and threats of violence are the most common forms of violence experienced in the child welfare service (Andersson & Överlien, 2018; Littlechild et al., 2016; Shin, 2011). However, results from the behavioral inventory reveals that violent and physical actions also occur quite often, while threats and violence involving objects are the least frequently observed behaviors in the child welfare service. Taking a closer look at the specific acts of threats and violence might also help us to understand why the number of observed false negatives were so high when comparing the results of the two different assessment methods. Actions such as being shouted or cursed at, or receiving threatening looks or ambiguous threatening movements might for many child welfare workers not be considered serious enough to label or report as actual forms of threats and violence. This aligns well with findings from qualitative studies showing that child welfare workers usually draw a distinction between the psychological and physical incidents they are exposed to, and that they only perceive exposure to physical incidents as actual forms of violence (Andersson & Överlien, 2018). Moreover, another qualitative study found that all child welfare workers were convinced that the aggression expressed by the adolescents they worked with was meaningful, and that it was their job to uncover the underlying meaning of the aggression in order to help them (Øien & Lillevik, 2014). Consequently, the way in which certain types of frequently occurring threats and violence is defined and normalized within the child welfare context might lead to underreporting, which in turn poses a problem for both risk assessment and risk management (Littlechild, 2002).
Our findings concerning the high number of false negatives observed in the current study further strengthens the argument that single-item questions measuring sensitive topics might lead to underreporting. Thus, possibly providing inaccurate estimates regarding the scope of this already large problem. Taking this into account, previous research on the prevalence of workplace violence within the same, or similar, fields should be considered with caution. Based on the current findings, our recommendation is that future research should be based on behavioral inventories, rather than single-item questions, as this will allow for more precise estimate of workplace violence. Professions in which this negative workplace exposure is perceived as an inevitable part of the job should especially take these findings into consideration.
Different Measurement Methods and Associated Outcomes
In terms of outcomes, and in accordance with previous research, this study further supports the notion of exposure to workplace violence being related to increased levels of mental distress (Lanctôt & Guay, 2014; Rudkjoebing et al., 2020). However, there were some differences regarding which assessment method that was used and the subsequent results that were obtained. While some of these differences could partly be explained by the level of statistical power, we argue that the different measurement methods in themselves drive these differences as they capture the phenomenon in different ways. The single-item question measuring experienced violence for the past 6 months showed a statistically significant association with increased levels of anxiety and PTS but did not seem to affect levels of depressive symptoms. The single-item question measuring experienced threats for the past 6 months showed a statistically significant association with all outcome variables. Hence, experiencing threats at work resulted in increased levels of anxiety and depression, as well as increased levels of PTS following a specific incident of workplace violence.
Utilizing the behavioral inventory, on the other hand, gave slightly different results, while also providing new perspectives and insight into the investigated relationships. A statistically significant increase in all symptom levels between those that were never exposed to threats and violence, and those that were exposed 1 to 2 times was observed. However, there were no additional differences observed in levels of anxiety and depression for those who were exposed 1 to 2 times compared to those who were exposed 3 or more times. Accordingly, our study implies that every child welfare worker experiencing workplace violence is at risk for increased levels of anxiety and depression, regardless of the frequency of the exposure.
This finding, in combination with the observed discrepancy of prevalence between the two different measurement methods, further highlights the possible underestimation that occurs. More specifically, the fact that the numbers of observed false negatives are above 60% further emphasizes how the chosen assessment method might undermine both the initial extent of the problem as well as the effects of this negative workplace exposure. Although it is known that child welfare workers in general are frequently exposed to workplace violence (Winstanley & Hales, 2008), those of the workers who are rarely exposed, or who are exposed to low intensity acts that do not leave physical marks or injuries, might unconsciously filter out or simply forget about these incidents when they are presented with overarching single-item questions asking them to recall exposure 6 months back in time. However, our findings highlight that even acts of this sort should not be taken lightly. As these acts are amongst those that most frequently occur in the child welfare service, the number of employees who are exposed is high, even if the level of exposure per employee is low.
For symptoms of PTS following a specific incident of workplace violence, the associated outcomes were a bit different. While there was a significant increase in symptoms of PTS between those that were never exposed to threats and violence, and those that were exposed 1 to 2 times, there was also an additional increase in levels of PTS for those who experienced it 1 to 2 times compared to those who experienced it 3 times or more. This implies that the frequency of workplace violence is an important factor in the development of PTS symptoms. One possible explanation might be that the outcome measure of PTS symptoms used in this study relates specifically to an incident of workplace violence. Consequently, unless the employee quits her/his job, she/he will remain in the environment that related to these symptoms in the first place. This, in turn, might trigger and elevate the symptom levels in line with more frequent exposure. This distinction between different levels of exposure and degree of symptom levels was not possible to make using the single-item questions as they were dichotomous. Thereby, this study further emphasizes the importance of also investigating the frequency with which specific acts of workplace violence occurs, and not solely focus on whether they occur or not.
Lastly, the value of using behavioral inventories rather than self-labeling techniques have also been raised in other fields. More specifically, it has been found that when investigating the prevalence and outcomes of domestic abuse, sexual abuse, and intimate partner violence, victims who met the criteria for assault through the Conflict Tactic Scale (Straus, 1979), but who did not acknowledge victimization themselves reported greater psychopathology and disability, more psychological symptoms, and impaired coping (Clements & Ogle, 2009; Clements et al., 2022). This observed effect was particularly strong for those who had experienced rape, whereby those who did not acknowledge victimization reported more psychological distress and disability compared to controls and other types of victims (Clements & Ogle, 2009). Hence, the issue of using different measurement methods and gaining different results is not specific to the child welfare service only, and there is probably much to learn from other fields dealing with similar sensitive topics.
Methodological Strengths and Limitations
A strength of the current study is the use of a probability sample with a relatively high response rate despite the unusual circumstances. More specifically, the survey was conducted at the very initial stages of the Covid-19 pandemic (the survey was already distributed to the participants when Norway went into lockdown). Although the Covid-19 pandemic led to changes in the organization of work and working life, the Norwegian government classified the child welfare service as part of the critical societal functions (Regjeringen, 2021). Thus, the child welfare service was not restricted in the same way as many other occupations throughout the pandemic. Although the pandemic could have led to changes and uncertainties, it is rather unlikely that this situation would have affected the prevalence of workplace violence and different forms of mental distress in this study, as all these variables were investigated retrospectively.
A possible limitation concerns the generalizability of our findings to countries that organize the child welfare system differentially than in Norway and/or countries that have working conditions that are not comparable to the conditions in the Norwegian working life. Moreover, culture and context may also play a part in the way people perceive violence (Radey & Wilke, 2021). In one way, workers of color may have higher thresholds for classifying certain incidents as violent (Phelps et al., 1991). On the other hand, considering that children and families of diverse racial and ethnic backgrounds are overrepresented in the child welfare service (Child Welfare Information Gateway, 2021), it might be that employees with similar backgrounds as the families they are involved with experience less violence because they are more compatible with their clients (Radey & Wilke, 2021). However, as our study does not contain information on ethnicity, it is not possible to investigate the potential influence of this. Moreover, our sample consists of 76.7% women, which could also raise questions regarding gender differences in the reporting of workplace violence. While the majority of studies in a systematic review concluded with no gender differences, the few studies with significant results tended to indicate a greater risk for men (Guay et al., 2014). Although these perspectives emphasize important aspects in the assessment of workplace violence, the purpose of the current study was not to investigate which groups reported the highest levels of exposure. Aspects of diversity could however be important to include in future research to extend these findings further.
It might be argued that the cross-sectional design of the study could represent a limitation. However, we argue that this in itself is not an issue (Spector, 2019). Based on the very purpose of the study, the aim was not to establish any causal relations, but rather to investigate differences in prevalence and associated outcomes using two different measurement methods. Regarding the behavioral inventory applied in the current study, the fact that it does not include any items capturing exposure to online harassment or threats may be seen as a limitation. As we continue to become more and more digital, future research should also explore this aspect of workplace violence further. The behavioral inventory also needs further validation, and future research should validate it by following the steps proposed by Hinkin (1998). Another possible limitation to the internal validity of the findings concerns the fact that all data were collected using self-report. Potential limitations of self-report measures include arguments such as the possibility of common method variance, response set tendencies and subjective interpretations (Spector & Fox, 2005). However, all investigated factors include a subjective component and are highly influenced by individual perceptions. It is therefore not possible to assess different forms of threats, as well as feelings of anxiety, depression, and PTS following a specific incident of workplace violence, using only “objective” methods. To minimize the potential problems following common method variance, well-established and validated tests were used, and all participants were assured that their responses would remain anonymous. We also ensured that the independent and dependent variables were presented in different sections of the survey, while the response anchors for the different subscales were also varied (Podsakoff et al., 2003).
Conclusion and Implications
The results of this study have important implications for the health and wellbeing of all child welfare workers, as well as the way employers address and handle workplace violence within the child welfare services. More specifically, a direct implication of our findings concerns the way in which employers carry out assessments of workplace violence. As shown by our study, a major disadvantage of only using single-item questions concerns the high number of false negatives that occur. With more than 60% of the cases going unreported, a higher number of the workforce might suffer from elevated levels of mental distress than what the employer might anticipate following earlier findings on prevalence based on single-item assessments. If these elevated symptom levels are not addressed or prevented properly, they could lead to increased levels of sickness absence and sick leaves, which, in turn, could also affect the overall quality of the services provided by the child welfare service.
Utilizing a behavioral inventory could be a part of the solution, as it provides the employers with the basis for developing specific preventive measures and procedures based on those specific acts of workplace violence that occur most frequently. As the most frequently occurring actions includes direct and indirect forms of threats, it may not be possible to prevent these kinds of actions from happening. However, the mere identification of these specific acts would help in creating awareness regarding what the child welfare workers are exposed to, and following which specific acts the employees may need to be better taken care of by their employer. Therefore, additional research is also needed on how to alleviate the consequences of these inevitable actions of workplace violence.
In conclusion, this study shows that the decision of which measurement methods to use in studies of workplace violence will have significant consequences both on the overall assessment of prevalence rates, as well as on results of associated outcomes. Future research on this negative workplace exposure needs to acknowledge the great implication such methodological considerations can have. When studying the occurrence and effects of workplace violence in the child welfare service, and similar fields in which this workplace exposure is deemed to be an inevitable part of the job, one should therefore aim at making use of behavioral inventories, rather than overarching single-item questions.
Footnotes
Appendix
Overview of associations with mental health outcomes
Results of one-way ANOVAs for anxiety, depression, and post-traumatic stress.
| Anxiety |
Depression |
Post-Traumatic Stress |
|||||||||||||||||
|---|---|---|---|---|---|---|---|---|---|---|---|---|---|---|---|---|---|---|---|
| Measurement Method | N | M | SD | df | F | p | N | M | SD | df | F | p | N | M | SD | df | F | p | |
| Behavioral Inventory | Never | 150 | 1.26 | .32 | 150 | 1.29 | .36 | 142 | 1.25 | .59 | |||||||||
| 1-2 Times | 335 | 1.44 | .47 | 333 | 1.44 | .47 | 331 | 1.59 | .82 | ||||||||||
| 3 or more times | 46 | 1.45 | .54 | 44 | 1.36 | .44 | 44 | 2.02 | .85 | ||||||||||
| ANOVA | 2 | 9.22 | .000 | 2 | 6.91 | .001 | 2 | 19.70 | .000 | ||||||||||
| Single item (Violence) | No | 474 | 1.37 | .42 | 470 | 1.39 | .44 | 459 | 1.46 | .76 | |||||||||
| Yes | 77 | 1.49 | .56 | 76 | 1.41 | .46 | 76 | 1.95 | .85 | ||||||||||
| ANOVA | 1 | 4.50 | .034 | 1 | .22 | .638 | 1 | 26.46 | .000 | ||||||||||
| Single item (Threat) | No | 450 | 1.34 | .41 | 448 | 1.37 | .42 | 436 | 1.40 | .71 | |||||||||
| Yes | 101 | 1.58 | .55 | 98 | 1.51 | .53 | 99 | 2.10 | .88 | ||||||||||
| ANOVA | 1 | 24.78 | .000 | 1 | 7.71 | .006 | 1 | 73.42 | .000 | ||||||||||
Acknowledgments and credits
The authors would like to thank Shahrooz Elka and Jan Emberland for their participation in the administration of the survey. We would like to thank the The Vice Mayor of Education and Child Services in Oslo municipality and all the participating child welfare service offices and institutions for their participation in this study.
Declaration of Conflicting Interests
The author(s) declared no potential conflicts of interests with respect to the authorship and/or publication of this article.
Funding
The author(s) received no financial support for the research and/or authorship of this article.